UNDEREMPLOYMENT IN THE EARLY CAREERS OF COLLEGE GRADUATES FOLLOWING THE GREAT RECESSION
Jaison R. AbelRichard Deitz
Working Paper 22654http://www.nber.org/papers/w22654
NATIONAL BUREAU OF ECONOMIC RESEARCH1050 Massachusetts Avenue
Cambridge, MA 02138September 2016
Prepared for NBER/CRIW conference on “Education, Skills, and Technical Change: Implications for Future U.S. GDP Growth.” We thank Chuck Hulten, Valerie Ramey, Till von Wachter, and the CRIW participants for helpful comments. The views and opinions expressed here are solely those of the authors and do not necessarily reflect those of the Federal Reserve Bank of New York, the Federal Reserve System, or the National Bureau of Economic Research.
NBER working papers are circulated for discussion and comment purposes. They have not been peer-reviewed or been subject to the review by the NBER Board of Directors that accompanies official NBER publications.
Underemployment in the Early Careers of College Graduates Following the Great RecessionJaison R. Abel and Richard DeitzNBER Working Paper No. 22654September 2016JEL No. I23,J23,J24,J62
ABSTRACT
Though labor market conditions steadily improved following the Great Recession, underemployment among recent college graduates continued to climb, reaching highs not seen since the early 1990s. In this paper, we take a closer look at the jobs held by underemployed college graduates in the early stages of their careers during the first few years after the Great Recession. Contrary to popular perception, we show that relatively few recent graduates were working in low-skilled service jobs, and that many of the underemployed worked in fairly well paid non-college jobs requiring some degree of knowledge and skill. We also find that the likelihood of being underemployed was lower for those with more quantitatively oriented and occupation-specific majors than it was for those with degrees in general fields. Moreover, our analysis suggests that underemployment is a temporary phase for many recent college graduates as they transition to better jobs after spending some time in the labor market, particularly those who start their careers in low-skilled service jobs.
Jaison R. AbelResearch and Statistics GroupFederal Reserve Bank of New York33 Liberty StreetNew York, NY [email protected]
Richard DeitzResearch and Statistics GroupFederal Reserve Bank of New York33 Liberty StreetNew York, NY [email protected]
1
“Welcome to the Well-Educated Barista Economy” --The Wall Street Journal, April 2014
I. INTRODUCTION
The image of a young newly minted college graduate working behind the counter
of a hip coffee shop has become a hallmark of the plight of college graduates following
the Great Recession. Indeed, although economic conditions steadily improved through
the recovery, significant slack remained in the labor market, and many recent graduates
were not finding jobs commensurate with their education. The underemployment rate for
recent college graduates—that is, the share working in jobs that typically do not require a
college degree—continued to climb for several years following the Great Recession,
topping out at nearly 50 percent, a level not seen since the early 1990s.
While underemployment among recent college graduates has attracted wide
attention in the media and among policymakers, very little is actually known about the
nature of college underemployment or what seems to make some college graduates more
prone to being underemployed than others.1 In this paper, we examine the plight of
college graduates in the aftermath of the Great Recession. We examine in detail the types
of jobs underemployed college graduates hold, and explore some of the factors associated
with a greater likelihood of being underemployed.
1 For example, a 2012 Associated Press article with the headline “Half of New Grads are Jobless or
Underemployed,” reignited an intense debate about the value of a college degree. Headlines such as “College Grads May Be Stuck in Low-Skill Jobs,” (WSJ, 2013) and “Welcome to the Well-Educated Barista Economy,” (WSJ, 2014) became commonplace after the Great Recession.
2
We conclude that while there is some truth behind the popular image of the
college-educated barista, this picture is not an accurate portrayal of the typical
underemployed recent college graduate. Contrary to popular perception, we show that
only a small fraction of recent graduates worked in a low-skilled service job following
the Great Recession. Instead, we find that underemployed recent graduates held a wide
range of jobs, and while most are clearly not equivalent to jobs that require a college
degree, some are fairly skilled and well paid. In addition, we find that underemployed
college graduates were more likely to be working in these higher paying non-college jobs
than similarly aged young workers without a college degree. Still, we find that roughly 9
percent of recent graduates—or about one-fifth of the underemployed—start their careers
working in a low-skilled service job.
We then explore the characteristics of underemployed recent college graduates,
and examine correlates associated with being underemployed or working in a low-skilled
service job. We find that men are more likely to be underemployed than women, though a
larger share of underemployed men work in the highest-paying non-college jobs. Further,
we show that underemployment is far more likely for recent graduates with some college
majors compared to others. For example, those with majors in Liberal Arts or General
Business are two to three times more likely to be underemployed than those with
Engineering or Nursing majors. The patterns we uncover suggest that those recent
graduates who major in more quantitatively oriented and occupation-specific fields tend
to have much lower underemployment than those with majors that are more general.
Finally, our analysis suggests that underemployment is a temporary phase for a good
number of recent graduates, particularly among those who start their careers working in a
3
low-skilled service job, as many transition to better jobs after spending a few years in the
labor market.
Though underemployment appears to have become increasingly prevalent in the
labor market, particularly among college graduates, only a small body of research on the
subject currently exists. Much of this research focuses on underemployment among re-
employed workers following layoffs, or those who work in part-time or temporary
positions (see, e.g., Feldman, 1996 and McKee-Ryan and Harvey, 2011). In addition,
much of the existing underemployment literature emphasizes the emotional and
psychological effects of underemployment, rather than its economic consequences. An
early exception is Feldman and Turnley (1995), who study underemployment among a
small sample of recent college graduates with business degrees, and more recently, Abel,
Deitz, and Su (2014) provide some historical context by examining underemployment
among recent college graduates over the past few decades. Our work builds on this small
body of research by providing a more detailed analysis of the types of jobs held by
underemployed graduates in the early stages of their careers, and by identifying the
factors that make some graduates more prone to underemployment than others.
One strand of the literature that is closely related to underemployment examines
over-education in the labor market (see, e.g., Hersch, 1991; Chevalier, 2003; Chevalier
and Lindley, 2009; and Green and Zhu, 2010). However, unlike our work, this research
typically relies on self-reported measures of whether there is a match between a worker’s
education and job to assess the extent and economic effects of over-education.
Our work is also related to a small but growing literature documenting the
economic consequences of graduating from college during recessions (see, e.g., Kahn,
4
2010; Oreopoulos, von Wachter, and Heisz, 2012; and Altonji, Kahn, and Speer, 2016).
This research indicates that adverse labor market conditions in the early careers of
college graduates can have significant long-term effects on earnings, and shows that these
negative effects differ greatly by college major and ability. These studies generally do not
directly examine the types of jobs graduates obtain in the early stages of their careers.
However, differences in the quality of the initial placement of graduates with more
challenging college majors or higher ability is believed to be an important contributor to
differences in longer-term employment outcomes. Our work provides some support for
this explanation by documenting that recent graduates with college majors that provide
technical training and quantitative skills are far less likely to be underemployed in the
early stages of their careers than those with majors that tend to be less quantitative in
nature.
Indeed, the role of college major in finding a good job has become of
considerable interest in recent years given the weak labor market following the Great
Recession. Recent research has documented significant heterogeneity in the labor market
outcomes of college graduates with different majors (see, e.g., Altonji, Blom, and
Meghir, 2012 and Altonji, Kahn, and Speer, 2014, 2016), and information on labor
market outcomes by major has been shown to influence the choices students make while
in college (see, e.g., Betts, 1996; Zafar, 2013; and Wiswal and Zafar, 2015a, 2015b). Our
work adds to this body of research by providing new information about how one’s
college major is associated with an understudied labor market outcome—the likelihood
of being underemployed upon graduation. Further, we are able to examine labor market
outcomes for a more detailed set of college majors than has previously been studied.
5
II. THE LABOR MARKET FOR COLLEGE GRADUATES FOLLOWING THE GREAT RECESSION
The Great Recession was the deepest downturn experienced in the United States
in the postwar era, and its effects on the labor market were swift and severe. Though
labor market conditions started to improve in early 2010, the recovery that followed was
slow and uneven, resulting in a large amount of slack that persisted for an extended
period of time (see, e.g., Elsby et al., 2010, 2011 and Şahin et al., 2014). Those unlucky
college graduates who started their careers in the aftermath of the Great Recession
struggled to find jobs, let alone jobs that utilized their degrees. Much of this difficulty can
be traced to relatively weak labor demand for college graduates during the recovery.
A. Unemployment Among College Graduates
Though college graduates generally weathered the economic storm better than
those without a degree, they were not immune from its effects. As Figure 1 shows,
unemployment rose sharply during the Great Recession and continued to climb in the
early stages of the recovery to levels not seen in decades. Figure 1 also shows the
unemployment rate for recent college graduates. For the purposes of our analysis, we
define recent college graduates as those with at least a bachelor’s degree who are 22 to 27
years old. We select this group to capture college graduates within their first five years
after graduation who are at the beginning of their careers.2
2 The typical age at which people earn a bachelor’s degree in the United States is 22. While some
graduates receive their degree at ages beyond their early twenties, data limitations do not allow us to identify these older graduates. We exclude those in the military and individuals enrolled in school, whether full-time or part-time, to avoid confusion about whether someone’s employment status is influenced by whether they are attending school.
6
Unemployment among recent college graduates, who are often more susceptible
to cyclical changes in the labor market than college graduates as a whole, doubled from
about 3.5 percent before the recession to a peak of more than 7 percent in 2011.
However, unemployment among recent college graduates began to fall in late 2011, and
generally continued to trend down thereafter. Even with this progress, unemployment
among recent college graduates fell less steeply than for college graduates as a whole,
underlying the more negative effects of labor market conditions for recent graduates
compared to their more seasoned counterparts.
B. Underemployment Among College Graduates
While the unemployment rate has declined, such a statistic reveals only part of the
story about the plight of recent college graduates following the Great Recession. Indeed,
the weak labor market prompted widespread concern that recent graduates were
underemployed—that is, working in jobs that typically do not require a college degree
(see, e.g., Fogg and Harrington, 2011; Yen, 2012; and Vedder, Denhart, and Robe, 2013).
We measure the underemployment rate as the share of employed college
graduates working in jobs that do not require a college degree. To distinguish between
college jobs and non-college jobs, we rely on the Department of Labor’s O*NET
database.3 O*NET contains occupation-level data for hundreds of occupations collected
via interviews of incumbent workers and input from professional occupational analysts
on a wide array of job-related requirements. We use the following question from the
O*NET Education and Training Questionnaire to determine whether an occupation
3 We use O*NET Version 18.1 for our analysis, see http://www.onetcenter.org/ for more information.
The O*NET database is discussed in detail by Peterson et al. (2001).
7
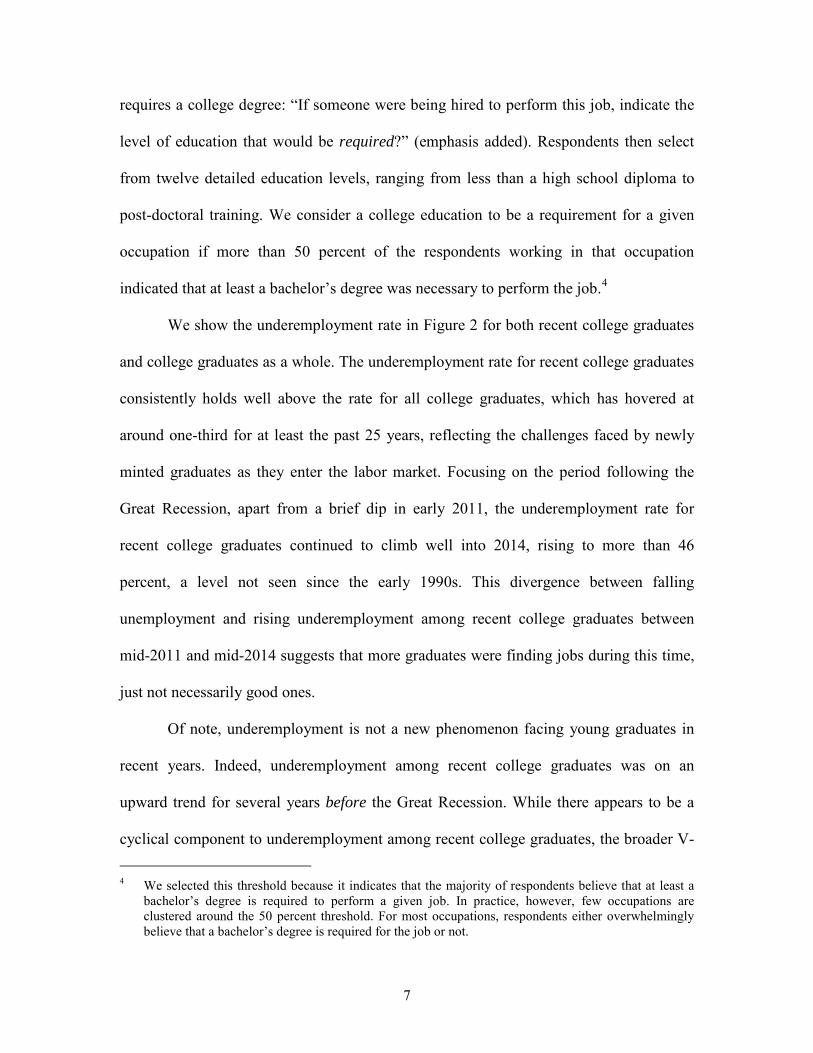
requires a college degree: “If someone were being hired to perform this job, indicate the
level of education that would be required?” (emphasis added). Respondents then select
from twelve detailed education levels, ranging from less than a high school diploma to
post-doctoral training. We consider a college education to be a requirement for a given
occupation if more than 50 percent of the respondents working in that occupation
indicated that at least a bachelor’s degree was necessary to perform the job.4
We show the underemployment rate in Figure 2 for both recent college graduates
and college graduates as a whole. The underemployment rate for recent college graduates
consistently holds well above the rate for all college graduates, which has hovered at
around one-third for at least the past 25 years, reflecting the challenges faced by newly
minted graduates as they enter the labor market. Focusing on the period following the
Great Recession, apart from a brief dip in early 2011, the underemployment rate for
recent college graduates continued to climb well into 2014, rising to more than 46
percent, a level not seen since the early 1990s. This divergence between falling
unemployment and rising underemployment among recent college graduates between
mid-2011 and mid-2014 suggests that more graduates were finding jobs during this time,
just not necessarily good ones.
Of note, underemployment is not a new phenomenon facing young graduates in
recent years. Indeed, underemployment among recent college graduates was on an
upward trend for several years before the Great Recession. While there appears to be a
cyclical component to underemployment among recent college graduates, the broader V- 4 We selected this threshold because it indicates that the majority of respondents believe that at least a
bachelor’s degree is required to perform a given job. In practice, however, few occupations are clustered around the 50 percent threshold. For most occupations, respondents either overwhelmingly believe that a bachelor’s degree is required for the job or not.
8
shaped pattern in the underemployment rate over the past 25 years is also consistent with
recent research by Beaudry, Green, and Sand (2014, 2016) arguing that there has been a
reversal in the demand for cognitive skills since 2000. According to this research,
businesses ramped up their hiring of college-educated workers in an effort to adapt to the
technological changes occurring during the 1990s. However, as the information
technology revolution reached maturity, demand for cognitive skill fell accordingly. As a
result, during the first decade of the 2000s, many college graduates were forced to move
down the job ladder to take jobs typically performed by lower-skilled workers. From this
perspective, the relatively low underemployment rates among recent college graduates at
the peak of the technology boom around 2000 may in fact be an outlier, while the rise in
underemployment since then represents a return to more typical conditions.
C. The Demand for College Graduates After the Great Recession
To gain a better understanding of what is behind recent patterns in both
unemployment and underemployment among college graduates, we measure the
availability of college jobs and non-college jobs around the Great Recession. We use data
on online job postings from The Conference Board’s Help Wanted OnLine (HWOL)
database, which provides information on the full universe of online job postings during
this period and serves as a comprehensive measure of labor demand.5 We use monthly
data measuring total advertised job postings. Importantly, for our purposes, the HWOL
database assigns a detailed occupation code to each advertised posting. We use these 5 Advertised job vacancies are collected from more than 16,000 online job boards, including corporate
job boards, and efforts are made to remove duplicate postings. See https://www.conference-board.org/data/helpwantedonline.cfm for more information on the HWOL database. Because the earliest available HWOL data start in 2005, we are not able to examine the extent to which the demand for college graduates started to decline around 2000, as suggested by Beaudry, Green, and Sand (2014, 2016).
9
occupation codes to distinguish between college jobs and non-college jobs using the
O*NET classification defined previously.
The trend in job postings for both types of jobs is shown in Figure 3. Although
postings for college jobs and non-college jobs rebounded at roughly the same pace
immediately following the Great Recession, by 2011 the demand for college graduates
began to fall behind. In fact, postings for college jobs leveled off around 2013, and even
declined slightly through mid-2014, while postings for non-college jobs continued to rise
at a fairly steady clip throughout the recovery.
The steady growth of non-college jobs, coupled with the relatively soft demand
for college graduates during this three-year period, appears to have forced many recent
college graduates to take jobs not commensurate with their education. With the demand
for college graduates rising again beginning in mid-2014, underemployment also started
to come down. However, even with this modest improvement, 44.6 percent of college
graduates—nearly one in two—found themselves underemployed in the early stages of
their careers following the Great Recession. However, these data reveal little about the
types of jobs these underemployed workers were performing.
III. ARE ALL UNDEREMPLOYED COLLEGE GRADUATES WORKING AS BARISTAS?
To provide a deeper understanding of the types of jobs held by underemployed
recent college graduates in the years following the Great Recession, we turn to the
American Community Survey (ACS), a nationally representative one percent sample of
the population conducted on an annual basis (Ruggles et al., 2015). These data include a
variety of detailed economic and demographic information for individuals, including a
10
person’s occupation, wage, and education. We pool annual data for the years 2009 to
2013, leaving us with a roughly 5 percent random sample of the U.S. population.
Our sample of recent college graduates contains nearly 180,000 observations
representing more than 20 million individuals during the 2009 to 2013 period. For
comparison purposes, we also construct a parallel sample of young workers aged 22 to 27
without a college degree. This sample contains roughly 346,000 observations
representing about 44 million individuals over this same period. Because men and
women may choose different career paths or have different experiences in the labor
market, we perform all of our analyses overall and separately by gender.
A. Types of Jobs Held by Underemployed College Graduates
What types of jobs are underemployed recent graduates performing, and how
common is it for such workers to be stuck in a low paying job, such as a coffee house
barista? To address these questions, we create ten underemployed occupation categories
from the hundreds of detailed occupation codes identified in the data. In forming these
occupation categories, we attempted to create groups with a reasonably comparable set of
knowledge and skill requirements based on the nature of the work performed. In some
cases, we also used average wages earned in these detailed occupations to assign them to
these categories. Table 1 displays these groupings together with the average wage paid to
all workers in each group, not just recent college graduates.6
6 We focus on the average wages of all workers in these occupation categories to give a general sense
about the relative differences in skill levels across the categories we create. While recent college graduates tend to earn less than these figures, largely because such workers are in the early stages of their careers, the pattern for recent graduates is similar to that for all workers.
11
These occupation categories fall into six tiers based on how well jobs in each
group tend to pay. The first tier contains two groups of relatively high paying jobs, where
workers on average earn more than $55,000 per year. The highest-paying occupation
category, Information Processing and Business Support, tends to emphasize cognitive
skills, and workers in these jobs typically work with technology, use or produce
information in their jobs, and often play a supporting role to others within their line of
business. Examples of the kinds of jobs included in this category are human resource
workers, computer support specialists, web developers, computer network architects, and
paralegals. The next highest paying category is Managers and Supervisors, which
includes workers who have direct oversight of other employees within their organization,
and are often responsible for managing part of a business. Some decision making is
typically required in these types of jobs, but such decisions are often fairly limited in
scope. Examples of jobs that fall within this category include first-line supervisors of
various types of workers (e.g., retail sales, administrative support, and production) and
food service managers.
The second tier of underemployed occupation categories tend to pay between
$50,000 and $55,000 per year, and includes Public Safety and Sales jobs. Jobs in the
Public Safety category emphasize a combination of physical and cognitive skills, and
workers in these types of jobs tend to protect and serve the public. Examples of the kinds
jobs included in this category are police officers, detectives, security guards, and
firefighters. Jobs in the Sales category tend to require strong interpersonal skills and the
ability to interact with customers. Workers in these jobs are responsible for selling a wide
array of goods and services, ranging from physical products found on the shelves of retail
12
stores to insurance policies and real estate. Examples of the kinds of jobs included in this
category are sales representatives, insurance agents, real estate brokers, as well as retail
salespersons.7
The third tier of underemployed occupations pays, on average, around $48,000,
and includes Arts and Entertainment and Skilled Trades. Workers in these jobs are often
highly skilled, but these are not the types of skills typically developed by earning a
college degree. Examples of the types of jobs captured in this tier include professional
athletes, musicians, actors, and dancers, as well as electricians, machine repairers,
plumbers, and welders.
The fourth tier has average annual earnings ranging between $35,000 and
$40,000. This tier includes two groups. First, Office and Administrative Support, which
tends to emphasize clerical knowledge, oral and written communication skills, and basic
proficiency with computers. While some cognitive skills are required, the demands are
typically below what is required of workers in Information Processing and Business
Support jobs. Examples of jobs in this category include secretaries, customer service
representatives, and office clerks. Second, this tier includes Healthcare Technicians and
Assistants. Workers in these jobs provide care for others, but typically in a role that
supports a healthcare practitioner. Many of these jobs require an associate’s degree or
some other type of training certificate. Examples of the jobs in this category are medical
assistants, nursing aides, diagnostic technicians, and dental hygienists.
7 While retail sales jobs might be viewed as similar to low-skilled service jobs, retail sales jobs tend to
require more skill, particularly in the areas of communication and persuasion, and pay significantly higher wages, even for young college graduates.
13
The fifth tier consists of Physical Laborers. Jobs in this category tend to
emphasize the physical dimension of a worker’s skill set, such as strength, agility, and
dexterity. Examples of jobs in this category include construction laborers, truck drivers,
roofers, and highway maintenance workers.
Finally, the lowest-paying tier consists of Low-Skilled Service jobs, which tend to
pay around minimum wage.8 These are the types of jobs that, rightly or wrongly, have
become the poster child for underemployed young college graduates in recent years.
Examples of the kinds of jobs found in this category are waiters and waitresses, cashiers,
bartenders, cooks, and, yes, baristas.
While demand in the non-college segment of the labor market doubled in the
years following the Great Recession, this growth was not merely in low-paying jobs. We
turn back to the HWOL database to provide estimates of the number and growth of
monthly job postings for each of the occupation categories identified above between 2009
and 2013, also shown in Table 1. The Managers and Supervisors category had the largest
number of job postings after the Great Recession, followed closely by Office and
Administrative Support. The two lowest-paying categories, Physical Laborers and Low-
Skilled Service, saw large increases in demand, as did Skilled Trades and Managers and
Supervisors. These figures suggest that while many low-skilled service jobs were
available during this time, there were plenty of opportunities in jobs that tended to pay
higher wages. Next, we examine which jobs both underemployed college graduates and
those without college degrees took.
8 Autor and Dorn (2013) demonstrate that growth in these types of jobs has been strong in recent
decades, which has contributed to the polarization of the U.S. workforce.
14
B. What Jobs Did Underemployed Graduates Take?
Table 2 shows the share of underemployed recent college graduates across the ten
occupation categories in the years following the Great Recession. Contrary to popular
perception, most underemployed recent college graduates were not working in low-
skilled service jobs. Indeed, nearly half were working in relatively high-paying jobs, with
more than 10 percent each working in the Information Processing and Business Support,
Managers and Supervisors, and Sales categories. At 25 percent, the largest share of
underemployed workers were employed in the Office and Administrative Support
category. While these jobs may not be as desirable as the typical college job, which pays
around $78,500 annually, they are significantly better than low-skilled service jobs. That
said, about one-fifth of underemployed recent college graduates—roughly 9 percent of all
recent graduates—were working in a low-skilled service job.9
Comparing the distribution of underemployed college graduates to young workers
of the same age without a college degree yields some important insights about the value
of a college degree for underemployed workers. Those with a college degree were much
more likely to be working in higher paying jobs than those without. This pattern is
particularly evident in the highest-paying occupation categories that tend to emphasize
cognitive skills and decision making, such as the Information Processing and Business
Support and Managers and Supervisors categories. While around 40 percent of recent
college graduates were employed in the two highest paid tiers of non-college
occupations, only 18 percent of young workers without degrees held these types of jobs.
9 As an alternative to the Low-Skilled Service category, we also measured the share of all
underemployed workers earning around the minimum wage. We estimate this share to be roughly 20 to 25 percent, comparable to the share working in a low-skilled service job.
15
By contrast, among those working in these occupational categories, more than half of
young workers without a college degree were working in the low-paying Physical
Laborers and Low-Skilled Service occupation categories, double the share for recent
college graduates. Moreover, though not shown in the table, we also find that
underemployed recent college graduates tend to earn more than similarly aged young
workers without a college degree within each occupation category.
While the same general patterns hold between the genders, there are some notable
differences, as shown in Table 3. Underemployed men are more likely to be working in
the highest-paying occupation categories, including Information Processing and Business
Support and Managers and Supervisors. The male-female ratio is also particularly large
for jobs in the Public Safety and Skilled Trades categories, both of which tend to
emphasize physical skills. By contrast, underemployed women are much more likely to
be working in Office and Administrative Support jobs, and, to a lesser extent, the
Healthcare Technicians and Assistants category. In terms of the lower-paying categories,
underemployed men are more likely than women to be working in jobs in the Physical
Laborers category, while underemployed women are more likely to be working in jobs in
the Low-Skilled Service category.
IV. WHICH GRADUATES ARE MORE PRONE TO UNDEREMPLOYMENT?
We next turn to the question of which recent college graduates are more likely to
be underemployed. We use probit regressions to reveal which characteristics of recent
college graduates are associated with a higher probability of being underemployed, with a
particular focus on college major. Because men and women may choose different career
paths or have different experiences in the labor market, we estimate our regression
16
models using aggregate data and separately by gender. We wish to emphasize that our
models are not meant to imply causation, but rather to uncover some of the correlates to
the likelihood of being underemployed based on the characteristics of workers we are
able to identify in the data we employ.
A. Estimation Approach
Because our measures of underemployment are binary variables, we use probit
models to estimate the likelihood of underemployment among recent college graduates.
Specifically, letting UNDERi represent the underemployment of individual i located in
state j during year t, the probability that an individual is working in a job that does not
require a college degree can be expressed as:
Prob (UNDERi = 1) = Φ (βXi + δMi + φj + φt) (1)
where Xi is a vector of individual-level worker characteristics, Mi is a vector of dummy
variables denoting an individual’s college major, φj is a state-level spatial fixed effect, φt
is an annual time fixed effect; and β and δ are parameters to be estimated. Φ (∙) is a
normal cumulative distribution function, and the estimated parameters are chosen to
maximize the sum of the log likelihoods over all observations. We estimate our models
using two different measures for UNDERi, one that broadly includes graduates working
in any non-college job, and a second more narrowly-defined measure of
underemployment for those working in the Low-Skilled Service category.
Of particular interest for our purposes, the ACS began to include information on
an individual’s undergraduate degree major starting in 2009. Specifically, the ACS
provides information for more than 170 detailed degree major categories. Since many of
17
these detailed majors contain relatively few observations, we collapse this list into 73
majors to preserve large enough sample sizes to obtain meaningful results.
To explore how differences in worker characteristics, Xi, are related to the
likelihood of underemployment, our probit models include a wide range of individual
level characteristics such as gender, age, marital status, the presence of children, race and
ethnicity, and disability status.10 In addition, when collecting information about college
major, the ACS allows individuals to list up to two majors. We consider those individuals
who listed two majors as having graduated with a double major, which we control for,
and count the first listed as that person’s college major. As another control, we are also
able to identify recent college graduates who have earned a graduate degree.11
Table 4 provides descriptive statistics for the worker characteristics included in
our study for three groups: all recent college graduates, those who are underemployed,
and those working in a low-skilled service job. Interestingly, there are more
underemployed women (55 percent) than men (45 percent). This differential partly
reflects the fact that there are now more women college graduates than men in the overall
population, though men seem to be slightly overrepresented among the underemployed.
By contrast, men are underrepresented among low-skilled service workers. About 20
percent of the underemployed are married, 8 percent have children, 12 percent graduated
with a double major, and 6 percent earned a graduate degree. Proportionally fewer recent
10 To allow for non-linear effects from gaining experience in the labor market, we follow the convention
in wage studies and include both age and age-squared in our models. 11 The ACS indicates whether an individual holds a master’s degree, professional degree, or doctoral
degree, but does not provide information about the type of graduate degree (e.g., MA, MBA, JD, MD) or course of study while in graduate school.
18
college graduates working in a low-skilled service job were married, had children,
graduated with a double major, or earned a graduate degree.
To account for differences in local economic conditions across time and space
which may influence the likelihood of being underemployed, we include state-level
spatial fixed effects, φj, and annual time fixed effects, φt, in our models.12 In all of our
analysis, we report robust standard errors clustered at the state level, which tends to
increase standard errors but does not affect the point estimates themselves.
Despite our efforts to control for differences in local economic performance and a
wide range of individual worker characteristics, care must be taken when interpreting our
findings. Most significantly, in part, students sort into their chosen field of study based on
their ability to complete the required coursework (see, e.g., Arcidiacono, 2004 and Zafar,
2011, 2013). Thus, not all majors are feasible for every college student, and graduates
with different majors likely differ in other important ways that we are unable to measure,
such as intelligence, perseverance, or motivation. Indeed, recent research has shown that
graduating with a math or science major is more difficult than other fields of study
(Stinebrickner and Stinebrickner, 2014). In addition, our results represent average
outcomes for graduates within each of the 73 college majors we analyze. Thus, by
definition, some individuals within each major will have better or worse outcomes than
12 For example, Mian and Sufi (2010, 2011) show that the most pronounced effects of the Great
Recession were concentrated in the ‘Sand States,’ and that the pace of recovery generally differed across states. Further, Abel and Deitz (2015) show that local labor market conditions can influence the likelihood and quality of the match between an individual’s education and job. We also estimated a model using spatial fixed effects at the local labor market area, which we defined as metropolitan areas and the rural portion of each state. Results were nearly identical to those reported in the paper, but small sample sizes within many local labor markets prevented us from estimating models using underemployed graduates working in low-skilled service jobs.
19
our results suggest. Nonetheless, examining the typical experience within each major can
provide useful insights into the correlates of the likelihood of underemployment.
B. Estimation Results
Because of the difficulties associated with interpreting raw coefficient estimates
obtained via probit analysis, we instead present the corresponding average marginal
effects and predicted probabilities obtained from our analysis. As such, our estimates can
be interpreted as the average percentage point change in the probability of either being
underemployed or working in a low-skilled service job. We first describe how the
probability of being underemployed is correlated with the worker characteristics we are
able to identify, and then turn to the role of college major.
i. Worker Characteristics
Table 5 presents the average marginal effects associated with the worker
characteristics included in our analysis. Columns (1)-(3) show results using
underemployment in general as the dependent variable, while Columns (4)-(6) show
results using Low-Skilled Service jobs only. Our results show that the likelihood of
college underemployment differs significantly across a wide range of worker
characteristics.
Regarding gender differences, our analysis indicates that male graduates are 1.2
percentage points more likely to be underemployed in the early stages of their careers
than their female counterparts. Specifically, men have a predicted probability of 45.3
percent compared to 44.1 percent for women—a gap that represents about a 3 percent
difference between these groups. This difference may stem in part from the recent
success women have enjoyed relative to men while in college, but it could also reflect the
20
fact that underemployed men tend to be more represented in the higher-paying non-
college occupation categories, and, therefore may have less incentive to seek a college
job.13 Indeed, women graduates are 1.1 percentage points (9.1 percent compared to 8.0
percent) more likely to be working in a low-skilled service job than men—a difference of
more than 12 percent. For both men and women, the likelihood of being underemployed
or working in a low-skilled service job declines sharply as workers age from 22 to 27.
In terms of family considerations, graduates who are married are less likely to be
underemployed (41.5 percent compared to 45.6 percent) or working in a low-skilled
service job (6.6 percent compared to 9.2 percent), and this is particularly true among
married men. In addition, those graduates with children are more likely to be
underemployed (47.4 percent compared to 44.4 percent). Women with children, in
particular, are more likely to be working in a low-skilled service job. One potential
explanation for these findings is that those who are married or without children have a
greater ability to search for better jobs because they have more resources available, or
face fewer constraints, and that these factors reduce the likelihood of being
underemployed. However, more research is needed to disentangle the potentially
complex relationships between gender, family, and the likelihood of underemployment.
Underemployment following the Great Recession also varied significantly across
racial and ethnic groups. Compared to white graduates, who have a 44.1 percent
likelihood of being underemployed, black and American Indian graduates are 17 percent
more likely to be working in a non-college job, while Asian graduates are 5 percent less 13 Goldin, Katz, and Kuziemko (2006) show that women are now much more likely to enroll in and
complete college than men, reversing the college gender gap. Fortin, Oreopoulos, and Phipps (2015) demonstrate that the relatively strong academic performance of women compared to men in recent decades stems, in large part, from being better prepared for and focused on college.
21
likely. Our estimates also indicate non-white graduates are more likely to be working in
low-skilled service jobs, though these differences are generally not statistically
significant. Moreover, those of Hispanic origin are 10 percent more likely to be
underemployed and 31 percent more likely to be working in a low-skilled service job
than non-Hispanics. Looking across genders, the magnitudes of our estimates pertaining
to race and ethnicity tend to be larger for men than women. These findings are broadly
consistent with other research showing that minorities, particularly black and Hispanic
men, tend to suffer the most during recessions (See, e.g., Elsby et al., 2010, 2011;
Hoynes, Miller, and Schaller, 2012; and Nunley et al., 2015).
Graduates with a disability are 4.2 percentage points—or 10 percent—more likely
to be underemployed than those who are not, and are 1.4 percentage points—or 16
percent—more likely to be working in a low-skilled service job. In both cases, the
estimated effects are larger for women than for men.
Graduating with a double major or earning a graduate degree are both associated
with a lower likelihood of being underemployed or working in a low-skilled service job.
Graduates with a double major are 4.6 percentage points less likely to be underemployed
than those with a single major, and are 1.6 percentage points less likely to be working in
a low-skilled service job. Those with a graduate degree are 25.2 percentage points less
likely to be underemployed than those without, and are 5.2 percentage points less likely
to be working in a low-skilled service job. These results are expected as those with two
majors or a graduate degree tend to have built more skills, and especially for those with a
graduate degree, have developed occupation specific skills and training that may allow
them better access to employment opportunities. The reduced likelihood of college
22
underemployment for those with a double major or graduate degree is similar for both
men and women.
ii. College Major
The role of college major in finding a good job has become of considerable
interest in recent years given the weak labor market following the Great Recession. While
not all students are willing and able to complete a degree in any major, some choice is
involved, making information about the success of those with certain majors relative to
others of value to students and parents. In Tables 6 and 7, we present the predicted
probabilities of being underemployed or working in a low-skilled service job,
respectively, by college major, holding constant the other variables in our model. Given
the large amount of information contained in these tables and the fact that the patterns do
not appear to differ widely by gender, we also plot the overall predicted probabilities by
college major in Figures 4 and 5. Though there are differences in the rankings of college
majors for each measure of underemployment, five broad themes emerge.14
First, it is clear that college major is a significant correlate with the probability of
being underemployed in the early careers of college graduates. While, on average, 44.6
percent of recent graduates work in a non-college job, underemployment rates range from
70 percent for graduates with a Criminal Justice major to 9.5 percent for those with a
Nursing degree. Similarly, while on average, only 8.6 percent of recent college graduates
work in a low-skilled service job, this figure ranges from 23.4 percent for those majoring
in Leisure and Hospitality to 1.7 percent for graduates with a Civil Engineering major.
14 The Spearman rank correlation of the predicted probabilities of being underemployed and working in a
low-skilled service job by college major is 0.57.
23
Second, graduates with college majors that provide technical training and
quantitative skills are far less likely to be underemployed than those with majors that tend
to be less quantitative in nature. Indeed, for both measures of college underemployment,
graduates with majors in the Science, Technology, Engineering, and Mathematics
(STEM) fields tend to have some of the lowest predicted probabilities of working in a
non-college job. In particular, graduates with any type of engineering major generally
fared well in the labor market following the Great Recession. Outside of the traditional
STEM majors, those with majors that are quantitatively oriented, such as Accounting,
Business Analytics, Economics, and Finance, also tend to have relatively low
underemployment rates. By contrast, those with majors in less quantitative subjects such
as English Language, Communications, Ethnic Studies, Art History, or Anthropology
tend to have relatively high rates of underemployment.
Third, graduates with college majors that provide occupation-specific training
tend to be less likely to be underemployed than those with majors providing a more
general education. For example, occupation-specific majors like education, engineering,
and health-related fields, tended to have much lower rates of underemployment than
those with majors in more general fields such as Liberal Arts, Philosophy, or History.
This pattern also emerges when examining the outcomes of graduates within a specific
academic discipline that may offer both occupation specific majors and majors that are
more general. The business field provides a case in point: those with a more targeted
major, such as Accounting or Finance, tend to have lower underemployment rates than
those with majors that are less directly connected to specific jobs, such as Business
Management or General Business.
24
Fourth, however, there are some college majors that offer occupation-specific
training that tends to be geared toward jobs that do not typically require a bachelor’s
degree, and graduates with these majors are more likely to be underemployed. For
example, those who major in Criminal Justice may be expecting to take jobs in Public
Safety (such as a police officer or detective) and those with a Fine Arts or Performing
Arts major may be expecting to take jobs in Arts and Entertainment (such as a
photographer or dancer). In addition, those with a Leisure and Hospitality major may be
trained for a number of jobs that do not to require a college degree, such as a restaurant
manager or health and wellness instructor. Further, while those with healthcare-related
degrees generally tend to have relatively low underemployment, those with a Medical
Technicians major, which likely prepares students to take jobs in the Healthcare
Technicians and Assistants category, have relatively high underemployment.
Finally, graduates with college majors geared toward growing parts of the
economy are generally less likely to be underemployed. Indeed, the health and education
sectors in particular continued to grow through both the downturn and recovery alike,
creating job opportunities for people with skills oriented toward these types of jobs. As
such, the likelihood of underemployment was fairly low for those with healthcare-related
majors, such as Nursing, Pharmacy, and Treatment Therapy. Similarly, those with an
education-related major tend to experience below average underemployment in general,
though such graduates tend to have higher rates of working in low-skilled service jobs,
particularly those who major in Elementary or Early Childhood Education.
25
V. TRANSITIONING TO BETTER JOBS
A key finding from our empirical analysis is that to some degree,
underemployment is a temporary phase for many recent graduates as they transition from
school to the labor market. This pattern is particularly evident for those who start their
careers working in a low-skilled service job. Indeed, such adjustment is not merely a new
phenomenon resulting from the Great Recession—research has shown that
underemployment typically falls as new graduates spend time in the labor market, and
that this pattern has been occurring for decades (Abel, Deitz, and Su, 2014).
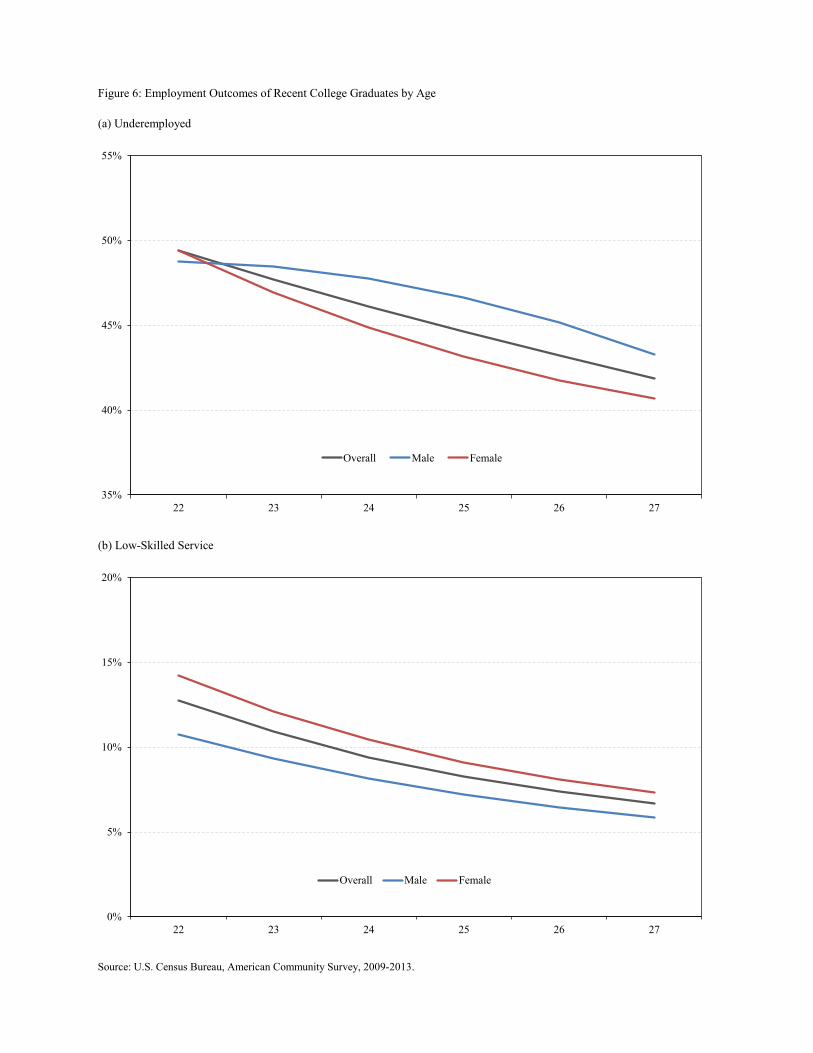
To illustrate this point, in Figure 6, we use estimates from our probit analysis to
plot the likelihood of being underemployed (top panel) and working in a low-skilled
service job (bottom panel) by age, overall and separately by gender. In both cases, we
identify a strong downward trend in the likelihood of working in a non-college job as
graduates gain more experience in the labor market. At age 22, when fresh out of college,
the likelihood of being underemployed is nearly 50 percent, but this figure falls to around
42 percent by age 27—a 15 percent decline. Not only are women generally less likely to
be underemployed than men at any age, the decline in underemployment is also more
pronounced for women than for men. The transition out of low-skilled service jobs is
even more striking. At age 22, the predicted probability of working in such a job is about
13 percent, but this figure falls to 6.7 percent by age 27—a nearly 50 percent decline. The
likelihood of working in a low-skilled service job declines at a similar pace for men and
women.
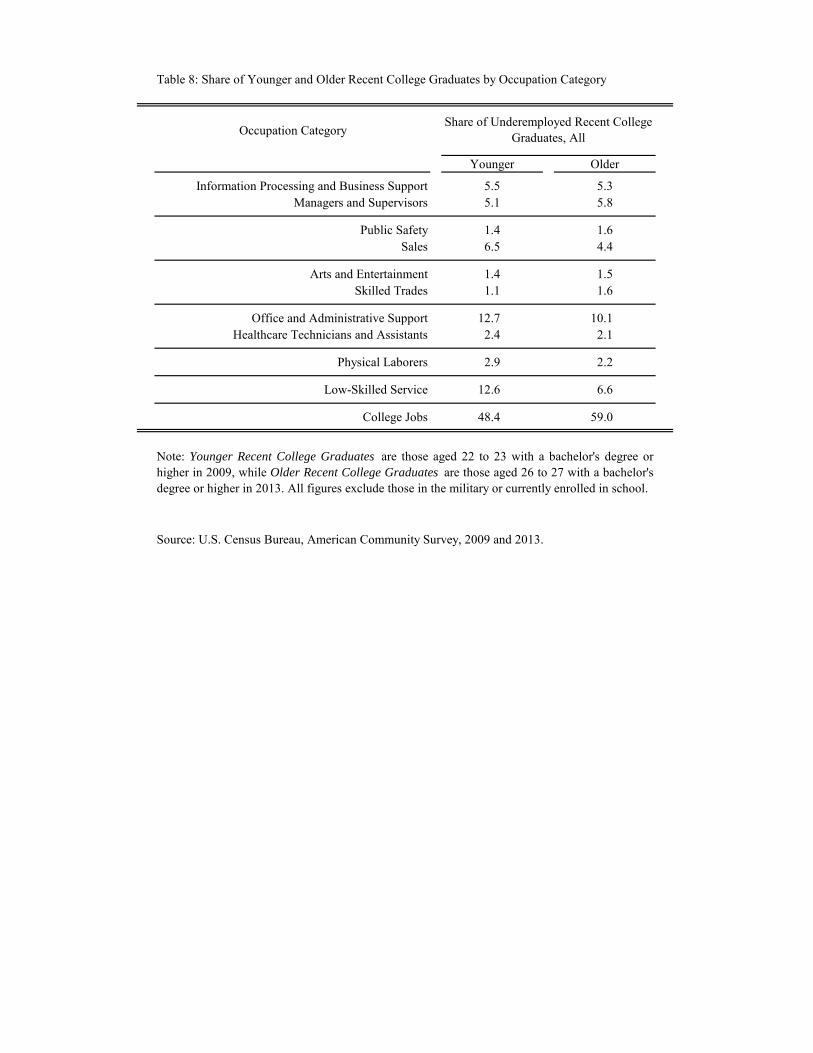
To examine more of the details of this transition, in Table 8 we compare the jobs
held by Younger Recent Graduates (aged 22 to 23 in 2009) to Older Recent Graduates of
26
the same cohort (aged 26 to 27 in 2013). Consistent with our analysis above, a larger
share of graduates worked in college jobs in their mid-twenties (59 percent) compared to
their early twenties (48 percent). In addition, the composition of jobs held by recent
graduates changed within the underemployed occupation categories as these workers
aged. The share employed in the lowest paying Low-Skilled Service group drops by half,
suggesting that these jobs are temporary for a good number of recent graduates: by the
age of 26 or 27, only 6.6 percent are still working in these types of jobs. The other two
groups with the most significant declines include Office and Administrative Support and
Sales. Though we cannot identify which jobs graduates tend to move into since our data
are cross-sectional in nature—that is, workers may be shifting into other non-college jobs
or into college jobs—these figures suggest that many underemployed graduates,
particularly those who start in a low-skilled service job, are able to transition to better
jobs as they gain more experience in the labor market.
Table 9 presents this same information by gender. In general, these patterns
continue to hold when looking at men and women separately. However, while a larger
share of women transition out of underemployment to college jobs by their late twenties
than men, we find that the share of underemployed graduates working in the high paying
Managers and Supervisors occupation category tends to increase more for men than for
women. This share rose about one and a half percentage points for men, but edged up
only slightly for women. There was also a slight increase in the share of women working
in the highest paid category of Information Processing and Business Support, while men
experienced almost a full percentage point decline.
27
Nonetheless, while underemployment appears to be a temporary phase for many
recent graduates who are able to transition to better jobs, a large share of college
graduates remain underemployed long after the initial transition into the labor market,
and this was particularly true following the Great Recession. Indeed, even in the best of
economic times, about one-third of all college graduates work in a non-college job. This
figure is fairly stable and does not appear to be particularly responsive to the business
cycle. This suggests that at least some college graduates may simply prefer to work in
such jobs, either because they like the nature of the work involved, or because of
geographic or family considerations, such as taking a lower-skilled job due to a dual
labor market search, or while raising children.
VI. CONCLUSIONS
With the Great Recession and weak labor market that followed in its wake, the
prevalence of underemployment among recent college graduates reached highs not seen
since the early 1990s. However, contrary to popular perception, our work reveals that
most of these newly underemployed workers were not forced into low-skilled service
jobs. In fact, many of the jobs such graduates took, while clearly not equivalent to jobs
that require a college degree, appeared to be more oriented toward knowledge and skill
when compared to the distribution of jobs held by young workers without a college
degree. Indeed, our analysis also suggests that underemployment is a temporary phase for
many young graduates when they enter the labor market, as it often takes time for newly
minted graduates to find jobs suited to their education.
We also find that some college graduates have had much better luck finding a
college-level job than others. In particular, the likelihood of being underemployed is
28
relatively low for those with quantitatively oriented and occupation-specific majors, and
much higher for those with degrees in more general fields. Those with STEM and
healthcare-related majors have done particularly well in recent years.
These findings raise some interesting questions about the relative supply and
demand for specific skill sets obtained in college, and about the value of some majors
relative to others in today’s economy. While we do not present our findings in the context
of a formal supply and demand model, our work does suggest that certain skills have a
higher demand relative to supply than others—such as those majors related to the STEM
fields and healthcare. Our findings also raise the specter that degrees in some majors,
particularly those that are broad based such as Liberal Arts and General Business, may be
less sought-after than others. Further, graduates with some majors seem to more easily
fall into jobs that typically do not require their degrees, such as Leisure and Hospitality
and Criminal Justice.
Why are graduates with certain majors faring so poorly upon graduation? Is high
underemployment for those with these particular majors a consequence of the quality of
the students who choose these majors, the quality of the programs and the skills that are
developed (or not developed), or is it that the skills that these majors provide are not as
valuable as others? More research is required to address these challenging questions.
More generally, today’s high level of underemployment is concerning, and raises
a number of questions about why it has continued to rise for more than a decade despite
ongoing improvement in the labor market. No doubt, the depth of the Great Recession
and the relatively lackluster demand for college graduates through the recovery has been
a contributing factor. However, there are lingering questions about whether this soft
29
demand is a long-term phenomenon, as opposed to cyclical in nature. Indeed, recent
research suggests that structural changes in the economy may have reduced the demand
for college graduates starting as early as 2000 (Beaudry, Green, and Sand, 2014, 2016).
On the supply side, there are questions about whether the quality of students graduating
from college has deteriorated in recent years, with some research suggesting that many
students gain little knowledge or skill from a college education (Arum and Roksa, 2011,
2014). Our work suggests that these questions are complex, particularly since college
graduates with certain skill sets seem to be doing much better in the labor market than
others. Further research into these questions would be particularly valuable.
While this work provides more detailed information about the nature of
underemployment than has previously been available, it does have its limitations. The
most significant limitation is that we cannot fully account for potential unobserved
heterogeneity across individuals, such as our inability to control for college grades or the
quality of the educational institution attended. In particular, attendance at for-profit
colleges increased dramatically during the Great Recession, which may have altered the
composition of students graduating during the period we study. Further, we do not have
information about innate ability, and so we do not know the value that a college degree is
adding relative to one’s baseline skill, or how ability factors into which college major
people choose. Any of these factors could be contributing to the patterns we observe. In
addition, it would be desirable to follow the same individuals over time to capture
measures of ability and to track career progression. However, we are not able to do so
with the datasets we employ, so we leave these issues for future research. Nonetheless,
we believe this work takes an important step forward by providing a more complete
30
picture of underemployment in the early careers of college graduates following the Great
Recession.
31
REFERENCES
Abel, Jaison R. and Richard Deitz. 2015. “Agglomeration and Job Matching Among College Graduates,” Regional Science and Urban Economics, Vol. 51, pp. 14-24.
Abel, Jaison R., Richard Deitz, and Yaqin Su. 2014. “Are Recent College Graduates Finding Good Jobs?” FRBNY Current Issues in Economics and Finance, Vol. 20, No. 1, pp. 1-8.
Altonji, Joseph G., Erica Blom, and Costas Meghir. 2012. “Heterogeneity in Human Capital Investments: High School Curriculum, College Major, and Careers,” Annual Review of Economics, Vol. 4, pp. 185-223.
Altonji, Joseph G., Lisa B. Kahn, and Jamin D. Speer. 2014. “Trends in Earnings Differentials Across College Majors and the Changing Task Composition of Jobs,” American Economic Review, Vol. 104, No. 5, pp. 387-393.
Altonji, Joseph G., Lisa B. Kahn, and Jamin D. Speer. 2016. “Cashier or Consultant? Entry Labor Market Conditions, Field of Study, and Career Success,” Journal of Labor Economics, Vol. 34, No. S1 (Part 2), pp. S361-S401.
Arcidiacono, Peter. 2004. “Ability Sorting and the Returns to College Major,” Journal of Econometrics, Vol. 121, No. 1-2, pp. 343-375.
Arum, Richard and Josipa Roksa. 2011. Academically Adrift: Limited Learning on College Campuses, Chicago: The University of Chicago Press.
Arum, Richard and Josipa Roksa. 2014. Aspiring Adults Adrift: Tentative Transitions of College Graduates, Chicago: The University of Chicago Press.
Autor, David H. and David Dorn. 2013. “The Growth of Low-Skill Service Jobs and the Polarization of the US Labor Market,” American Economic Review, Vol. 103, No. 5, pp. 1553-1597.
Beaudry, Paul, David A. Green, and Benjamin M. Sand. 2014. “The Declining Fortunes of the Young Since 2000,” American Economic Review, Vol. 104, No. 5, pp. 381-386.
Beaudry, Paul, David A. Green, and Benjamin M. Sand. 2016. “The Great Reversal in the Demand for Skill and Cognitive Tasks,” Journal of Labor Economics, Vol. 34, No. S1 (Part 2), pp. S199-S247.
Betts, Julian R. 1996. “What Do Students Know About Wages?” Journal of Human Resources, Vol. 31, No. 1, pp. 27-56.
Casselman, Ben. 2013. “College Grads May Be Stuck in Low-Skill Jobs,” The Wall Street Journal, March 26.
Chevalier, Arnaud and Joanne Lindley. 2009. “Overeducation and the Skills of UK Graduates,” Journal of the Royal Statistical Society, Vol. 172, No. 2, pp. 307-337.
Elsby, Michael W., Bart Hobijn, and Ayşegül Şahin. 2010. “The Labor Market in the Great Recession,” Brookings Papers on Economic Activity, Spring, pp. 1-48.
Elsby, Michael W., Bart Hobijn, Ayşegül Şahin, and Robert G. Valletta. 2011. “The Labor Market in the Great Recession—An Update to September 2011,” Brookings Papers on Economic Activity, Fall, pp. 353-384.
Feldman, Daniel C. 1996. “The Nature, Antecedents and Consequences of Underemployment,” Journal of Management, Vol. 22, No. 3, pp. 385-407.
Feldman, Daniel C. and William H. Turnley. 1995. “Underemployment Among Recent Business College Graduates,” Journal of Organizational Behavior, Vol. 16, No. S1, pp. 691-706.
Fogg, Neeta P. 2011. “Rising Mal-Employment and the Great Recession: The Growing Disconnection between Recent College Graduates and the College Labor Market,” Continuing Higher Education Review, Vol. 75, pp. 51-65.
Fortin, Nicole M., Philip Oreopoulos, and Shelly Phipps. 2015. “Leaving Boys Behind: Gender Disparities in High Academic Achievement,” Journal of Human Resources, Vol. 50, No. 3, pp. 549-579.
Galston, William A. 2014. “Welcome to the Well-Educated Barista Economy,” The Wall Street Journal, April 29.
Goldin, Claudia, Lawrence F. Katz, and Ilyana Kuziemko. 2006. “The Homecoming of American College Women: The Reversal of the College Gender Gap,” Journal of Economic Perspectives, Vol. 20, No. 4, pp. 133-156.
Green, Francis and Yu Zhu. 2010. “Overqualification, Job Dissatisfaction, and Increasing Dispersion in the Returns to Graduate Education,” Oxford Economic Papers, Vol. 62, No. 4, pp. 740-763.
Hersch, Joni. 1991. “Education Match and Job Match,” Review of Economics and Statistics, Vol. 73, No. 1, pp. 140-144.
Hoynes, Hilary, Douglas L. Miller, and Jessamyn Schaller. 2012. “Who Suffers During Recessions?” Journal of Economic Perspectives, Vol. 26, No. 3, pp. 27-48.
Kahn, Lisa B. 2010. “The Long-Term Labor Market Consequences of Graduating from College in a Bad Economy,” Labour Economics, Vol. 17, No. 2, pp. 303-316.
33
McKee-Ryan, Frances M. and Jaron Harvey. 2011. “‘I Have a Job, But …’: A Review of Underemployment,” Journal of Management, Vol. 37, No. 4, pp. 962-996.
Mian, Atif and Amir Sufi, 2010. “Household Leverage and the Recession of 2007 to 2009,” IMF Economic Review, Vol. 58, pp. 74-117.
Mian, Atif and Amir Sufi, 2011. “Household Debt and the Weak U.S. Recovery,” Federal Reserve Bank of San Francisco Economic Letter, 2011-02, January, pp. 1-5.
Nunley, John M., Adam Pugh, Nicholas Romero, and R. Alan Seals. 2015. “Racial Discrimination in the Labor Market for Recent College Graduates: Evidence from a Field Experiment,” The BE Journal of Economic Analysis & Policy, Vol. 15, No. 3, pp. 1093-1125.
Oreopoulos, Philip, Till von Wachter, and Andrew Heisz. 2012. “The Short- and Long-Term Career Effects of Graduating in a Recession,” American Economic Journal: Applied Economics, Vol. 4, No. 1, pp. 1-29.
Peterson, Norman, Michael Mumford, Walter Borman, Richard Jeanneret, Edwin Fleishman, Kerry Levin, Michael Campion, Melinda Mayfield, Frederick Morgeson, Kenneth Pearlman, Marilyn Gowing, Anita Lancaster, Marilyn Silver, and Donna Dye. 2001. “Understanding Work Using the Occupational Information Network (O*NET): Implications for Practice and Research,” Personnel Psychology, Vol. 54, No. 2, pp. 451-492.
Ruggles, Steven, Katie Genadek, Ronald Goeken, Josiah Grover, and Matthew Sobek. 2015. Integrated Public Use Microdata Series: Version 6.0 [Machine-readable database]. Minneapolis: University of Minnesota.
Şahin, Ayşegül, Joseph Song, Giorgio Topa, and Giovanni L. Violante. 2014. “Mismatch Unemployment,” American Economic Review, Vol. 104, No. 11, pp. 3529-3564.
Stinebrickner, Ralph and Todd R. Stinebrickner. 2014. “A Major in Science? Initial Beliefs and Final Outcomes for College Major and Dropout,” Review of Economic Studies, Vol. 81, No. 1, pp. 426-472.
Vedder, Richard, Christopher Denhart, and Jonathan Robe. 2013. “Why Are Recent College Graduates Underemployed?” Center for College Affordability and Productivity Policy Paper, January.
Wiswall, Matthew and Basit Zafar. 2015a. “Determinants of College Major Choice: Identification Using and Information Experiment,” Review of Economic Studies, Vol. 82, No. 2, pp. 791-824.
Wiswall, Matthew and Basit Zafar. 2015b. “How Do College Students Respond to Public Information about Earnings?” Journal of Human Capital, Vol. 9, No. 2, pp. 117-169.
34
Yen, Hope. 2012. “Half of New Grads are Jobless or Underemployed,” Associated Press, April 24.
Zafar, Basit. 2011. “How Do College Students Form Expectations?” Journal of Labor Economics, Vol. 29, No. 2, pp. 301-348.
Zafar, Basit. 2013. “College Major Choice and the Gender Gap,” Journal of Human Resources, Vol. 48, No. 3, pp. 545-595.
Table 1: Occupation Categories of Underemployed College Graduates
Occupation CategoryAverage Wage,
Full-Time Workers
Average Monthly Job Postings
Percent Growth in Postings
Information Processing and Business Support $59,059 188,000 63Managers and Supervisors $55,415 359,200 122
Public Safety $52,567 31,300 76Sales $52,474 293,700 66
Arts and Entertainment $48,765 29,000 9Skilled Trades $47,268 158,000 162
Office and Administrative Support $37,207 351,000 57Healthcare Technicians and Assistants $36,223 220,500 34
Physical Laborers $33,006 275,200 285
Low-Skilled Service $23,584 271,100 133
Note: Average wages are calculated for all workers aged 22 to 65 who usually work at least 35 hours per week for40 or more weeks per year. Average Monthly Job Postings are calculated for the years 2009 to 2013. PercentGrowth in Postings is calculated from mid-2009, the end of the Great Recession, through mid-2014.
Source: U.S. Census Bureau, American Community Survey, 2009-2013; The Conference Board, Help WantedOnline; U.S. Department of Labor, O*NET.
Table 2: Share of Underemployed Recent College Graduates by Occupation Category
Occupation Category
Share of Underemployed Recent College
Graduates
Share of Young Workers Without a
College Degree
Information Processing and Business Support 11.4 2.0Managers and Supervisors 13.1 7.8
Public Safety 3.7 2.8Sales 11.7 5.1
Arts and Entertainment 3.0 0.7Skilled Trades 2.7 8.2
Office and Administrative Support 25.2 15.0Healthcare Technicians and Assistants 4.7 6.6
Physical Laborers 5.4 24.1
Low-Skilled Service 19.3 27.6
Source: U.S. Census Bureau, American Community Survey, 2009-2013.
Note: Recent College Graduates are those aged 22 to 27 with a bachelor's degree or higher,while Young Workers are those aged 22 to 27 without a bachelor's degree. All figures excludethose in the military or currently enrolled in school.
Table 3: Share of Underemployed Recent College Graduates by Occupation Category and Gender
Occupation Category
Male Female Male Female
Information Processing and Business Support 12.1 10.7 2.1 2.0Managers and Supervisors 15.1 11.4 7.7 8.1
Public Safety 5.9 1.9 3.9 1.3Sales 12.6 11.0 4.6 5.9
Arts and Entertainment 3.9 2.2 0.7 0.6Skilled Trades 5.0 0.8 13.1 1.0
Office and Administrative Support 17.8 31.3 9.3 23.4Healthcare Technicians and Assistants 2.4 6.5 1.9 13.6
Physical Laborers 9.2 2.3 35.5 7.5
Low-Skilled Service 16.1 22.0 21.3 36.7
Source: U.S. Census Bureau, American Community Survey, 2009-2013.
Share of Underemployed Recent College Graduates
Share of Young Workers Without a College Degree
Note: Recent College Graduates are those aged 22 to 27 with a bachelor's degree or higher, while Young Workers are thoseaged 22 to 27 without a bachelor's degree. All figures exclude those in the military or currently enrolled in school.
Table 4: Characteristics of Recent College Graduates
All Recent Grads Underemployed Low-Skilled Service
Variable Mean St. Dev. Mean St. Dev. Mean St. Dev.
Source: U.S. Census Bureau, American Community Survey, 2009-2013.
20,233,500 9,031,408 1,744,695
Note: Recent College Graduates are those aged 22 to 27 with a bachelor's degree or higher. Allfigures exclude those in the military or currently enrolled in school.
Table 5: Average Marginal Effects from Underemployment and Low-Skilled Service Probit Models
Weighted N 20,233,500 8,818,586 11,414,914 20,233,500 8,818,586 11,414,914
Source: U.S. Census Bureau, American Community Survey, 2009-2013.
Note: Robust standard errors, clustered at the state level, are reported in parentheses. ***, **, and * denote statistical significance at the 0.01, 0.05, and0.10 levels, respectively. Models also include the following controls (coefficients not reported for brevity): individual's college major (73 degree fields),state, and year. Marginal effects for dummy variables represent discrete change from 0 to 1.
Table 6: Probability of Underemployment Among Recent College Graduates by Major
Art History 0.621 (0.021) 0.736 (0.047) 0.592 (0.023) Public Policy and Law 0.618 (0.029) 0.547 (0.052) 0.674 (0.030) Business Management 0.601 (0.006) 0.592 (0.011) 0.613 (0.007)
Fine Arts 0.591 (0.009) 0.604 (0.012) 0.580 (0.012) History 0.575 (0.011) 0.581 (0.013) 0.573 (0.016)
Source: U.S. Census Bureau, American Community Survey, 2009-2013.
Table 8: Share of Younger and Older Recent College Graduates by Occupation Category
Occupation Category
Younger Older
Information Processing and Business Support 5.5 5.3Managers and Supervisors 5.1 5.8
Public Safety 1.4 1.6Sales 6.5 4.4
Arts and Entertainment 1.4 1.5Skilled Trades 1.1 1.6
Office and Administrative Support 12.7 10.1Healthcare Technicians and Assistants 2.4 2.1
Physical Laborers 2.9 2.2
Low-Skilled Service 12.6 6.6
College Jobs 48.4 59.0
Source: U.S. Census Bureau, American Community Survey, 2009 and 2013.
Share of Underemployed Recent College Graduates, All
Note: Younger Recent College Graduates are those aged 22 to 23 with a bachelor's degree orhigher in 2009, while Older Recent College Graduates are those aged 26 to 27 with a bachelor'sdegree or higher in 2013. All figures exclude those in the military or currently enrolled in school.
Table 9: Share of Younger and Older Recent College Graduates by Occupation Category and Gender
Occupation Category
Younger Older Younger Older
Information Processing and Business Support 6.3 5.4 5.0 5.1Managers and Supervisors 5.0 6.4 5.2 5.3
Public Safety 2.7 2.5 0.6 0.8Sales 7.1 5.4 6.1 3.5
Arts and Entertainment 2.3 2.1 0.8 0.9Skilled Trades 2.2 3.1 0.4 0.4
Office and Administrative Support 9.8 6.9 14.6 12.6Healthcare Technicians and Assistants 1.4 1.3 3.0 2.8
Physical Laborers 5.7 3.8 1.2 0.8
Low-Skilled Service 11.0 5.7 13.6 7.4
College Jobs 46.4 57.4 49.7 60.4
Source: U.S. Census Bureau, American Community Survey, 2009 and 2013.
Share of Underemployed Recent College Graduates, Male
Share of Underemployed Recent College Graduates, Female
Note: Younger Recent College Graduates are those aged 22 to 23 with a bachelor's degree or higher in 2009, while Older Recent College Graduates are those aged 26 to 27 with a bachelor's degree or higher in 2013. All figures exclude those in themilitary or currently enrolled in school.
Figure 1: Unemployment Among College Graduates
Source: U.S. Census Bureau and U.S. Bureau of Labor Statistics, Current Population Survey.
Note: Rates are calculated as a twelve-month moving average. Recent College Graduates are those aged 22 to 27 with a bachelor's degree or higher,while College Graduates are those aged 22 to 65 with a bachelor's degree or higher. All Workers are those aged 16 to 65 regardless of education. Allfigures exclude those in the military or currently enrolled in school. Shaded area indicates period designated recession by the NBER.
Recent College Graduates
College Graduates
All Workers
0%
1%
2%
3%
4%
5%
6%
7%
8%
9%
10%
1990 1995 2000 2005 2010 2015
Figure 2: Underemployment Among College Graduates
Sources: U.S. Census Bureau and U.S. Bureau of Labor Statistics, Current Population Survey; U.S. Department of Labor, O*NET.
Note: Rates are calculated as a twelve-month moving average. Recent College Graduates are those aged 22 to 27 with a bachelor's degree or higher,while College Graduates are those aged 22 to 65 with a bachelor's degree or higher. All figures exclude those in the military or currently enrolled inschool. Shaded area indicates period designated recession by the NBER.
25%
30%
35%
40%
45%
50%
1990 1995 2000 2005 2010 2015
Recent College Graduates
College Graduates
Figure 3: The Demand for College Graduates Through the Great Recession
Note: Shaded area indicates period designated recession by the NBER.
Source: The Conference Board, Help Wanted Online; U.S. Department of Labor, O*NET.
College Jobs
Non-College Jobs
0
20
40
60
80
100
120
140
160
180
2006 2007 2008 2009 2010 2011 2012 2013 2014 2015
Index (December 2007 = 100)
Figure 4: Probability of Underemployment Among Recent College Graduates by Major
Source: U.S. Census Bureau, American Community Survey, 2009-2013.
0% 10% 20% 30% 40% 50% 60% 70% 80%
Criminal JusticePerforming Arts
Leisure and HospitalityAnthropology
Art HistoryPublic Policy and LawBusiness Management
Fine ArtsHistory
Animal and Plant SciencesMiscellaneous Technologies
CommunicationsLiberal Arts
General BusinessPolitical Science
MarketingSociology
Mass MediaForeign Language
PhilosophyEnglish Language
AgricultureAdvertising and Public Relations
Medical TechniciansEnvironmental Studies
PsychologyInternational Affairs
Interdisciplinary StudiesTheology and Religion
Ethnic StudiesGeneral Social Sciences
Health ServicesMiscellaneous Biological Sciences
GeographyBiology
Earth SciencesEngineering Technologies
Nutrition SciencesInformation Systems and Management
Family and Consumer SciencesMiscellaneous Physical Sciences