Underestimated health risks: polystyrenemicro- and nanoplastics jointly induceintestinal barrier dysfunction by ROS-mediated epithelial cell apoptosisBoxuan Liang1†, Yizhou Zhong1†, Yuji Huang1†, Xi Lin1†, Jun Liu1, Li Lin1, Manjiang Hu1, Junying Jiang2,Mingzhu Dai3, Bo Wang1, Bingli Zhang1, Hao Meng1, Jesse Justin J. Lelaka1, Haixia Sui4, Xingfen Yang5* andZhenlie Huang1*
Abstract
Background: Micro- and nanoplastic pollution has become a global environmental problem. Nanoplastics in theenvironment are still hard to detect because of analysis technology limitations. It is believed that when microplasticsare found in the environment, more undetected nanoplastics are around. The current “microplastic exposure” is in factthe mixture of micro- and nanoplastic exposures. Therefore, the biological interaction between organisms amongdifferent sizes of micro- and nanoplastics should not be neglected.
Results: We measured the biodistribution of three polystyrene (PS) particles (50 nm PS, PS50; 500 nm PS, PS500; 5000nm PS, PS5000) under single and co-exposure conditions in mice. We explored the underlying mechanisms byinvestigating the effects on three major components of the intestinal barrier (the mucus layer, tight junctions and theepithelial cells) in four intestine segments (duodenum, jejunum, ileum and colon) of mice. We found that the amountsof both PS500 and PS5000 increased when they were co-exposed with PS50 for 24 h in the mice. These increasedamounts were due primarily to the increased permeability in the mouse intestines. We also confirmed there was acombined toxicity of PS50 and PS500 in the mouse intestines. This manifested as the mixture of PS50 and PS500causing more severe dysfunction of the intestinal barrier than that caused by PS50 or PS500 alone. We found that thecombined toxicity of PS micro- and nanoplastics on intestinal barrier dysfunction was caused primarily by reactiveoxygen species (ROS)-mediated epithelial cell apoptosis in the mice. These findings were further confirmed by anoxidants or antioxidants pretreatment study. In addition, the combined toxicity of PS micro- and nanoplastics was alsofound in the mice after a 28-day repeated dose exposure.
* Correspondence: [email protected]; [email protected]†Boxuan Liang, Yizhou Zhong, Yuji Huang and Xi Lin contributed equally tothis work as co-first authors.5Food Safety and Health Research Center, School of Public Health, SouthernMedical University, 1023-1063 Shatai Nan Road, Guangzhou 510515, PR China1Department of Toxicology, Guangdong Provincial Key Laboratory of TropicalDisease Research, School of Public Health, Southern Medical University,1023-1063 Shatai Nan Road, Guangzhou 510515, PR ChinaFull list of author information is available at the end of the article
Liang et al. Particle and Fibre Toxicology (2021) 18:20 https://doi.org/10.1186/s12989-021-00414-1
Conclusions: There is a combined toxicity of PS50 and PS500 in the mouse intestines, which was caused primarily byROS-mediated epithelial cell apoptosis in the mice. Considering that most recent studies on PS micro- and nanoplasticshave been conducted using a single particle size, the health risks of exposure to PS micro- and nanoplastics onorganisms may be underestimated.
Keywords: Microplastic, Nanoplastic, Mixture, Intestinal barrier, Health risk, Combined effect
BackgroundPlastic pollution has become a global problem, in bothland and marine environments [1]. Waste plastics arecontinuously degraded by various physicochemical pro-cesses, generating so-called microplastics (size < 5 mm)and nanoplastics (size < 100 nm), based upon the diam-eter of the plastic particles [2]. Due to the small plasticparticle size, micro- and nanoplastics are easily ingestedby organisms and enter their bodies where they affectbiological health [3, 4]. Recent data have revealed thatmicro- and nanoplastics are found in aquatic foods, tapwater, beer, sea salt and packaged beverages [5–8].These compounds have also been detected in humanstool [9]. Given that multiple toxicities of micro- andnanoplastics have been found in both aquatic and terres-trial organisms, all humans have a degree of exposure tomicro- and nanoplastics [10–14].Particle size is one of the most important factors in de-
termining the extent and pathway of particle biodistribu-tion [15, 16], affecting the particle’s toxicities in vivo [17,18]. The upper limit for microplastic particles to translo-cate across the human gut is about 150 μm [19]. However,particles > 1.5 μm rarely penetrate into the organs, andthus are unlikely to cause any organ damage [15]. The ab-sorption of micro- and nanoplastics increases in organ-isms as particle size decreases [20–23]. Despite what isknown, more research is needed on the adverse effects ofmicroplastics and nanoplastics on human health.Waste plastic particles occur in an array of sizes,
shapes and materials [8, 24–26]. However, nanoplasticsin the environment are still hard to detect because ofanalysis technology limitations [27]. It is estimated thatthe particle count will scale inversely with the particleradius to the power of 3 [28]. Additionally, it is believedthat when microplastics are found in the environment,more undetected nanoplastics are around as well [29].The current “microplastic exposure” is in fact the mix-ture of micro- and nanoplastic exposure [30, 31]. Anin vitro study has reported that a mixture of differentsizes of nanoparticles affected their cellular uptake effi-ciency [32]. This promotes the hypothesis that there isalso interplay between the sizes of micro- and nanoplas-tics. This affects their biodistribution and toxicitiesin vitro and in vivo. However, most studies on micro-and nanoplastics have used a single size of plastic parti-cles in the exposure group so far [33]. The biological
interaction between different sizes of micro- and nano-plastics on organisms may be neglected [34]. This givesrise to the need for additional, foundational studies tounderstand the underlying mechanisms of interaction.In the present study, we explored the interplay be-
tween polystyrene (PS) micro- and nanoplastic size, andhow it influences their biodistribution and toxicity. Wemeasured the biodistribution of three PS particles (50nm PS, PS50; 500 nm PS, PS500; 5000 nm PS, PS5000)under single and co-exposure conditions in mice. Weexplored the underlying mechanisms by investigating theeffects on three major components of the intestinal bar-rier (the mucus layer, tight junctions and epithelial cells)in four mouse intestine segments (duodenum, jejunum,ileum and colon). To confirm the combined toxicity ofPS micro- and nanoplastics in the intestine, we also con-ducted a 28-day repeated dose oral toxicity study in miceusing a range of doses (2.5–500 mg/kg body weight).
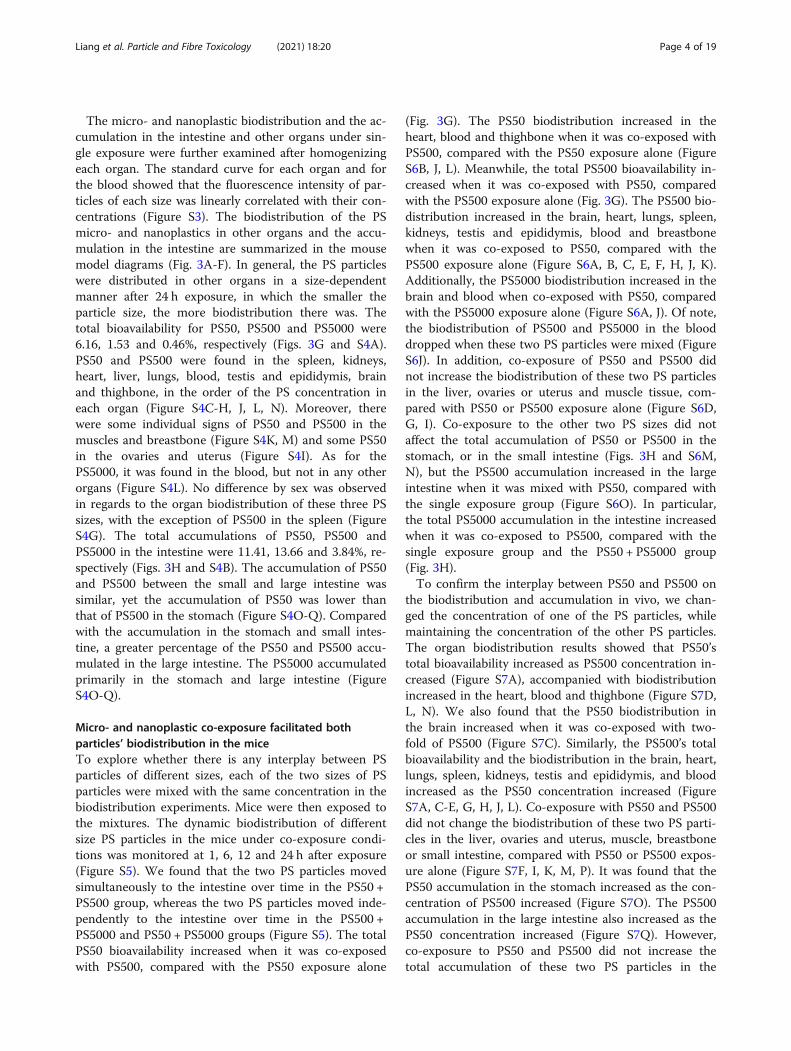
ResultsMicro- and nanoplastic characteristicsWe have presented the present study’s strategy with aflow chart diagram (Fig. 1). Scanning electron micro-scope (SEM) results showed that all non-fluorescence(NF) PS particles were spherical. The mixture of twoparticle sizes did not change the particle morphology inwater (Fig. 2). SEM images showed that the average sizeswere 50.7, 503.6, and 5047.0 nm for the PS50, PS500,and PS5000, respectively. The characteristics of PS50,PS500 and a mixture of PS50 and PS500 in double dis-tilled water, as well as simulated gastric and intestinalfluids were measured by Zetasizer Nano ZS. This in-cluded hydrodynamic size, polymer dispersity index(PDI), and zeta potential. We found that both PS50 andPS500 had narrow size distributions and good stabilitiesin double distilled water. The high zeta potential indi-cated that the mixture of PS50 and PS500 was monodis-perse in double distilled water. PS50 and PS500 wereaggregated in simulated gastric and intestinal fluids,manifesting as hydrodynamic sizes. PDI increased andzeta potentials decreased. The physical characteristics ofred fluorescence (RF) and green fluorescence (GF) parti-cles are similar to those of NF particles (Table S1). Wealso confirmed that the fluorescence leakage from eachparticle type was negligible under the experimental con-ditions (Figure S1).
Liang et al. Particle and Fibre Toxicology (2021) 18:20 Page 2 of 19
PS micro- and nanoplastics were distributed in a size-dependent manner in the miceThe dynamic biodistribution of different sized PS parti-cles in the mice under single exposure was monitored at1, 6, 12 and 24 h after exposure by the in vivo
fluorescence imaging system (Figure S2). We found thatthe fluorescent PS particles moved over time and accu-mulated in the intestine during 24 h exposure. However,the in vivo fluorescence imaging system detected noother fluorescent signals in any other organs.
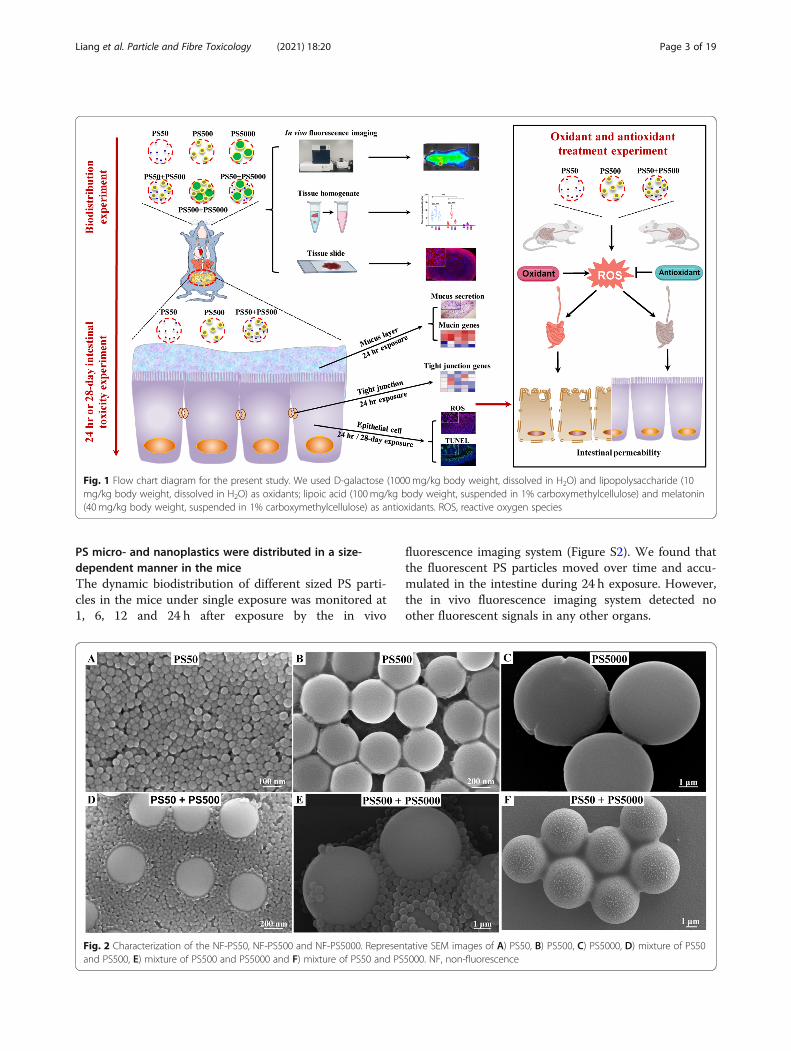
Fig. 1 Flow chart diagram for the present study. We used D-galactose (1000mg/kg body weight, dissolved in H2O) and lipopolysaccharide (10mg/kg body weight, dissolved in H2O) as oxidants; lipoic acid (100mg/kg body weight, suspended in 1% carboxymethylcellulose) and melatonin(40 mg/kg body weight, suspended in 1% carboxymethylcellulose) as antioxidants. ROS, reactive oxygen species
Fig. 2 Characterization of the NF-PS50, NF-PS500 and NF-PS5000. Representative SEM images of A) PS50, B) PS500, C) PS5000, D) mixture of PS50and PS500, E) mixture of PS500 and PS5000 and F) mixture of PS50 and PS5000. NF, non-fluorescence
Liang et al. Particle and Fibre Toxicology (2021) 18:20 Page 3 of 19
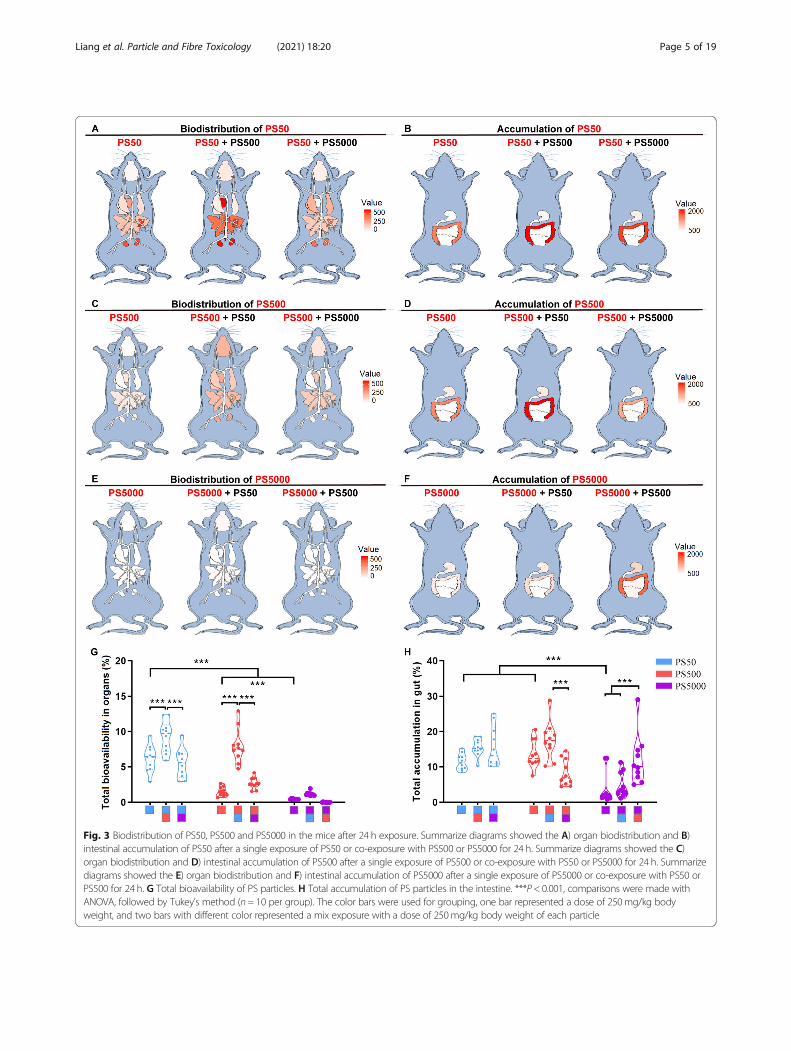
The micro- and nanoplastic biodistribution and the ac-cumulation in the intestine and other organs under sin-gle exposure were further examined after homogenizingeach organ. The standard curve for each organ and forthe blood showed that the fluorescence intensity of par-ticles of each size was linearly correlated with their con-centrations (Figure S3). The biodistribution of the PSmicro- and nanoplastics in other organs and the accu-mulation in the intestine are summarized in the mousemodel diagrams (Fig. 3A-F). In general, the PS particleswere distributed in other organs in a size-dependentmanner after 24 h exposure, in which the smaller theparticle size, the more biodistribution there was. Thetotal bioavailability for PS50, PS500 and PS5000 were6.16, 1.53 and 0.46%, respectively (Figs. 3G and S4A).PS50 and PS500 were found in the spleen, kidneys,heart, liver, lungs, blood, testis and epididymis, brainand thighbone, in the order of the PS concentration ineach organ (Figure S4C-H, J, L, N). Moreover, therewere some individual signs of PS50 and PS500 in themuscles and breastbone (Figure S4K, M) and some PS50in the ovaries and uterus (Figure S4I). As for thePS5000, it was found in the blood, but not in any otherorgans (Figure S4L). No difference by sex was observedin regards to the organ biodistribution of these three PSsizes, with the exception of PS500 in the spleen (FigureS4G). The total accumulations of PS50, PS500 andPS5000 in the intestine were 11.41, 13.66 and 3.84%, re-spectively (Figs. 3H and S4B). The accumulation of PS50and PS500 between the small and large intestine wassimilar, yet the accumulation of PS50 was lower thanthat of PS500 in the stomach (Figure S4O-Q). Comparedwith the accumulation in the stomach and small intes-tine, a greater percentage of the PS50 and PS500 accu-mulated in the large intestine. The PS5000 accumulatedprimarily in the stomach and large intestine (FigureS4O-Q).
Micro- and nanoplastic co-exposure facilitated bothparticles’ biodistribution in the miceTo explore whether there is any interplay between PSparticles of different sizes, each of the two sizes of PSparticles were mixed with the same concentration in thebiodistribution experiments. Mice were then exposed tothe mixtures. The dynamic biodistribution of differentsize PS particles in the mice under co-exposure condi-tions was monitored at 1, 6, 12 and 24 h after exposure(Figure S5). We found that the two PS particles movedsimultaneously to the intestine over time in the PS50 +PS500 group, whereas the two PS particles moved inde-pendently to the intestine over time in the PS500 +PS5000 and PS50 + PS5000 groups (Figure S5). The totalPS50 bioavailability increased when it was co-exposedwith PS500, compared with the PS50 exposure alone
(Fig. 3G). The PS50 biodistribution increased in theheart, blood and thighbone when it was co-exposed withPS500, compared with the PS50 exposure alone (FigureS6B, J, L). Meanwhile, the total PS500 bioavailability in-creased when it was co-exposed with PS50, comparedwith the PS500 exposure alone (Fig. 3G). The PS500 bio-distribution increased in the brain, heart, lungs, spleen,kidneys, testis and epididymis, blood and breastbonewhen it was co-exposed to PS50, compared with thePS500 exposure alone (Figure S6A, B, C, E, F, H, J, K).Additionally, the PS5000 biodistribution increased in thebrain and blood when co-exposed with PS50, comparedwith the PS5000 exposure alone (Figure S6A, J). Of note,the biodistribution of PS500 and PS5000 in the blooddropped when these two PS particles were mixed (FigureS6J). In addition, co-exposure of PS50 and PS500 didnot increase the biodistribution of these two PS particlesin the liver, ovaries or uterus and muscle tissue, com-pared with PS50 or PS500 exposure alone (Figure S6D,G, I). Co-exposure to the other two PS sizes did notaffect the total accumulation of PS50 or PS500 in thestomach, or in the small intestine (Figs. 3H and S6M,N), but the PS500 accumulation increased in the largeintestine when it was mixed with PS50, compared withthe single exposure group (Figure S6O). In particular,the total PS5000 accumulation in the intestine increasedwhen it was co-exposed to PS500, compared with thesingle exposure group and the PS50 + PS5000 group(Fig. 3H).To confirm the interplay between PS50 and PS500 on
the biodistribution and accumulation in vivo, we chan-ged the concentration of one of the PS particles, whilemaintaining the concentration of the other PS particles.The organ biodistribution results showed that PS50’stotal bioavailability increased as PS500 concentration in-creased (Figure S7A), accompanied with biodistributionincreased in the heart, blood and thighbone (Figure S7D,L, N). We also found that the PS50 biodistribution inthe brain increased when it was co-exposed with two-fold of PS500 (Figure S7C). Similarly, the PS500’s totalbioavailability and the biodistribution in the brain, heart,lungs, spleen, kidneys, testis and epididymis, and bloodincreased as the PS50 concentration increased (FigureS7A, C-E, G, H, J, L). Co-exposure with PS50 and PS500did not change the biodistribution of these two PS parti-cles in the liver, ovaries and uterus, muscle, breastboneor small intestine, compared with PS50 or PS500 expos-ure alone (Figure S7F, I, K, M, P). It was found that thePS50 accumulation in the stomach increased as the con-centration of PS500 increased (Figure S7O). The PS500accumulation in the large intestine also increased as thePS50 concentration increased (Figure S7Q). However,co-exposure to PS50 and PS500 did not increase thetotal accumulation of these two PS particles in the
Liang et al. Particle and Fibre Toxicology (2021) 18:20 Page 4 of 19
Fig. 3 Biodistribution of PS50, PS500 and PS5000 in the mice after 24 h exposure. Summarize diagrams showed the A) organ biodistribution and B)intestinal accumulation of PS50 after a single exposure of PS50 or co-exposure with PS500 or PS5000 for 24 h. Summarize diagrams showed the C)organ biodistribution and D) intestinal accumulation of PS500 after a single exposure of PS500 or co-exposure with PS50 or PS5000 for 24 h. Summarizediagrams showed the E) organ biodistribution and F) intestinal accumulation of PS5000 after a single exposure of PS5000 or co-exposure with PS50 orPS500 for 24 h. G Total bioavailability of PS particles. H Total accumulation of PS particles in the intestine. ***P < 0.001, comparisons were made withANOVA, followed by Tukey’s method (n= 10 per group). The color bars were used for grouping, one bar represented a dose of 250mg/kg bodyweight, and two bars with different color represented a mix exposure with a dose of 250mg/kg body weight of each particle
Liang et al. Particle and Fibre Toxicology (2021) 18:20 Page 5 of 19
intestine, compared with PS50 or PS500 exposure alone(Figure S7B).
Histopathology confirmed the biodistribution of PSmicro- and nanoplastics in the organs of miceThe biodistribution of PS micro- and nanoplastics ineach mouse organ was confirmed by fluorescencehistopathology. The results showed that these threesizes of PS particles were found in the brain, heart,liver, lungs, spleen, kidneys, testis and epididymis
(Figs. 4 and S8). The biodistribution of PS50 andPS500 in all of the organs was exceeded by that ofPS5000 (Figs. 4 and S8). The PS particles were micro-scopically observed in the brain, heart, liver, kidneysand testis (Figs. 4A-D and S8C), and they were alsofound in the blood vessels of the lungs and spleen(Figure S8A, B). The PS particles were predominantlyfound in the lumen of the epididymis (Fig. 4E). Thebiodistribution of PS50 and PS500 increased in themouse organs when these two PS particles were co-
Fig. 4 Histopathology confirmed the biodistribution of PS micro- and nanoplastics in the organs. Representative merged fluorescence imagesshowed the biodistribution of PS50, PS500, PS5000 and their mixtures in A) brain, B) heart, C) liver, D) kidney and E) epididymis after 24 hexposure (n = 5 per group). The font color represented the fluorescent color of the particle. The nucleus was stained with DAPI in blue
Liang et al. Particle and Fibre Toxicology (2021) 18:20 Page 6 of 19
exposed (Figs. 4 and S8). Of note, PS50 and PS500were more distributed in the organs than PS5000,when co-exposed with PS5000 (Figs. 4 and S8).
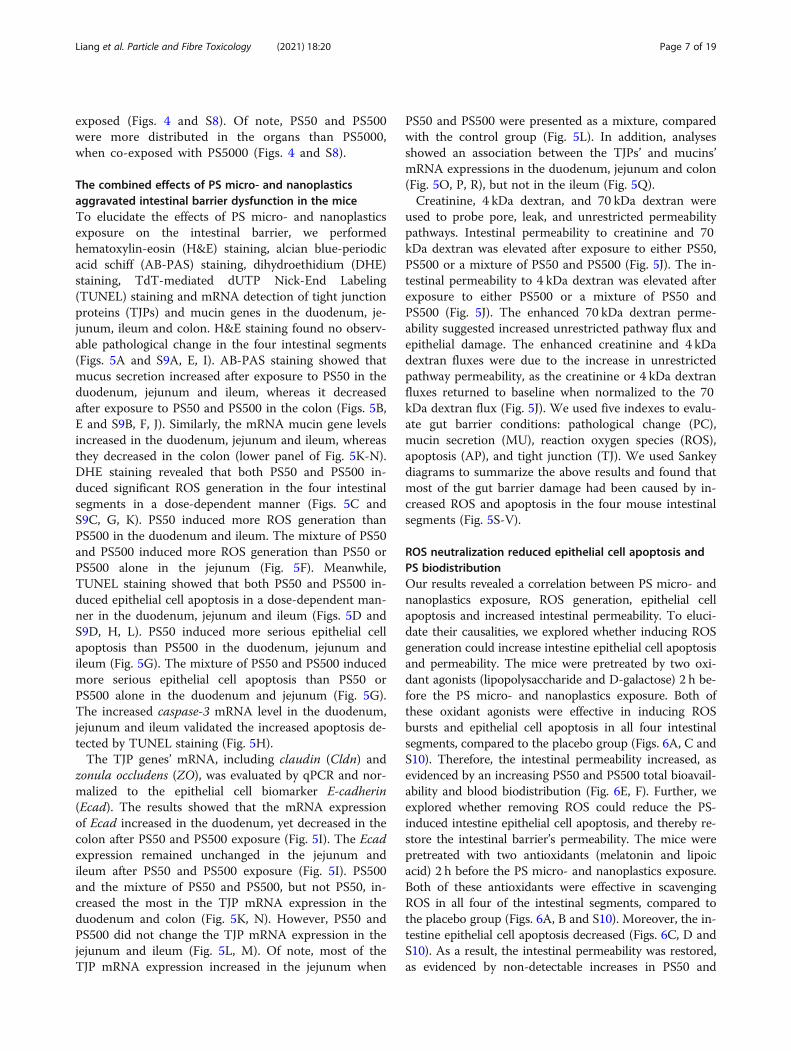
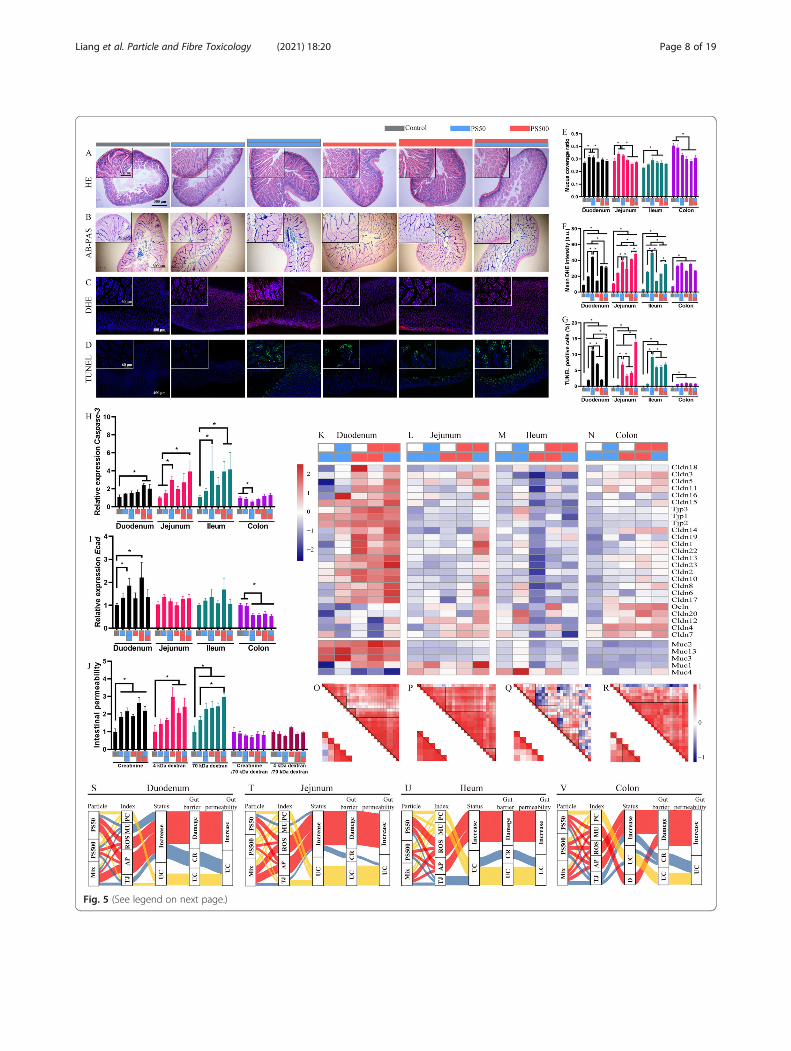
The combined effects of PS micro- and nanoplasticsaggravated intestinal barrier dysfunction in the miceTo elucidate the effects of PS micro- and nanoplasticsexposure on the intestinal barrier, we performedhematoxylin-eosin (H&E) staining, alcian blue-periodicacid schiff (AB-PAS) staining, dihydroethidium (DHE)staining, TdT-mediated dUTP Nick-End Labeling(TUNEL) staining and mRNA detection of tight junctionproteins (TJPs) and mucin genes in the duodenum, je-junum, ileum and colon. H&E staining found no observ-able pathological change in the four intestinal segments(Figs. 5A and S9A, E, I). AB-PAS staining showed thatmucus secretion increased after exposure to PS50 in theduodenum, jejunum and ileum, whereas it decreasedafter exposure to PS50 and PS500 in the colon (Figs. 5B,E and S9B, F, J). Similarly, the mRNA mucin gene levelsincreased in the duodenum, jejunum and ileum, whereasthey decreased in the colon (lower panel of Fig. 5K-N).DHE staining revealed that both PS50 and PS500 in-duced significant ROS generation in the four intestinalsegments in a dose-dependent manner (Figs. 5C andS9C, G, K). PS50 induced more ROS generation thanPS500 in the duodenum and ileum. The mixture of PS50and PS500 induced more ROS generation than PS50 orPS500 alone in the jejunum (Fig. 5F). Meanwhile,TUNEL staining showed that both PS50 and PS500 in-duced epithelial cell apoptosis in a dose-dependent man-ner in the duodenum, jejunum and ileum (Figs. 5D andS9D, H, L). PS50 induced more serious epithelial cellapoptosis than PS500 in the duodenum, jejunum andileum (Fig. 5G). The mixture of PS50 and PS500 inducedmore serious epithelial cell apoptosis than PS50 orPS500 alone in the duodenum and jejunum (Fig. 5G).The increased caspase-3 mRNA level in the duodenum,jejunum and ileum validated the increased apoptosis de-tected by TUNEL staining (Fig. 5H).The TJP genes’ mRNA, including claudin (Cldn) and
zonula occludens (ZO), was evaluated by qPCR and nor-malized to the epithelial cell biomarker E-cadherin(Ecad). The results showed that the mRNA expressionof Ecad increased in the duodenum, yet decreased in thecolon after PS50 and PS500 exposure (Fig. 5I). The Ecadexpression remained unchanged in the jejunum andileum after PS50 and PS500 exposure (Fig. 5I). PS500and the mixture of PS50 and PS500, but not PS50, in-creased the most in the TJP mRNA expression in theduodenum and colon (Fig. 5K, N). However, PS50 andPS500 did not change the TJP mRNA expression in thejejunum and ileum (Fig. 5L, M). Of note, most of theTJP mRNA expression increased in the jejunum when
PS50 and PS500 were presented as a mixture, comparedwith the control group (Fig. 5L). In addition, analysesshowed an association between the TJPs’ and mucins’mRNA expressions in the duodenum, jejunum and colon(Fig. 5O, P, R), but not in the ileum (Fig. 5Q).Creatinine, 4 kDa dextran, and 70 kDa dextran were
used to probe pore, leak, and unrestricted permeabilitypathways. Intestinal permeability to creatinine and 70kDa dextran was elevated after exposure to either PS50,PS500 or a mixture of PS50 and PS500 (Fig. 5J). The in-testinal permeability to 4 kDa dextran was elevated afterexposure to either PS500 or a mixture of PS50 andPS500 (Fig. 5J). The enhanced 70 kDa dextran perme-ability suggested increased unrestricted pathway flux andepithelial damage. The enhanced creatinine and 4 kDadextran fluxes were due to the increase in unrestrictedpathway permeability, as the creatinine or 4 kDa dextranfluxes returned to baseline when normalized to the 70kDa dextran flux (Fig. 5J). We used five indexes to evalu-ate gut barrier conditions: pathological change (PC),mucin secretion (MU), reaction oxygen species (ROS),apoptosis (AP), and tight junction (TJ). We used Sankeydiagrams to summarize the above results and found thatmost of the gut barrier damage had been caused by in-creased ROS and apoptosis in the four mouse intestinalsegments (Fig. 5S-V).
ROS neutralization reduced epithelial cell apoptosis andPS biodistributionOur results revealed a correlation between PS micro- andnanoplastics exposure, ROS generation, epithelial cellapoptosis and increased intestinal permeability. To eluci-date their causalities, we explored whether inducing ROSgeneration could increase intestine epithelial cell apoptosisand permeability. The mice were pretreated by two oxi-dant agonists (lipopolysaccharide and D-galactose) 2 h be-fore the PS micro- and nanoplastics exposure. Both ofthese oxidant agonists were effective in inducing ROSbursts and epithelial cell apoptosis in all four intestinalsegments, compared to the placebo group (Figs. 6A, C andS10). Therefore, the intestinal permeability increased, asevidenced by an increasing PS50 and PS500 total bioavail-ability and blood biodistribution (Fig. 6E, F). Further, weexplored whether removing ROS could reduce the PS-induced intestine epithelial cell apoptosis, and thereby re-store the intestinal barrier’s permeability. The mice werepretreated with two antioxidants (melatonin and lipoicacid) 2 h before the PS micro- and nanoplastics exposure.Both of these antioxidants were effective in scavengingROS in all four of the intestinal segments, compared tothe placebo group (Figs. 6A, B and S10). Moreover, the in-testine epithelial cell apoptosis decreased (Figs. 6C, D andS10). As a result, the intestinal permeability was restored,as evidenced by non-detectable increases in PS50 and
Liang et al. Particle and Fibre Toxicology (2021) 18:20 Page 7 of 19
Fig. 5 (See legend on next page.)
Liang et al. Particle and Fibre Toxicology (2021) 18:20 Page 8 of 19
PS500 total bioavailability and blood biodistribution, com-pared to the placebo group and oxidant agonist groups(Fig. 6E, F). The detailed PS50 and PS500 biodistributionin the brain, heart, lungs, liver, spleen, kidneys, testis andepididymis, stomach, and small and large intestines afteroxidant and antioxidant treatment is shown in Figure S11.
28-day repeated dose oral exposure to PS micro- andnanoplastics has combined effects in miceTo confirm the combined effects of PS micro- and nano-plastics in the intestine, and to explore a lowest PS dosefor observed adverse effects in a longer PS micro- andnanoplastics exposure period, a 28-day repeated doseoral toxicity study in mice was conducted using a rangeof doses. Both PS50 and PS500 induced ROS generation(Figs. 7A-E and S12A, C, E), epithelial cell apoptosis(Figs. 7F-J and S12B, D, F) and increased intestinal per-meability (Fig. 7K-O) in the four intestinal segments.We found the combined effects of PS micro- and nano-plastics in the 50 mg/kg body weight and 500 mg/kgbody weight concentrations in the duodenum and je-junum. This was characterized as the mixture of PS50and PS500 causing more ROS than that would havebeen caused by PS50 or PS500 alone (Fig. 7B-E). Ofnote, significant ROS generation was found at concen-trations as low as 2.5 mg/kg body weight in the four in-testinal segments (Fig. 7B-E). Increased epithelial cellapoptosis was found at the concentration of 50 mg/kgbody weight in the 4 intestinal segments (Fig. 7G-J).However, we found no significant pathological changesin the four mouse intestinal segments (Figure S13). Par-allel to the epithelial cell apoptosis, intestinal permeabil-ity to creatinine was elevated after exposure to PS500 ormixing PS50 and PS500 at a concentration of 50 mg/kgbody weight (Fig. 7K). The intestinal permeability to 4kDa dextran and 70 kDa dextran was elevated after ex-posure to PS50, PS500 or the mixture of PS50 andPS500 at the concentrations over 50 mg/kg body weight(Fig. 7L, M). The permeability to 70 kDa dextran in-creased after exposure to the mixture of PS50 and PS500at the concentration of 50 mg/kg body weight, compared
to exposure to PS50 or PS500 alone (Fig. 7M). The in-creased creatinine and 4 kDa dextran flux were due tothe enhanced unrestricted pathway permeability, as nei-ther the creatinine nor the 4 kDa dextran flux exceededthat of the control group, when normalized to 70 kDadextran flux (Fig. 7N, O).
DiscussionThe present study has investigated the interplay betweenPS micro- and nanoplastics that may affect their biodis-tribution and toxicities in mouse models. Under singleor co-exposure conditions, we provided an overall per-spective on the biodistribution of three PS sizes in mice.The PS sizes covered micro- to nano-scale. We foundthat an unexpected combined effect between PS50 andPS500 facilitates the biodistribution of both particles inmice. We confirmed that this was most likely due to theincreased intestinal permeability caused by ROS-mediated epithelial cell apoptosis (Fig. 8). Given thatmost PS particles in environments appear as mixtures ofsizes, and that the toxic effects related to PS particleshave mostly been studied in single exposure conditions,the health risk of PS micro- and nanoplastics exposurein humans could be underestimated.Many factors affect particle absorption, such as par-
ticle size [22, 35], material [36], surface charge [22] andhydrophilicity [17]. Particle size is one of the most ef-fective factors affecting the biodistribution of the PS mi-cro- and nanoplastics [22, 35]. We set the co-exposuredose in our biodistribution experiment at 500 mg/kgbody weight, i.e., 250 mg/kg body weight for each twoparticle types. We selected such a high dose to increasethe PS micro- and nanoplastic detectability in the or-gans, given the low expectations of bioavailability in themice. The estimated oral bioavailability of PS50, PS500and PS5000 that we report (i.e. 6.16%, 1.53 and 0.46%,respectively) suggested that the smaller the particles, thegreater the proportion of PS particles that enter thebody. This indicates a ubiquitous size dependency in re-gard to PS bioavailability in organisms, as similar effectshave also been reported in zebrafish [20], early juvenile
(See figure on previous page.)Fig. 5 Mixture of PS micro- and nanoplastics aggravated dysfunction of intestinal barrier in mice. Representative merged images of the jejunum sections A)stained with H&E to assess the pathological changes; B stained with AB-PAS to assess the change of mucin secretion, the mucin was stained in blue; C stainedwith DHE to assess the ROS generation, the ROS was stained in red and the nucleus was stained with DAPI in blue; D stained with TUNEL to assess cellapoptosis, the apoptosis cells were stained in green and the nucleus was stained with DAPI in blue. The quantification of E) mucus coverage ratio, F) meanDHE intensity and G) TUNEL positive cell rate in the four intestinal segments. The mRNA expression of H) Casepase-3 and I) Ecad in the four intestinal segmentswere shown. J The fluxes of creatinine, 4 kDa dextran, 70 kDa dextran in the intestine were quantified. The mRNA expressions of TJPs and mucins genes wereshown in the K) duodenum, L) jejunum,M) ileum and N) colon. The correlation of TJPs genes expression and mucins genes expression in the O) duodenum,P) jejunum, Q) ileum and R) colon. Sankey diagrams summarized multiple effects of PS particles in the S) duodenum, T) jejunum, U) ileum and V) colon. *P<0.05. Results are shown as means ± SE. Comparisons were made with ANOVA, followed by Tukey’s method (n=5 per group). The color bars were used forgrouping, one bar represented a dose of 250mg/kg body weight, two bars with same color represented a dose of 500mg/kg body weight, and two bars withdifferent colors represented the mix exposure group with a dose of 250mg/kg body weight of each particle. PC, pathological change; MU, mucin secretion; AP,apoptosis; TJ, tight junction; UC, unchanged; CR, compensatory response
Liang et al. Particle and Fibre Toxicology (2021) 18:20 Page 9 of 19
Fig. 6 (See legend on next page.)
Liang et al. Particle and Fibre Toxicology (2021) 18:20 Page 10 of 19
fish [21], in vitro intestinal cell models [22], and rats[23]. However, conflicting findings have also been re-ported. The highest uptake into Caco-2 cells has beenfound in 4 μm microplastics, comparing to 1 μm and10 μm microplastics alone [18]. This indicates that therelationship between micro- and nanoplastics’ particleuptake and particle size remains in question and war-rants further investigation.En route to absorption through the intestine, the PS
particles encounter a series of barriers, including themucus layer, the tight junctions blocking paracellularpassage, and the epithelial cells of the intestine [37]. Thegel-like mucus layer is the first physical barrier to ab-sorption in the intestine [38]. It has been reported thatPS5000 decreases mucus secretion in the colon [13].Similar to this finding, our results showed that exposureto PS50 and PS500 decreases mucus secretion in thecolon. However, we found that PS50 exposure stimulatesmucus secretion in the duodenum, jejunum and ileum.This stimulatory effect has also been found with othernanoparticles, e.g., silver nanoparticles, where it in-creases the amount of intestinal mucin by stimulatinggoblet cells [39]. There is a positive correlation betweenmucus secretion and mucin gene expression [40]. Theopposite effects of the small and large intestines maydue to the difference in mucin gene expression and re-sponses to the PS particles. Because the small intestineperforms more important functions in absorption, itcould also have been that exposure to PS50 and PS500caused protective compensatory responses in the intes-tinal mucus layer under our experimental conditions.The paracellular flux is restricted by the tight junctions
which are sealed between adjacent epithelial cells [41].There are two pathways through an intact epithelialmonolayer, termed the “pore” and “leak” pathways,which are regulated by TJPs [41]. The intestinal perme-ability increases when the tight junctions break [42].However, our findings revealed that the TJP gene ex-pression did not decrease; some even increased after PSmicro- and nanoplastics exposure. Increased TJP mRNAexpression is commonly found to act as a protectivemechanism when the intestine faces xenobiotics [43, 44].The increased CLDN1 and CLDN4 expression tightened
the junctions after narenginin exposure in Caco-2 cells[43]. Increased intestinal epithelial CLDN2 expression fa-cilitates pathogen clearance [44]. More importantly, themicro- and nanoplastics could not cross the intestinalbarrier efficiently via the above-mentioned two pathwayssince the diameters were as wide as ~ 0.6 nm and ~ 6nm, respectively [45]. When the tight junctions or epi-thelial cells were damaged, a high capacity and permis-sive pathway termed “unrestricted” pathway formed [41,44]. This allowed large subjects like large protein andbacteria to shoot across the intestine [41]. As expected,we found increased 70 kDa dextran flux and epithelialcell apoptosis in the small intestine in a dose-dependentmanner after PS50 and PS500 exposure. PS50 inducedmore severe apoptosis in the epithelial cells than didPS500. Additionally, PS-induced cell dysfunctions werein line with other previous in vivo and in vitro studies ina size-dependent manner [10, 46]. Parallel to the epithe-lial cell apoptosis, we found increased ROS generation inthe small intestine. ROS generation is a common causeof nanoparticle-induced cell apoptosis [47]. ROS gener-ation caused by PS micro- and nanoplastics has been re-ported in multiple organisms, such as zebrafish [10], rats[48] and mice [49], and ROS clearance alleviates the mu-cosal injury and damage in the intestine [50]. Via twoproven effective antioxidants—lipoic acid and melatonin[51], the causality between PS micro- and nanoplasticsexposure, ROS generation, epithelial cell apoptosis, andincreased intestinal permeability has been confirmed inthis study by clearing ROS during PS micro- and nano-plastic exposure. By using PS as one of the most abun-dant and typical micro- and nanoplastics [52, 53], ourresults draw an overall perspective that micro- andnanoplastics may induce oxidative stress in the small in-testine, resulting in epithelial cell apoptosis and loss ofthe intestinal barrier. This led to increased intestinalpermeability and micro- and nanoplastics absorption.The absorption of both PS50 and PS500 was enhanced
in the mice when PS50 was mixed with PS500, indicat-ing that PS50 and PS500 have combined effects. This ispossibly due to enhancing toxicity on the small intestineby inducing more ROS generation than PS50 or PS500exposure alone when these two PS particles were mixed.
(See figure on previous page.)Fig. 6 ROS neutralization reduced epithelial cell apoptosis and PS particles biodistribution in the intestine. A Representative merged images ofthe jejunum sections stained with DHE to assess the ROS generation after oxidant or antioxidant treatment. The ROS was stained in red and thenucleus was stained with DAPI in blue. B The quantification of mean DHE intensity in the four intestinal segments was shown. C Representativemerged images of the jejunum sections stained with TUNEL to assess the cell apoptosis after oxidant or antioxidant treatment. The apoptosiscells were stained in green and the nucleus was stained with DAPI in blue. D The quantification of TUNEL positive cell rate in the four intestinalsegments. E Total bioavailability of PS50 and PS500 after oxidant or antioxidant treatment. F Total accumulation of PS50 and PS500 in theintestine after oxidant or antioxidant treatment. *P < 0.05, **P < 0.01, and ***P < 0.001. Results were shown as means ± SE. Comparisons weremade with ANOVA, followed by Tukey’s method (n = 5 per group). The color bars were used for grouping. The blue and red bar represented adose of 250 mg/kg body weight for PS50 and PS500, respectively, two bars with same color represented a dose of 500 mg/kg body weight, andtwo bars with different colors represented the mix exposure group with a dose of 250 mg/kg body weight of each particle
Liang et al. Particle and Fibre Toxicology (2021) 18:20 Page 11 of 19
Fig. 7 28-day repeated dose oral exposure to PS micro- and nanoplastics confirmed the combined effects. A Representative merged images of the jejunumsections stained with DHE to assess the ROS generation after repeated dose of PS particles exposure for 28 days. The ROS was stained in red and the nucleuswas stained with DAPI in blue. The quantification of mean DHE intensity in B) duodenum, C) jejunum, D) ileum and E) colon was shown. F Representativemerged images of the jejunum sections stained with TUNEL to assess the cell apoptosis after repeated dose of PS particles exposure for 28 days. The apoptoticcells were stained in green and the nucleus was stained with DAPI in blue. The quantification of TUNEL positive cell rate in G) duodenum, H) jejunum, I) ileumand J) colon was shown. The fluxes of K) creatinine, L) 4 kDa dextran,M) 70 kDa dextran in the intestine were quantified. The fluxes of N) creatinine and O) 4kDa dextran were normalized to 70 kDa dextran flux. *P< 0.05. Results were shown as means ± SE. Comparisons were made with ANOVA, followed by Tukey’smethod (n=5 per group). The color bars were used for grouping. The exposure dose was shown by the color bars
Liang et al. Particle and Fibre Toxicology (2021) 18:20 Page 12 of 19
The underlying mechanisms of the combined effects areunclear. However, an in vitro study has reported that thebigger nanoparticles promote the cellular uptake of thesmaller nanoparticles with a total uptake increase of par-ticles in the cells [32]. Additionally, some physicochemi-cal properties could have changed when micro-particlesmixed with nanoparticles [29, 34, 54, 55], which mayalso have affected their toxicities. The increased uptakeof the “more-toxic” PS50 and the total particle countmay be the cause of the enhanced toxicity in the mixtureof PS50 and PS500.The estimated daily intake (EDI) of microplastics with
diameters between 0.5–10 μm for adults is 40.1 μg/kgbody weight/day [56]. A much higher estimate proposes 5g microplastics with diameters below 1mm per week forhuman ingestion [57]. That is approximately 10mg/kgbody weight/day by taking 70 kg as the body weight of anadult into account. Furthermore, it is likely that the par-ticle counts will be much higher if we account for thenanoplastics [28]. These nanoplastics have often been ig-nored due to the limitations of detection methods [58].We conducted a 28-day repeated dose oral toxicity studyon PS micro- and nanoplastics with a range of concentra-tions from 2.5 mg/kg body weight to 500mg/kg body
weight. We set the high dose of 500mg/kg body weight toidentify hazards and the low dose of 2.5 mg/kg bodyweight to approach the environmental level. SignificantROS generation was found in PS concentrations as low as2.5 mg/kg body weight. Increased epithelial cell apoptosiswas found in concentrations of PS over 50mg/kg bodyweight. This indicated that PS micro- and nanoplasticscan generate ROS in the intestine at a low concentration,but epithelial cell apoptosis occurs only when a consider-able amount of ROS is produced after high PS micro- andnanoplastics exposure. Considering the combined effectsof PS micro- and nanoplastics on the intestine, and thatmost human PS micro- and nanoplastics intake appears asa mixture of multiple sizes of PS particles [5, 6], the healthrisk of PS particles exposure in humans should not beunderestimated.
ConclusionsPS micro- and nanoplastics exposure causes intestinalbarrier dysfunction by ROS-mediated epithelial cellapoptosis in a size-dependent manner. This affects theabsorption and biodistribution of PS micro- and nano-plastics in body organs. More importantly, we found acombined toxicity of PS micro- and nanoplastics on the
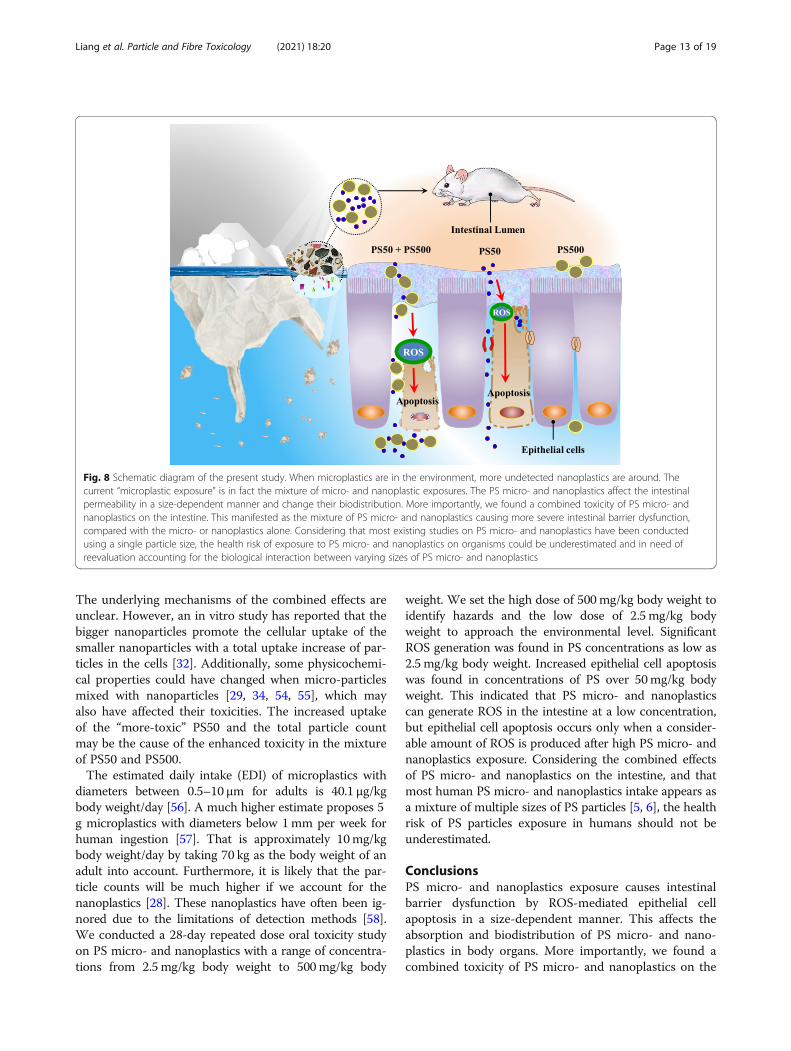
Fig. 8 Schematic diagram of the present study. When microplastics are in the environment, more undetected nanoplastics are around. Thecurrent “microplastic exposure” is in fact the mixture of micro- and nanoplastic exposures. The PS micro- and nanoplastics affect the intestinalpermeability in a size-dependent manner and change their biodistribution. More importantly, we found a combined toxicity of PS micro- andnanoplastics on the intestine. This manifested as the mixture of PS micro- and nanoplastics causing more severe intestinal barrier dysfunction,compared with the micro- or nanoplastics alone. Considering that most existing studies on PS micro- and nanoplastics have been conductedusing a single particle size, the health risk of exposure to PS micro- and nanoplastics on organisms could be underestimated and in need ofreevaluation accounting for the biological interaction between varying sizes of PS micro- and nanoplastics
Liang et al. Particle and Fibre Toxicology (2021) 18:20 Page 13 of 19
intestine. This manifested as the mixture of PS micro-and nanoplastics causing more severe intestinal barrierdysfunction, which therefore changed their biodistribu-tion, compared with PS micro- or nanoplastics alone.Considering that most existing studies on PS micro- andnanoplastics have only examined a single particle size,the health risks associated with exposure to PS micro-and nanoplastics in organisms could be underestimated.
Materials and methodsChemicals and microplasticsChemicals were purchased from Sigma-Aldrich (Tauf-kirchen, Germany), Merck (Darmstadt, Germany), orCarl Roth (Karlsruhe, Germany), unless otherwise indi-cated. The unmodified PS particles, including NF, RFand GF particles were purchased from Magsphere (Pasa-dena, California, USA). All of the PS particle densitieswere 1.05 g/mL provided by the Certificate of Analysis.
Particle characterizationParticle sizes were morphologically characterized bySEM (Zeiss Supra55, Carl Zeiss AG, Germany), follow-ing previously described protocols [22]. The PS suspen-sions’ size distribution and zeta-potential were detectedby a Dynamic Light Scattering with a Zetasizer Nano ZS(Malvern Panalytical GmbH, Kassel, Germany). Each PSparticle type was suspended in distilled water, simulatedgastric or intestinal fluids at a concentration of 0.25 mg/mL. We prepared the simulated gastric and intestinalfluids by following previously described protocols [59].We determined each PS particle type’s in vitro fluores-cence leakage by incubating 1 mL PS suspensions (0.25mg/mL) in distilled water, and simulated gastric or intes-tinal fluids at 37 °C for 1, 6, 12 and 24 h by followingpreviously described protocols [32].
Mouse husbandryA total of 455 C57BL/6 J mice (6-week-old, body weight18–20 g, 400 males, 55 females, specific pathogen free)were used in this study. The mice were provided by theGuangdong Medical Laboratory Animal Center(Guangzhou, China). All animals were housed and accli-mated to the new environment for 7 days in atemperature- (23–25 °C) and humidity- (50–60%) con-trolled room under a 12 h light/dark cycle (lights onfrom 8:00 a.m. to 8:00 p.m.). Food and sterilized waterwere provided ad libitum. The exposure conditions andnumber of mice for each experimental group are listedin Table 1. Mice were randomly divided into each groupbased on their body weights at the beginning of theexperiment.
Biodistribution experimentWe treated the mice with a single oral gavage with eitherdouble distilled water, or with PS micro- and nanoplas-tics in double distilled water, at a volume of 20 mL/kgbody weight after fasting (from both solids and liquids)for 12 h. At the end of 24 h of exposure, we anesthetizedthe mice and collected the blood from the retroorbitalplexus in an ethylene diamine tetraacetic acid anticoagu-lation tube. After perfusion with saline, we terminatedthe animals by cervical dislocation and collected tissuesamples on ice. We cut the small intestines into the duo-denum, jejunum and ileum, and the large intestine intothe cecum and colon. In order to measure the residualof the PS micro- and nanoplastics in the intestine afterexposure, we did not wash the contents of either thesmall or the large intestines. We froze the tissue samplesimmediately in liquid nitrogen, and then stored them at− 80 °C until use.
28-day repeated dose oral toxicity study in miceAfter fasting (from both solids and liquids) for 12 h, wetreated the mice with a single oral gavage, daily, with ei-ther double distilled water, or with PS micro- and nano-plastics in double distilled water at a volume of 20 mL/kg body weight, for 28 consecutive days. Before and dur-ing the exposure period (between 8:00 and 9:00 a.m.every 7 days), we weighed the mice. We adjusted thegavage volumes by the mice’s body weights every 7 days.At the end of exposure, we anesthetized the mice (0.3%pentobarbital sodium, intraperitoneal) and perfusedthem with saline. Then, we terminated the animals bycervical dislocation, and collected the tissue samples onice. We cut the small intestines into the duodenum, je-junum and ileum, and the large intestines into thececum and colon. Next, we washed the intestinal con-tents and cut each section of the intestine into halves.We immediately froze each intestine section in liquid ni-trogen and then stored them at − 80 °C until use. Wefixed the remaining half in 4% paraformaldehyde forpathological examination.
Oxidant and antioxidant treatmentIndividual oxidant and antioxidant compounds were dis-solved in H2O or suspend in 1% sodium carboxymethyl-cellulose (CMC). Mice were treated by a single oralgavage with the oxidants or antioxidants 2 h before ex-posure to microplastics or nanoplastics. The oxidants orantioxidants were used at the following final doses: D-galactose, 1000mg/kg body weight (dissolved in H2O);lipopolysaccharide, 10 mg/kg body weight (dissolved inH2O); lipoic acid, 100 mg/kg body weight (suspended in1% CMC); melatonin, 40 mg/kg body weight (suspendedin 1% CMC).
Liang et al. Particle and Fibre Toxicology (2021) 18:20 Page 14 of 19
RNA isolation and quantitative polymerase chain reactionanalysisFrozen animal tissues were homogenized in Trizol (Invi-trogen, CA, USA), and total RNA was isolated followingthe manufacturer’s recommended protocol. For quanti-tative polymerase chain reaction (qPCR) analysis, the
mRNA cDNA was synthesized using an Evo M-MLVOne Step RT-PCR Kit (Accurate Biotechnology, China)following the manufacturer’s recommended protocols.The primers for mRNA (Table S2) were designed andsynthesized by Tsingke Biological Technology (Beijing,China). qPCR was performed with SYBR® Green Premix
Table 1 The mice experimental design
Experiment GroupNo.
PS50 (mg/kg bodyweight)
PS500 (mg/kg bodyweight)
PS5000 (mg/kg bodyweight)
Male(n)
Female(n)
Biodistribution experimenta) 1 0 0 0 10 5
2 250 (RF) 0 0 10 5
3 250 (RF) 125 (GF) 0 10 5
4 250 (RF) 250 (GF) 0 10 5
5 250 (RF) 500 (GF) 0 10 5
6 0 250 (RF) 0 10 5
7 125 (RF) 250 (GF) 0 10 5
8 500 (RF) 250 (GF) 0 10 5
9 0 0 250 (RF) 10 5
10 250 (RF) 0 250 (GF) 10 5
11 0 250 (RF) 250 (GF) 10 5
Toxicity effects on intestinal barrierexperimentb)
1 0 0 0 10 0
2 250 (NF) 0 0 10 0
3 500 (NF) 0 0 10 0
4 0 250 (NF) 0 10 0
5 0 500 (NF) 0 10 0
6 250 (NF) 250 (NF) 0 10 0
Oxidant and antioxidant treatmentexperimentc)
1 0 0 0 25 0
2 250 (NF) 0 0 15 0
3 500 (NF) 0 0 15 0
4 0 250 (NF) 0 15 0
5 0 500 (NF) 0 15 0
6 250 (NF) 250 (NF) 0 15 0
28-day repeated dose oral toxicitystudyd)
1 0 0 0 10 0
2 2.5 (NF) 0 0 10 0
3 25 (NF) 0 0 10 0
4 50 (NF) 0 0 10 0
5 250 (NF) 0 0 10 0
6 500 (NF) 0 0 10 0
7 0 2.5 (NF) 0 10 0
8 0 25 (NF) 0 10 0
9 0 50 (NF) 0 10 0
10 0 250 (NF) 0 10 0
11 0 500 (NF) 0 10 0
12 25 (NF) 25 (NF) 0 10 0
13 250 (NF) 250 (NF) 0 10 0a) Results in Fig. 3 and 4 and Figures S2, S3, S4, S5, S6, S7, and S8; b) Results in Fig. 5 and Figure S9; c) Results in Fig. 6 and Figures S10 and S11; d) Results in Fig. 7and Figures S12 and S13. NF, non-fluorescence; RF, red fluorescence; GF, green fluorescence
Liang et al. Particle and Fibre Toxicology (2021) 18:20 Page 15 of 19
Pro Taq HS qPCR Kit (Accurate Biotechnology) on theABI QuantStudio™ 6 flex (Applied Biosystems, USA).The qPCR reaction conditions were as follows: 30 s at95 °C, followed by 40 cycles of 5 s at 95 °C and 34 s at60 °C. Primer specificity was confirmed by melting curveanalysis, which showed a single product with the appro-priate Tm for each primer set. All samples were analyzedin quadruplicate. The relative expression of TJP mRNAwas normalized by Ecad and the others were normalizedby β-actin. Gene relative expression was determinedwith the 2-ΔΔCT, compared with the control.
Fluorescence imaging in vivo and ex vivoAt 1, 6, and 12 h post-gavage, mice were euthanized withisoflurane and underwent in vivo fluorescence imagingusing an In-Vivo Multispectral (MS) FX PRO system(Bruker, Billerica, MA, USA) with excitation = 530 nmand emission = 600 nm for RF and excitation = 470 nmand emission = 535 nm for GF. At 24 h post-gavage, themice were anesthetized and terminated. Organs and tis-sues were extracted and underwent ex vivo fluorescenceimaging at the same conditions as above.
Fluorescence detection in organ homogenateFrozen animal tissues were weighted and homoge-nized in a digestive solution consisting of 1 g/L pro-teinase K (Python biotech, China), 5 g/L SDS, 23 g/LNa2HPO4, and 4.6 g/L NaH2PO4 using a FastPrep-24Sample Preparation System (MP Biomedicals, Solon,OH, USA). We used 2.5 mL digestive solution pergram of tissue to digest the tissues. The homogenatewas then digested in water bath at 37 °C for 12 h,resulting in a clear digested tissue solution. Thedigested solution of each tissue in the control groupwas mixed and diluted with double distilled waterbased on need. For intestines, we diluted the digestedsolution 30 times; for other organs, we diluted thedigested solution 5 times. In addition, we diluted theblood with 12 mL double distilled water per gram ofblood. Serial dilutions of each fluorescence particle ineach tissue solution and in the blood were preparedand measured by a fluorescence spectrophotometer(Tecan Spark, Austria) with excitation = 538 nm andemission = 584 nm for RF and excitation = 480 nm andemission = 525 nm for GF. A standard curve for eachfluorescence particle in each tissue and the blood wascalculated in the corresponding organ homogenate ofthe control group animals. The digested solution ofeach tissue, and the blood in the exposure group,were diluted just like the control group, with doubledistilled water, and measured under the same condi-tions. After 24 h exposure, we evaluated the PS mi-cro- and nanoplastic biodistribution by theconcentrations of the PS particles in each organ or
blood. This was calculated as (particle weight) /(organ weight). We evaluated the PS micro- andnanoplastic bioavailability by the fraction (%) of ad-ministered particles that reached the major organs,including the brain, heart, lungs, liver, spleen, kidneys,reproductive organs, muscles, blood, and bone, andexcluding the gastrointestinal tract. It was calculatedas (total amount in the major organs and blood) /(total amount of gavage). We evaluated the PS micro-and nanoplastic accumulation in the intestines after24 h exposure by the fraction (%) of residue particlesremaining in the gastrointestinal tract. It was calcu-lated as (total amount in the gastrointestinal tract) /(total amount of gavage).
Fluorescence particle detection on tissue slidesFrozen animal tissues were postfixed overnight andthe fixative was replaced with a series of 10, 20 and30% sucrose solution (Sigma Aldrich). Then, the tis-sues were embedded in optimal cutting temperaturecompound (Tissue-Tek®, Sakura Finetek Japan Co.,Ltd., Tokyo, Japan). Coronal sections were used forfluorescence detection. Slides were scanned by Pan-noramic MIDI (3D HISTECH, Budapest, Hungary)and images were reviewed with Pannoramic Viewer(3D HISTECH).
ROS detection and TUNEL fluorescence assay on tissueslidesIn situ ROS and apoptosis detection was performedusing DHE assay (Sigma-Aldrich) and TUNEL fluores-cence assay, respectively, following previously describedprotocols with slight modifications [51]. For DHE stain-ing, the intestinal sections were incubated with 20 mMDHE on a shaker at room temperature for 30 min in thedark. Then the slides were washed three times in PBSfor 5 min, using a shaker at room temperature. ForTUNEL staining, a Click-iT® TUNEL Alexa Fluor® 488Imaging Assay (Invitrogen) was used according to themanufacturer’s instructions. Slides were immediately im-aged with identical settings on an OLYMPUS BX53fluorescence microscope (OLYMPUS, Japan) or scannedby Pannoramic MIDI (3D HISTECH). The images wereviewed with Pannoramic Viewer (3D HISTECH).
Histopathological analysisIntestinal segments, including the duodenum, jejunum,ileum and colon, were cut into small pieces and fixedimmediately in 4% (wt/vol) paraformaldehyde solution.The fixed intestinal tissues were then dehydrated in arising series of ethanol, cleared in xylene, and embeddedin paraffin wax at 56 °C. Coronal sections were used forH&E staining, AB-PAS staining and TUNEL staining.Slides were scanned by Pannoramic MIDI (3D HIST
Liang et al. Particle and Fibre Toxicology (2021) 18:20 Page 16 of 19
ECH) and images were reviewed with PannoramicViewer (3D HISTECH).
Image quantificationImage quantification was performed using ImageJ 1.52v(National Institute of Health, Bethesda, MD, USA). Wecalculated the mucus coverage ratio in each group as(pixels in the mucus area) / (total pixels area of each gutsection), as described previously [13]. We calculated theDHE intensity in each group by measuring the fluores-cent signal’s pixel intensity in each gut section, as de-scribed previously [51]. To quantify the cell apoptosisrate, the TUNEL positive cells from each view werecounted and normalized to a 4′,6-diamidino-2-phenylin-dole (DAPI) count. At least 10 views from each slidewere randomly selected and measured for statisticalanalysis.
Intestinal permeability assayMice were administered with 0.2 mL saline containing12mg fluorescein isothiocyanate-4 kDa dextran, 8 mgrhodamine B isothiocyanate-70 kDa dextran, and 20mgcreatinine (Sigma) 3 h prior to the end of 24 h and 28days PS micro- and nanoplastics exposure. Serum washarvested after 24 h of PS micro- and nanoplastics ex-posure. Creatinine was measured using a kit from Nan-jing Jiancheng Bioengineering Institute (Jiangsu, China).Recovery of creatinine and fluorescent probes was mea-sured in a Synergy HT plate reader (BioTek, Winooski,VT, USA) using freshly prepared standards. Fluoresceinand rhodamine B fluorescence were measured using ex-citation wavelengths of 495 nm and 555 nm, and emis-sion wavelengths of 525 nm and 585 nm, respectively.
Statistical analysisData are presented as mean ± standard error of the mean(SE) unless indicated otherwise. All statistical analyseswere performed in SPS PARTICLES 22.0 (IBM, Armonk,NY, USA). Comparisons among multiple exposuregroups, and the corresponding control in each exposureexperiment, were performed using a one-way analysis ofvariance (ANOVA) followed by a Tukey’s method. Aprobability (P) value < 0.05 was considered statisticallysignificant. Statistical graphs were generated in GraphPad Prism 8.0 (GraphPad Software, Inc., San Diego, CA,USA). The mouse model diagrams illustrating the PSorgan biodistribution in the mice were generated usingR [60] and the “gganatogram” package [61]. The sankeydiagrams were generated in OriginPro 2019 (OriginLabCorp., Northampton, MA, USA).
Supplementary InformationThe online version contains supplementary material available at https://doi.org/10.1186/s12989-021-00414-1.
Additional file 1: Figure S1. Fluorescence leakage after incubated inthe gastric and intestine juice. Figure S2. The dynamic biodistributionafter single exposure with PS50, PS500 and PS5000. Figure S3. Thestandard curves of fluorescence intensity of PS particles in each organ orblood. Figure S4. The organ biodistribution after single exposure withPS50, PS500 and PS5000. Figure S5. The dynamic biodistribution afterco-exposure with each two of PS50, PS500 and PS5000. Figure S6. Theorgan biodistribution after co-exposure with each two of PS50, PS500and PS5000. Figure S7. The organ biodistribution after co-exposure withdifferent proportions of PS50 and PS500. Figure S8. Histopathology con-firmed the biodistribution in the lung, spleen and testis of mice. FigureS9. H&E, AB-PAS, DHE, TUNEL staining in the duodenum, ileum and colonafter 24 h exposure. Figure S10. ROS generation and apoptosis in theduodenum, ileum and colon after oxidant or antioxidant treatment. Fig-ure S11. The organ biodistribution of PS micro- and nanoplastics afteroxidant or antioxidant treatment. Figure S12. ROS generation and apop-tosis in the duodenum, ileum and colon after exposure for 28 days. Fig-ure S13. H&E staining of the intestinal segments after exposure for 28days. Table S1. Physical characteristics of PS micro- and nanoplastics.Table S2. Primer sequences for qPCR. Table S3. Body weight of a 28-day repeated dose oral toxicity study of PS micro- and nanoplasticsexposure.
Additional file 2. These values correspond to the heatmaps in Fig. 5.
AcknowledgmentsWe gratefully thank L. Lu, W. Zhong, Z. Bian, Z. Li, K. Zhang, D. Yu, Y. Luo, X.Wang, M. Ye, X. Zhu, and C. Wang (Southern Medical University) for samplingcollection in mice; Y. H. Gao (Guangdong Laboratory Animals MonitoringInstitute) and M. Huang (Guangdong Province Hospital for OccupationalDisease Prevention and Treatment) for pathological observation.
Authors’ contributionsB.L. and Y.Z. designed the study, analyzed the data, and wrote themanuscript; Y.H. and X.L. collected and analyzed the data, and wrote themanuscript; J.L., L.L., M.H., J.J., M.D., B.W., B.Z., H.M., J.L., and H.S. collected andanalyzed the data; X.Y. and Z.H. designed and supervised the study andprovided financial support.
FundingThis work was supported by Guangdong Key R&D Program, Ministry ofScience and Technology of Guangdong Province (2019B020210002), NationalKey R&D Program of China, Ministry of Science and Technology of China(2018YFC1602103, 2018YFC1603101), National Natural Science Foundation ofChina (82073519, 81872601), Natural Science Foundation of GuangdongProvince (2018A030313068), National Training Program of Innovation andEntrepreneurship for Undergraduates (S202012121157, S202012121055,S201912121024), the Guangdong Provincial Key Laboratory of TropicalDisease Research (2017B030314035) and NMPA Key Laboratory for SafetyEvaluation of Cosmetics.
Availability of data and materialsThe datasets supporting the conclusions of this article are included withinthe article and its Additional files 1 and 2.
Liang et al. Particle and Fibre Toxicology (2021) 18:20 Page 17 of 19
Ethics approval and consent to participateThis study has been approved by the Scientific Research Committee ofSouthern Medical University on Ethics in the Care and Use of LaboratoryAnimals (Permit No. L2019146). The mouse studies, were conductedaccording to the Chinese National Institutes of Health guidelines concerningthe protection and control of animals.
Consent for publicationNot applicable.
Competing interestsThe authors declare no competing financial interest.
Author details1Department of Toxicology, Guangdong Provincial Key Laboratory of TropicalDisease Research, School of Public Health, Southern Medical University,1023-1063 Shatai Nan Road, Guangzhou 510515, PR China. 2Faculty ofPreventive Medicine, School of Public Health, Guangdong PharmaceuticalUniversity, Guangzhou 510006, PR China. 3Hunter Biotechnology, Inc.,Hangzhou 310051, PR China. 4Division III of risk assessment, China NationalCenter for Food Safety Risk Assessment, Beijing 100022, PR China. 5FoodSafety and Health Research Center, School of Public Health, SouthernMedical University, 1023-1063 Shatai Nan Road, Guangzhou 510515, PRChina.
Received: 2 January 2021 Accepted: 20 May 2021
References1. Geyer R, Jambeck JR, Law KL. Production, use, and fate of all plastics ever
made. Sci Adv. 2017;3(7):e1700782. https://doi.org/10.1126/sciadv.1700782.2. Galloway TS, Cole M, Lewis C. Interactions of microplastic debris throughout
the marine ecosystem. Nat Ecol Evol. 2017;1(5):116. https://doi.org/10.1038/s41559-017-0116.
3. Wu P, Huang J, Zheng Y, Yang Y, Zhang Y, He F, et al. Environmentaloccurrences, fate, and impacts of microplastics. Ecotoxicol Environ Saf. 2019;184:109612. https://doi.org/10.1016/j.ecoenv.2019.109612.
4. Hirt N, Body-Malapel M. Immunotoxicity and intestinal effects of nano- andmicroplastics: a review of the literature. Part Fibre Toxicol. 2020;17(1):57.https://doi.org/10.1186/s12989-020-00387-7.
5. Toussaint B, Raffael B, Angers-Loustau A, Gilliland D, Kestens V, Petrillo M,et al. Review of micro- and nanoplastic contamination in the food chain.Food Addit Contam Part A Chem Anal Control Expo Risk Assess. 2019;36(5):639–73. https://doi.org/10.1080/19440049.2019.1583381.
6. Koelmans AA, Mohamed Nor NH, Hermsen E, Kooi M, Mintenig SM, DeFrance J. Microplastics in freshwaters and drinking water: critical review andassessment of data quality. Water Res. 2019;155:410–22. https://doi.org/10.1016/j.watres.2019.02.054.
7. Shruti VC, Perez-Guevara F, Elizalde-Martinez I, Kutralam-Muniasamy G. Firststudy of its kind on the microplastic contamination of soft drinks, cold tea andenergy drinks - future research and environmental considerations. Sci TotalEnviron. 2020;726:138580. https://doi.org/10.1016/j.scitotenv.2020.138580.
8. Shruti VC, Perez-Guevara F, Elizalde-Martinez I, Kutralam-Muniasamy G.Toward a unified framework for investigating micro (nano) plastics inpackaged beverages intended for human consumption. Environ Pollut.2021;268(Pt A):115811.
9. Schwabl P, Koppel S, Konigshofer P, Bucsics T, Trauner M, Reiberger T, et al.Detection of various microplastics in human stool: a prospective case series.Ann Intern Med. 2019;171(7):453–7. https://doi.org/10.7326/M19-0618.
10. Gu W, Liu S, Chen L, Liu Y, Gu C, Ren HQ, et al. Single-cell RNA sequencingreveals size-dependent effects of polystyrene microplastics on immune andsecretory cell populations from zebrafish intestines. Environ Sci Technol.2020;54(6):3417–27. https://doi.org/10.1021/acs.est.9b06386.
11. Sussarellu R, Suquet M, Thomas Y, Lambert C, Fabioux C, Pernet MEJ, et al.Oyster reproduction is affected by exposure to polystyrene microplastics. PNatl Acad Sci USA. 2016;113(9):2430–5. https://doi.org/10.1073/pnas.1519019113.
12. Collard F, Gasperi J, Gilbert B, Eppe G, Azimi S, Rocher V, et al.Anthropogenic particles in the stomach contents and liver of the freshwater
fish Squalius cephalus. Sci Total Environ. 2018;643:1257–64. https://doi.org/10.1016/j.scitotenv.2018.06.313.
13. Jin Y, Lu L, Tu W, Luo T, Fu Z. Impacts of polystyrene microplastic on thegut barrier, microbiota and metabolism of mice. Sci Total Environ. 2019;649:308–17. https://doi.org/10.1016/j.scitotenv.2018.08.353.
14. Luo T, Wang C, Pan Z, Jin C, Fu Z, Jin Y. Maternal polystyrene microplasticexposure during gestation and lactation altered metabolic homeostasis inthe dams and their F1 and F2 offspring. Environ Sci Technol. 2019;53(18):10978–92. https://doi.org/10.1021/acs.est.9b03191.
15. Yoo JW, Doshi N, Mitragotri S. Adaptive micro and nanoparticles: temporalcontrol over carrier properties to facilitate drug delivery. Adv Drug DelivRev. 2011;63(14–15):1247–56. https://doi.org/10.1016/j.addr.2011.05.004.
16. EFSA CONTAM Panel (EFSA Panel on Contaminants in the Food Chain).Presence of microplastics and nanoplastics in food, with particular focus onseafood. EFSA J. 2016;14(6):4501.
17. Walczak AP, Hendriksen PJ, Woutersen RA, van der Zande M, Undas AK,Helsdingen R, et al. Bioavailability and biodistribution of differently chargedpolystyrene nanoparticles upon oral exposure in rats. J Nanopart Res. 2015;17(5):231. https://doi.org/10.1007/s11051-015-3029-y.
18. Stock V, Bohmert L, Lisicki E, Block R, Cara-Carmona J, Pack LK, et al. Uptakeand effects of orally ingested polystyrene microplastic particles in vitro andin vivo. Arch Toxicol. 2019;93(7):1817–33. https://doi.org/10.1007/s00204-019-02478-7.
19. Hussain N, Jaitley V, Florence AT. Recent advances in the understanding ofuptake of microparticulates across the gastrointestinal lymphatics. Adv DrugDeliv Rev. 2001;50(1–2):107–42. https://doi.org/10.1016/S0169-409X(01)00152-1.
20. Lu Y, Zhang Y, Deng Y, Jiang W, Zhao Y, Geng J, et al. Uptake andaccumulation of polystyrene microplastics in zebrafish (Danio rerio) andtoxic effects in liver. Environ Sci Technol. 2016;50(7):4054–60. https://doi.org/10.1021/acs.est.6b00183.
21. Zitouni N, Bousserrhine N, Missawi O, Boughattas I, Chevre N, Santos R, et al.Uptake, tissue distribution and toxicological effects of environmentalmicroplastics in early juvenile fish Dicentrarchus labrax. J Hazard Mater.2021;403:124055. https://doi.org/10.1016/j.jhazmat.2020.124055.
22. Walczak AP, Kramer E, Hendriksen PJ, Tromp P, Helsper JP, van der ZandeM, et al. Translocation of differently sized and charged polystyrenenanoparticles in in vitro intestinal cell models of increasing complexity.Nanotoxicology. 2015;9(4):453–61. https://doi.org/10.3109/17435390.2014.944599.
23. Jani P, Halbert GW, Langridge J, Florence AT. Nanoparticle uptake by the ratgastrointestinal mucosa: quantitation and particle size dependency. J PharmPharmacol. 1990;42(12):821–6. https://doi.org/10.1111/j.2042-7158.1990.tb07033.x.
24. Danopoulos E, Jenner LC, Twiddy M, Rotchell JM. Microplasticcontamination of seafood intended for human consumption: a systematicreview and meta-analysis. Environ Health Perspect. 2020;128(12):126002.https://doi.org/10.1289/EHP7171.
25. Abbasi S, Turner A. Human exposure to microplastics: a study in Iran. J HazardMater. 2021;403:123799. https://doi.org/10.1016/j.jhazmat.2020.123799.
26. Cox KD, Covernton GA, Davies HL, Dower JF, Juanes F, Dudas SE. Humanconsumption of microplastics. Environ Sci Technol. 2019;53(12):7068–74.https://doi.org/10.1021/acs.est.9b01517.
27. Lee J, Chae KJ. A systematic protocol of microplastics analysis from theiridentification to quantification in water environment: a comprehensivereview. J Hazard Mater. 2021;403:124049. https://doi.org/10.1016/j.jhazmat.2020.124049.
28. Lenz R, Enders K, Nielsen TG. Microplastic exposure studies should beenvironmentally realistic. Proc Natl Acad Sci U S A. 2016;113(29):E4121–2.https://doi.org/10.1073/pnas.1606615113.
29. Amorim MJB, Scott-Fordsmand JJ. Plastic pollution - a case study withEnchytraeus crypticus - from micro-to nanoplastics. Environ Pollut. 2020;271:116363.
30. Gao G, Zhao X, Jin P, Gao K, Beardall J. Current understanding andchallenges for aquatic primary producers in a world with rising micro- andnano-plastic levels. J Hazard Mater. 2020;406:124685.
31. Kwak JI, An YJ. Microplastic digestion generates fragmented nanoplastics insoils and damages earthworm spermatogenesis and coelomocyte viability. JHazard Mater. 2021;402:124034. https://doi.org/10.1016/j.jhazmat.2020.124034.
32. Li L, Xi WS, Su Q, Li Y, Yan GH, Liu Y, et al. Unexpected size effect: theinterplay between different-sized nanoparticles in their cellular uptake.Small. 2019;15(38):e1901687. https://doi.org/10.1002/smll.201901687.
Liang et al. Particle and Fibre Toxicology (2021) 18:20 Page 18 of 19
33. Sorensen RM, Jovanovic B. From nanoplastic to microplastic: a bibliometricanalysis on the presence of plastic particles in the environment. Mar PollutBull. 2020;163:111926.
34. Bhagat J, Nishimura N, Shimada Y. Toxicological interactions ofmicroplastics/nanoplastics and environmental contaminants: currentknowledge and future perspectives. J Hazard Mater. 2021;405:123913.https://doi.org/10.1016/j.jhazmat.2020.123913.
35. Carr KE, Smyth SH, McCullough MT, Morris JF, Moyes SM. Morphologicalaspects of interactions between microparticles and mammalian cells:intestinal uptake and onward movement. Prog Histochem Cytochem. 2012;46(4):185–252. https://doi.org/10.1016/j.proghi.2011.11.001.
36. Stock V, Laurisch C, Franke J, Dnmez H, Sieg HJ. Uptake and cellular effectsof PE, PP, PET and PVC microplastic particles. Toxicol in Vitro. 2020;70:105021.
37. Lundquist P, Artursson P. Oral absorption of peptides and nanoparticlesacross the human intestine: Opportunities, limitations and studies in humantissues. Adv Drug Deliv Rev. 2016;106(Pt B):256–76.
38. Wagner CE, Wheeler KM, Ribbeck K. Mucins and their role in shaping thefunctions of mucus barriers. Annu Rev Cell Dev Biol. 2018;34(1):189–215.https://doi.org/10.1146/annurev-cellbio-100617-062818.
39. Jeong GN, Jo UB, Ryu HY, Kim YS, Song KS, Yu IJ. Histochemical study ofintestinal mucins after administration of silver nanoparticles in Sprague-Dawley rats. Arch Toxicol. 2010;84(1):63–9. https://doi.org/10.1007/s00204-009-0469-0.
40. Kebouchi M, Hafeez Z, Le Roux Y, Dary-Mourot A, Genay M. Importance ofdigestive mucus and mucins for designing new functional food ingredients.Food Res Int. 2020;131:108906. https://doi.org/10.1016/j.foodres.2019.108906.
41. Odenwald MA, Turner JR. The intestinal epithelial barrier: a therapeutictarget? Nat Rev Gastroenterol Hepatol. 2017;14(1):9–21. https://doi.org/10.1038/nrgastro.2016.169.
42. Camilleri M. Leaky gut: mechanisms, measurement and clinical implicationsin humans. Gut. 2019;68(8):1516–26. https://doi.org/10.1136/gutjnl-2019-318427.
43. Noda S, Tanabe S, Suzuki T. Naringenin enhances intestinal barrier functionthrough the expression and cytoskeletal association of tight junctionproteins in Caco-2 cells. Mol Nutr Food Res. 2013;57(11):2019–28. https://doi.org/10.1002/mnfr.201300045.
44. Tsai PY, Zhang B, He WQ, Zha JM, Odenwald MA, Singh G, et al. IL-22upregulates epithelial claudin-2 to drive diarrhea and enteric pathogenclearance. Cell Host Microbe. 2017;21(6):671–81 e4.
45. Fihn BM, Sjoqvist A, Jodal M. Permeability of the rat small intestinalepithelium along the villus-crypt axis: effects of glucose transport.Gastroenterology. 2000;119(4):1029–36. https://doi.org/10.1053/gast.2000.18148.
46. Wu B, Wu X, Liu S, Wang Z, Chen L. Size-dependent effects of polystyrenemicroplastics on cytotoxicity and efflux pump inhibition in human Caco-2cells. Chemosphere. 2019;221:333–41. https://doi.org/10.1016/j.chemosphere.2019.01.056.
47. Mohammadinejad R, Moosavi MA, Tavakol S, Vardar DO, Hosseini A, RahmatiM, et al. Necrotic, apoptotic and autophagic cell fates triggered bynanoparticles. Autophagy. 2019;15(1):4–33. https://doi.org/10.1080/15548627.2018.1509171.
48. An R, Wang XF, Yang L, Zhang JJ, Wang NN, Xu FB, et al. Polystyrenemicroplastics cause granulosa cells apoptosis and fibrosis in ovary throughoxidative stress in rats. Toxicology. 2021;449:152665. https://doi.org/10.1016/j.tox.2020.152665.
49. Xie X, Deng T, Duan J, Xie J, Yuan J, Chen M. Exposure to polystyrenemicroplastics causes reproductive toxicity through oxidative stress andactivation of the p38 MAPK signaling pathway. Ecotoxicol Environ Saf. 2020;190:110133. https://doi.org/10.1016/j.ecoenv.2019.110133.
50. Gao T, Wang Z, Dong Y, Cao J, Lin R, Wang X, et al. Role of melatonin insleep deprivation-induced intestinal barrier dysfunction in mice. J PinealRes. 2019;67(1):e12574. https://doi.org/10.1111/jpi.12574.
51. Vaccaro A, Kaplan Dor Y, Nambara K, Pollina EA, Lin C, Greenberg ME, et al.Sleep loss can cause death through accumulation of reactive oxygenspecies in the gut. Cell. 2020;181(6):1307–28 e15.
52. Xu C, Zhang B, Gu C, Shen C, Yin S, Aamir M, et al. Are we underestimatingthe sources of microplastic pollution in terrestrial environment? J HazardMater. 2020;400:123228. https://doi.org/10.1016/j.jhazmat.2020.123228.
53. Wang C, Zhao J, Xing B. Environmental source, fate, and toxicity ofmicroplastics. J Hazard Mater. 2021;407:124357. https://doi.org/10.1016/j.jhazmat.2020.124357.
54. Yohanes SY. Synergistic effects of mixed silica micro-nanoparticles oncompressive dynamic stiffness and damping of epoxy adhesive. JDynamic Behavior Mater. 2018;4(2):190–200. https://doi.org/10.1007/s40870-018-0148-4.
55. Zhao Q, Zhang Q, Du C, Sun S, Steinkruger JD, Zhou C, et al. Synergisticeffect of dual particle-size AuNPs on TiO2 for efficient photocatalytichydrogen evolution. Nanomaterials (Basel). 2019;9(4):499. https://doi.org/10.3390/nano9040499.
56. Zuccarello P, Ferrante M, Cristaldi A, Copat C, Grasso A, Sangregorio D, et al.Exposure to microplastics (<10 μm) associated to plastic bottles mineralwater consumption: the first quantitative study. Water Res. 2019;157:365–71.https://doi.org/10.1016/j.watres.2019.03.091.
57. Senathirajah K, Attwood S, Bhagwat G, Carbery M, Wilson S, Palanisami T.Estimation of the mass of microplastics ingested - A pivotal first steptowards human health risk assessment. J Hazard Mater. 2021;404(Pt B):124004.
58. Elkhatib D, Oyanedel-Craver V. A critical review of extraction andidentification methods of microplastics in wastewater and drinking water.Environ Sci Technol. 2020;54(12):7037–49. https://doi.org/10.1021/acs.est.9b06672.
59. Oomen AG, Rompelberg CJ, Bruil MA, Dobbe CJ, Pereboom DP, Sips AJ.Development of an in vitro digestion model for estimating thebioaccessibility of soil contaminants. Arch Environ Contam Toxicol. 2003;44(3):281–7. https://doi.org/10.1007/s00244-002-1278-0.
60. R.C. Team, R: a language and environment for statistical computing, Rfoundationfor statistical computing, Vienna, Austria. 2020; https://www.R-project.org.
61. JLV M. gganatogram: An R package for modular visualisation of anatogramsand tissues based on ggplot2. F1000Res. 2018;28:1576.
Publisher’s NoteSpringer Nature remains neutral with regard to jurisdictional claims inpublished maps and institutional affiliations.
Liang et al. Particle and Fibre Toxicology (2021) 18:20 Page 19 of 19