Walden University Walden University ScholarWorks ScholarWorks Walden Dissertations and Doctoral Studies Walden Dissertations and Doctoral Studies Collection 2021 Undergraduate Education Value: A Comparative Analysis of China Undergraduate Education Value: A Comparative Analysis of China and the United States and the United States Alexandra Allman Walden University Follow this and additional works at: https://scholarworks.waldenu.edu/dissertations Part of the Public Policy Commons This Dissertation is brought to you for free and open access by the Walden Dissertations and Doctoral Studies Collection at ScholarWorks. It has been accepted for inclusion in Walden Dissertations and Doctoral Studies by an authorized administrator of ScholarWorks. For more information, please contact [email protected].
Transcript
Walden University Walden University
ScholarWorks ScholarWorks
Walden Dissertations and Doctoral Studies Walden Dissertations and Doctoral Studies Collection
2021
Undergraduate Education Value: A Comparative Analysis of China Undergraduate Education Value: A Comparative Analysis of China
and the United States and the United States
Alexandra Allman Walden University
Follow this and additional works at: https://scholarworks.waldenu.edu/dissertations
Part of the Public Policy Commons
This Dissertation is brought to you for free and open access by the Walden Dissertations and Doctoral Studies Collection at ScholarWorks. It has been accepted for inclusion in Walden Dissertations and Doctoral Studies by an authorized administrator of ScholarWorks. For more information, please contact [email protected].
Table 17 ANOVA United States ...................................................................................... 103
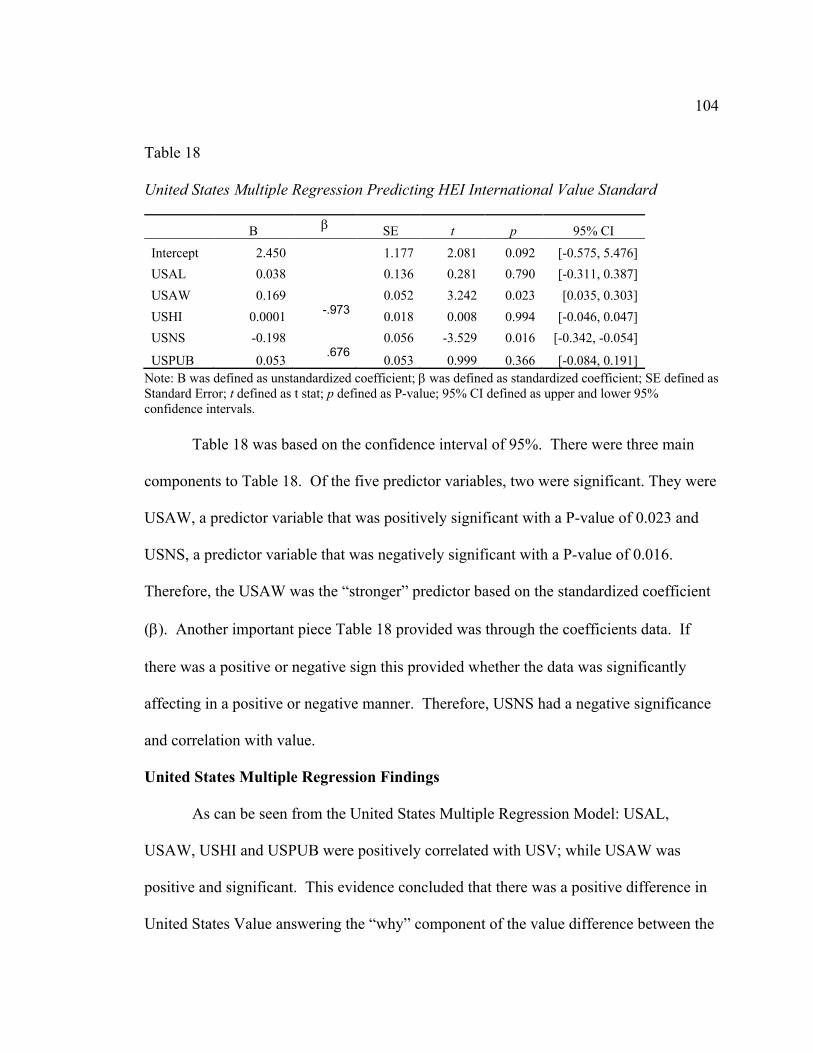
Table 18 United States Multiple Regression Predicting HEI International Value
Standard .................................................................................................................. 104
viii
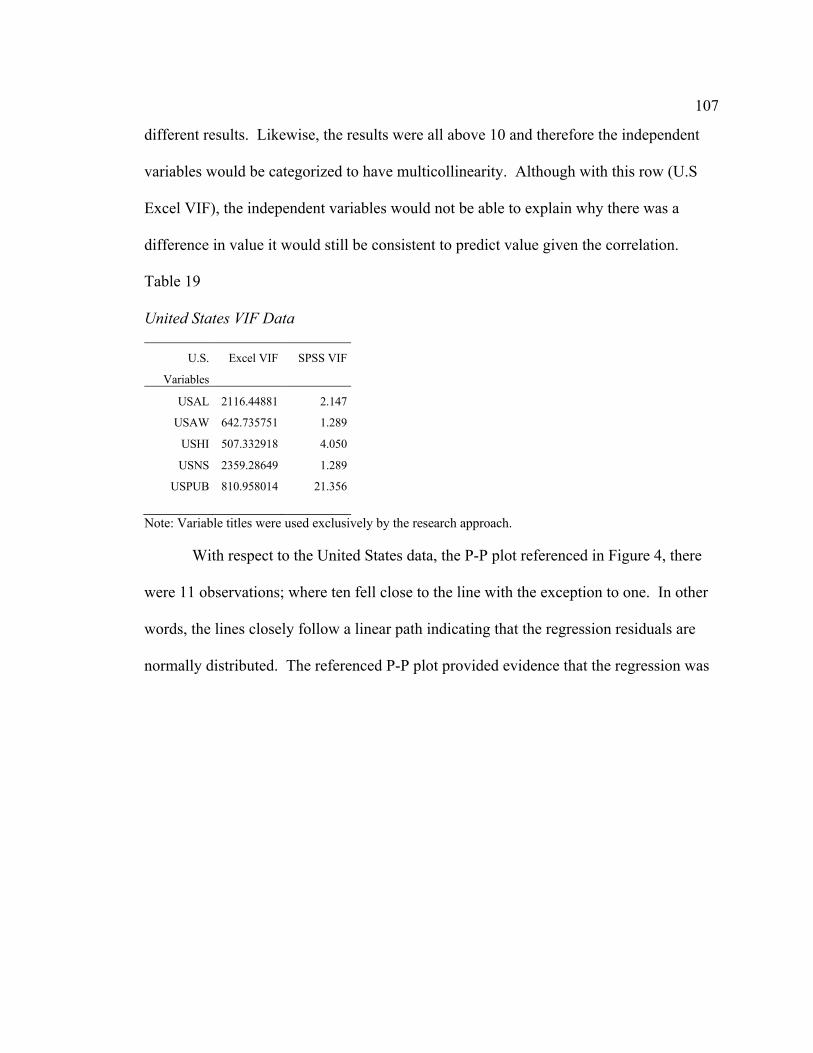
Table 19 United States VIF Data ................................................................................... 107
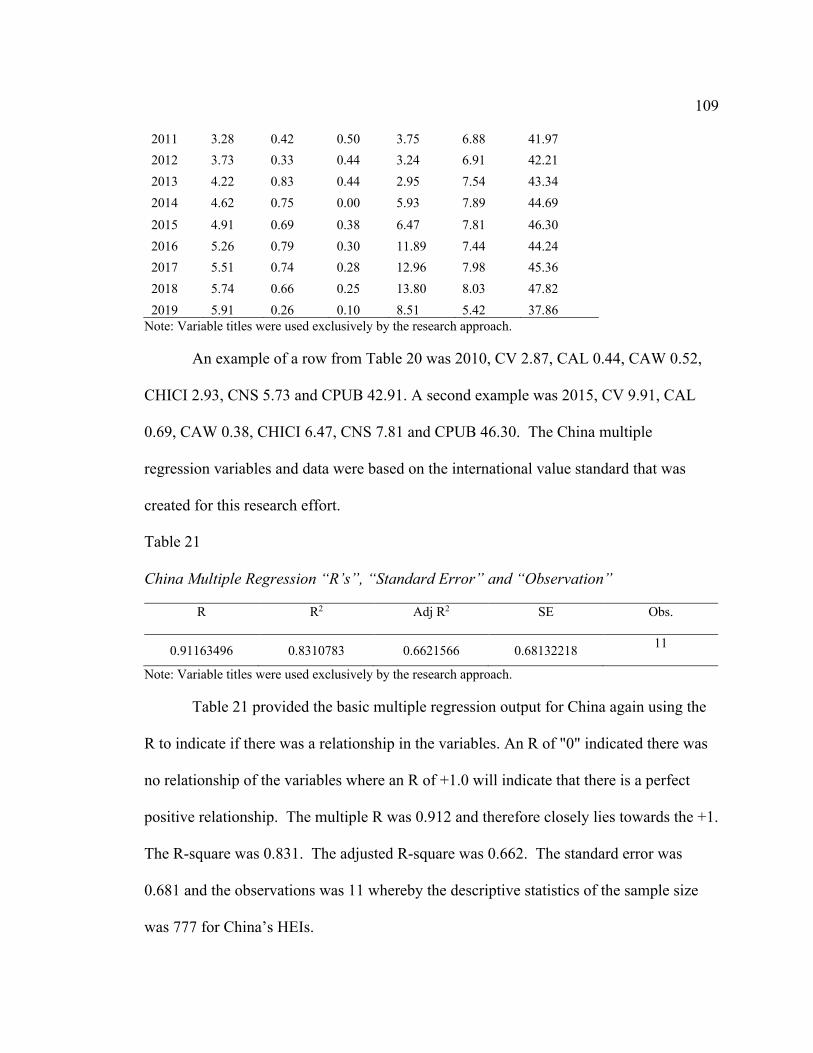
Table 20 Data for China Multiple Regression to Predict HEI International Value
Standard .................................................................................................................. 108
Table 21 China Multiple Regression “R’s”, “Standard Error” and “Observation” .... 109
Table 22 ANOVA China ................................................................................................. 110
Table 23 China Multiple Regression Predicting HEI International Value Standard ... 110
Table 24 China VIF Data ............................................................................................... 113
ix
List of Figures
Figure 1. U.S. Accreditation System ................................................................................. 49
Figure 2. Structure of Evaluation System in China ........................................................... 53
Figure 3. International Value Standard Comparison ......................................................... 98
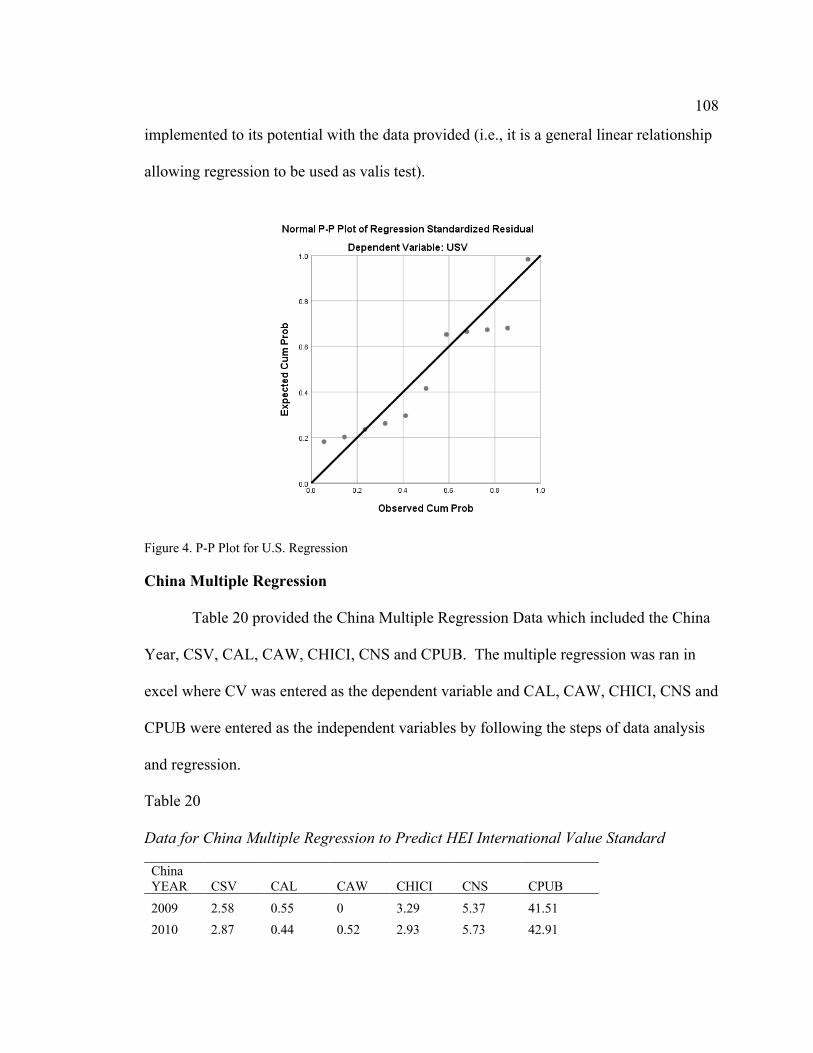
Figure 4. P-P Plot for U.S. Regression ............................................................................ 108
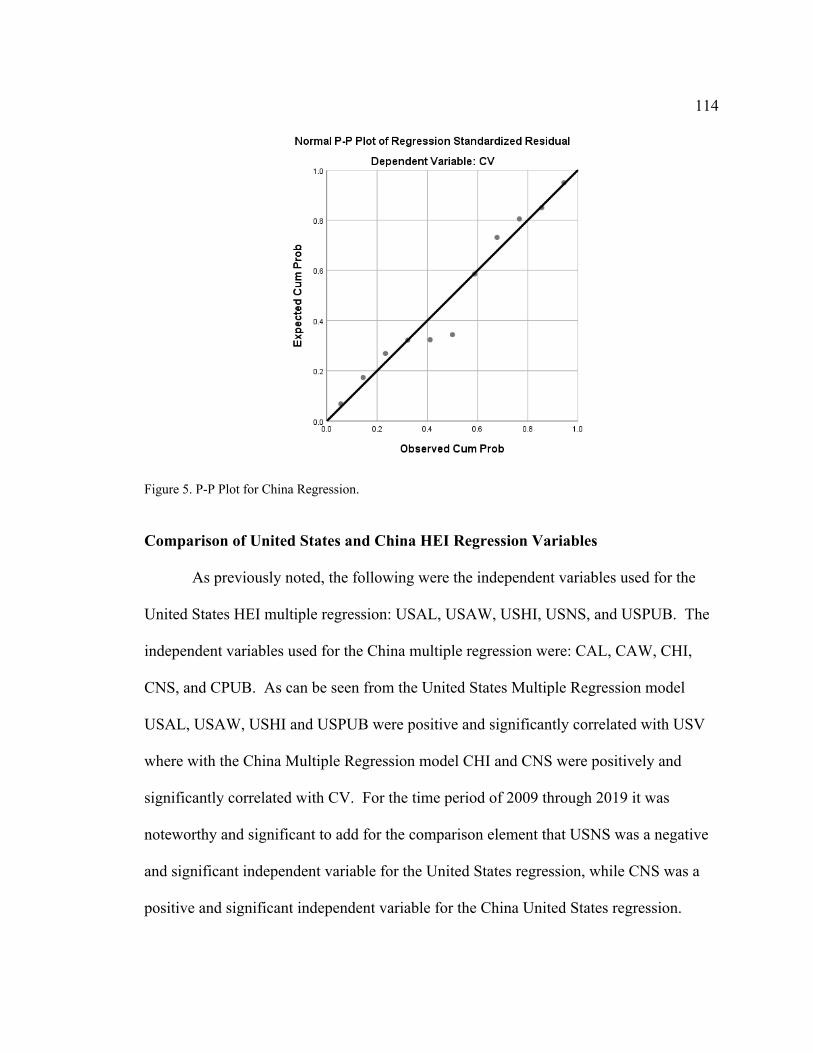
Figure 5. P-P Plot for China Regression. ........................................................................ 114
1
Chapter 1: Introduction to the Study
Higher education institutions (HEIs) acknowledged that there is a value connected
to the 4-year public undergraduate degree. Value was an international question that
affected all HEIs. The international HEI community did not have an international value
standard, gold standard, global standard, universal standard, or value index that identifies
and defines value. Nonetheless, HEIs across the globe consistently assessed their value
through outputs such as the quantity of bachelor's degrees awarded, and higher education
grades as a whole.
Studies based on value revealed little attention towards HEI value and
quantification; and, the academic body of literature did not present an "HEI international
value standard." In this study, I created an HEI international value standard. The
countries of China and the United States were the quantitative comparative analysis
component forming the foundation of this research.
Background of Study
HEIs did not have an international value standard; this was evidence of a gap in
the literature. The purpose of this research was to address this gap. This study was
necessary because, within the higher education community, the value of an undergraduate
education was considered necessary by both customers and academic providers.
Historically, the term value had conflicting definitions with the shared consensus that it is
critical for the institutions output and survival (Lee & Raschke, 2018; Amir, Auzair,
Maelah, & Ahmad, 2016; Daromes, 2015; Barron, 2017; Susilo, 2016; Lai, To, Lung, and
2
Lai, 2012; Hamid, Mustafa, Suradi, Idris, & Abdullah, 2012; Milla, Martin & Van
Bellegem, 2016).
Bernhard (2012) focused on an international higher education comparative
analysis addressing tuition; Zha (2011) focused on comparing the massification of higher
education using the countries of China and the United States. Ryan (2016) defined
accreditation and the role of accreditation agencies; Ramirez (2015) explained that
accreditation agencies in the United States all have different rules and standards,
specifically international institutions. Guangli (2016) explained the accreditation process
in China. There was a social problem within the HEI community as to how it operated
without a set international standard. The lack of a HEI international standard led to
conflicting and confusing tuition policies, deregulated and confusing accreditation
policies, under-employment and unemployment outcomes, and conflicting earning rates.
Therefore, the current value for a 4-year public undergraduate degree under the current
social conditions were inconsistent with the present global community.
Problem Statement
Within the international higher education community, there was no system or gold
standard to identify the value of higher education institutions (HEI). Lacking an
international value standard created a problem for the United States and Chinese HEIs’
internal and external stakeholders as there was no international global measuring system
akin to the metric system. There were many definitions of value. For this study, I used
the definition given by Mihram and Murphy (2008), that value was determined through
quantitative methods by taking utility and dividing it by cost. With this approach, utility
3
was identified as a numeric ratio function used for statistics where cost and utility were
measured (Upton & Cook, 2014). There was a need to quantify the value of higher
education because provided empirical evidence of the benefits chosen over the associated
costs. The global community required measurable evidence of the utility of higher
education and the value it created. A measurable way to compare the relative value of
higher education among competitive entities was also needed. The value system
contributed to the literature by providing an understanding of the benefits of an
undergraduate education versus the comparative cost. Included in this study, was a
comparative element between the two countries of China and the United States. It was
determined if value matters within the global community, and why.
The literature on higher education and value was extensive and covered themes
such as academic values, educational values, organizational values, culture values,
perceived value, material value, and value competition. For example, educational values,
in terms of outcomes, contain perceived educational worth, affordability, class size, and
entrance standards (Lee & Raschke, 2018). In contrast, perceived worth was identified as
consumption value with categories such as functional value, social value, and emotional
value (Lai, To, Lung, & Lai, 2012). In this study, I addressed the lack of an international
value indicator to measure higher education institutions. The international value indicator
provided the ability to quantify the value of HEIs.
The United States and China each provided their own set of standards to accredit
their HEIs (Ryan, 2015; Ramirez, n.d.; Guangli, 2016). Ultimately, the value of higher
education in the United States was somewhat regulated through outside authorities such
4
as regional and state-sponsored accreditation agencies. The accreditation agencies, for
example, had the authority to accredit or strip the HEI of its credentials if it was not
compliant with its rules and standards; an action known as punishment (Chen,
Ramamurthy, & Wen, 2013). The Chinese government required a similar procedure for
undergraduate education, where the HEIs underwent a review for quality accreditation
through a compulsory regulation under the Ministry of Education Higher Education
Evaluation Centre (Shuiyun, 2016). Therefore, the research problem underscored the
importance known about the United States and Chinese HEIs concerning undergraduate
education by filling the gap of its value within the context of existing literature. A
credible link was established, that provided evidence to retain the value indicator as the
international standard within the HEI community.
Purpose of Study
The purpose of this study was to define the value of undergraduate education, and
create an international value standard through a quantitative comparative analysis of
China and the United States There were many studies on the value of higher education;
however, there was a gap in the literature that did not address a quantitative comparative
approach of these themes (Zha, 2011; Bernhard, 2011). In this study, I used secondary
data of the United States and China available via open sources. The dependent variable
for the study was value for both the United States and China, as defined in a general
sense labeled as USV and CV, respectively. There were multiple independent variables
for the study. The first was cost (the price of a 4-year undergraduate degree) labeled as
USC and CC. The second was utility (employment rate and earnings rate) labeled as
5
USEMR, CEMR, USERR, CERR. The third was Alumni labeled as USAL and CAL.
The fourth was award labeled as USAW and CAW. The fifth was the Number of highly
cited researchers labeled as USHI and CHI. The sixth was the Number of papers
published in nature and science labeled as USNS and CNS. Finally, the seventh was the
Total number of papers indexed in science citation index-expanded and social science
citation index labeled as USPUB and CPUB. Refer to Table 1 for a general menu of
variables used in this research:
Table 1 Variables for Higher Education Value Standard
Variable name Variable Label U.S. Employment Rate USEMR U.S. Earning Rate USERR U.S. Cost USC U.S. Alumni USAL U.S. Award USAW U.S. Number of Highly Cited Researchers
USHI
U.S. Number of Papers Published in Nature and Science
USNS
U.S. Total Number of Papers Indexed in Science Citation Index-Expanded and Social Science Citation Index
USPUB
U.S. Value USV China Employment Rate CEMR China Earning Rate CERR China Cost CC China Alumni CAL China Award CAW China Number of Highly Cited Researchers
CHI
China Number of Papers Published in Nature and Science
CNS
China Total Number of Papers Indexed in Science Citation Index-Expanded and Social Science Citation Index
CPUB
China Value CV Note: Variable titles were used exclusively by the research approach.
6
Research Questions and Hypothesis
The problem I addressed in this study was the lack of an international value
standard for HEIs across the globe, including the United States and China. I designed
the research questions to explore the validity of the value of higher education in the
United States and China as being the same or different. The value USV and CV of HEIs
were determined by taking utility and dividing it over cost. The independent variables
were cost (USC and CC) of an undergraduate degree and utility (USEMR, CEMR,
USERR, and CERR), which included employment rate and earnings rate. In the second
part of the research, I attempted to determine the most influential variables that explain
the difference or similarity using the independent variables: USAL, CAL, USAW, CAW,
USHI, CHI, USNS, CNS, USPUB, and CPUB.
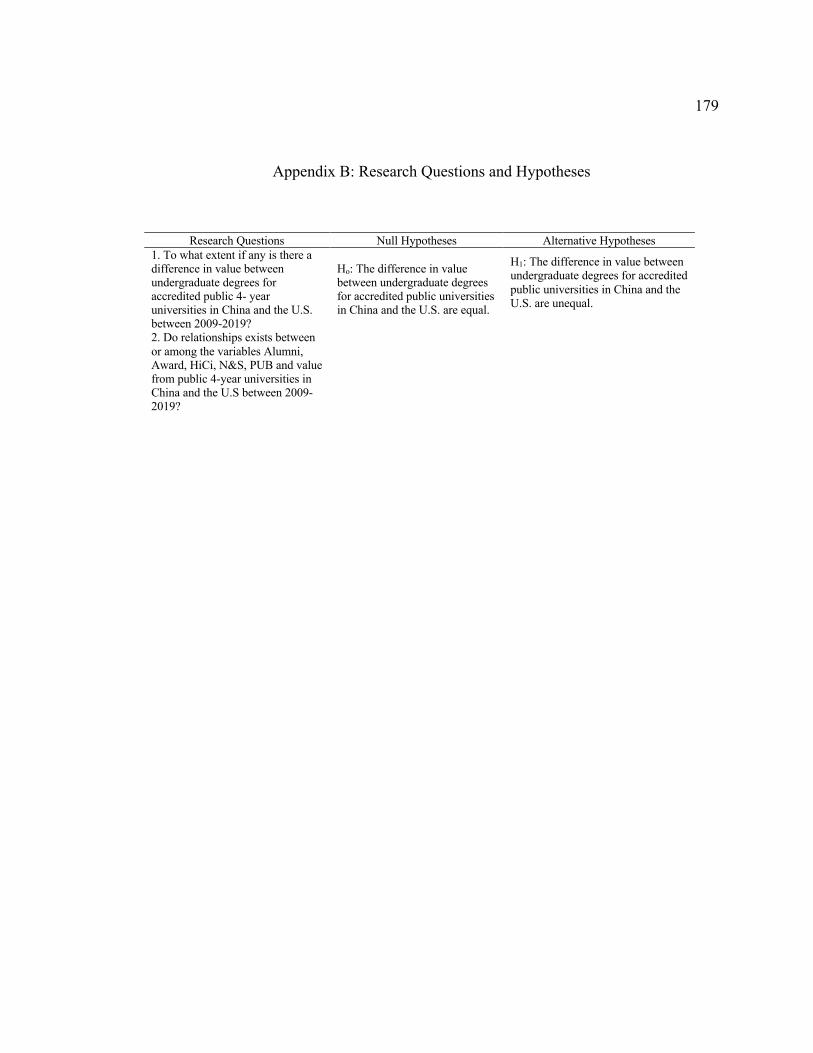
RQ1: To what extent if any is there a difference in value between undergraduate
degrees for accredited public 4-year universities in China and the United States
between 2009–2019?
RQ2: Do relationships exist between or among the variables alumni, award, HiCi,
N&S, PUB, and value from public 4-year universities in China and the United
States between 2009–2019?
First Hypothesis:
Ho: The differences in value between undergraduate degrees for accredited public
universities in China and the United States are equal.
H1: The differences in value between undergraduate degrees for accredited public
universities in China and the United States are unequal.
7
Conceptual Framework for the Study
The conceptual framework tI used for this study was based on the seminal works
of Roels' (2010) value transaction theory (VTT), Thaler's (1983) transaction utility theory
(TUT), and decision rules from the cost-utility analysis of Ginsberg, Somekh, and
Schlesinger (2018). Both the VTT and TUT were theories that are not within the public
policy school of thought. The foundation of Roel's theory is based on statistical
thermodynamics and information theory. It may seem counterintuitive to use theory from
physics for public policy. However, information theory discussed statistical entropy, also
known and described as disorder (Grady, Jr., 2008). The VTT contained two major laws
that were first used for statistical thermodynamics and later rewritten so commercial
markets and industries could apply them. The first rewritten law states,
"true value is a conserved quantity; transactions cannot result in the generation of
true value. The second law states that transactions result in the creation of statistical
entropy, and free-value can only be gained if it is exchanged within this environment"
(Roels, 2010, p. 32).
In other words, free-value is value calculated with less significant information,
while true-value is calculated with all information.
The VTT was relevant to undergraduate education for many reasons. The first
notion, conserved quantity, indicated that the transaction of undergraduate education was
being protected from the true value. The VTT posited a higher likelihood of a
transactional disorder for higher education where free value is only achievable if it is
released. The VTT was vital for the overall comparison of the United States and China,
8
for the same foundational argument of the transactions of HEIs and their true value. The
same goes for the transaction disorder for the United States and China's HEIs, where the
free value will only be achievable when released.
Thaler (1983) created the TUT, which used the market price (the price of the
good/product when sold) and reservation price (the lowest point at which the
good/product will be negotiated) to measure value through utility. The market price and
reservation price were used to gauge the customer's happiness in consideration of the
perceived value of the product (Thaler, 1983).
The TUT was relevant to undergraduate education for many reasons. The first
reason was the concept of the undergraduate market price and the undergraduate
reservation price, which all stakeholders must consider. Another reason the TUT was
relevant to undergraduate education was that the theory can be used as a foundation to
gauge the happiness of the customers—in this case students—considering the perceived
value of their product: education.
Both Duvetorp, Levin, Mattsson, and Ryttig (2019) and Ginsberg, Somekh, and
Schlesinger (2018) used the cost utility analysis and applied decision rules to their
studies. Duvetorp et al. (2019) used cost utility analysis and rules to study psoriasis. The
rules were applied to the treatment decision of ointment or foam. The decision paths were
created based on the success rate (non-success rate) and release rates throughout 12
weeks (Duvertorp et al., 2019). Ginsberg et al. (2018) cost utility analysis, and decision
rules were based on the immunizations against respiratory syncytial virus. More
specifically, based on the data available the established rules were very cost effective and
9
cost effective if their variable was less than the per capita gross domestic product (GDP)
$35,329-$105,987 (Ginsberg et al., 2018, p. 2-3). If the variable was three times more
than the per capita GDP, it was considered not cost effective (Ginsberg et al., 2018, p. 2-
3). Decision rules were crucial for the international value standard. Once an
international value standard was created, decision rules can be applied in this this
research study to examine the HEIs’ effectiveness.
Nature of Study
This was a quantitative comparative analysis study. The first phase of the study
calculated the international value standard. The variables chosen for the United States
and China HEIs were the following: the higher education costs for an undergraduate
degree and the associated utilities of employment rate and earnings rate. The focus of
HEI value and its influence on HEI costs were consistent with Bernhard's (2012) effort to
compare countries from a price perspective. Choosing a comparative analysis of higher
education institutions with the countries of the United States and China for locations
conformed to Johnstone (2003) research and facilitated the research theme on value of
higher education. Finally, there were no covariates for this research study.
The referenced data sets of employment rate were secondary and collected from
the United States Bureau of Labor Statistics website for the United States data and the
Statista website for the China data (Databases, Tables & Calculators by Subject, n.d.;
Share of employed people in the Chinese population from 2009 to 2019, n.d.). The
datasets were analyzed using Microsoft Excel. The referenced data sets of earning rate
were secondary and collected from the United States Census Bureau for the United States
10
data and the National Bureau of Statistics of China website for the China data (Income
and poverty in the United States 2018, 2020; Annual by province, n.d.). The datasets
were analyzed using Microsoft Excel. The referenced datasets of cost were secondary
and collected from the Digest of Education Statistics 2014 for the United States data and
the ebook Higher Education in China for China’s data (National Center for Education
Statistics, 2014; Gu, J., Li, X., Wang, L., 2018). All referenced datasets were collected
into a master data folder.
The second phase of the study was a two-population t-test. Value will already
have been calculated for 2009–2019 for both the United States and China. Value will be
considered the dependent variable, specifically USV and CV. The independent variables
chosen to assess if there was a difference in value were: USC, CC, USEMR, CEMR,
USERR and CERR.
The third phase of the study was a multiple regression. That methodology was
chosen to assess why there was a difference in value (as the dependent variable). The
independent variables chosen were as follows: USAL, CAL, USAW, CAW, USHI, CHI,
USNS, CNS, USPUB, and CPUB. The referenced data was secondary and was collected
from the Academic Rankings of World Universities website (Academic Rankings of
World Universities 2019, n.d.). The datasets were analyzed using SPSS and Microsoft
Excel. All referenced datasets were collected into a master data folder.
Definition of Terms
I used the following terms for this study:
11
Accreditation: Tabrizi and Farahsa (2015) defined accreditation as a procedure in
identifying the quality of an institution or a study program, where it was evaluated by a
private or a state-independent actor to certify that it met specific and pre-determined
standards (p. 5). I assumed that all HEIs used for the United States and China were
properly institutionally accredited.
Alumni: Alumni had a diversity of meanings. Alumni provided the option to
showcase the depth and breadth of individuals who have graduated from a particular
organization or institution. For purposes of this study alumni included graduates from
bachelors and beyond who have obtained the Nobel Prizes and Field Medals from higher
education institutions.
Award: Awards are provided to recognize particular achievements that
individuals, teams, organizations and/or institutions have accomplished. For purposes of
this study, awards signified staff within the higher education institution who have
obtained the Nobel Prizes and Field Medals.
Cost: Cost was defined as public tuition from public 4- year institutions in the
United States (Hemelt & Marcotte, 2016). I used the average cost of a 4-year degree
from a HEI in China or the United States.
Government: In this study, I examined government from the perspective of a
communist regime and a democracy. Welch (1989) explained that communism has two
dimensions, which included actors and subjects of action; where Karl Marx (1996)
explained in the Communist Manifesto that everything should be equally owned and
shared. Lijphart (1999) explained that Robert Dahl's definition of democracy from
12
polyarchy is as follows: (a) the right to vote, (b) the right to be elected, (c) the right of
political leaders to compete for support and votes, (d) elections that are free and fair, (e)
freedom of association, (f) freedom of expression, (g) alternative sources of information
and, (h) institutions for making public policies dependent on votes and other expressions
of preference.
Higher education: Higher education had a variety of meanings. Higher education
provided the option of brick-and-mortar institutions or online and hybrid programs across
the globe. Higher education also underscored different degrees such as bachelor's,
master's, doctorates, professional (JD’s, MBA's), and certificates. Likewise, higher
education included different classifications of study, such as natural science (i.e.,
biology), social science (i.e., political science and economics), and humanities (i.e.,
religion), as examples. For purposes of this study, I defined higher education as a
completed bachelor's degree from a public 4-year higher education institution).
Higher Education Institution: Liu and Dai (2012) explained that HEIs were
universities and colleges and they were their own businesses and had the quality to
internationalize. I defined an HEI for this study as a 4–year public institution that is fully
accredited and validated to provide undergraduate degrees from either the United States
or China.
The Number of Highly Cited Researchers aka HiCi: I conducted this research so
that it could be shared with the world and for it to have a positive impact. One way to
share the research was for researchers to become highly cited through different analytic
databases. One of the databases included Clarivate Analytics.
13
The Number of Papers Published Indexed in Science Citation Index-Expanded
and Social Science Citation Index PUB: Scholarly indices provided a robust and
purposeful manner for data research to populate. PUB indicated the number of papers
published from the Science Citation Index-Expanded and Social Science Citation Index.
The Number of Papers Published in Nature and Citation Index-Expanded N&S:
The purpose for scholarly indices were to conglomerate research in a purposeful and
strategic manner. N&S helped to indicate the amount of papers published from the
Nature and Citation Index.
Utility: The body of literature provided a range of descriptions for utility (Thaler,
1983; Witt, 2016; Mao, Hu, and Liu, 2018). This study used : (a) the employment rate of
both China and the United States which will include recent graduates from public 4 year
universities, and (b) the earnings rate of both China and the United States which will
include recent graduates from public 4 year universities.
Value: The body of literature presented various articles from separate schools of
thought on value (Porter, 2009; Maab & Grundmann, 2018; Chen, Liu, & Huang; 2016).
This study was based on the quantitative measurement of value equals utility divided by
Value based system for health care Value Porter (2009)
Qualitative
Value Transaction Theory Value Utility
Roels’ (2010) Witt (2016) Quantitative
Utility bsd shrtfl mdl; Rank Dep. expt. utility (RDEU) model
Utility Mao, Hu & Liu (2018) Quantitative
Expected utility theory; utility maximization; interdependent utility function
Utility Lisciandra (2016) Qualitative
Utility; coalition game Transaction Utility Theory
Utility Utility
Khalilzadeh and Wang (2017) Thaler (1983)
Quantitative Quantitative
Note: Variable titles were used exclusively by the research approach.
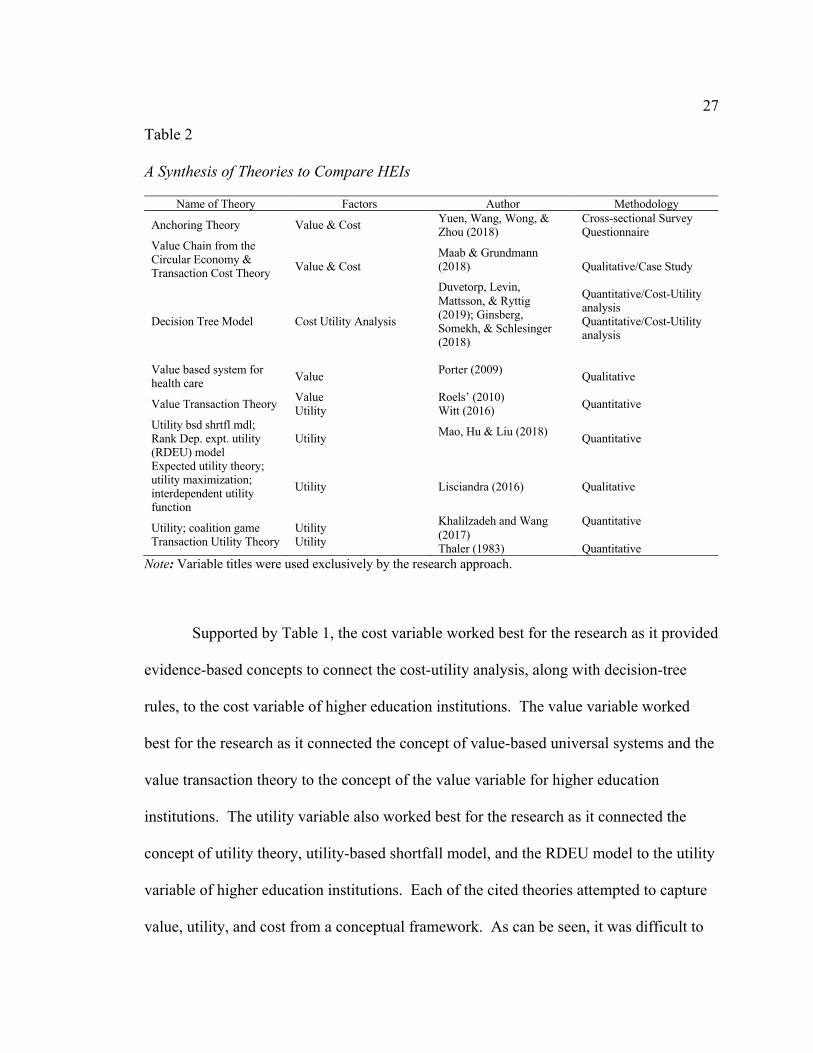
Supported by Table 1, the cost variable worked best for the research as it provided
evidence-based concepts to connect the cost-utility analysis, along with decision-tree
rules, to the cost variable of higher education institutions. The value variable worked
best for the research as it connected the concept of value-based universal systems and the
value transaction theory to the concept of the value variable for higher education
institutions. The utility variable also worked best for the research as it connected the
concept of utility theory, utility-based shortfall model, and the RDEU model to the utility
variable of higher education institutions. Each of the cited theories attempted to capture
value, utility, and cost from a conceptual framework. As can be seen, it was difficult to
28
use a specific formula for the chosen research questions. Due to this, the conceptual
framework was a better choice than a theoretical approach. For purposes of this research,
value was measured as utility divided by the average cost of HEIs in China and the
United States.
Conventional Higher Education Value Factors
The following section provided an overview of the five higher education value
factors: alumni, awards, the Number of highly cited researchers, the Number of papers
published in nature and citation index-expanded and the Number of papers published
indexed in science citation index-expanded and social science citation index. It was
through the five conventional higher education factors that the international value
standard was defined.
Table 3 Conventional Higher Education Value Factors
Name of Theory Factors Author Methodology Alumni Satisfaction Model Alumni Hsu et al. (2016) Quantitative
ALTRIS Alumni Mijic and Jankovic (2014) Quantitative Inductive data analysis strategy for themes Awards Mitten and Ross (2018) Qualitative/Interviews
Theming with categories Awards Lowe and Shaw (2019) Qualitative
Own HiCi Ranking HiCi Bornmann and Bauer (2014) Quantitative
Input/Output for Inst. Qualitiy HiCi Micceri (2005) Quantitative
“Publish or perish” & low quality work N&S Ertas and Kozak (2020) Mixed
Motivational, other social, economic or none N&S Lambovska and Yordanov
(2020) Mixed
QLA PUB PUB Woten and Pilgrim (2017) Quantitative
SSI PUB Social Support Index (2002) Quantitative
Note: Variable titles were used exclusively by the research approach.
29
The Alumni Factor
The body of literature defined and highlighted alumni in different ways. Hsu et
al. (2016) reflected it through the alumni satisfaction model. This model was based off of
the Customer Satisfaction Index and built to measure and analyze different parts of the
higher education institution such as experience, courses and environment (Hsu et al.,
2016). Mijic and Jankovic (2014) argued that alumni took on an important role as it
related to HEIs through information communication technologies for employment and
personal information (p. 1156). The information retrieved about alumni assisted HEIs in
making data driven decisions (Mijic & Jankovic, 2014, p. 1156). Data specifically
gathered for Mijic and Jankovic (2014) was based on their ALTRIS theory and research
instrument.
The Awards Factor
The awards factor had a plethora of meanings within the academic community.
Research by Mitten and Ross (2018) supported that awards, as it related to HEIs, was
undergraduate faculty receiving awards in the context of Teacher of the Year at a large
southeastern research HEI (p. 1350). Lowe and Shaw (2019) categorized awards and
HEIs with reference to students. Examples of this included students who taught and
student research initiatives (Lowe and Shaw, 2019).
The HiCi Factor
Bornmann and Bauer (2014) used the Highly cited data from 2014 which was
secondary and created their own ranking. The authors were able to add additional HEIs
30
to their unique ranking system (Bornmann & Bauer, 2014). Micceri (2005) processed
Highly cited scholars as an output when rating the HEI quality.
The N&S Factor
Ertas and Kozak (2020) discussed the notion in the academic community of
“publishing or perishing”. In other words, there was a driving competition for academics
to publish their work which could benefit both the scholar and the HEI however, this
could lead to low quality published work (Ertas & Kozak, 2020). Lambovska and
Yordanov (2020) research found that the main components for academics publishing was
collaboration, funding, financial assets, and to contribute to the academic community
(p.188). This evidence showed that there was not one driving factor for academics when
it comes to publishing.
The PUB Factor
The PUB factor was considered an index because it served as a measure and was
also an indicator. When researching indices, the academic body of literature populated
many indices for numerous typical areas. The Social Support Index for example, was an
index because it used scoring similar to the Likert Scale with 17 items to answer (Social
Support Index, 2002). Woten and Pilgrim’s (2017) Quality of Life Assessment was an
additional example of an index because it had two sections with 33 items each. The first
section asked the patient about satisfaction vs dissatisfaction and was given a score. After
the entire QLA was completed by the respondent the researcher was able to add up the
scores based on the index (Woten and Pilgrim, 2017).
31
Why the China Comparison?
In the present-day global pecking order, China is one of the leading players. "Of
the top 100 companies in the world, China and Hong Kong have 21 of them" (Rapoza,
2018, para. 8). A second tangible example of China's global position is through the
United Nations Security Council UNSC. The UNSC maintains 15 members, five of
whom are permanent members, where China includes one of the permanent members. In
other words, China has a seat at the global table with specific powers that include, but are
not limited to, maintaining international peace, determining threats, and a 'vote' if action
should be made with the council ("United Nations Security Council," n.d). The
International Monetary Fund (IMF) reported that China has a population of 1.4 billion,
and the Pew Research Center indicated that China had the world's largest population
(Hackett, 2018). Because China has the world's largest population, it is at the forefront of
sending the largest number of individuals to HEIs. The second-largest population was
India, with 1.35 billion (Hackett, 2018). Finally, higher education was considered a
matter of national security for China. For example, the Chinese Communist Party (CCP)
has a policy in place for researchers who go overseas, where the researchers must check-
in with the CCP or they will be suspended ("Authorized to release the issuance," 2019).
For China, the State and how individuals deal with national security elements were
through a blended (market economy) with communist government politics. The China
HEI system followed the communist traditions of the State. Therefore, the referenced
elements provided a foundation of why an universal value standard was needed,
beginning with the inception of the United States and China.
32
The China comparison was essential for the research as it created the international
value standard component of a semi-communistic state to the theory. Without bringing in
a second country for the research, the standard would simply be a national value standard
for HEIs. For this research, China was strategically chosen to create the international
value standard due to its positions in the world. Likewise, China's rank of world's largest
population was another dominant factor in creating the international value standard. See
Appendix B for a simplistic comparison of the United States and China.
History of HEIs
The following section was based on the history of HEIs. First, it will examine the
chronological history of HEIs, then it will analyze the Global Perspective of HEIs and
their respective value. It will then critique the United States HEI history, followed by a
focus on China's HEI history. It will end with a discussion on the secondary effects of
HEIs.
Himanka (2015) explained that higher education and research currently has an
"identity crises;" therefore, the logical treatment would be to revisit the "childhood" of
higher education. The first step was to review the ancient history of higher education
development through the lens of the Egyptians and Babylonians and then the Greeks.
Himanka (2015) found that Egyptians and Babylonians educated only the privileged class
of humanity; while under the Pythagorean Model in Athens, Greece, education included
all citizens. Fuller (2018) examined how philosophy impacted the American university
system. An example of this was the German philosopher Wilhelm von Humboldt's
viewpoint of making the academic discipline of philosophy, the foundation of the liberal
33
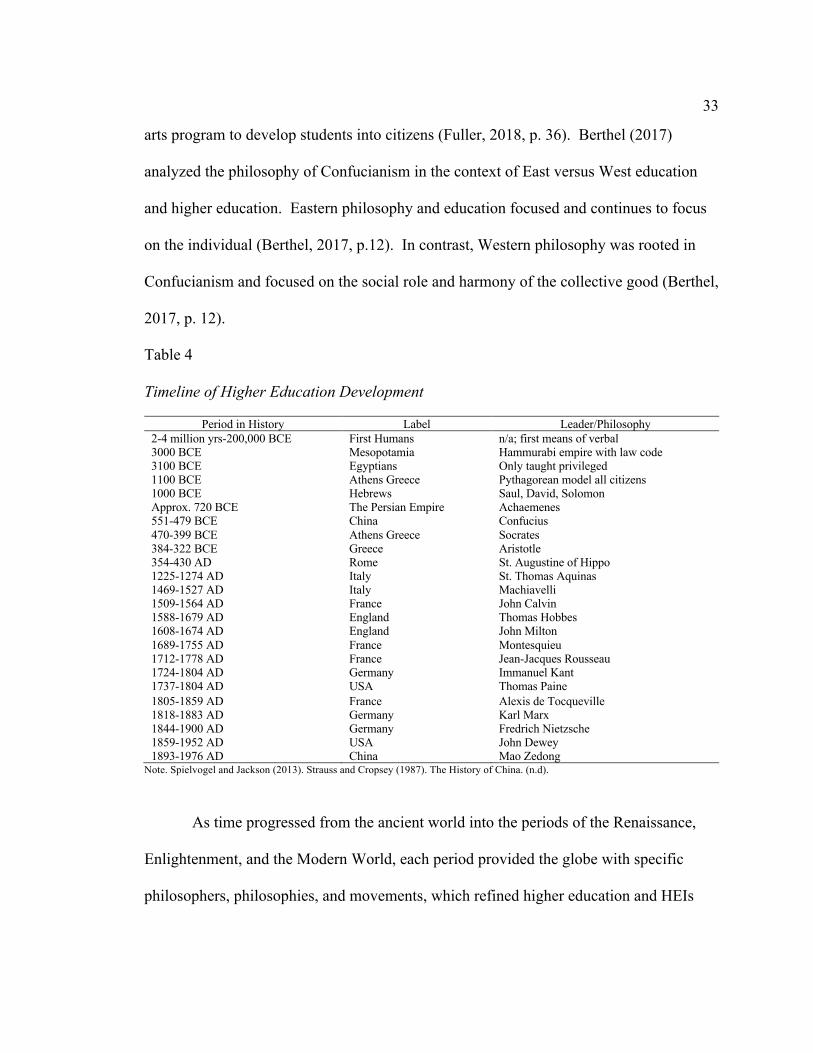
arts program to develop students into citizens (Fuller, 2018, p. 36). Berthel (2017)
analyzed the philosophy of Confucianism in the context of East versus West education
and higher education. Eastern philosophy and education focused and continues to focus
on the individual (Berthel, 2017, p.12). In contrast, Western philosophy was rooted in
Confucianism and focused on the social role and harmony of the collective good (Berthel,
2017, p. 12).
Table 4 Timeline of Higher Education Development
Period in History Label Leader/Philosophy 2-4 million yrs-200,000 BCE First Humans n/a; first means of verbal 3000 BCE Mesopotamia Hammurabi empire with law code 3100 BCE Egyptians Only taught privileged 1100 BCE Athens Greece Pythagorean model all citizens 1000 BCE Hebrews Saul, David, Solomon Approx. 720 BCE The Persian Empire Achaemenes 551-479 BCE China Confucius 470-399 BCE Athens Greece Socrates384-322 BCE Greece Aristotle 354-430 AD Rome St. Augustine of Hippo 1225-1274 AD Italy St. Thomas Aquinas1469-1527 AD Italy Machiavelli 1509-1564 AD France John Calvin 1588-1679 AD England Thomas Hobbes 1608-1674 AD England John Milton1689-1755 AD France Montesquieu1712-1778 AD France Jean-Jacques Rousseau 1724-1804 AD Germany Immanuel Kant 1737-1804 AD USA Thomas Paine 1805-1859 AD France Alexis de Tocqueville1818-1883 AD Germany Karl Marx 1844-1900 AD Germany Fredrich Nietzsche 1859-1952 AD USA John Dewey1893-1976 AD China Mao Zedong
Note. Spielvogel and Jackson (2013). Strauss and Cropsey (1987). The History of China. (n.d).
As time progressed from the ancient world into the periods of the Renaissance,
Enlightenment, and the Modern World, each period provided the globe with specific
philosophers, philosophies, and movements, which refined higher education and HEIs
34
accordingly. St. Augustine of Hippo's noteworthy works were The Confessions and City
of God; which included essential themes such as politics, justice, law, and faith (Strauss
& Cropsey, 1987). Karl Marx's most noteworthy piece was The Communist Manifesto,
which provided the framework for a transition and development of the communist
doctrine (Strauss & Cropsey, 1987). Finally, Mao Zedong created the People's Republic
of China and China's Communist Party (Strauss & Cropsey, 1987). As evidenced from
the historical record, government's role in higher education and HEIs progressed and
developed with the ebbs-and-flows of time, region, politics, and endogenous and
exogenous shocks that were presented at the time.
Global Perspective of HEIs and Value
Higher education institutions did not have an agreed-upon international value
standard to reference when comparing the United States and China. Research by Amir,
Auzair, Maelah, and Ahmad (2016) addressed value and HEIs through the conceptual
paper using the value-based pricing approach, which further used "value-added" to
measure student's "individual utility" (p. 935). The overall purpose of the value factor
was to find a monetary worth in the data, which can be done through a customer value
map. Although Amir et al. covered value factors, there was a missed connection for HEIs
and an international value standard that could provide evidence of gaps in the literature
and a foundational purpose of the research.
Daromes (2015) examined the value and HEIs from the belief system theory
perspective, where organizations created a formalized institutional way of life for internal
operations. In other words, for the institutional system, internal operations elements such
35
as standards, procedures, and plans were considered (Daromes, 2015, p. 663). Although
the notion of value was touched on for HEIs by Daromes, there was not an agreed-upon
international value standard. Barron (2017) analyzed HEIs and value based on the 2006
Berlin Principles that were created to standardize the practice of institutional rankings.
Barron (2017) proved that value was meaningful by collecting data in a non-bias way;
however, the principal did not provide standardization on how to collect the data.
Susilo (2016) highlighted HEIs and value using a customer-value form, place,
time, and an ownership construct that explained consumer value is being akin to the
utility of goods with a price (p.186). Susilo's "customer value" was a partial foundational
framework to the international value standard using quantitative measures. However, the
"customer value" did not provide the same variables used by this research. Lee and
Raschke (2018) discussed HEIs and value through the lens of educational value where
there were antecedent conditions such as procedural justice, distributive justice, research
engagement, teaching engagement, and service engagement; while the outcome
conditions were perceived educational value, affordability, appropriate class sizes, and
appropriate entrance standards (p. 445). The notion of educational value provided a
possible foundation for the global value index; however, the Lee and Raschke literature
did not touch on the topic.
Lai, To, Lung, and Lai (2012) discussed HEI and value based on the context of
perceived value using the categories of functional value, social value, emotional value,
epistemic value, and conditional value. There was room for perceived value and HEIs
within the notion of a global value index; however, Lai et al. (2012) did not discuss the
36
gap. Hamid, Mustafa, Suradi, Idris, and Abdullah (2012) used the value-based
performance excellence framework for HEIs in Malaysia to measure performance
through values constructing leadership, culture, productivity, to measure core values such
as truthfulness, trustworthiness, citizenship (p. 3,026). The value-based performance
excellence framework provided some information on connecting stakeholders and
indicators for HEIs; however, there is not an international value index provided.
Golooba and Ahlan (2013) described the concept of value co-creation as products
and/or services that are produced and used for the consumer, customer, and/or
stakeholder. The authors merged two theories; the service-dominant logic theory (SDL)
and the work systems theory (GDL), which created their proposed framework. The
proposed framework contained the following: (a) business process management and
information management with input, process, and output information; (b) information
technology architecture, and governance with service-oriented architecture (SOA); and
(c) the value co-creation component which provided the interaction between the service
provider and customer with B2B and/or B2C. The merged concept of value co-creation
was important for HEIs as it was a foundation on how to measure processes and
information; however, there was not a true international standardization for it. Milla,
Martin, and Van Bellegem (2016) examined the concept of value-added (VA) based on
HEIs. Colombia provided the "Saber 11" and "Saber PRO VA" indicators, which were
exams provided to students prior to the entrance to HEI and exit from HEI. The authors
built on the VA indicators creating a multidimensional value-added model (MVAM) that
contained outcome specific value-added and composite value-added factors. The
37
difference with the MVAM was that it provided a holistic representation for HEIs to
make better data-driven decisions (Milla, Martin & Van Bellegem, 2016, p. 372). The
MVAM was an important indicator as it measured an entire country; however, it failed to
forecast past Colombia and not scale up into Latin America, Western Hemisphere, and/or
the Globe.
The global perspective of HEIs, as it related to value, indicated that an
international value standard did not exist. In the current environment of HEIs, there was
deregulation for the value of HEIs. Due to the deregulation for value of HEIs, the body
of literature for global perspectives of HEIs, as it related to value, presented elements of
an international value standard, however; it did not present the entire idea of it.
United States HEI History
During the 17th Century, Christian theology and ideology were strategically
taught through HEIs such as Harvard University (founded in 1636) and Yale University
(founded in 1701). Clergy, doctors, lawyers, and politicians received the doctrine as they
were future leaders of the American colonies (Ford, n.d, p. 562). Historical Context of
Institutional Diversity (2013) explained that the founding fathers debated the notion of a
"National University" at the Constitutional Convention in Philadelphia. Men such as
Benjamin Rush, James Madison, and George Washington were all proponents of a
National University; purposed to mold men for the Republic, and to create institutional
research to benefit the state and society (Historical Context of Institutional Diversity,
2013). Ultimately, the idea failed; thus, public universities formed throughout the states.
The first established public university in the country was the University of North
38
Carolina, founded in 1789. The New England region formed "colleges," which were
private entities and driven with religious ideology (Historical Context of Institutional
Diversity, 2013). During the 1800s, the United States passed several policies that
addressed higher education. For example, in 1862, the Enactment of the Morrill Act
established federal and state funding for college through the sale of public lands (Taylor,
2016, p. 22). The Hatch Act established agricultural experiment stations for scientific
research in 1887 and the passage of the Second Morrill Act in 1890 advanced education
in the former Confederate states and new territories requiring them to admit students
regardless of race or establish separate land grant schools for persons of color (Taylor,
2016, p. 22).
Evidence showed that the cost and price of United States colleges before World
War I was affected due to public and private universities not having solid strategic and
financial plans in place, which created an environment of low retention and graduation
rates (Thelin, 2015). Zumeta (2011) posited for HEIs comparisons to happen states must
analyze policies explaining the effect of higher education in terms of student aid policies,
public sector tuition policy, state mandates, and regulations on private higher education
(pp. 430-432).
Rose (2018) highlighted three specific higher education policies that played
critical roles in the United States during the 20th century: (a) the Serviceman's
Readjustment Act also known as the GI Bill of 1944, (b) the National Defense Education
Act (NDEA) of 1958 and, (c) the Higher Education Act (HEA) of 1965. Rose's (2018)
assessment, based on the NDEA and HEA, was that women obtained support for higher
39
education due to "inadvertent outcomes," while the GI Bill continued to support the
gender gap (p. 5). This was due to the servicemen from World War II who were majority
male (Rose, 2018, p. 5). Hutcheson (2011) analyzed the first federal commission report
on higher education titled "Higher Education for American Democracy." The report was
established in 1946 by United States President Harry S. Truman; was six-volumes and
argued for equal opportunity and an educated citizenry (History of Learning Assistance in
United States Postsecondary Education, 2010). In 1965, the Higher Education Act
provided $70 million towards scholarships for the first year, full-time students that
needed support (Hutcheson, 2011, p. 51). Hegji (2017) provided a policy brief on the
Higher Education Act (HEA). The brief distilled the HEA in two manners: (a) it was
organized into eight sections; and (b) there were eight revisions of the HEA from 1968
through 2008. The HEA is still essential today, for colleges and universities in terms of
appropriation and budgetary matters, e.g., teacher education grants, endowment challenge
grants, and promotion of entry into STEM fields (Hegji, 2017, p. 32-34). In April of
2019, The Bill and Melinda Gates Foundation along with the Institute for Higher
Education Policy decided to fund and manage a newly formed "Postsecondary Value
Commission" with the mission of defining a postsecondary value with a deadline of mid-
2020, providing a measurement framework and recommendations (Postsecondary Value,
2019).
The organization and structure of HEIs in the United States contain universities,
colleges, and academic departments, while disciplines structure the academic units. For
example, the college of humanities, college of science, college of engineering, and the
40
like have leadership and management chains of their own. However, the leadership and
management chains differ depending on whether the university or college is private or
public.
The United States HEI history in the context of this research matters because
there was no mention of an international value standard. The only mention of a standard
was the Gates Foundation attempting to create a "value standard" for the United States.
The United States HEI history in the context of how it functioned mattered for the
research because there was no mention of an international value standard within the
general operation of United States HEIs.
China HEI History
Fan, Wen, Yang, and He (2017) described that China had one of the oldest higher
education systems globally, with records going back to the first Five Emperors from
2852-2205 BCE (p. 733). Liu (2012) partitioned the Chinese HEIs into four periods:
Prehistoric before 2100 BC; Ancient 2100 BC-221 BC; Imperial 221 BC-1911 AD; and
Modern 1911 AD-Present (p. 113).
HEIs in China were, and are, based on Confucian ideology and teach individuals
they must be present to their true virtue (Fan et al., 2017, p. 737). Editors Introduction:
Revisioning Higher Education (2017) explained that the history of HEIs in China
displays a consistent clash of receptivity towards western ideology into their system. In
1919, there were protests against the Confucian tradition at Beijing University; in 1937
Mao Zedong founded Yanan University based on western academic ideology but
containing 'moral discipline'; from 1966 through 1976 China had a Cultural Revolution
41
with almost no open universities across the country; and recently there is 'holistic liberal
arts' known as 'suzhi' education (Editors Introduction: Revisioning Higher Education,
2017, p. 555).
The progression of the HEIs in China had taken two paths; one led to state-run
schools that used imperial examinations, and the second known as the shuyuan schools,
who worked on the development of an individual's personal qualities. The history of HEI
admission in China began during the Imperial Period with the Imperial Examination,
transitioned to the model of the worker, farmer, and soldier during Modern China (Liu,
2012, p. 107). Finally, during the 1960s and 1970s, China formed the concept of the
National College Entrance Examination (NCEE) (Liu, 2012, p. 107). Passing the
national exam is still a norm that high school students must do in China as part of the
process of gaining admission into university or college. Feng (1999) provided three
essential strengths and weaknesses for the NCEEs. The strengths of the NCEE were trust
in the system of government, efficiency by the government, and a means in which HEIs
standards can benchmark (Feng, 1999, p. 48-49). The weaknesses were an education
resource waste, the admission process was biased in part due to the NCEE exam, and
individuals were set aside based on political and social classes (Feng, 1999, p. 49-50).
Xuewei (1993) explained that China's admission policies were conducted in
regions and at the local level, yet guided by the State Education Commission (p. 6).
China has undergone three ebbs-and-flows by the State Education Commission known as
a unified plan for student recruitment and admissions during the periods of 1952 to 1965,
1966 to 1976, and 1977 to 1982 (Xuewei, 1993, p. 7). Reforms in the student admission
42
system aligned with economic and educational reforms, e.g., China transitioning to a dual
system of planning (Xuewei, 1993, p. 9). Currently, China provides two national exams
known as the 'huikao' for middle school graduates and the 'gaokao' for prospective
individuals that desire college attendance. The Ministry of Education of the People's
Republic of China contains "The Higher Education Law of the People's Republic of
China." This law was effective on January 1, 1999, written with a contents section and
eight chapters. The first chapter 'general provisions' contained 14 articles explaining
concepts such as higher education is anything after senior middle school, it should be
based on Marxism-Leninism, Mao Zedong Thought, and Deng Xiaoping Theory (Higher
Education Law of the People's Republic of China, n.d). The Ministry of Education of the
People's Republic of China contained an additional law entitled Regulations on Academic
Degrees of the People's Republic of China. This law was effective on February 12, 1980,
and amended on August 28, 2004, containing 20 articles. A broad concept of the law was
that China required its citizens to be members of the communist party and to have good
grades in order to qualify for Bachelors, Masters, or Doctorate programs (Regulations on
Academic Degrees of the People's Republic of China, n.d).
The organization and structure of the HEIs in China were similar to the United
States as it also consisted academic units and functional organizations. The functional
organizations contained universities, colleges, and departments, while disciplines
structured the academic units, all of which were similar to the United States. However,
the diverging path was the leadership system. The People's Republic of China (PRC) was
founded in 1949, where the president took overall responsibility from 1950-1956 (Gu, Li,
43
and Wang, 2018, p. 60). The PRC undertook seven cycles where the current cycle
consists of the president maintaining responsibility under the leadership of the Chinese
Communist Party's primary committee, which began in 1989 (Gu, Li, and Wang, 2018 p.
61).
Upon review of China's HEI history, there was no mention of an international
value standard. Likewise, China HEIs history in the context of how it functioned also did
not reveal an international value standard. This was relevant because it showed the gap
in the literature of the international HEI value standard absence.
Secondary Effects of HEIs
The initial "secondary effect" of HEIs were based upon economics. The term
"Glonacal" was coined meaning global + national + local = Glonacal (Marginson, Kaur,
& Sawir, 2011). "Glonacal" is understood as a symbiotic relationship where a task on the
global side of HEIs affected a task on the national side of HEIs, and so on. More
specifically, when university X has received recognition in a global capacity (receiving
global rankings, engaging in international research, having a certain amount of
international students) the national component (government) and local component
(investors) are affected through university creditability and/or performance (Marginson,
Kaur, & Sawir, 2011, p. 14).
The second "secondary effect" of HEIs were concerning national security.
Dumitru and Feararu (2018) argued that the National Security tenants formed around
economic, political, military, social, and environmental sectors. The political and social
sectors maintained the ideological, institutional, and physical stability of the state
44
(Dumitru & Feararu, 2018, p. 94). Therefore, the HEIs would be categorized under the
political sector as they are an institution. Dumitru and Feararu (2018) asserted that
security was measured when the state/organization/system operated without insecurity for
a certain amount of time concerning history (p. 96). Bolborici (2016) provided a
historical context of national security with definitions of the Cold War, such as Buzan's
analysis of security affecting human communities in five manners. The five manners
included military, political, economic, societal, and environment. The United Nation's
definition asserted that security must take on a collective and collaborative security
approach in the context of international security to restore peace and security in the
global community (Bolborici, 2016, p. 161).
History of HEI Accreditation
The following section was based on the History of HEI Accreditation. The
History of HEI Accreditation was based on three sections. The first section is Global
HEI Accreditation. The second section is U.S HEI Accreditation. Finally, the third
section is China HEI Accreditation.
Global HEI Accreditation
From a global perspective, the history of HEIs and accreditation was still a new
concept. Therefore, the contemporary notion of HEIs needing accreditation for
validation of legitimacy pointed to the gap in the academic literature that there was not an
agreed-upon international value standard to refer to when comparing the United States of
America and China, or any other HEI located throughout the world. Globally, "The
United Nations' Conference on Sustainable Development Rio +20" developed the Higher
45
Education Sustainability Initiative (HESI). Likewise, the United Nations created the
Sustainable Development Goals (SDG) for our Global Community. The SDG Number
Four of 2016 underscored the equitable quality of education and lifelong learning,
including the importance of higher education, quality assurances, regulations, and
policies (Education 2030: Incheon Declaration, 2016). Therefore, the United Nations
recognizes the need for HEIs and accreditation holistically; but does not have a global
formula, and/or evaluation for HEIs to become accredited and does not have periodic
check-ins on the HEIs accreditation status. Likewise, the European Union has supported,
along with the "Erasmus+Programme," "The European Association for Quality
Assurance in Higher Education" (ENQA). The establishment of the association began in
1994-1995. The association developed overtime making various recommendations,
including the Bologna Declaration. The European Minister of Education created the
Bologna Declaration (The European Association for Quality Assurance in Higher
Education, n.d). The Bologna Declaration was the first standard set in higher education
for the EU members that were part of the association (The European Association for
Quality Assurance in Higher Education, n.d).
The ENQA contained accreditation guidelines for quality assurance that the
European Union countries' Higher Education Institutions should follow. Again, there
was no compulsory standard formula and/or evaluation that the ENQA has created for
HEIs (The European Association for Quality Assurance in Higher Education, n.d).
The section of Global HEI Accreditation in the context of an international value
standard emergence was nonexistent. This proved to be noteworthy because it solidified
46
the gap in the literature. The non-presence of an international value standard in the
section of Global HEI Accreditation provided more evidence for purposes of this
research, as a credible foundation to create a standard.
United States HEI Accreditation
Bell (2017) explained that the history of United States accreditation began at the
end of the Gilded Age (1877-1900) and through the Progressive Period 1897-1920 where
the first oversight and authority organizations were The National Association of State
Universities (1895), the Association of American Universities (1900), the General
Education Board (1902), and the Carnegie Foundation for the Advancement of Teaching
(1905) (pp. 68-69). Paton, Fitzgerald, Green, Raymond, and Borchardt (2014) defined
accreditation as a means of self-regulation and peer review adopted by the educational
community where the process was intended to strengthen and sustain the quality and
integrity of higher education providing public confidence and minimizing external
control (p. 46).
The United States Department of Education provided authority and powers to six
regional accreditors: (a) Middle States Commission on Higher Education (MSCHE); (b)
New England Association of Schools and Colleges Commission on Institutions of Higher
Education (NEASC-CIHE); (c) North Central Association Higher Learning Commission
(NCA HLC); (d) Northwest Commission on Colleges and Universities (NWCCU); (e)
Southern Association of Colleges and Schools Commission on Colleges (SACSCOC); (f)
Western Association of Schools and Colleges College and University Commission
(WASC).
47
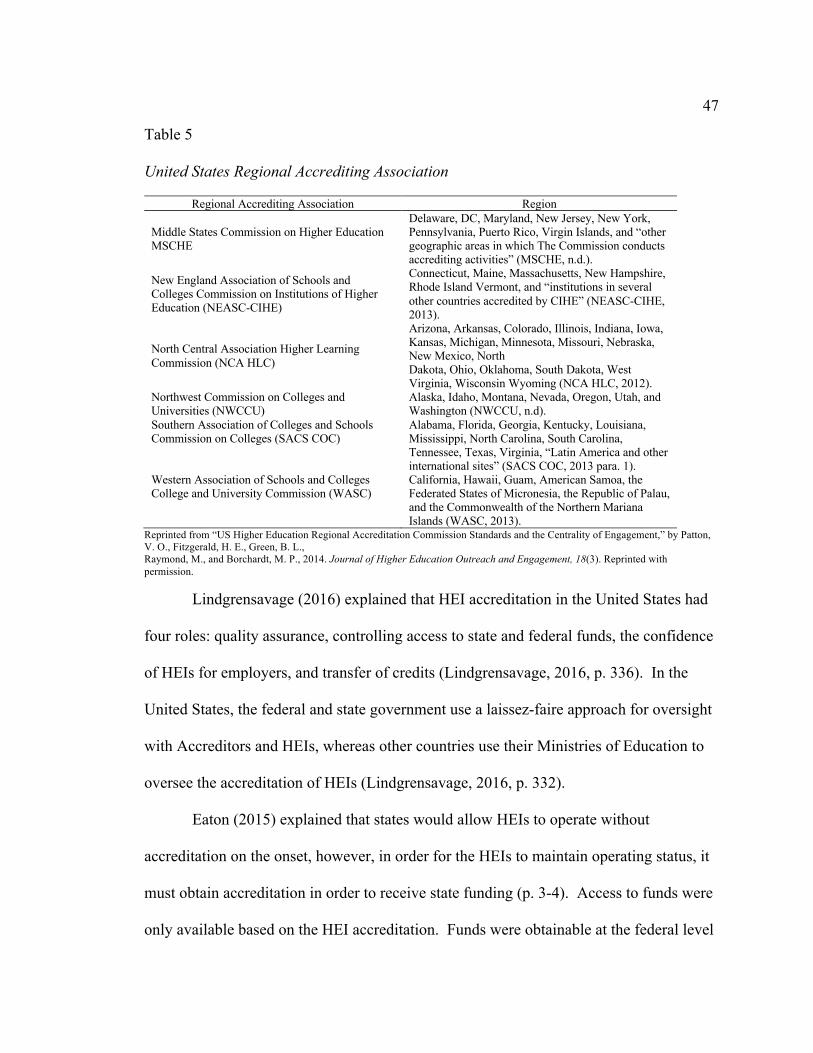
Table 5 United States Regional Accrediting Association
Regional Accrediting Association Region
Middle States Commission on Higher Education MSCHE
Delaware, DC, Maryland, New Jersey, New York, Pennsylvania, Puerto Rico, Virgin Islands, and “other geographic areas in which The Commission conducts accrediting activities” (MSCHE, n.d.).
New England Association of Schools and Colleges Commission on Institutions of Higher Education (NEASC-CIHE)
Connecticut, Maine, Massachusetts, New Hampshire, Rhode Island Vermont, and “institutions in several other countries accredited by CIHE” (NEASC-CIHE, 2013).
North Central Association Higher Learning Commission (NCA HLC)
Arizona, Arkansas, Colorado, Illinois, Indiana, Iowa, Kansas, Michigan, Minnesota, Missouri, Nebraska, New Mexico, North Dakota, Ohio, Oklahoma, South Dakota, West Virginia, Wisconsin Wyoming (NCA HLC, 2012).
Northwest Commission on Colleges and Universities (NWCCU)
Alaska, Idaho, Montana, Nevada, Oregon, Utah, and Washington (NWCCU, n.d).
Southern Association of Colleges and Schools Commission on Colleges (SACS COC)
Alabama, Florida, Georgia, Kentucky, Louisiana, Mississippi, North Carolina, South Carolina, Tennessee, Texas, Virginia, “Latin America and other international sites” (SACS COC, 2013 para. 1).
Western Association of Schools and Colleges College and University Commission (WASC)
California, Hawaii, Guam, American Samoa, the Federated States of Micronesia, the Republic of Palau, and the Commonwealth of the Northern Mariana Islands (WASC, 2013).
Reprinted from “US Higher Education Regional Accreditation Commission Standards and the Centrality of Engagement,” by Patton, V. O., Fitzgerald, H. E., Green, B. L., Raymond, M., and Borchardt, M. P., 2014. Journal of Higher Education Outreach and Engagement, 18(3). Reprinted with permission.
Lindgrensavage (2016) explained that HEI accreditation in the United States had
four roles: quality assurance, controlling access to state and federal funds, the confidence
of HEIs for employers, and transfer of credits (Lindgrensavage, 2016, p. 336). In the
United States, the federal and state government use a laissez-faire approach for oversight
with Accreditors and HEIs, whereas other countries use their Ministries of Education to
oversee the accreditation of HEIs (Lindgrensavage, 2016, p. 332).
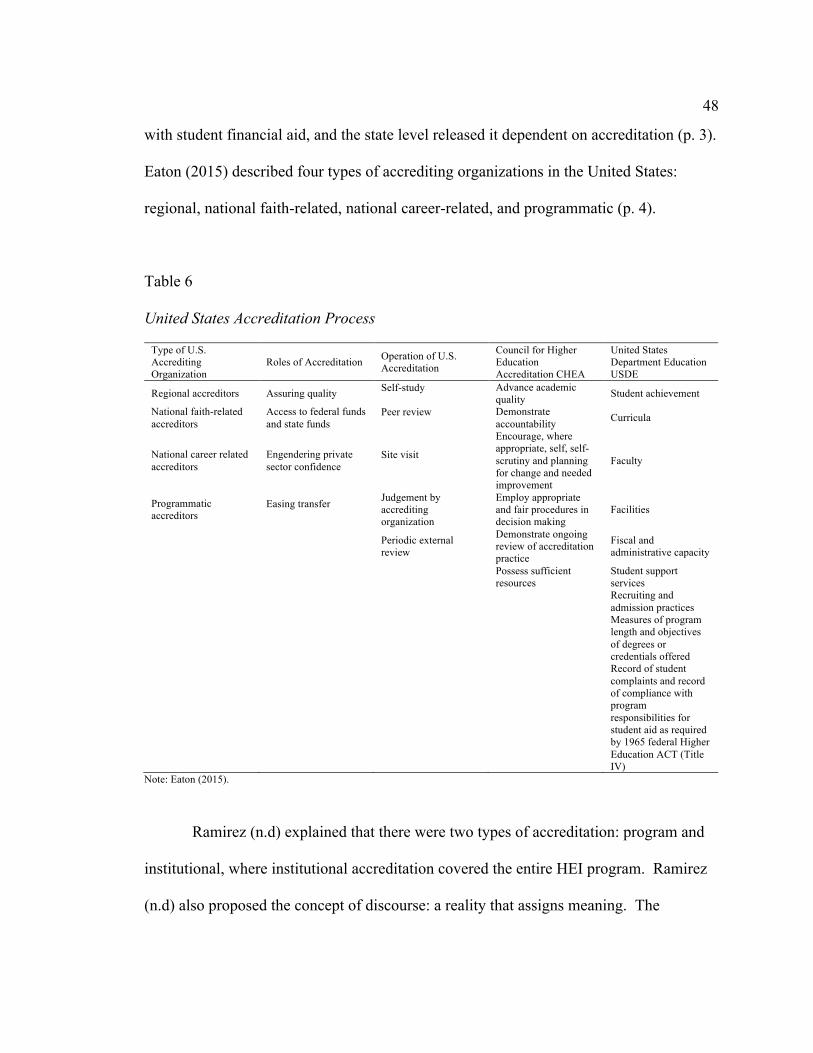
Eaton (2015) explained that states would allow HEIs to operate without
accreditation on the onset, however, in order for the HEIs to maintain operating status, it
must obtain accreditation in order to receive state funding (p. 3-4). Access to funds were
only available based on the HEI accreditation. Funds were obtainable at the federal level
48
with student financial aid, and the state level released it dependent on accreditation (p. 3).
Eaton (2015) described four types of accrediting organizations in the United States:
regional, national faith-related, national career-related, and programmatic (p. 4).
Table 6 United States Accreditation Process
Type of U.S. Accrediting Organization
Roles of Accreditation Operation of U.S. Accreditation
Encourage, where appropriate, self, self-scrutiny and planning for change and needed improvement
Faculty
Programmatic accreditors
Easing transfer Judgement by accrediting organization
Employ appropriate and fair procedures in decision making
Facilities
Periodic external review
Demonstrate ongoing review of accreditation practice
Fiscal and administrative capacity
Possess sufficient resources
Student support services
Recruiting and admission practices
Measures of program length and objectives of degrees or credentials offered
Record of student complaints and record of compliance with program responsibilities for student aid as required by 1965 federal Higher Education ACT (Title IV)
Note: Eaton (2015).
Ramirez (n.d) explained that there were two types of accreditation: program and
institutional, where institutional accreditation covered the entire HEI program. Ramirez
(n.d) also proposed the concept of discourse: a reality that assigns meaning. The
49
connection of discourse to HEIs and accreditation was the accreditation process and
quality assurance, for example, text (Ramirez, n.d., p. 945). Ryan (2016) explained that a
common theme of accreditation for HEIs was quality assurance and standards of how
accreditation authorities operated, whereby some were voted on by boards, and some
adhered to private agreements (p. 2).
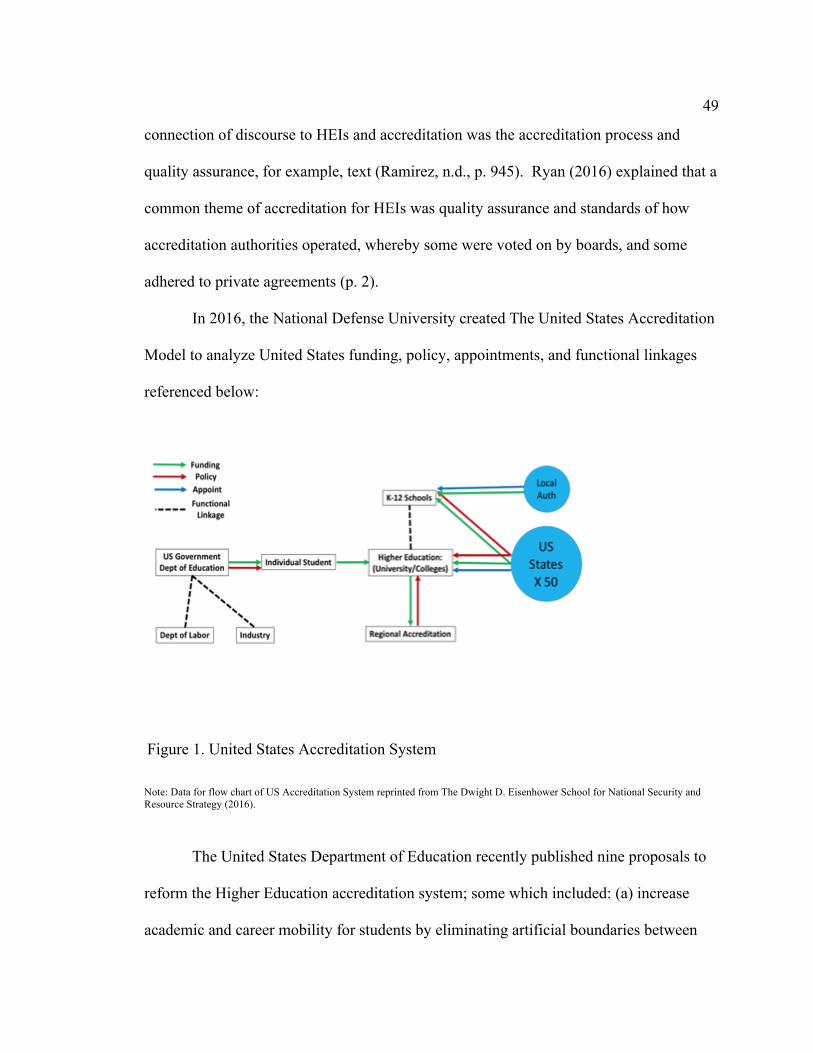
In 2016, the National Defense University created The United States Accreditation
Model to analyze United States funding, policy, appointments, and functional linkages
referenced below:
Note: Data for flow chart of US Accreditation System reprinted from The Dwight D. Eisenhower School for National Security and Resource Strategy (2016).
The United States Department of Education recently published nine proposals to
reform the Higher Education accreditation system; some which included: (a) increase
academic and career mobility for students by eliminating artificial boundaries between
Figure 1. United States Accreditation System
50
institutions due to the credential levels an institution offers or the agency that accredits
the institution or its program; (b) reward institutional value-added, not student selectivity;
and (c) streamline and clarify the Departments accreditor recognition process (Rethinking
higher education accreditation reform, 2018). The University of California, Los Angeles,
created The Higher Education Research Institute (HERI) who now is using Cooperative
Institutional Research Program (CIRP) Surveys in accreditation and "is now developing
guides which align CIRP survey results with all six regional accrediting agencies" (Using
CIRP Surveys in Accreditation, n.d, para. 15).
The process of United States HEI Accreditation as it related to online universities
was not different from brick and mortar universities. For example, Walden University's
institutional accreditation came from the Higher Learning Commission (HLC). Southern
New Hampshire University institutional accreditations came from the New England
Commission of Higher Education. Finally, Western Governors University accreditations
came from the Northwest Commission on Colleges and Universities.
The literature concerning United States HEI accreditation in the context of
providing an international value standard was nonexistent. Within the United States,
there are various accreditation models that HEIs may use. Therefore, the academic body
of literature proves that the United States HEIs did not engage in an HEI standardized
national value system or HEI international standard value system.
China HEI Accreditation
Guangli (2016) explained that China's accreditation system was established in
1986 by the State Education Commission with the Chinese Communist Party and leader
51
Deng Xiaoping. Prior to Xiaoping's reign, Mao Zedong ruled up until 1976, using
Maoism, which was the political philosophy of Communism. Due to the massification of
accreditation, the government transitioned to a blended form of government and private
operation. The Higher Education Law of 1998 established in its Article 44 that HEIs
must provide access for supervision and evaluations by education administers within their
departments (Guangli, 2016, p. 44). The referenced law of 1998 underscores how HEIs
in China follow communist government policy.
In Hong Kong, universities were providing accreditation through self-
accreditation, which affected the distance education learning community. In 2007, there
was a new policy passed for institutional audits titled 'Accreditation of Academic and
Vocational Qualifications Ordinance' (Jung et al., 2011, p. 66). Dill (2015) asserted that
the Hong Kong Academic Audit process must clarify their necessary tasks for HEIs.
Shenzhen University, which is part of the Guangdong Province in China, received
its accreditation from the State Council of the People's Republic of China (School Profile
(2013) contended that the increase in cost for HEI has led to poverty in China. Higher
education was supposed to be a gateway that alleviated poverty and improved social
69
mobility (Li et al., 2013). The Chinese government made attempts to help poverty-
stricken students, where they set-up special state grants of 800 million yuan in 2005 and
in 2009 provided merit-based aid in the amount of Y9.3 billion yuan (Li, Meng, Shi, and
Wu, 2013, p. 974). However, findings indicated that campus poverty was a major issue;
22% of college students lived in poverty, 32% were rural areas, and 28% were from West
China (Li, Meng, Shi, & Wu, 2013, p. 988).
Value Differences Between Undergraduate Degrees in China and the United States
on alumni, award, HICI, N&S and PUB
Turner and Lindsteadt (2012) researched alumni and value qualitatively and found
the intersection through networking. There were many rich pieces of advice provided
such as leveraging an existing internship and to build relationships to secure employment
(Turner and Lindsteadt, 2012). Thomas (2017) addressed value and award in the context
that HEIs are becoming increasing competitive whereby by academic awards are
important. Academic awards were classified at the M level embracing equity, entitlement
and expectation (Thomas, 2017). Giuffrida, Abramo and D’Angelo (2019) research
suggested that all citations were not valued with the same weight. A major portion of the
finding were due to the technology that data mined the information. Likewise, findings
concluded that citation “n” are worth more than “n-1” (Giuffrida et al., 2019). Niles,
Schimanski, Mckiernan and Alperin (2020) researched publishing decisions of
academics. These decisions were based on variables such as publication rate, publication
importance factors and perceptions (Niles et al., 2020). Alves (2010) posited that value
and higher education index can be measured through perception. Alves analyzed a
70
common thread within the body of literature that perceived value of higher education is
based on benefits and sacrifices where variables used to measure it are price, quality and
experience (2010).
After extensive review, it can be seen that the literature did not answer the second
proposed research question for this research “do relationships exist between or among the
variables alumni, award, HiCi, N&S, PUB, and value from public 4-year universities in
China and the United States between 2009–2019?” The research higher education value
factors explored the “why” there is a difference in value between undergraduate degrees
for accredited public 4–year universities in China and the United States The research was
needed because the academic literature provided irregularities on value and the higher
education value factors chosen whereby the research question addressed with evidence-
based research the differences in value between undergraduate degrees for accredited
public universities in China and the United States and if they have a significant effect on
them.
Measures of Effectiveness in HEI
The Dwight D. Eisenhower School for National Security and Resource Strategy
(2016) explained that measures of effectiveness are current laws and policies that an
organization can use to evaluate itself. For example, the United States HEIs may
evaluate itself using Title IX, Federal Student Aid, and data collection methods. As the
literature review has revealed, there was not an international value standard for HEIs.
Due to the nonexistence of an international value standard, there equally did not exist
71
current law or policies that the United States HEI and China HEIs could have used to
evaluate value or quality.
Therefore, for purposes of this research, the measures of effectiveness, pertained
to "how good or correlated" the independent variables of "cost," and "utility" were to the
dependent variable "value." The dependent variable for the study was value, as defined
in a general sense. The independent variable for this study was cost (the price of a 4-year
undergraduate degree) and utility (employment rate and earnings rate) of recent graduates
from respective HEIs. Likewise, the measure of effectiveness measured how good or
correlated the independent variables of alumni, awards, HiCi, N&S and PUB were to the
dependent variable value. The measures of effectiveness were important because it
solidified, within an international context, how the United States and China HEIs could
evaluate their value. This was statistically analyzed by using excel with a two-population
t test and multiple-variable regression.
Conclusion
As was demonstrated throughout the literature review, the gap in the academic
literature was the notion that there was not an international value standard to measure
what HEIs have agreed on, and/or can use as a comparison measurement of value, and
specifically for the countries of the United States and China. Within the HEI community,
accredited institutions and countries believed that value was essential. The definition of
value for HEIs varied along with how to quantify and explain value. Likewise, with
countries having different government approaches to policies and regulations for
institutions, this added to the diversity on the topic. Transitioning into Chapter 3, the
72
reader will begin to read about the research design and methods of the study. The
methodology will describe a quantitative analysis approach using an international value
standard through the lens of a two-population t-test and multiple regression. Chapter 4
will analyze data collection and results. Finally, Chapter 5 will provide interpretations,
recommendations, and social change implications.
73
Chapter 3: Research Methodology
Introduction
One intention that social scientists had through the process of research
methodology was to analyze variables, seek answers to research questions, and test
hypotheses. Research methodology also provided researchers the opportunity to link
research approaches to data analysis, and ultimately to discover facts. The particular
methodology chosen for this research was a comparative quantitative study through a
two-population t-test and multiple regression. The two-population t-test measured the
statistical significance using the p-value, while the multiple regression measured the
Pearson Correlation Coefficient to test the level of significance through the strength of
correlations.
The study's purpose was to define the value of undergraduate education and
fashion an international value standard through a comparative analysis of China and the
United States. There were many studies on the value of higher education; however, there
was a gap in the literature that did not address a quantitative comparative approach of
these themes (Zha, 2011; Bernhard, 2011). The research design was modeled after a
quantitative non-experimental correlational research design as the variables were
measured and not manipulated (Burkholder, 2106). This study was based on a blend of
theoretical frameworks that included Roel's (2010) VTT and Ginsberg, Somekh, and
Schlesinger's (2018) decision tree modeling through cost utility analysis. There was a
comparative analysis of public four-year undergraduate HEIs from the U.S and China.
The sample included HEIs from 2014 based on data from the United States Department
74
of Education and China's Ministry of Education. This study was based on secondary
quantitative data from multiple sources. Data analysis was determined through a two-
population t-test and multiple regression analysis.
Chapter 3 began with sections on Research Design. It was then followed by
additional sections: Rationale, Methodology, Population, Sampling Procedures, Data
Collection, Instrumentation and Materials, International Value Standard, Value, Cost,
Employment Rate, Earnings Rate, HEI List, Data Analysis Plan, Research Questions 1
and 2, Threats to Validity, Construct Validity, Ethical Procedures, and finally a
Summary.
Research Design and Rationale
The research design for this study was a quantitative non-experimental
correlational research design as the variables were measured and not manipulated through
a comparative framework. The quantitative approach was selected because it helped
determine if a relationship existed between the variables of value, utility (as defined by
earnings and employment), and cost. The quantitative analysis of the data created an
instrument (an international value standard) to measure the potential relationship between
utility and cost, driving toward a measure of value. Upon determining if the relationship
existed, the next step was to compare the driving factor of the difference using five set
variables through multiple regression. All data used was secondary. This choice was the
best and most cost efficient in terms of time and funding. It also served as a time-efficient
method for the research.
75
Data saturation was required by the original researchers upon collection and
therefore, with this research as a quantitative secondary analysis, I agreed with the
original researchers, and data saturation was met. Rigor was required by the original
researchers upon collection and therefore, with this research as a quantitative secondary
analysis, I agreed with the original researchers, and it was met. There was
methodological appropriateness with the quantitative secondary analysis because the two-
population t-test and multiple regression analysis were appropriate for this quantitative
study.
The comparative approach of the United States and China quantitative data
allowed me to create the international value standard. For this study, another reason the
quantitative approach was appropriate was for the needs of objectivity and controlling for
bias. With statistical analysis, the I had to note biases such as sampling biases and
response biases. This study used secondary data and the potential for biases was
addressed and mitigated.
I considered two other research methods for this study. The first was a qualitative
approach and the second was mixed methods. Qualitative research includes 10 common
methods: action, case study, ethnography and critical ethnography, evaluation, grounded
theory, narrative, participatory action, phenomenology, and practitioner; each of them
considers peoples' experiences and perspectives (Ravitch & Carl, 2016). A qualitative
approach would have required both the United States and China HEIs individuals'
experiences and perspectives as it related to value. Although qualitative studies add to
the academic body of literature in a profound manner, the "international value standard"
76
would have been considered a subjective measure when approached from a qualitative
manner. As Ravitch and Carl (2016) described qualitative bias: "in qualitative research,
understanding and confronting the values and beliefs underlying decisions and
approaches is vital and at the heart of the inquiry itself " (p. 13). Therefore, the
qualitative approach was not aligned with the research goals, including the research
questions and choice of secondary open sourced data.
Mixed-methods research is considered the "integration or mixing the quantitative
and qualitative component within a study" (Plano, Clark, & Ivankova, 2016, p. 9). There
are different approaches as to how "mixing" occurs. However, the fact with mixed
methods research was there are at least two research questions: one that is quantitative in
nature; the second that is qualitative in nature. Therefore, mixed methods was not
aligned with the research goals, including the research questions and choice of secondary
open sourced data.
Methodology
For this research effort I used the quantitative methodological approach which
included the independent t-test and a multiple regression.
Population
A population is the representation of the entire pool where the sample is derived
(Agresti & Finlay, 1999). The population for this study was all 4-year public higher
education institutions in the world. Therefore, the sample institutions were drawn from
two countries: the United States and China. The study population for the United States
consists of 4,724 4-year public higher education institutions in total ((National Center for
77
Education Statistics, 2014; The Carnegie Classification of Institutions of Higher
Education, 2010). This population represented 50 states and included the United States
territories such as American Samoa, Federated States of Micronesia, and Guam.
According to The National Center for Education Statistics and The Carnegie
Classification of Institution of Higher Education, the United States HEI population is
represented by private, public, research, 2-year, and 4-year institutions, and combinations
thereof (National Center for Education Statistics, 2014; The Carnegie Classification of
Institutions of Higher Education, 2010).
The listed population for China was 2,246 HEIs. The HEI list was diverse and
categorized the HEIs into 31 sections, some of which include Beijing, Hubei, and
Chongqing. According to the Ministry of Education in China, the HEI China population
represented levels of learning at the regular and junior college level (Ministry of
Education of the Peoples Republic of China, n.d.).
Sample Size and Sampling Procedures
The sampling procedures for this study aligned with the sampling techniques used
by the original researchers for both the United States and China HEIs. Furthermore, the
HEIs of the sample provided the highest probability of mirroring and representing the
populations as best as possible. Therefore, I publicly accessed the data through the open
sources of two secondary HEI lists; one for the United States Department of Education
(2014) and the second for China Ministry of Education (2014). The sampling technique
for the United States HEI list was based on the annual institutional characteristics of all
postsecondary institutions in the United States and its territories (NCES Handbook of
78
Survey Methods, 2019). The sampling technique for the China HEI list was based on all
of China’s colleges and universities (Ministry of Education of the Peoples Republic of
China, n.d.). For both the United States and China sampling techniques I agreed with the
original researchers sampling procedures. I chose the year 2014 as the sample year for a
number of reasons. First, the data were available for both the United States and China.
Second, 2014 is the midpoint between the 2009–2019 range. Third, the 2014 data were
considered a census of the HEIs. Finally, the power analysis, was based on assumptions:
one which was that the sample was random (Statistical solutions, n.d). Given that the
referenced sample data was categorized as census in nature a power analysis was not
applicable for this research effort.
The defined sample size for the United States was 4-year public HEIs from the
United States HEI list. The United States sample size was appropriate because the data
were an open source secondary option from 2014. The United States list revealed that for
the 2013–14 year, there was a total of 4,724 degree granting HEIs by control and level of
institutions and state or jurisdiction. The source of the HEI list information came from
The Carnegie Classification of Institution of Higher Education. The common variable
between the list from the Department of Education and The Carnegie Classification of
Institution of Higher Education was “BASIC2010” with the number 15–32. The numbers
15–32 indicated that the United States HEIs were in fact United States public 4-year
institutions. The sample size therefore became 691 United States HEIs for all 50 states
and its territories.
79
The defined sample size that I choose for China was 4-year public HEIs from the
China HEI list as discussed earlier. The China sample was appropriate because the data
were an open-source secondary option from 2014. The China HEI list indicated that for
the 2013–14 year, there were 2,246 Regular Colleges and Universities (Ministry of
Education of the Peoples Republic of China, n.d). The process to clean the 2013–2014
China HEI list was based on taking the junior colleges that did not have a label and
labeling them as "public." Next, regular colleges that were not labeled were labeled
public. This decision was based on the fact that China has a communist government.
junior colleges were assumed as not 4 years e.g. vocational, technical. Therefore, the
sample size of public 4-year institutions for China was 777. The final list was labeled as
China’s HEIs.
Data Collection
The secondary data were appropriate as a source for this research design.
Secondary data were just as important as primary data because the quantitative data were
already vetted. The data came from official government funded sponsorships within the
United States and/or China or they were from international organizations whose data
were reliable, relevant and had principals that govern their statistical methodology (Data,
n.d). Likewise, the secondary data were less time consuming as it allowed for easy and
free access to open sources (Babbie, 2017). This was the case between the United States
and China where travel was not needed. In this study I merged secondary quantitative
data sets together based on the United States and China.
80
The first step I took in the procedure for data collection was the creation of a
master data folder. The second step was to store all secondary data files in the master data
folder. The third was to create an excel master spreadsheet with a tab titled data
collection beginning with the first column as: variable names, variable labels, name of
website and types of secondary sources. See Table 7 below.
Table 7 Data collection method
Variable name Variable Label Name of Website Type of Secondary Source U.S. Employment Rate USEMR U.S. Bureau of Labor
Statistics Government
U.S. Earning Rate USERR United States Census Bureau
Government
U.S. Cost USC Digest of Education Statistics 2014
Government
U.S. Alumni USAL The Academic Rankings of World Universities website
International Organization
U.S. Award USAW The Academic Rankings of World Universities website
International Organization
U.S. HiCi USHI The Academic Rankings of World Universities website
International Organization
U.S. N & S USNS The Academic Rankings of World Universities website
International Organization
U.S. PUB USPUB The Academic Rankings of World Universities website
International Organization
U.S. Value USV Calculated Calculated China Employment Rate CEMR Statista Government China Earning Rate CERR National Bureau of
Statistics of China Government
China Cost CC Higher Education in China
Ebook
China Alumni CAL The Academic Rankings of World Universities website
International Organization
China Award CAW The Academic Rankings of World Universities website
International Organization
China HiCi CHI The Academic Rankings of World Universities website
International Organization
China N & S CNS The Academic Rankings of World Universities website
International Organization
China PUB CPUB The Academic Rankings of World Universities website
International Organization
China Value CV Calculated Calculated Note. Variable titles were used exclusively by the research approach.
81
Data collection for international value standard.
I downloaded the referenced data set of the United States employment rate by
collecting it from the United States Bureau of Labor Statistics website. I then transferred
the data into the master excel spreadsheet and created a tab titled United States
employment. The data were organized with Column A labeled as year beginning with
2009 through 2019, Column B labeled as United States employment and Column C
labeled as United States unemployment (Databases, Tables & Calculators by Subject,
n.d.). Next, I downloaded the referenced data set of China’s employment rate by
collecting it from the Statista website. I transferred the data into the master Excel
spreadsheet and created a tab titled China Employment. The data were organized with
Column A labeled as year beginning with 2009 through 2019, Column B labeled as
China employment (Share of employed people in the Chinese population from 2009 to
2019, n.d.).
Then, I downloaded the referenced data set of United States earning rate by
collecting it from the United States Census Bureau website (Income and poverty in the
United States 2018, 2020). I transferred the data into the master excel spreadsheet and
created a tab titled United States earning. This data were organized with Column A
labeled as year beginning with 2009 through 2019, Column B labeled as United States
earning whereby the data were set up for further cleaning and analysis. I downloaded the
referenced data set of China earning rate by collecting it from the National Bureau of
Statistics of China website (Annual by province, n.d.). I then transferred the data into the
master excel spreadsheet and created a tab titled China earning. The data sets were
82
organized with Column A labeled as region, Column B labeled as 2019 Yuan, Column C
labeled as 2019 USD and through 2009. The data were set up for further cleaning and
analysis.
I downloaded the referenced datasets of United States cost by collecting it from
the Digest of Education Statistics 2014 website (National Center for Education Statistics,
2014). I then transferred the data into the master excel spreadsheet and created a tab
titled United States cost. The data were organized with Column A labeled year and
Column B United States cost. The data were set up for further cleaning and analysis.
I then downloaded the referenced datasets of China cost by collecting it from the
ebook Higher Education in China for China’s data (Gu, et al., 2019). The data were
organized with Column A labeled year and Column B United States cost and Column C
China cost. The data was set up for further cleaning and analysis.
The aforementioned data’s original intention was not for an “international value
standard.” Therefore, two more tabs were created in the master excel spreadsheet; United
States value and China value. Each tab had columns labeled United States value and
China value. The columns were labeled as the following: year, value, cost, employment
and earnings. The international value standard as previously noted were calculated using
the following equation:
V= (EMR*ERR)/C
83
Afterwards, a new excel spread sheet was created with six tabs: t-test, United States
multiple regression, China multiple regression, earnings data, employment data and cost
data. The data from the master excel spread sheet were transferred into it.
Data collection for two-population t-test.
Organization continued within the master excel spreadsheet by creating another
tab labeled “T-test Output.” The first set of columns were labeled as the following:
United States year, United States value, employment, earnings and cost. Placed below
the United States data, was the China data, labeled as the following: China year, China
value, employment, earnings and cost. The data were set up for further cleaning if needed
and analysis through excel for the two-population t-test.
Data collection for multiple regression analysis.
The procedure for data collection for the variables alumni, award, HiCi, N&S, and
PUB all practiced the same the method. The referenced variables for the multiple
regression were collected from the Academic Rankings of World Universities website for
both the United States data and China data and stored in the data folder as a raw data
excel file (Academic Rankings of World Universities 2019, n.d.). I then transferred the
data after cleaning and sorting into the master excel spreadsheet and created a tab titled
United States multiple regression and China multiple regression.
Instrumentation and Materials
The research method for this study was quantitative in nature. By applying
quantitative methods, I first applied the international value standard when calculating the
two-population t-test. The dependent variable for the research study was value (v). The
84
value of HEIs was determined by taking utility and dividing it over cost (Mihram &
Murphy, 2008; Resnick, Tosteson, Groman, & Ghogawala, 2014). As was previously
discussed within the literature review chapter, value as it relates to higher education had
multiple meanings. For example, Chapman and Lindner (2016), higher education was
discussed through the context of corruption which therefore showed how higher
education was devalued. Hongjuan (2018) analyzed higher education institutions by
looking at their transition from the tradition model of four-year brick and mortar lectures
to learning institutions. Finally, Bartlett, Han, and Bartlett (2018) studied Chinese
students studying abroad in the United States and the value of their degree finding
different motives.
Instrumentation and two-population t-test.
The two-population t-test specifically was used to determine if there is a
difference in calculation between the United States and China’s population. The two-
population t-test had five steps to it: assumption, hypotheses, test statistic t-test, p-value
and conclusion. The p value analysis cited that the smaller the p number the greater the
proof in opposition of the null hypothesis and in support of the alternative hypothesis
(Agresti and Finlay, 1999, p. 184). Reliability in the most basic definition was the ability
to gauge consistency in the research and to have the research repeatable (Babbie, 2017, p.
149). There was evidence for reliability with this research as it had the ability to be
repeatable with likely similar results. Therefore, it can continue on into the 2020
secondary databases. If the 2020 numbers were not available (as some were not with the
current research), the researcher would follow the same path averaging data and using the
85
inflation calculator to obtain data as a predictive means. Validity in the most basic
definition is the test that gauges if the research evaluated was what it was supposed to be
(Babbie, 2017, 152). For this research the validity measurement was based on value. The
value factor was valid because utility and cost were variables that significantly affected
HEIs and met the literature-supported definition of value.
Instrumentation and multiple regression analysis.
After, the two-population t-test was performed, a multiple regression was
performed. The multiple regression analysis was the analysis of the simultaneous
relationships among several variables (Babbie, 2017, p. 440). Therefore, the multiple
regression in this research used the variables: alumni, award, Hici, N&S and PUB. Refer
to the Chapter 2 discussion on variable identification and explanation. The multiple
regression with the international standard value provided the level of significance through
the strength of correlation.
Operationalization
In research, operationalization can be categorized in four ways; nominal, ordinal,
interval, or ratio (Babbie, 2017). For purposes of this research all data were categorized
as ratio data and was shown in both Table 8 and 9.
Table 8 Variable categorization and nomenclature U.S.
Variable name Measurement Variable Typology U.S. Employment Rate (USEMR) Ratio Independent U.S. Earning Rate (USERR) Ratio Independent U.S. Cost (USC) Ratio Independent U.S. Alumni (USAL) Ratio Independent U.S. Award (USAW) Ratio Independent U.S. HiCi (USHI) Ratio Independent U.S. N & S (USNS) Ratio Independent
86
U.S. PUB (USPUB) Ratio IndependentU.S. Value (USV) Ratio Dependent
Note. Variable titles were used exclusively by the research approach
Table 8 headings provided the variable name, measurement and variable
typology. An example of a row from Table 8 was USERR, ratio and independent. A
second example of a row from Table 8 was USHI, ratio and independent. A third
example from Table 8 was USV, ratio and dependent.
Table 9 Variable categorization and nomenclature China
Variable name Measurement Variable Typology China Employment Rate (CEMR) Ratio Independent China Earning Rate (CERR) Ratio Independent China Cost (CC) Ratio IndependentChina Alumni (CAL) Ratio Independent China Award (CAW) Ratio Independent China HiCi (CHI) Ratio Independent China N & S (CNS) Ratio IndependentChina PUB (CPUB) Ratio Independent China Value (CV) Ratio Dependent
Note. Variable titles were used exclusively by the research approach.
Table 9 headings provided the variable’s name, measurement, and variable
typology. An example of a row from Table 9 was CERR, ratio and independent. A
second example of a row from Table 9 was CHI, ratio and independent. A third example
from Table 9 was CV, ratio and dependent.
The ratio data for this research had a specific number assigned to the variable. An
example of ratio data for this research would be the cost of a college education; whereby
I was able to gather data for a 4-year public accredited United States HEI education and
China HEI education. Specifically, the ratio variable 2014 United States cost was an
87
independent number equaling $18,682 while the ratio variable 2014 China cost was an
independent number equaling $706.91.
Although it may seem contradictory, the international value standard created in
this research equally was categorized as ratio. There was a number assigned to the
variable value by the three ratio numbers of cost and utility. A value in this research can
be either -0 to positive 0 and therefore this translated to a meaning that there can be a
value attached to HEI and higher education in general. All aforementioned variables
maintained consistency within the referenced research. In other words, the independent
variables and dependent variables did not switch as the research questions unfolded.
.
Data Analysis Plan
The data analysis plan had three parts: the international value standard, two-
population t-test, and then a multiple regression. As previously noted, all variables were
organized and then analyzed through Microsoft Excel and SPSS. Some of the secondary
data sets were provided “ready to use” while other data sets needed cleaning and sorting
for this particular research. There were no covariates or cofounding variables used for
this research.
Data analysis plan and international value standard.
The United States earning dataset required cleaning and screening procedures.
Therefore, I used an inflation calculation to obtain a full decade of data (Income and
poverty in the United States 2018, 2020). The China earning data set required cleaning
and screening procedures. Therefore, I obtained the entire China earning dataset (2009–
88
2019) by taking the average of each year and then used an inflation calculator with
averaged numbers obtained. The data were then consolidated further with Column A
labeled as year beginning with 2009 through 2019 and Column B labeled as China
earning (Annual by province, n.d.). The United States cost dataset required cleaning and
screening procedures. Therefore, in order to obtain all years (2009–2019) of the dataset I
used an inflation calculator (National Center for Education Statistics, 2014). The China
cost dataset required cleaning and screening procedures. Therefore, to obtain all years
(2009–2019) of the China dataset I first converted the 2014 cost from Yuan to USD and
then used an inflation calculator (Gu, et al., 2019). The United States and China datasets
for alumni, awards, HiCi, PUB and N&S required cleaning and screening procedures.
Therefore, for 2009 I took the average of the data provided for Alumni (both United
States and China) and came up with the calculated 2009 ratio number. I then repeated
this process for the other four variables for both the United States. and China for 2009
and then repeated this process for 2010 through 2019 (Academic Rankings of World
Universities 2019, n.d.).
Data analysis plan and two-population t-test.
A two-population t-test was performed to determine the difference in calculation
between the United States and China’s HEIs. All data were organized and cleaned. At
this point, was able to run a two-population t-test in Microsoft Excel. This portion of the
data analysis used both countries data simultaneously. The results were interpreted using
the p value. If the p value is less than 0.05 then I will reject my null hypothesis and if it
is greater than 0.05 then I will fail to reject my null hypothesis.
89
The first research question is: “To what extent if any is there a difference in value
between undergraduate degrees for accredited public 4-year universities in China and the
United States between 2009–2019?” The null hypothesis is: “The differences in value
between undergraduate degrees for accredited public 4–year universities in China and the
United States are equal.” The alternative hypothesis is: “The differences in value
between undergraduate degrees for accredited public 4–year universities in China and the
United States are unequal.”
Data analysis plan and multiple regression.
After the two-population t-test was performed to determine the difference
between United States and China, a multiple regression was performed. The multiple
regression analyzed predictors for the difference in value for each country between
undergraduate degrees for accredited public 4–year universities between 2009–2019
using the following variables: alumni, award, HiCi, N&S and PUB. The five preceding
variables practiced the same data analysis plan for both the United States and China.
Beginning with the 2009 United States and China HEIs, I took the average of each
variable (alumni, award, HiCi, N&S and PUB) to have a consistent ratio number for
2009-2019.
After obtaining the data, I ran the multiple regression. The multiple regression
was used to determine the second research question: “do relationships exist between or
among the variables alumni, award, HiCi, N&S, PUB, and value from public 4–year
universities in China and the United States between 2009–2019”? The Pearson
correlation coefficient also known as “r” was used to examine the level of significance
90
and effect size of the predictors. The strength of the relationship will fall within the
range of -1 to +1 (Frankfort-Nachmias & Leon Guerro, 2015). Zero will indicate that
there is no relationship of the variables where +1 will indicate that there is a perfect
relationship between the variables (Frankfort-Nachmias and Leon Guerro, p. 444, 2015).
The number, or “absolute value” of (r) will indicate the strength of the linear relationship
of the variables as depicted in Tables 8, 9 and 10 (Frankfort-Nachmias and Leon Guerro,
p. 444, 2015).
Table 10 Data analysis plan
Test Software RQs Hypotheses Interpretation International Value Standard Microsoft Excel n/a n/a
Two-population t-test Microsoft Excel
To what extent if any is there a difference in value between undergraduate degrees for accredited public 4-year universities in China and the U.S between 2009-2019
Null: The differences in value between undergraduate degrees for accredited public universities in China and the U.S. are equal Alternative: The differences in value between undergraduate degrees for accredited public universities in China and the U.S. are unequal
P value
Multiple Regression Microsoft Excel & SPSS
Do relationships exist between or among the variables Alumni, Award, HiCi, N&S, PUB, and value of a degree from a 4-year university in China and the U.S between 2009-2019?
Same Pearson Correlation Coefficient aka R
Note. Variable titles were used exclusively by the research approach.
91
Threats to Validity
Internal Validity
Burkholder et al. (2016) defined validity as the concept of truth where in research
valid findings described the study (p. 104). Burkholder et al. (2016) also explained that
possible internal validity threats were: history, maturation, testing, instrumentation,
statistical regression to the mean, researcher bias, selection, overall mortality, and
differential mortality (p. 114). For this research study, one internal validity threat was
maturation. This internal validity threat addressed the component that individuals and
organizations change over time e.g. HEIs changing over time, employment rate changing
over time, etc. (Burkholder, 2016, p. 115). A second internal validity threat was
selection. This internal validity threat addressed the component that there were
purposefully selected participant groups which may have yielded two groups that were
not equivalent at the beginning of the study (Burkholder, 2016, p. 115). Therefore, if the
groups were not equivalent at the beginning of the study any post-test differences were
because of treatment effect, or the differences (Burkholder, 2016, p. 115).
External Validity
Burkholder et al. (2016) explained that possible external validity threats were:
interactions of the observed causal relationship with sample units, treatment variations,
types of outcome measures used, settings in which the treatment was delivered and
context dependent mediation (p. 118). For this study one external validity threat was
setting for which treatment is was delivered (Burkholder et al., 2016, p. 118). This study
92
was based on a quantitative comparative analysis therefore the setting component was a
factor.
Construct Validity
The construct validity is the degree to which a test measures what it claims or
purports to measure. For this study a two-population t-test was one test used to measure
the comparison of two populations. A two-population t-test is a widely regarded
statistical analysis test used in many dissertations and published papers which has been
verified as a valid test through basic statistical textbooks (Frankfort-Nachmias and Leon
Guerro, 2015). Another test that was used for this study was a multiple regression; used
to measure the strength of the relationship for the variables (er), (em) and (c). Multiple
regression is a widely used test also used in many dissertations and published papers
which has also been verified through basic statistical textbooks (Burkholder et al., 2016;
Frankfort-Nachmias and Leon Guerro).
Ethical Procedures
This study was based on secondary quantitative data. Therefore, no consideration
was needed for vulnerable populations. Likewise, there was no personal information
gathered on individuals and organizations for the study. No data was gathered prior to
the approval from Walden Universities Institutional Review Board (IRB). All data that
was collected is stored in a locked folder for a five (5) year duration.
Summary
Open sources were used to gather data on HEIs for the United States and China to
assess the value of undergraduate public 4-year degrees. The value of the United States
93
and China HEIs was based on an international value standard which I created. I was able
to analyze the relationship of value to utility and cost through a two-population t-test and
why there is a difference in value through the variable’s alumni, award, HiCi, PUB and
N&S. Transitioning into Chapter 4, there will be analysis of data collection and results.
Chapter 5 will provide interpretations, recommendations, and social change implications.
94
Chapter 4: Results
Introduction
The study's purpose was to define the value of undergraduate education, and
create an international value standard through a quantitative comparative analysis of
China and the United States. The following research questions applied to address the
previously identified research problem:
RQ1: To what extent if any is there a difference in value between undergraduate
degrees for accredited public 4–year universities in China and the United
States between 2009–2019?
RQ2: Do relationships exist between or among the variables alumni, award,
HiCi, N&S, PUB, and value from public 4–year universities in China and
the United States between 2009–2019?
Ho: The differences in value between undergraduate degrees for accredited
public universities in China and the United States are equal.
H1: The differences in value between undergraduate degrees for accredited
public universities in China and the United States are unequal.
Chapter 4 includes data collection, data results and the international value
standard, data results and the two-population t-test, data results, multiple regression,
comparison of United States and China HEI regression variables, and a summary.
Data Collection
This research study met Walden University’s ethical standards. The Institutional
Review Board (IRB) approval number 10-09-20-0668766 was issued on October 9, 2020.
95
The time frame for the secondary data collection was 2009 through 2019. Therefore,
there were no actual recruitment and response rates with respect to data collection, as it
existed within an open-source construct. There were no discrepancies in data collection
from the plan presented in Chapter 3, as all data were secondary and open source. The
defined sample size for the United States was 4-year public HEIs from the United States
HEI list. The sample size, therefore, was 691 United States HEIs for all 50 states and its
territories. The defined sample size that I chose for China was 4-year public HEIs from
the China HEI list. Therefore, the sample size of public 4-year institutions for China was
777 referenced in Table 11. The 2014 data were considered a census of the HEIs and this
is why it is representative of the sample of the population of interest. There were no
covariates used for this research study. There was no treatment and/or intervention
fidelity used for this study.
Table 11 Participants and Sample Size
HEIs Population Sample Population US HEIs 4,724 691 China HEIs 2,246 777
Note. Variable titles were used exclusively by the research approach.
With regard to the accuracy of the measured variable “value,” and in the context
of higher education and HEIs, the definition of value was determined through
quantitative methods by taking utility and dividing it by cost as confirmed by (Mihram &
Murphy (2008). The value variable met the validity test as employment and earnings
(utility) and cost were the variables for the measurement of HEIs, and supported the
definition of value.
96
Research Question 1
RQ1 was: “To what extent if any is there a difference in value between
undergraduate degrees for accredited public 4-year universities in China and the United
States between 2009–2019?” This question was created to determine if there was a
difference in value between the United States and China’s HEIs.
Data Results and International Value Standard
In addressing RQ1, an international value standard was first quantitatively created
with the secondary data sources this research effort undertook coming from six sources
(Databases, Tables, and Calculators by Subject, n.d.; Share of employed people in the
Chinese population from 2009 to 2019, n.d.; Income and poverty in the United States
2018, 2020; Annual by province, n.d.; Gu, J., Li, X., Wang, L., 2018; National Center for
Education Statistics, 2014). The international value standard takes the utility and divides
it over cost referenced below:
V = ( EMR * EER ) / C
The international value standard was calculated and implemented for both the United
States Value and China Value which can be seen in both Tables 12 and 13.
Note: Variable titles and names were used exclusively by the research approach. Names are the following: USV as US Value, USEMR as US Employment Rate, USEER as US Earning Rate and US Cost as USC.
Table 12 provided the international value standard data for the United States. The
heading is as follows: Year, USV, USEMR, USERR and USC. The year provided for the
data was from 2009–2019. One variable that affected the USV was USEMR where from
2009 through 2019 USEMR had an average 0.93; beginning with 0.92 and ending with
0.96. Another variable that affected the USV was USC where from 2009 through 2019
USC had an average of $18,565.00; beginning with $16,939.23 and ending with
Note: Variable titles and names were used exclusively by the research approach. Names are the following: CV as China Value, CEMR as China Employment Rate, CERR as China Earning Rate and CC as China Cost.
98
Table 13 provided the international value standard data for China. The heading is
as follows: year, CV, CEMR, CERR and CC. The year provided for the data was from
2009–2019. One variable that affected CV was CEMR where from 2009 through 2019
CEMR had an average of 0.67; beginning with 0.68 and ending with 0.65. Another
variable that affected the CV was CC. From 2009 through 2019 CC had an average of
$702.11; beginning with $640.62 and ending with $761.95.
Figure 3. International Value Standard Comparison
Figure 3 displayed a similarity between the USV and CV in 2009. Both began
around the same number, with USV at 2.75 and CV at 2.58. However, the value of the
United States from 2009 through 2019 increased from 2.75 to 3.06. The USV increased
with a positive numeric score. Additionally, the USV increased with an average 2.79
during the time period 2009 through 2019. Compared to China, the USV had a less
significant growth in value over the time period 2009 through 2019. The value of China
from 2009 through 2019 increased 2.58 to 5.91. The CV increased with a positive
numeric score. Additionally, the CV increased with an average 4.42 during the time
period 2009 through 2019.
Data Results and Two-Population t-Test
After the international value standard was calculated, a two-population t-test was
computed. The purpose of the two-population t-test was to see if there was a difference
in value between the United States and China HEIs. Table 14 displayed the results of the
two-population t-test.
Table 14 Two-population t-test
USA Value China Value Mean 2.789949488 4.420969959 Variance 0.044551306 1.376097159 Standard Deviation .2121 1.1730 Observations 11 11 Hypothesized Mean Difference 0 df 11 t Stat -4.53850106 P(T<=t) one-tail 0.000422972 t Critical one-tail 1.795884819 P(T<=t) two-tail 0.000845943 t Critical two-tail 2.20098516
Note: Variable titles were used exclusively by the research approach.
Table 14 provided the two-population t-test and descriptive statistics for the HEIs of the
United States and China. The USV mean was 2.79 and CV mean was 4.42 CV. The
observation size of 11 was based on the number of years (2009–2019) for both the United
States and China whereas the sample size of the United States was 691 and the sample
size of China was 777. The variables were quantitative in nature.
100
RQ1 Findings
China’s mean value (M = 4.42, SD = 1.17) was higher than the United States
mean value (M = 2.79, SD = .21). The difference was statistically significant, t(11) = -
4.54, P < .001. Since the P-value was less than 0.05, the null hypothesis was rejected and
it was concluded the HEI mean value between the United States and China were not
equal to one another. The alternative hypothesis was accepted, where there was a
difference in value between undergraduate degrees for accredited public 4-year
universities in China and the United States from 2009–2019. The effect size based on
Cohen’s d was calculated by (M1 4.420969 – M2 2.789949) ⁄ SD pooled 0.842887 =
1.935041. As a result the calculated Cohen’s d provided insight of a large effect size as it
was over the threshold 0.08. There was no post-hoc analysis. There were also no
additional statistical tests of hypothesis that emerged from the two-population t-test.
For this study I specifically addressed the research problem that the HEI
international community did not have an international value standard. With my research,
I created an international value standard and compared the two countries of the United
States and China. Those two countries were necessary as the first step addressing the gap
of HEI value. Therefore, I was able to define what value meant and obtained evidence
for an international value standard as a foundation for HEIs across the globe. After I
implemented the two- population t-test, RQ1 addressed and answered the research
problem by retaining the international value standard (using the independent variables
utility and cost) and answered is there a difference in value of 4-year public
undergraduate HEIs between the United States and China where the answer was yes.
101
Two-population t-test assumptions.
The statistical assumptions for a two-population t-test were the following: i) the
data was continuous, ii) the data was based on the normal probability distribution, iii) the
data was independent and large with n > 30 and, iv) the data from both samples were
random (Rajaretnam, 2015, p. 129). All four assumptions were met for the two-
population t-test as the data were continuous (all ratio), based on the normal probability
distribution, independent and large (see discussion of secondary open-source data sets in
Chapter 3), and samples being at random (see discussion in Chapter 3). The assumption
test was conducted and found to be within the constraint of the two-population t-test.
In the alternative, if I were to approach this research using the non-parametric
route, the “go-to” test would be the chi-square test. The chi-square offers “the goodness-
of-fit tests.” Since all assumptions were met there cannot be a “specific” chi-square test
to recommend; only the discussion that there are specific chi-square tests available such
as testing the hypothesis that a distribution of data is from a normal population and
goodness-of fit test: unequal expected frequencies (Frampton, 2013).
Research Question 2
Data Results and Multiple Regression
“Do relationships exist between or among the variables alumni, award, HiCi,
N&S, PUB, and value from public 4-year universities in China and the United States
between 2009–2019?” Research Question 2 was created to determine “why” there is a
difference in value between the United States and China HEIs. The United States and
102
China multiple regression was implemented after the two-population t-test in this
research study.
United States Multiple Regression
Table 15 provided the United States Multiple Regression Data which included the
variables United States year, USV, USAL, USAW, USHICI, USNS and USPUB. The
multiple regression was ran in excel where USV was entered as the dependent variable
and USAL, USAW, USHICI, USNS and USPUB were entered as the independent
variables by following the steps of data analysis and regression.
Table 15 Data for United States Multiple Regression to Predict HEI International Value Standard
The U.S multiple regression variables and data were based on the international value
standard that was created for this research effort.
103
Table 16 United States Multiple Regression “R’s”, “Standard Error” and “Observation”
R R2 Adj R2 SE Obs.
0.976 0.952 0.905 0.065 11 Note: R was defined as Multiple R; R2 was defined as R Square; Adj R2 was defined as Adjusted R square; SE was defined as Standard Error; and Obs. defined as Observations.
Table 16 provided the basic multiple regression output for the United States. An
R of "0" indicates there was no relationship of the variables where an R of +1.0 will
indicate that there was a perfect positive relationship. The multiple R is 0.976 and
therefore closely lies towards the +1. The R-square was 0.952. The adjusted R-square
was 0.905. The standard error was 0.065 and the observations was 11 whereby the
descriptive statistics of the sample size was 691 for the United States HEIs.
Table 17 ANOVA United States
DF SS MS F F Sig.
Regression 5 0.427 0.085 20.007 0.003
Residual 5 0.021 0.004 Total 10 0.448
Note: DF defined as degrees of freedom; SS defined as Sum of Squares; MS defined as Mean Squares, F defined as F statistic; and F Sig. defined as F significance. Table 17 provided the output results from the Analysis of Variance (ANOVA)
calculations. The F-value was reported in the ANOVA table, along with its level of
significance where the F value was 20.007 and the significance was 0.003. Therefore, the
table read as follows: F(5, 5)=20.007, p<.05 where the regression model was considered
a good fit of the data, and was found to be statistically significant.
104
Table 18 United States Multiple Regression Predicting HEI International Value Standard
B b SE t p 95% CI Intercept 2.450 1.177 2.081 0.092 [-0.575, 5.476] USAL 0.038 0.136 0.281 0.790 [-0.311, 0.387] USAW 0.169 0.052 3.242 0.023 [0.035, 0.303] USHI 0.0001 -.973 0.018 0.008 0.994 [-0.046, 0.047] USNS -0.198 0.056 -3.529 0.016 [-0.342, -0.054]
USPUB 0.053 .676 0.053 0.999 0.366 [-0.084, 0.191] Note: B was defined as unstandardized coefficient; b was defined as standardized coefficient; SE defined as Standard Error; t defined as t stat; p defined as P-value; 95% CI defined as upper and lower 95% confidence intervals.
Table 18 was based on the confidence interval of 95%. There were three main
components to Table 18. Of the five predictor variables, two were significant. They were
USAW, a predictor variable that was positively significant with a P-value of 0.023 and
USNS, a predictor variable that was negatively significant with a P-value of 0.016.
Therefore, the USAW was the “stronger” predictor based on the standardized coefficient
(b). Another important piece Table 18 provided was through the coefficients data. If
there was a positive or negative sign this provided whether the data was significantly
affecting in a positive or negative manner. Therefore, USNS had a negative significance
and correlation with value.
United States Multiple Regression Findings
As can be seen from the United States Multiple Regression Model: USAL,
USAW, USHI and USPUB were positively correlated with USV; while USAW was
positive and significant. This evidence concluded that there was a positive difference in
United States Value answering the “why” component of the value difference between the
105
United States and China. On the other hand, the independent variable USNS was
negative and significant. Since the alpha was 0.05, and the two P-values were USAW at
0.023 and USNS at 0.016, the null hypothesis was rejected, and we conclude that
relationships do exist between or among the variables alumni, award, HiCi, N&S, PUB,
and value for public 4–year universities in China and the United States between 2009–
2019. Finally, the USV model can be written as the following:
Note: B was defined as unstandardized coefficient; b was defined as standardized coefficient; SE defined as Standard Error; t defined as t stat; p defined as P-value; 95% CI defined as upper and lower 95% confidence intervals.
Table 23 was based on the confidence interval of 95%. There were three main
components to Table 23. There was one P-value in Table 23 that was less than
the significance level of 0.05 which provided that the null hypothesis can be rejected.
The one P-value was CHI at 0.02. Another important factor of Table 23 were the
111
coefficients. If there was a positive or negative sign this provided whether the data was
significantly affecting in a positive or negative manner. Therefore, CAL, CAW and
CPUB all had a negative impact and correlation with value.
China Multiple Regression Findings
The R output was 0.912 and therefore indicated that there was a strong correlation
among the independent variables CAL, CAW, CHI, CNS, and CPUB. As can be seen
from the China Multiple Regression Model, the CHI was positively and significantly
correlated with CV. This evidence concluded that there is a positive difference in China
Value answering the “why” component of the value difference between the United States
and China; using the variable of CHI. The independent variables CAL, CAW and CPUB
are negative, and therefore insignificantly, correlated with CV. The F-value was reported
in the ANOVA Table 26, along with its level of significance where the F-value was 4.92
and the significance was 0.053. For China, since the alpha was 0.05, and the P-value for
CHI was 0.02 the null hypothesis is rejected and we conclude that relationships do exist
between or among the variables alumni, award, HiCi, N&S, PUB, and value for public 4–
year universities in China and the United States between 2009–2019. The CV model can
Zumeta, W. (2011) State Policies and Private Higher Education in the USA:
Understanding the Variation in Comparative Perspective. Journal of Comparative
Policy Analysis: Research and Practice, 13(4), 425-442, DOI:
10.1080/13876988.2011.583110.
159
Appendix A: Permission Letters in Redacted Format
8/9/19, 8'07 AMGmail - Re: Copyright and Permission
Page 1 of 4
Alexandra Allman
Re: Copyright and Permission
Shannon O Wilder Mon, Aug 5, 2019 at 4:39 PMTo: Alexandra Allman , Paul J Brooks >
August 5, 2019
Dear Alexandra:
The request to reprint Table 1 “US Regional Accrediting Commissions and Regions” in the article “US HigherEducation Regional Accreditation Commission Standards and the Centrality of Engagement” (Vol. 18, No. 4) for use inyour dissertation is approved with the understanding that the following credit line will be used:
Reprinted with permission from the Journal of Higher Education Outreach and Engagement
Approved by: Shannon O. Wilder, Editor – Journal of Higher Education Outreach and Engagement
Best,
S.
--
Shannon O'Brien Wilder, Ph.D.
Director, Office of Service-Learning
Editor, Journal of Higher Education Outreach and Engagement
University of Georgia
1242 1/2 S. Lumpkin St.
Athens, GA 30602
160
161
162
163
164
8/9/19, 8'31 AM
Page 1 of 6
Alexandra Allman
RE: cres20:Reconsidering the Regional Economic Development Impacts of HigherEducation Institutions in the United States1 message
Academic UK Non Rightslink Fri, Aug 9, 2019 at 6:38 AMTo: Alexandra Allman
09 August 2019
Dear Alexandra Allman,
Table 1 from Joshua Drucker (2016) Reconsidering the Regional Economic Development Impacts ofHigher Education Institutions in the United States, Regional Studies, 50:7, 1185-1202, DOI:10.1080/00343404.2014.986083
Thank you for your email correspondence requesting permission to reproduce the above material from ourJournal in your printed thesis and to be posted in your university’s repository - Walden Universityhttps://scholarworks.waldenu.edu/
We will be pleased to grant entirely free permission on the condition that you acknowledge the original sourceof publication and insert a reference to the Journal’s web site: www.tandfonline.com
Thank you for your interest in our Journal.
With best wishes
Lee-Ann
Lee-Ann Anderson – Senior Permissions & Licensing Executive, Journals
Routledge, Taylor & Francis Group
3 Park Square, Milton Park, Abingdon, Oxon, OX14 4RN, UK.
Permissions Tel:
165
8/9/19, 8'31 AM
Page 2 of 6
Permissions e-mail:
Direct Tel:
Web: www.tandfonline.com
e-mail: l
Taylor & Francis is a trading name of Informa UK Limited, registered in England under no. 1072954
Please note the current processing time for all permissions requests received in-house by theJournal permissions team have a processing time of 6 weeks.
The quickest way for you to obtain permission is for you to request permission almost instantly throughCopyright Clearance Center’s Rightslink® service. (Rightslink guide for clearing permission)
Do you need corporate or book permission? Please contact our dedicated Corporate permission or Bookpermission teams.
From: Alexandra Allman Sent: 08 August 2019 11:36To: Academic Journals Society Permissions Subject: Re: cres20:Reconsidering the Regional Economic Development Impacts of Higher Education Institutions inthe United States
Hi there Leanne,
Thank you for the permission. I wanted to follow up with you, I live in However, I'm a doctoralcandidate with Walden University (not the University ) and it will be used in the repository
166
8/9/19, 8'31 AM
Page 3 of 6
Scholarworks.
Best,
Alexandra AllmanDoctoral Candidate, Doctor of Public Policy and Administration, Walden UniversityM.A., Political Science, The University of Texas at DallasEmail: Phone:
On Thu, Aug 8, 2019 at 4:49 AM Academic Journals Society Permissions wrote:
08 August 2019
Dear Alexandra Allman,
Table 1 from Joshua Drucker (2016) Reconsidering the Regional Economic Development Impactsof Higher Education Institutions in the United States, Regional Studies, 50:7, 1185-1202,
DOI: 10.1080/00343404.2014.986083
Thank you for your correspondence requesting permission to reproduce the above material from our Journalin your printed thesis and to be posted in your university’s repository - The University
We will be pleased to grant entirely free permission on the condition that you acknowledge the originalsource of publication and insert a reference to the Journal’s web site: www.tandfonline.com
Please note that this licence does not allow you to post our content on any third party websites orrepositories.
Thank you for your interest in our Journal.
With best wishes
167
8/9/19, 8'31 AM
Page 4 of 6
Lee-Ann
Lee-Ann Anderson – Senior Permissions & Licensing Executive, Journals
Routledge, Taylor & Francis Group
3 Park Square, Milton Park, Abingdon, Oxon, OX14 4RN, UK.
Permissions Tel:
Permissions e-mail:
Direct Tel:
Web: www.tandfonline.com
e-mail:
Taylor & Francis is a trading name of Informa UK Limited, registered in England under no. 1072954
Please note the current processing time for all permissions requests received in-house by theJournal permissions team have a processing time of 6 weeks.
The quickest way for you to obtain permission is for you to request permission almost instantly throughCopyright Clearance Center’s Rightslink® service. (Rightslink guide for clearing permission)
Do you need corporate or book permission? Please contact our dedicated Corporate permission orBook permission teams.
-----Original Message-----From: Alexandra Allman Sent: 05 August 2019 19:02To: Academic UK Non Rightslink Subject: cres20:Reconsidering the Regional Economic Development Impacts of Higher Education Institutions in theUnited States
Permissions Request
<br/>
Contact name: Alexandra Allman
<br/>
Street address: <br/>
Town:
<br/>
Postcode/ZIP code:
<br/>
Country: USA
<br/>
Contact telephone number:
<br/>
Contact email address: <br/> Article title: Reconsidering the Regional EconomicDevelopment Impacts of Higher Education Institutions in the United States <br/> Article DOI:10.1080/00343404.2014.986083 <br/> Author name: Joshua Drucker <br/> Journal title: Regional Studies <br/>Volume number: 50 <br/> Issue number: 7 <br/> Year of publication: 2016 <br/> Page number(s): 1191 <br/> Areyou the sole author/editor of the new publication?: Yes <br/> Are you requesting the full article?: No <br/> If no,please supply extract and include number of word: Reprint of Table 1 <br/> If no, please supply details offigure/table: Reprint of Table 1 <br/> Name of publisher of new publication: Scholarworks <br/> Title of newpublication: Higher Education Institutions <br/> Course pack: No <br/> Number of Students:
<br/>
Is print:
<br/>
Electronic:
<br/>
E-reserve: No
<br/>
169
8/9/19, 8'31 AM
Page 6 of 6
Period of use: Perpetual
<br/>
Short loan library?: No
<br/>
Thesis: Yes
<br/>
To be reprinted in a new publication?: Yes <br/> In print format: Yes <br/> In ebook format?: Yes <br/>
ISBN:
<br/>
Languages:
<br/>
Distribution quantity:
<br/>
Retail price:
<br/>
Additional comments: Table one to be reprinted for my dissertation.
Vethakkan, Anita Mercy M. (ELS-CHN) Tue, Aug 6, 2019 at 11:33 PMTo:
Dear Alexandra Allman
We hereby grant you permission to reprint the aforementioned material at no charge in your thesis, in print and onthe University of Walden web site subject to the following conditions:
1. If any part of the material to be used (for example, figures) has appeared in our publication withcredit or acknowledgement to another source, permission must also be sought from that source. If suchpermission is not obtained then that material may not be included in your publication/copies.
2. Suitable acknowledgment to the source must be made, either as a footnote or in a reference list atthe end of your publication, as follows:
“This article was published in Publication title, Vol number, Author(s), Title of article, Page Nos, CopyrightElsevier (or appropriate Society name) (Year).”
3. Your thesis may be submitted to your institution in either print or electronic form.
4. Reproduction of this material is confined to the purpose for which permission is hereby given.
5. This permission is granted for non-exclusive world English rights only. For other languages pleasereapply separately for each one required. Permission excludes use in an electronic form other than asspecified above. Should you have a specific electronic project in mind please reapply for permission.
171
8/9/19, 8'30 AM
Page 2 of 3
6. Should your thesis be published commercially, please reapply for permission.
Kind Regards
Anita
Anita Mercy
Senior Copyrights Coordinator - Global Rights
Elsevier | Health Content Operations
(A division of Reed Elsevier India Pvt. Ltd.)
Ascendas International Tech Park, Crest - 12th Floor|Taramani, Chennai 600113 • India|
Tel:
Permissions Helpdesk no -
Join the Elsevier Connect Community
www.elsevier.com
Twitter | Facebook | LinkedIn | Google+
From: Sent: Monday, August 5, 2019 11:58 PMTo: Rights and Permissions (ELS) Subject: Obtain permission request - Journal
*** External email: use caution ***
172
8/9/19, 8'30 AM
Page 3 of 3
Institute/company: Walden University Address: Post/Zip Code: City: State/Territory: Country: United StatesTelephone: Email:
Type of Publication: Journal
Journal Title: Social Science Research Journal ISSN: 0049-089X Journal Volume: 57Journal Issue: 0Journal Year: 2016 Journal Pages: 245 to 245Journal Author: M. Vuolo et al. Journal Article title: The value of educational degrees in turbulent economic times: Evidence from the YouthDevelopment Study
I would like to use: Figure(s)Quantity of material: 1Excerpts: Are you the author of the Elsevier material? NoIf not, is the Elsevier author involved? NoIf yes, please provide details of how the Elsevier author is involved: In what format will you use the material? Print and ElectronicWill you be translating the material? NoIf yes, specify language: Information about proposed use: Reuse in a thesis/dissertationProposed use text: Scholarworks in Walden UniversityAdditional Comments / Information:
173
ELSEVIER LICENSETERMS AND CONDITIONS
Aug 24, 2019
This Agreement between Alexandra Allman ("You") and Elsevier ("Elsevier") consists ofyour license details and the terms and conditions provided by Elsevier and CopyrightClearance Center.
License Number 4655560639782
License date Aug 24, 2019
Licensed Content Publisher Elsevier
Licensed Content Publication Research in Social Stratification and Mobility
Licensed Content Title Mobility in the middle: Bachelor’s degree selectivity and theintergenerational association in status in the United States
Licensed Content Author Jason Thompson
Licensed Content Date Apr 1, 2019
Licensed Content Volume 60
Licensed Content Issue n/a
Licensed Content Pages 13
Start Page 16
End Page 28
Type of Use reuse in a thesis/dissertation
Portion figures/tables/illustrations
Number offigures/tables/illustrations
1
Format both print and electronic
Are you the author of thisElsevier article?
No
Will you be translating? No
Order reference number n/a
Original figure numbers Table 5 Intergenerational Association in Family Income from thearticle "Mobility in the middle: Bachelor’s degree selectivity and theintergenerational association in status in the United States".
Title of yourthesis/dissertation
Expected completion date Jan 2020
Estimated size (number ofpages)
200
Requestor Location Alexandra Allman
174
United StatesAttn:
Publisher Tax ID 98-0397604
Total 0.00 USD
Terms and Conditions
INTRODUCTION1. The publisher for this copyrighted material is Elsevier. By clicking "accept" inconnection with completing this licensing transaction, you agree that the following termsand conditions apply to this transaction (along with the Billing and Payment terms andconditions established by Copyright Clearance Center, Inc. ("CCC"), at the time that youopened your Rightslink account and that are available at any time at
GENERAL TERMS2. Elsevier hereby grants you permission to reproduce the aforementioned material subject tothe terms and conditions indicated.3. Acknowledgement: If any part of the material to be used (for example, figures) hasappeared in our publication with credit or acknowledgement to another source, permissionmust also be sought from that source. If such permission is not obtained then that materialmay not be included in your publication/copies. Suitable acknowledgement to the sourcemust be made, either as a footnote or in a reference list at the end of your publication, asfollows:"Reprinted from Publication title, Vol /edition number, Author(s), Title of article / title ofchapter, Pages No., Copyright (Year), with permission from Elsevier [OR APPLICABLESOCIETY COPYRIGHT OWNER]." Also Lancet special credit - "Reprinted from TheLancet, Vol. number, Author(s), Title of article, Pages No., Copyright (Year), withpermission from Elsevier."4. Reproduction of this material is confined to the purpose and/or media for whichpermission is hereby given.5. Altering/Modifying Material: Not Permitted. However figures and illustrations may bealtered/adapted minimally to serve your work. Any other abbreviations, additions, deletionsand/or any other alterations shall be made only with prior written authorization of ElsevierLtd. (Please contact Elsevier at ). No modifications can be madeto any Lancet figures/tables and they must be reproduced in full.6. If the permission fee for the requested use of our material is waived in this instance,please be advised that your future requests for Elsevier materials may attract a fee.7. Reservation of Rights: Publisher reserves all rights not specifically granted in thecombination of (i) the license details provided by you and accepted in the course of thislicensing transaction, (ii) these terms and conditions and (iii) CCC's Billing and Paymentterms and conditions.8. License Contingent Upon Payment: While you may exercise the rights licensedimmediately upon issuance of the license at the end of the licensing process for thetransaction, provided that you have disclosed complete and accurate details of your proposeduse, no license is finally effective unless and until full payment is received from you (eitherby publisher or by CCC) as provided in CCC's Billing and Payment terms and conditions. Iffull payment is not received on a timely basis, then any license preliminarily granted shall bedeemed automatically revoked and shall be void as if never granted. Further, in the eventthat you breach any of these terms and conditions or any of CCC's Billing and Paymentterms and conditions, the license is automatically revoked and shall be void as if nevergranted. Use of materials as described in a revoked license, as well as any use of the
175
materials beyond the scope of an unrevoked license, may constitute copyright infringementand publisher reserves the right to take any and all action to protect its copyright in thematerials.9. Warranties: Publisher makes no representations or warranties with respect to the licensedmaterial.10. Indemnity: You hereby indemnify and agree to hold harmless publisher and CCC, andtheir respective officers, directors, employees and agents, from and against any and allclaims arising out of your use of the licensed material other than as specifically authorizedpursuant to this license.11. No Transfer of License: This license is personal to you and may not be sublicensed,assigned, or transferred by you to any other person without publisher's written permission.12. No Amendment Except in Writing: This license may not be amended except in a writingsigned by both parties (or, in the case of publisher, by CCC on publisher's behalf).13. Objection to Contrary Terms: Publisher hereby objects to any terms contained in anypurchase order, acknowledgment, check endorsement or other writing prepared by you,which terms are inconsistent with these terms and conditions or CCC's Billing and Paymentterms and conditions. These terms and conditions, together with CCC's Billing and Paymentterms and conditions (which are incorporated herein), comprise the entire agreementbetween you and publisher (and CCC) concerning this licensing transaction. In the event ofany conflict between your obligations established by these terms and conditions and thoseestablished by CCC's Billing and Payment terms and conditions, these terms and conditionsshall control.14. Revocation: Elsevier or Copyright Clearance Center may deny the permissions describedin this License at their sole discretion, for any reason or no reason, with a full refund payableto you. Notice of such denial will be made using the contact information provided by you. Failure to receive such notice will not alter or invalidate the denial. In no event will Elsevieror Copyright Clearance Center be responsible or liable for any costs, expenses or damageincurred by you as a result of a denial of your permission request, other than a refund of theamount(s) paid by you to Elsevier and/or Copyright Clearance Center for deniedpermissions.
LIMITED LICENSEThe following terms and conditions apply only to specific license types:15. Translation: This permission is granted for non-exclusive world English rights onlyunless your license was granted for translation rights. If you licensed translation rights youmay only translate this content into the languages you requested. A professional translatormust perform all translations and reproduce the content word for word preserving theintegrity of the article.16. Posting licensed content on any Website: The following terms and conditions apply asfollows: Licensing material from an Elsevier journal: All content posted to the web site mustmaintain the copyright information line on the bottom of each image; A hyper-text must beincluded to the Homepage of the journal from which you are licensing athttp://www.sciencedirect.com/science/journal/xxxxx or the Elsevier homepage for books athttp://www.elsevier.com; Central Storage: This license does not include permission for ascanned version of the material to be stored in a central repository such as that provided byHeron/XanEdu.Licensing material from an Elsevier book: A hyper-text link must be included to the Elsevierhomepage at http://www.elsevier.com . All content posted to the web site must maintain thecopyright information line on the bottom of each image.
Posting licensed content on Electronic reserve: In addition to the above the following
176
clauses are applicable: The web site must be password-protected and made available only tobona fide students registered on a relevant course. This permission is granted for 1 year only.You may obtain a new license for future website posting.17. For journal authors: the following clauses are applicable in addition to the above:Preprints:A preprint is an author's own write-up of research results and analysis, it has not been peer-reviewed, nor has it had any other value added to it by a publisher (such as formatting,copyright, technical enhancement etc.).Authors can share their preprints anywhere at any time. Preprints should not be added to orenhanced in any way in order to appear more like, or to substitute for, the final versions ofarticles however authors can update their preprints on arXiv or RePEc with their AcceptedAuthor Manuscript (see below).If accepted for publication, we encourage authors to link from the preprint to their formalpublication via its DOI. Millions of researchers have access to the formal publications onScienceDirect, and so links will help users to find, access, cite and use the best availableversion. Please note that Cell Press, The Lancet and some society-owned have differentpreprint policies. Information on these policies is available on the journal homepage.Accepted Author Manuscripts: An accepted author manuscript is the manuscript of anarticle that has been accepted for publication and which typically includes author-incorporated changes suggested during submission, peer review and editor-authorcommunications.Authors can share their accepted author manuscript:
immediatelyvia their non-commercial person homepage or blogby updating a preprint in arXiv or RePEc with the accepted manuscriptvia their research institute or institutional repository for internal institutionaluses or as part of an invitation-only research collaboration work-groupdirectly by providing copies to their students or to research collaborators fortheir personal usefor private scholarly sharing as part of an invitation-only work group oncommercial sites with which Elsevier has an agreement
After the embargo periodvia non-commercial hosting platforms such as their institutional repositoryvia commercial sites with which Elsevier has an agreement
In all cases accepted manuscripts should:
link to the formal publication via its DOIbear a CC-BY-NC-ND license - this is easy to doif aggregated with other manuscripts, for example in a repository or other site, beshared in alignment with our hosting policy not be added to or enhanced in any way toappear more like, or to substitute for, the published journal article.
Published journal article (JPA): A published journal article (PJA) is the definitive finalrecord of published research that appears or will appear in the journal and embodies allvalue-adding publishing activities including peer review co-ordination, copy-editing,formatting, (if relevant) pagination and online enrichment.Policies for sharing publishing journal articles differ for subscription and gold open accessarticles:Subscription Articles: If you are an author, please share a link to your article rather than the
177
full-text. Millions of researchers have access to the formal publications on ScienceDirect,and so links will help your users to find, access, cite, and use the best available version.Theses and dissertations which contain embedded PJAs as part of the formal submission canbe posted publicly by the awarding institution with DOI links back to the formalpublications on ScienceDirect.If you are affiliated with a library that subscribes to ScienceDirect you have additionalprivate sharing rights for others' research accessed under that agreement. This includes usefor classroom teaching and internal training at the institution (including use in course packsand courseware programs), and inclusion of the article for grant funding purposes.Gold Open Access Articles: May be shared according to the author-selected end-userlicense and should contain a CrossMark logo, the end user license, and a DOI link to theformal publication on ScienceDirect.Please refer to Elsevier's posting policy for further information.18. For book authors the following clauses are applicable in addition to the above: Authors are permitted to place a brief summary of their work online only. You are notallowed to download and post the published electronic version of your chapter, nor may youscan the printed edition to create an electronic version. Posting to a repository: Authors arepermitted to post a summary of their chapter only in their institution's repository.19. Thesis/Dissertation: If your license is for use in a thesis/dissertation your thesis may besubmitted to your institution in either print or electronic form. Should your thesis bepublished commercially, please reapply for permission. These requirements includepermission for the Library and Archives of Canada to supply single copies, on demand, ofthe complete thesis and include permission for Proquest/UMI to supply single copies, ondemand, of the complete thesis. Should your thesis be published commercially, pleasereapply for permission. Theses and dissertations which contain embedded PJAs as part ofthe formal submission can be posted publicly by the awarding institution with DOI linksback to the formal publications on ScienceDirect. Elsevier Open Access Terms and ConditionsYou can publish open access with Elsevier in hundreds of open access journals or in nearly2000 established subscription journals that support open access publishing. Permitted thirdparty re-use of these open access articles is defined by the author's choice of CreativeCommons user license. See our open access license policy for more information.Terms & Conditions applicable to all Open Access articles published with Elsevier:Any reuse of the article must not represent the author as endorsing the adaptation of thearticle nor should the article be modified in such a way as to damage the author's honour orreputation. If any changes have been made, such changes must be clearly indicated.The author(s) must be appropriately credited and we ask that you include the end userlicense and a DOI link to the formal publication on ScienceDirect.If any part of the material to be used (for example, figures) has appeared in our publicationwith credit or acknowledgement to another source it is the responsibility of the user toensure their reuse complies with the terms and conditions determined by the rights holder.Additional Terms & Conditions applicable to each Creative Commons user license:CC BY: The CC-BY license allows users to copy, to create extracts, abstracts and newworks from the Article, to alter and revise the Article and to make commercial use of theArticle (including reuse and/or resale of the Article by commercial entities), provided theuser gives appropriate credit (with a link to the formal publication through the relevantDOI), provides a link to the license, indicates if changes were made and the licensor is notrepresented as endorsing the use made of the work. The full details of the license areavailable at http://creativecommons.org/licenses/by/4.0.
178
CC BY NC SA: The CC BY-NC-SA license allows users to copy, to create extracts,abstracts and new works from the Article, to alter and revise the Article, provided this is notdone for commercial purposes, and that the user gives appropriate credit (with a link to theformal publication through the relevant DOI), provides a link to the license, indicates ifchanges were made and the licensor is not represented as endorsing the use made of thework. Further, any new works must be made available on the same conditions. The fulldetails of the license are available at http://creativecommons.org/licenses/by-nc-sa/4.0.CC BY NC ND: The CC BY-NC-ND license allows users to copy and distribute the Article,provided this is not done for commercial purposes and further does not permit distribution ofthe Article if it is changed or edited in any way, and provided the user gives appropriatecredit (with a link to the formal publication through the relevant DOI), provides a link to thelicense, and that the licensor is not represented as endorsing the use made of the work. Thefull details of the license are available at http://creativecommons.org/licenses/by-nc-nd/4.0.Any commercial reuse of Open Access articles published with a CC BY NC SA or CC BYNC ND license requires permission from Elsevier and will be subject to a fee.Commercial reuse includes:
Associating advertising with the full text of the ArticleCharging fees for document delivery or accessArticle aggregationSystematic distribution via e-mail lists or share buttons
Posting or linking by commercial companies for use by customers of those companies. 20. Other Conditions: v1.9
Questions?
179
Appendix B: Research Questions and Hypotheses
Research Questions Null Hypotheses Alternative Hypotheses 1. To what extent if any is there a difference in value between undergraduate degrees for accredited public 4- year universities in China and the U.S. between 2009-2019?
Ho: The difference in value between undergraduate degrees for accredited public universities in China and the U.S. are equal.
H1: The difference in value between undergraduate degrees for accredited public universities in China and the U.S. are unequal.
2. Do relationships exists between or among the variables Alumni, Award, HiCi, N&S, PUB and value from public 4-year universities in China and the U.S between 2009-2019?
180
Appendix C: China and United States Comparable
Topics China U.S.
Governance MoE DoE
Funding
“Government Appropriation for Education” refers to the public budgetary fund for education, taxes and fees collected by governments at all levels that are used for education purpose, enterprise appropriation for enterprise-run schools, income from school-run enterprises and social services that are used for education purpose and other national appropriations for education.”
Appropriation for education begin in House of Rep and then passed in Senate.
Economy RMB USD
Span of Control 2,246 HEIs 4,724 HEIs
Is the BA a Social Norm Yes Yes
Note. China Statistical Yearbook. (2014). Budget Process in the US Department of Education. (n.d).
181
Appendix D: HEI Standard Comparison Questions
HEI Comparison Questions
1) Changes in the ideologies of the state. 2) Changes in the mechanisms of government and the salience of central government. 3) Policy formation and the place of government agencies, educational institutions, elites, interest groups, and actor networks of various kinds. 4) The nature of the reforms created by government. 5) The impacts of the reforms in terms of the academic profession, epistemic identities and working practices of academics in a range of disciplines, and in a range of institutions in the three countries.
Note: Custer (2018).
182
Appendix E: Earnings
Reprinted from “Reconsidering the Regional Economic Development Impacts of Higher Education Institutions in the United States,” by Drucker, J., 2016, Regional Studies. 50, 7. www.tandfonline.com Reprinted with permission
183
Appendix F: Degrees and the Economy
Reprinted from “The Value of Educational Degrees in Turbulent Economic Times,” by Vuolo, M. et al., 2016, Social Science. 57, Reprinted with permission.
184
Appendix G: Family Income and Degrees
Note. Reprinted from “Mobility in the Middle: Bachelor’s Degree Selectivity and the Intergenerational Association in Status in the United States,” by Thompson, J., 2019, Research in Social Stratification and Mobility. 60. Reprinted with permission.
185
Appendix H: Multiple Regression United States Residual Output