UNDERSTANDING DEMAND • This section will be one of the easiest to understand. – You live out this section nearly every day. • SUMMARY OF SECTION – – This section explains how when you have more you want (Demand) more, and… – How you want (Demand) more when prices drop, and – How your income affect your choices (i.e. I have $5 I buy a value meal. I have $30 I go to Cheddars).
Transcript
UNDERSTANDING DEMAND
• This section will be one of the easiest to understand. – You live out this section nearly every day.
• SUMMARY OF SECTION –– This section explains how when you have more
you want (Demand) more, and…– How you want (Demand) more when prices
drop, and– How your income affect your choices (i.e. I have
$5 I buy a value meal. I have $30 I go to Cheddars).
UNDERSTANDING DEMAND
• According to the LAW OF DEMAND people buy less of a good when the price rises.
• Demand schedules & demand curves illustrates how people & markets react to different prices.
• SUMMARY OF SECTION –this section explains how people increase or decrease their wants and it uses graphs, charts, & tables to illustrate how people increase or decrease their wants.
UNDERSTANDING DEMAND
• Demand – the desire to own something and have the ability to pay for it.
• Law of Demand – when a good’s price is lower consumers will buy more of it.
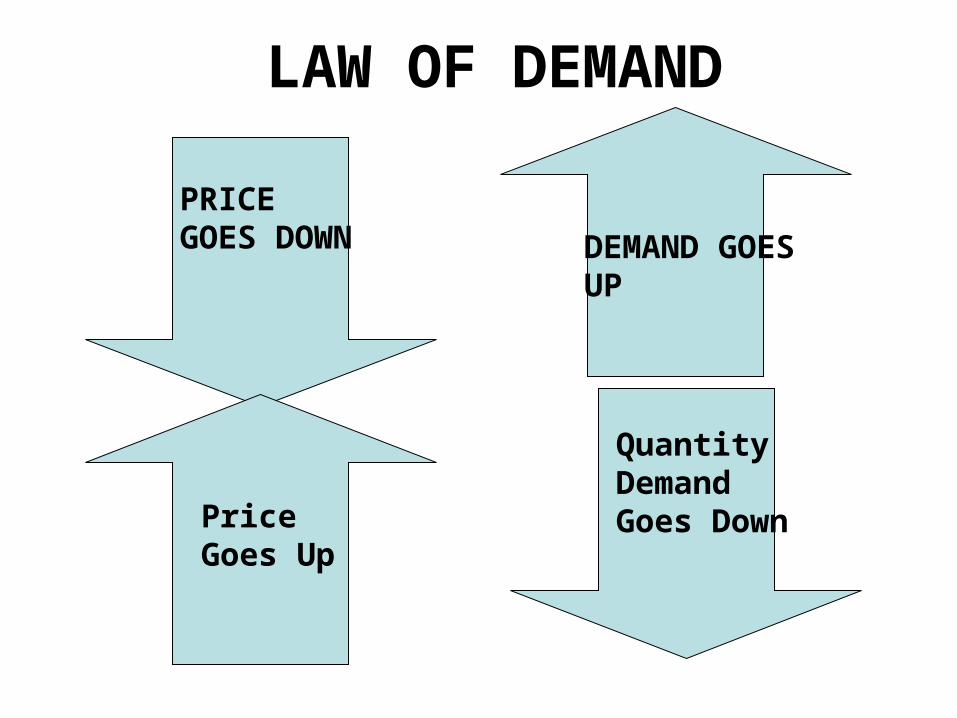
PRICE GOES DOWN
DEMAND GOES UP
Price Goes Up
Quantity Demand Goes Down
LAW OF DEMAND
INCOME EFFECT
PRICE OF “A” INCREASES
Consumption of “A” goes down
Consumption of other goods go
down or remain the same
The change in consumption resulting from a change in real income.
Understanding the income effect.
When the price of “A” increase real Income (purchasing power)
decreases
Resulting in the consumer’s ability to buy fewer of the other goods
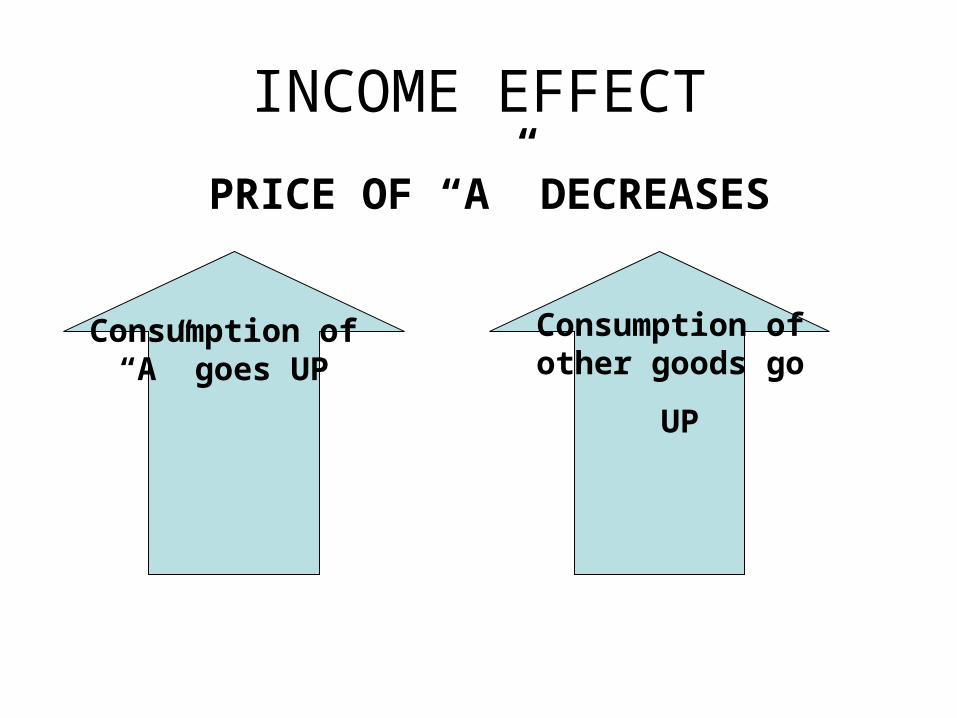
INCOME EFFECT
PRICE OF “A” DECREASES
Consumption of “A” goes UP
Consumption of other goods go
UP
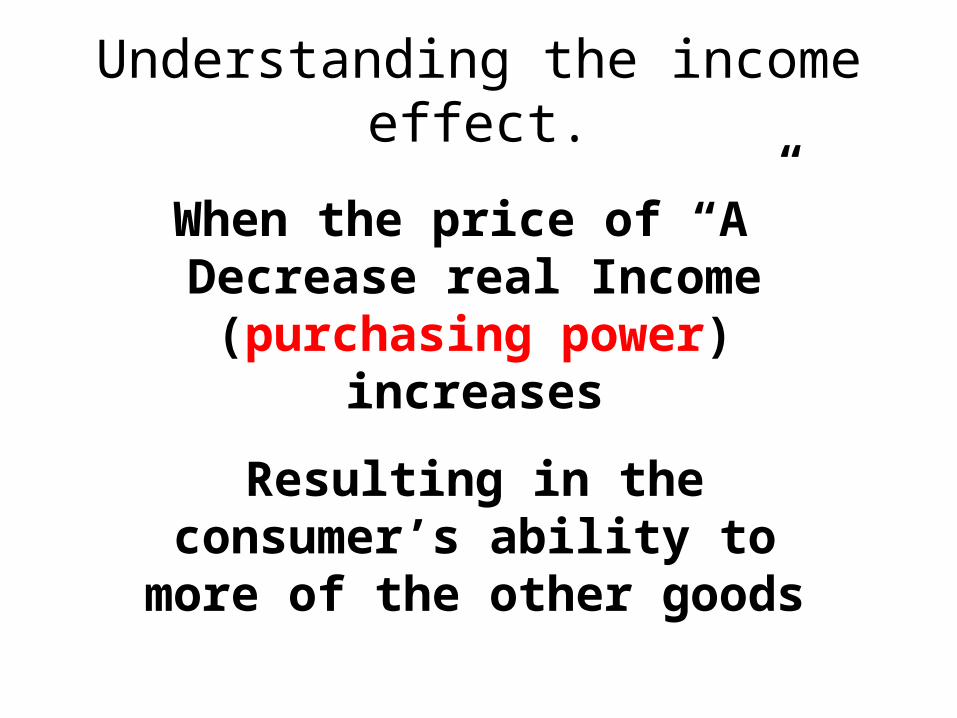
Understanding the income effect.
When the price of “A” Decrease real Income (purchasing power)
increases
Resulting in the consumer’s ability to
more of the other goods
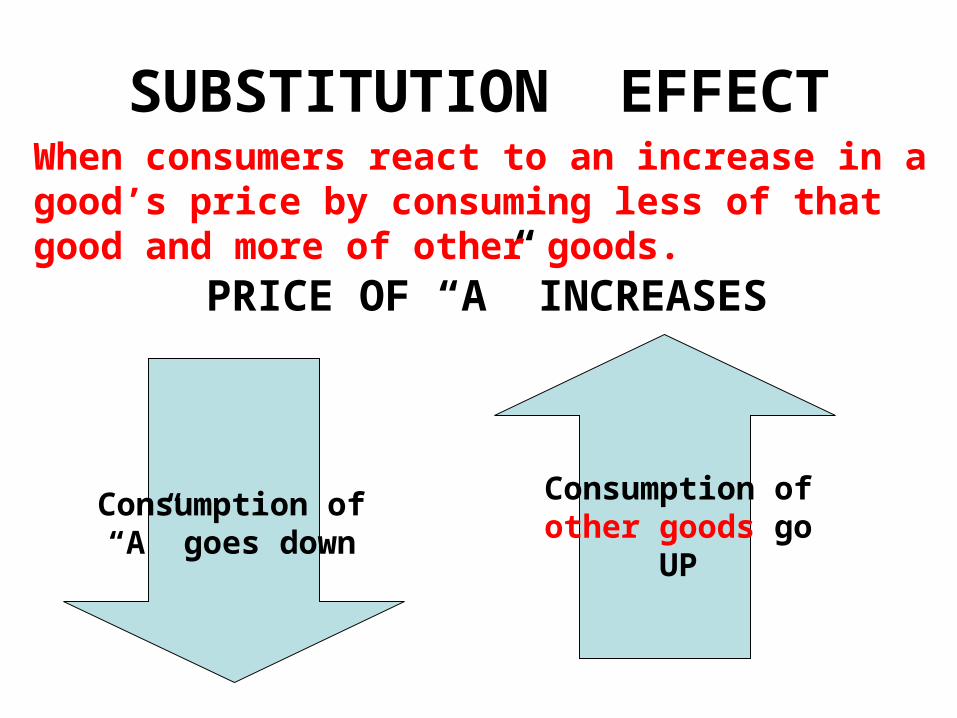
SUBSTITUTION EFFECT
PRICE OF “A” INCREASES
Consumption of “A” goes down
Consumption of other goods go UP
When consumers react to an increase in a good’s price by consuming less of that good and more of other goods.
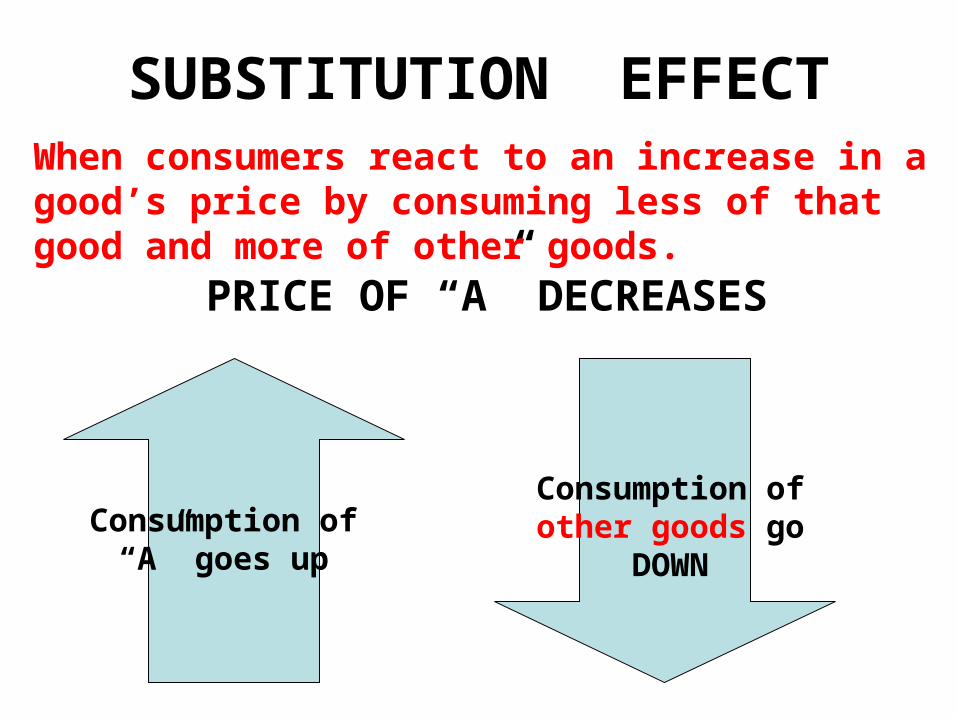
SUBSTITUTION EFFECT
PRICE OF “A” DECREASES
Consumption of “A” goes up
Consumption of other goods go
DOWN
When consumers react to an increase in a good’s price by consuming less of that good and more of other goods.
THE PRICE OF A CASE OF COCA COLA GOES UP TO $5.99 / CASE
PEOPLE WILL SUBSTITUTE FOR A CHEAPER COLA
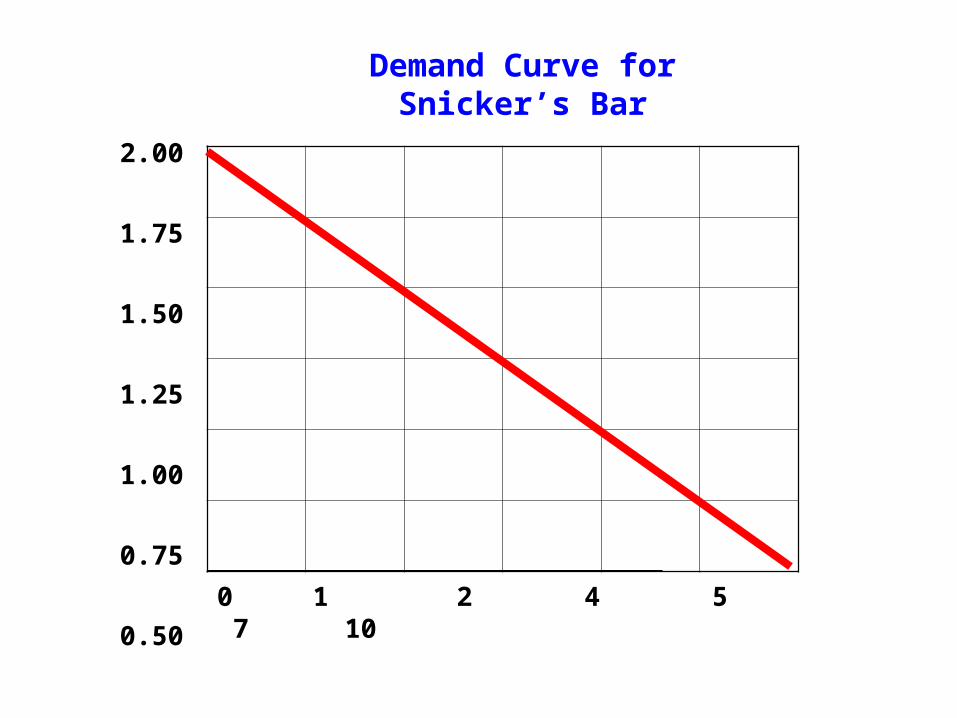
• For example let’s view a demand schedule for a “Snicker’s candy bar.
Price of Snicker’s
Quantity demanded
.50 10
.75 7
1.00 5
1.25 4
1.50 2
2.00 0
Demand Schedule
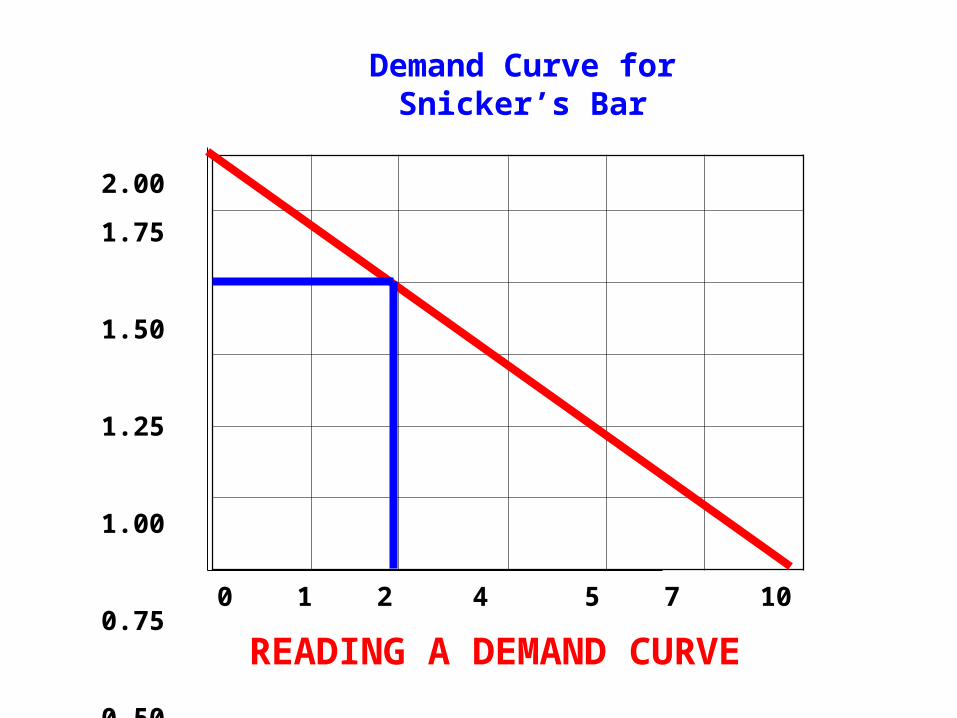
Demand Curve for Snicker’s Bar
0 1 2 4 5 7 10
2.00
1.75
1.50
1.25
1.00
0.75
0.50
READING A DEMAND CURVE
Demand Curves slope down from left to right
0 1 2 4 5 7 10
2.00
1.75
1.50
1.25
1.00
0.75
0.50
READING A DEMAND CURVE
The higher the price the lower the demand
SHIFTS OF THE DEMAND CURVE
• In this section we will understand the difference between a change in quantity demanded and a SHIFT IN QUANTITY demanded.
• A Shift involves factors other than price.
• For example let’s view a demand schedule for a “Snicker’s candy bar.
Price of Snicker’s
Quantity demanded
.50 10
.75 7
1.00 5
1.25 4
1.50 2
2.00 0
Demand Schedule
Demand Curve for Snicker’s Bar
0 1 2 4 5 7 10
2.00
1.75
1.50
1.25
1.00
0.75
0.50
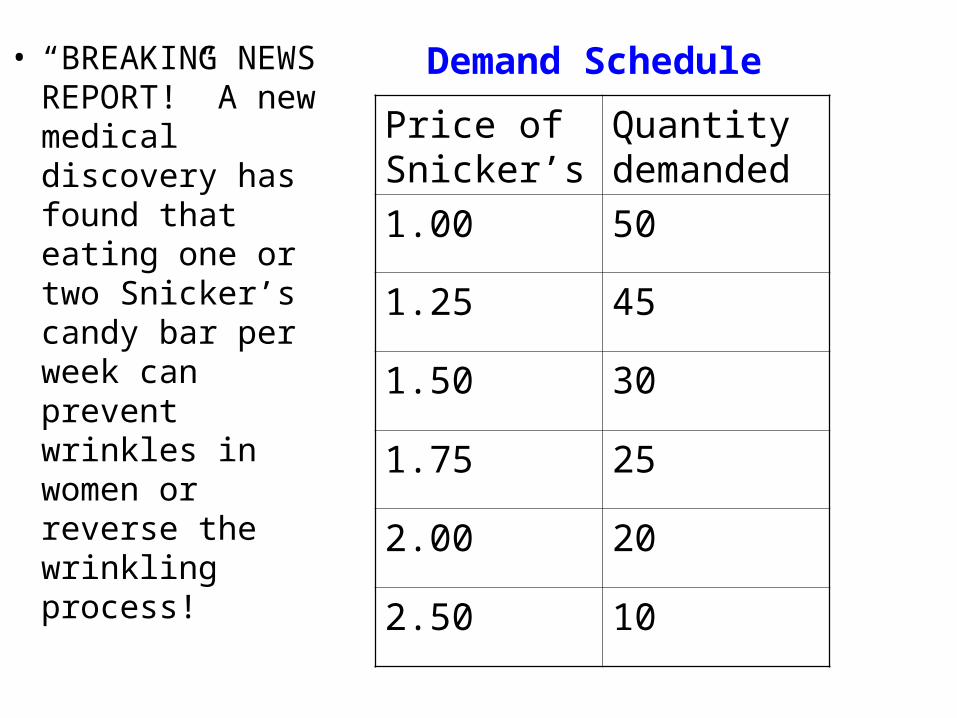
• “BREAKING NEWS REPORT!” A new medical discovery has found that eating one or two Snicker’s candy bar per week can prevent wrinkles in women or reverse the wrinkling process!
Price of Snicker’s
Quantity demanded
1.00 50
1.25 45
1.50 30
1.75 25
2.00 20
2.50 10
Demand Schedule
Demand Curve for Snicker’s Bar
0 10 20 25 30 45 50
2.50
2.00
1.75
1.50
1.25
1.00
Understanding Through Relating Terms & Sections
• Demand Shifts - A Shift involves factors other than price.– Ceteris paribus – “all other things held
constant.” – in the previous section the demand schedule only took into account prices.
• More factors than just price cause a shift in quantities demanded (key).
• A demand curve is accurate only as long as the “ceteris paribus” assumption is true.
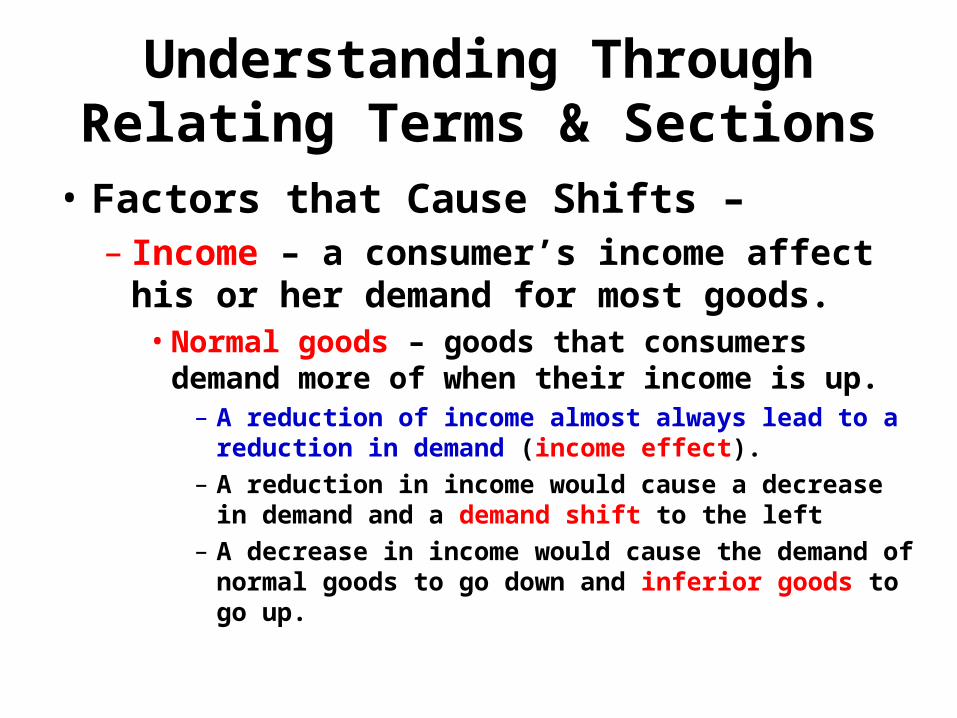
Understanding Through Relating Terms & Sections
• Factors that Cause Shifts –– Income – a consumer’s income affect his or
her demand for most goods.• Normal goods – goods that consumers demand
more of when their income is up.– A reduction of income almost always lead to a
reduction in demand (income effect). – A reduction in income would cause a decrease in
demand and a demand shift to the left– A decrease in income would cause the demand of
normal goods to go down and inferior goods to go up.
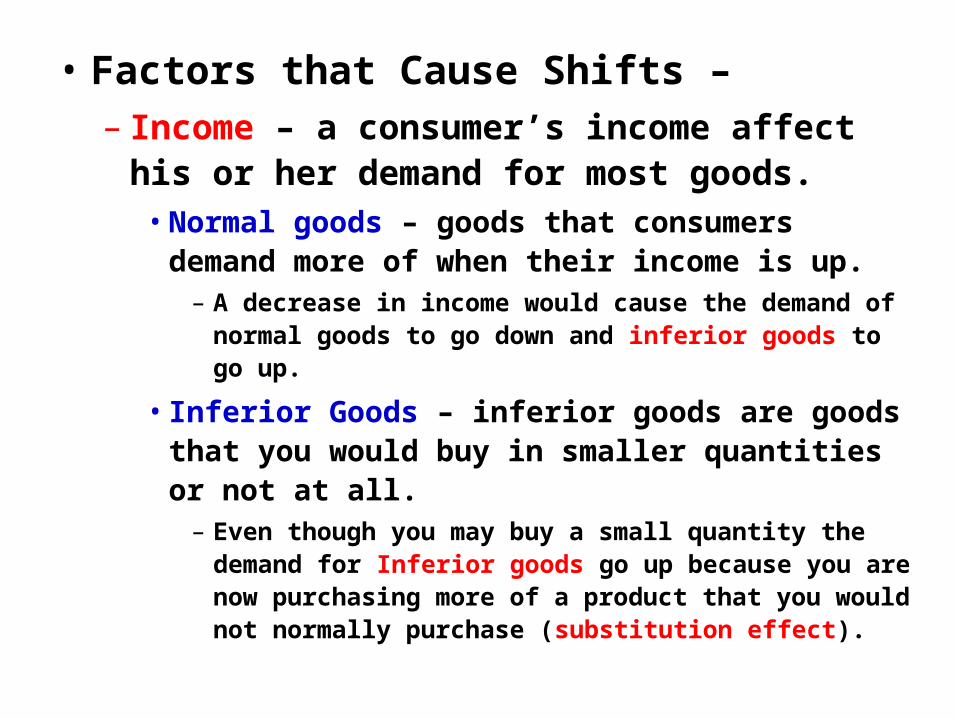
• Factors that Cause Shifts –– Income – a consumer’s income affect his or
her demand for most goods.• Normal goods – goods that consumers demand
more of when their income is up.– A decrease in income would cause the demand of
normal goods to go down and inferior goods to go up.
• Inferior Goods – inferior goods are goods that you would buy in smaller quantities or not at all.
– Even though you may buy a small quantity the demand for Inferior goods go up because you are now purchasing more of a product that you would not normally purchase (substitution effect).
• Factors that Cause Shifts –– Consumer Expectation – Our expectations
about the future affect our demand for certain goods.
• Would tax free weekend in August cause a demand shift to the left or right in July?
– The shift would be to the left because people will wait until the tax free weekend to satisfy their demands.
• Skinny leg jeans will double in price starting in April. Will the demand for skinny leg jeans shift to the left or right in March?
– The shift will be to the right because the immediate demand goes up in order to beat the price increase.
– Self interest becomes the incentive to buy.
• Factors that Cause Shifts –– Population – The size of the population
affect the demand for products.• Example – a new factory opens up in Macon
employing 1000 local workers but relocating 2000 employees to Macon.
– Which way will the demand for goods in Macon shift?
– Name some of the things that will cause an increase in demand.
– Consumer tastes & Advertising –• Once advertising makes a product popular how
is the demand for that product affected?
• Factors that Cause Shifts –– Price of Related Goods – the demand curve
for one good can affect positively or negatively the demand curve for another.
• Complements are two goods bought and used together.
– Computer, monitor, & printer – if the demand for computers rise the demand shift for monitors & printers go up.
– How will a rise in demand for laptops cause a demand shift for monitors? Which way will the shift go?
• Substitutes are goods used in place of one another.
PRICE GOES DOWN
Quantity Of Supply Goes Up
Price Goes Up
Quantity OF SUPPLY Goes DOWN
LAW OF SUPPLY
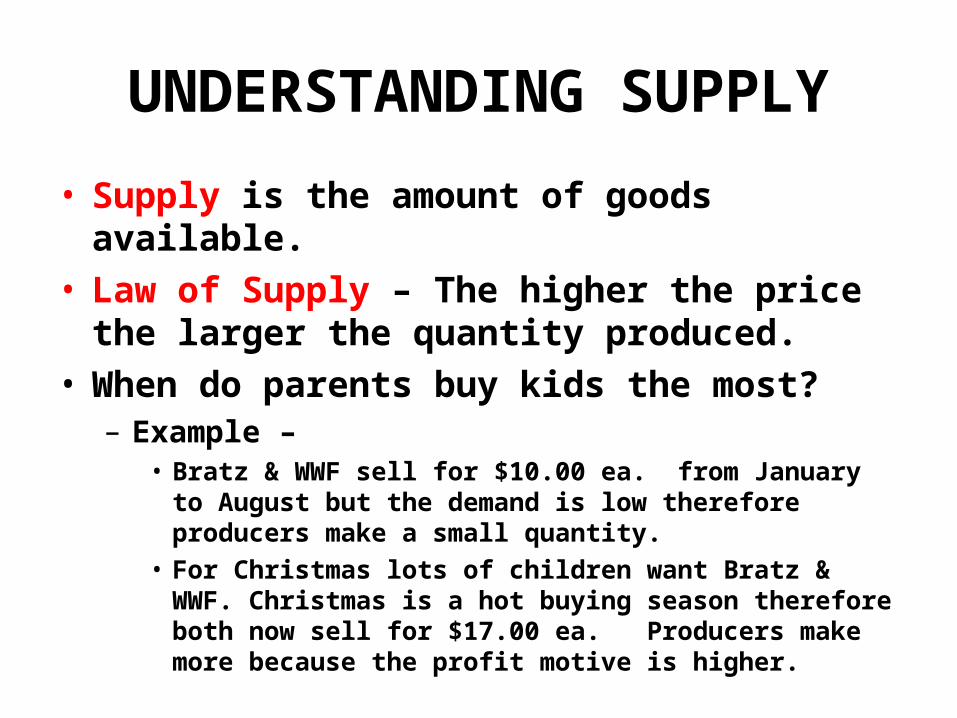
UNDERSTANDING SUPPLY
• Supply is the amount of goods available.• Law of Supply – The higher the price the
larger the quantity produced.• When do parents buy kids the most?
– Example – • Bratz & WWF sell for $10.00 ea. from January to August
but the demand is low therefore producers make a small quantity.
• For Christmas lots of children want Bratz & WWF. Christmas is a hot buying season therefore both now sell for $17.00 ea. Producers make more because the profit motive is higher.
• Quantity Supplied describes how much of a good is offered for sale at a specific price. – When the price of goods rise firms produce
more in order to earn more profit.– The key to profit is that they utilize almost the
same labor & output cost.– The rise in the price of goods causes new
firms to enter into the market.– Firms changing their level of output and new
firms entering into the market combine to create the Law of Supply.
– Bottom Line – The more money to be made the higher the supply becomes.
• If a firm is making a profit an increase in price will automatically bring an increase in profit.
• A Supply Schedule shows the relationship between a price increase of a good and the quantity supplied.– Variables are the factors that can change.
See Figure 5.2– A supply schedule only deals with price. It
shows how the price affects the producer’s output.
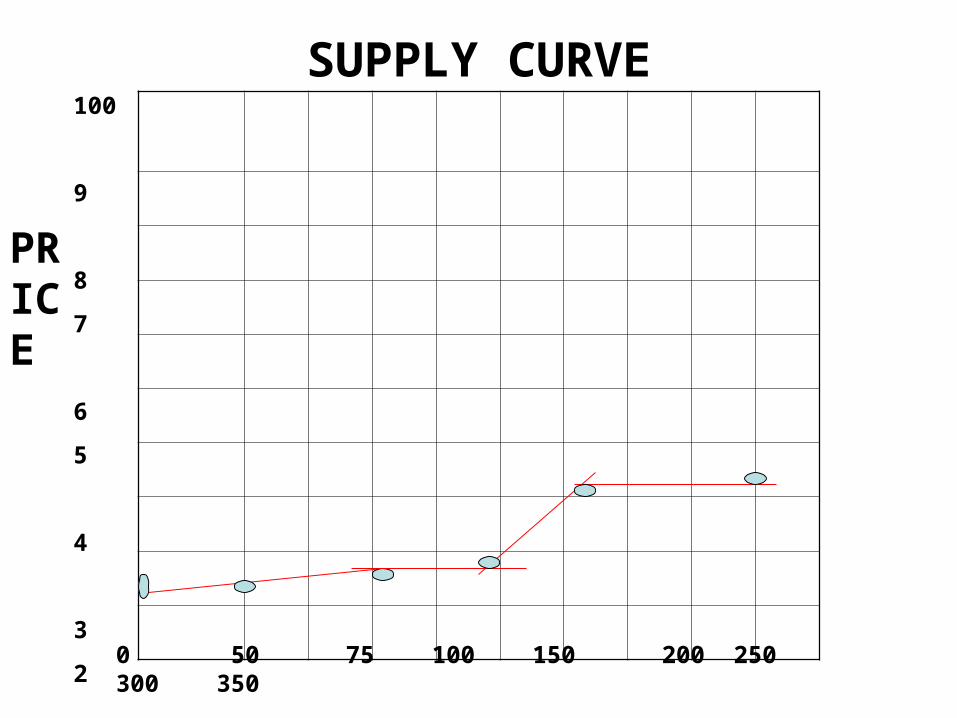
• A Supply Curve – is a graph of the data in a supply schedule.
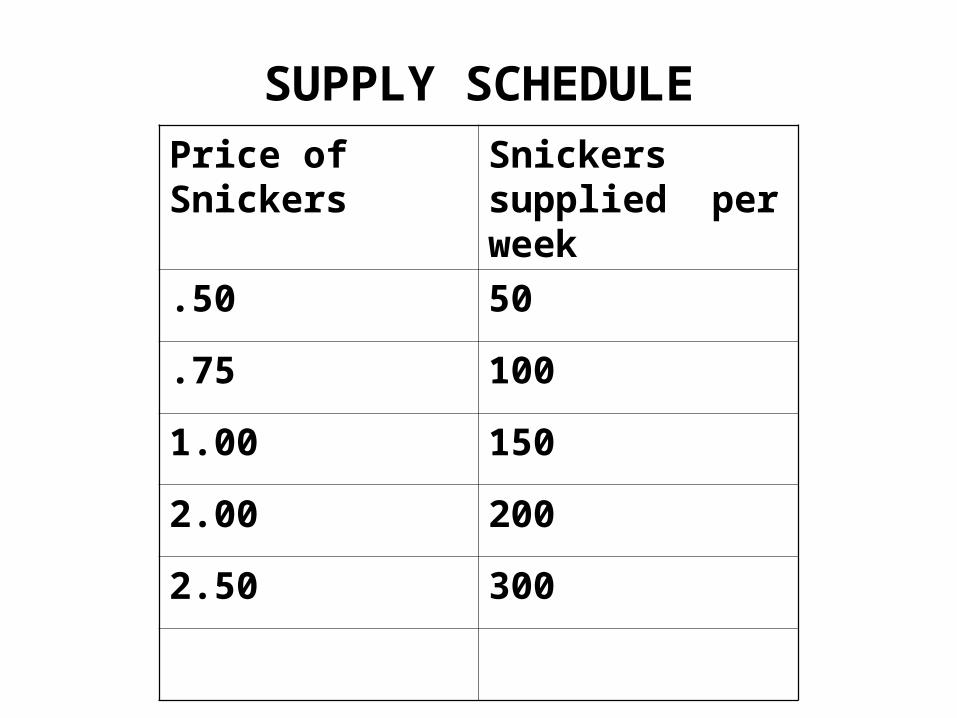
Price of Snickers
Snickers supplied per week
.50 50
.75 100
1.00 150
2.00 200
2.50 300
SUPPLY SCHEDULE
0 50 75 100 150 200 250 300 350
Quantity of Goods supplied
100
9
8
7
6
5
4
3
2
1
0
SUPPLY CURVE
PRICE
• Elasticity of Supply measures the way suppliers respond to a change in prices.– If elasticity is greater than one supply is
considered ________– If Elasticity is less than one supply is
considered ________– If Elasticity is equal to one supply is said to be
___________.
• Elasticity of Supply and Time– If a producer can change his production to
take advantage of a price increase the supply is elastic. A Baker (cakes double)
– If a producer cannot change in a short period of time the supply is inelastic. Hotel rooms
COSTS OF PRODUCTION
• Why do you suppose that some employers increase the work load on its employees instead of hiring help?
• Labor & Output – how does the number of workers affect production?– Marginal Product of Labor – the change in
output from hiring one more worker –• Why would an employer pay an employee
overtime instead of hiring another employee?
COSTS OF PRODUCTION
• Labor & Output – how does the number of workers affect production?– Marginal Product of Labor – the change in
output from hiring one more worker –– Recall THINKING AT THE MARGIN!!!
• Deciding whether to do or add one unit of resource.
• The marginal product of labor measures the change of output at the margin.
• Increasing Marginal Returns –a level of production in which the marginal product of labor (what is being made) increases as the number of workers increase.– More workers equal greater production– More workers can specialize thereby
creating EFFICIENCY.
• Diminishing Marginal Returns - a level of production in which the marginal product of labor decreases as the number of workers increase.– More workers equals less production.
Production Costs
• Fixed costs – a cost that does not change no matter how much goods are produced.
• Variable Costs – costs that rise or fall depending on the quantity produced.
• Total costs – the fixed costs and variables costs added together find the total cost.
• Marginal cost is the additional cost to produce one more unit.