Page 1
University of South CarolinaScholar Commons
Theses and Dissertations
2014
Understanding Destination Choice from a CulturalDistance PerspectiveHongbo LiuUniversity of South Carolina - Columbia
Follow this and additional works at: https://scholarcommons.sc.edu/etd
Part of the Hospitality Administration and Management Commons
This Open Access Thesis is brought to you by Scholar Commons. It has been accepted for inclusion in Theses and Dissertations by an authorizedadministrator of Scholar Commons. For more information, please contact [email protected] .
Recommended CitationLiu, H.(2014). Understanding Destination Choice from a Cultural Distance Perspective. (Master's thesis). Retrieved fromhttps://scholarcommons.sc.edu/etd/2668
Page 2
UNDERSTANDING DESTINATION CHOICE FROM A CULTURAL DISTANCE
PERSPECTIVE
by
Hongbo Liu
Bachelor of Science
Fudan University, 2012
Submitted in Partial Fulfillment of the Requirements
For the Degree of Master of International Hospitality and Tourism Management in
International Hospitality and Tourism Management
College of Hospitality, Retail and Sport Management
University of South Carolina
2014
Accepted by:
Xiang (Robert) Li, Director of Thesis
David Cardenas, Reader
Jiyeon Kim, Reader
Lacy Ford, Vice Provost and Dean of Graduate Studies
Page 3
ii
© Copyright by Hongbo Liu, 2014
All Rights Reserved.
Page 4
iii
DEDICATION
To my beloved parents and all relatives who give me endless love throughout my
life.
Page 5
iv
ACKNOWLEDGEMENTS
First of all, I would like to express my deepest gratitude to my advisor, Dr. Xiang
(Robert) Li, who gave me professional and patient guidance, tremendous support and
continuous encouragement, not only on my thesis writing, but also throughout the whole
process of my Master’s study. He is always very generous with his knowledge and time,
and seeking for the best for his students. I can never finish both my thesis and internship
at Disney at the same time without Dr. Li’s support and encouragement. I feel so lucky to
have such a good advisor.
Besides my advisor, I would also like to thank my committee members: Dr.
Jiyeon Kim and Dr. David Cardenas, who spent a lot of time reviewing my thesis drafts,
providing me constructive comments, guidance and tremendous support. My sincere
thanks also go to Dr. Yang Yang from Temple University, who gave me many patient
and helpful guidance in the data analysis process, Dr. Han Shen from Fudan University,
who helped review my questionnaire, and those student volunteers from Fudan
University and Tongji University, who helped me collect data through street interception
in Shanghai. Without their help, I would never be able to complete my thesis.
Specially, I would like to express my gratitude to my boyfriend, Haiyang Xu, who
always give me unconditional support and understanding. In particular, he helped me a
lot in the data collection process in Shanghai, despite that he was also very busy with his
internship at the same time.
Page 6
v
In addition, I would like to acknowledge my friends and study buddies: Allison
Zhang, Bing Guo, Kang Zheng, Qiulin Lv, Tao Lu, Xi Li, Xiao Lin, Yang Cao, Yao Hu,
Yimeng Zhou, Yingda Xu, Yingsha Zhang, Yujia Peng, etc. (Name listed in alphabetical
order, and I cannot list everyone due to space limitation). I highly appreciate their
warmhearted help during both my Master’s study and the process of my thesis writing. I
really appreciate having them in my life and those happy times we spent together.
Last but not least, I would like to show my greatest thanks to my dad and my
relatives. Thank you for raising me up, offering me good education, and providing me the
most unconditional love and financial support.
Page 7
vi
ABSTRACT
National cultural distance is an important factor of tourists’ destination choice, yet
the specific role it plays in destination decision process is not well understood. This paper
attempts to fill this gap. Taking potential Chinese outbound tourists as a case, this study
tries to explore the impact of perceived cultural distance on tourists’ international
destination choice through a conditional logit model. Familiarity, geographical distance,
past international travel experience and novelty-seeking tendency were examined as
moderators of the relationship between perceived cultural distance and destination
choice. Results show that tourist are more likely to choose culturally similar countries as
destinations; geographical distance and novelty-seeking tendency have significant
moderating effects on the relationship between perceived cultural distance and
destination choice. The research results are expected to provide insights for
understanding tourists’ destination choice from a cultural distance perspective, and
further shed some light on global destination marketing.
Page 8
vii
TABLE OF CONTENTS
DEDICATION ....................................................................................................................... iii
ACKNOWLEDGEMENTS ........................................................................................................ iv
ABSTRACT .......................................................................................................................... vi
LIST OF TABLES .................................................................................................................. ix
LIST OF FIGURES ...................................................................................................................x
CHAPTER 1 INTRODUCTION ...................................................................................................1
1.1 BACKGROUND OF THIS STUDY ..............................................................................1
1.2 OBJECTIVES OF THIS STUDY .................................................................................5
1.3 JUSTIFICATIONS OF THIS STUDY ...........................................................................7
1.4 LIMITATIONS & DELIMITATIONS ...........................................................................8
1.5 DEFINITION OF TERMS ..........................................................................................9
1.6 ORGANIZATION OF THIS STUDY ..........................................................................10
CHAPTER 2 LITERATURE REVIEW .......................................................................................11
2.1 INTRODUCTION ....................................................................................................11
2.2 DESTINATION CHOICE .........................................................................................12
2.3 CULTURAL DISTANCE ..........................................................................................14
2.4 CONNECTION BETWEEN DESTINATION CHOICE
AND CULTURAL DISTANCE .................................................................................20
2.5 POTENTIAL MODERATORS ...................................................................................24
2.6 SUMMARY ...........................................................................................................28
Page 9
viii
CHAPTER 3 METHODOLOGY ................................................................................................31
3.1 RESEARCH DESIGN ..............................................................................................31
3.2 SAMPLING ...........................................................................................................32
3.3 MEASUREMENT ...................................................................................................33
3.4 QUESTIONNAIRE DESIGN .....................................................................................35
3.5 DATA COLLECTION..............................................................................................35
3.6 DATA ANALYSIS ..................................................................................................38
CHAPTER 4 METHODOLOGY ................................................................................................40
4.1 DEMOGRAPHIC AND TRIPOGRAPHIC PROFILES ....................................................40
4.2 DESCRIPTIVE STATISTICS, RELIABILITY AND CORRELATIONS
OF EXPLANATORY VARIABLES ............................................................................45
4.3 HYPOTHESIS TESTING ..........................................................................................47
CHAPTER 5 CONCLUSIONS AND DISCUSSION ......................................................................57
5.1 REVIEW OF KEY FINDINGS ..................................................................................57
5.2 MANAGERIAL IMPLICATIONS ...............................................................................62
5.3 LIMITATIONS AND FUTURE RESEARCH ...............................................................64
REFERENCES .......................................................................................................................67
APPENDIX A – QUESTIONNAIRE DESIGN .............................................................................79
Page 10
ix
LIST OF TABLES
Table 2.1 Hofstede’s cultural framework ..........................................................................16
Table 2.2 Summary of hypothesis development ................................................................30
Table 4.1 Demographic profile of the sample ...................................................................41
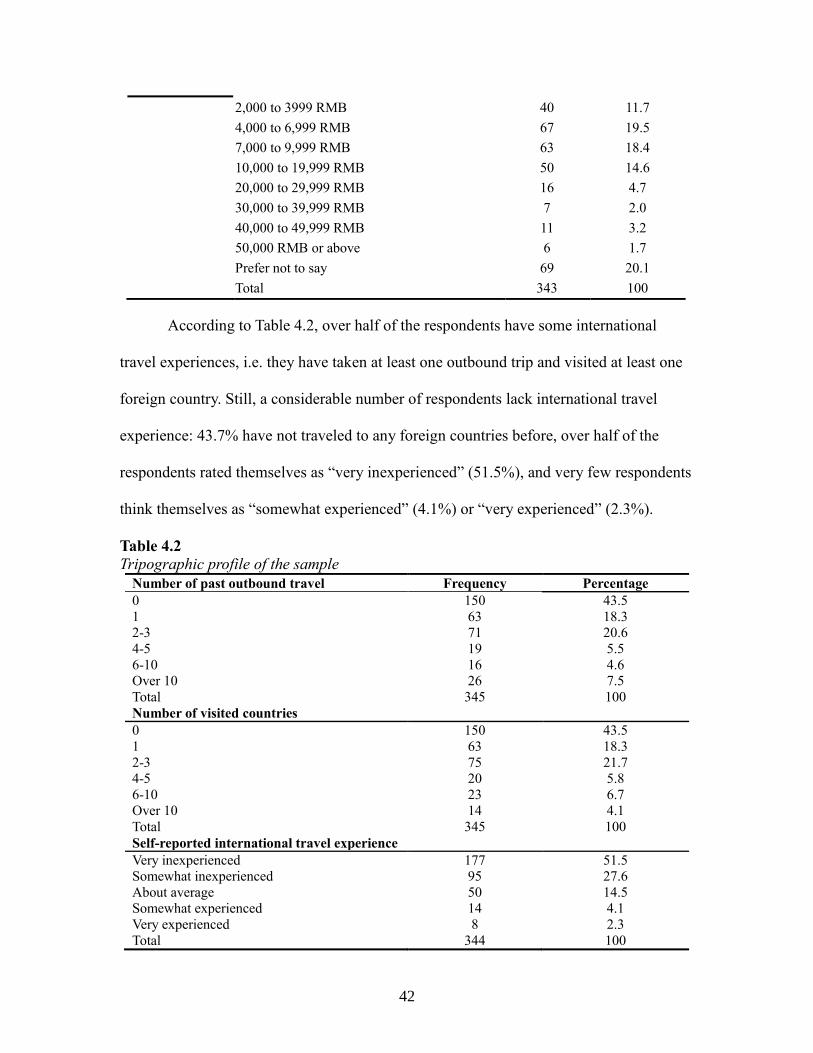
Table 4.2 Tripographic profile of the sample ....................................................................42
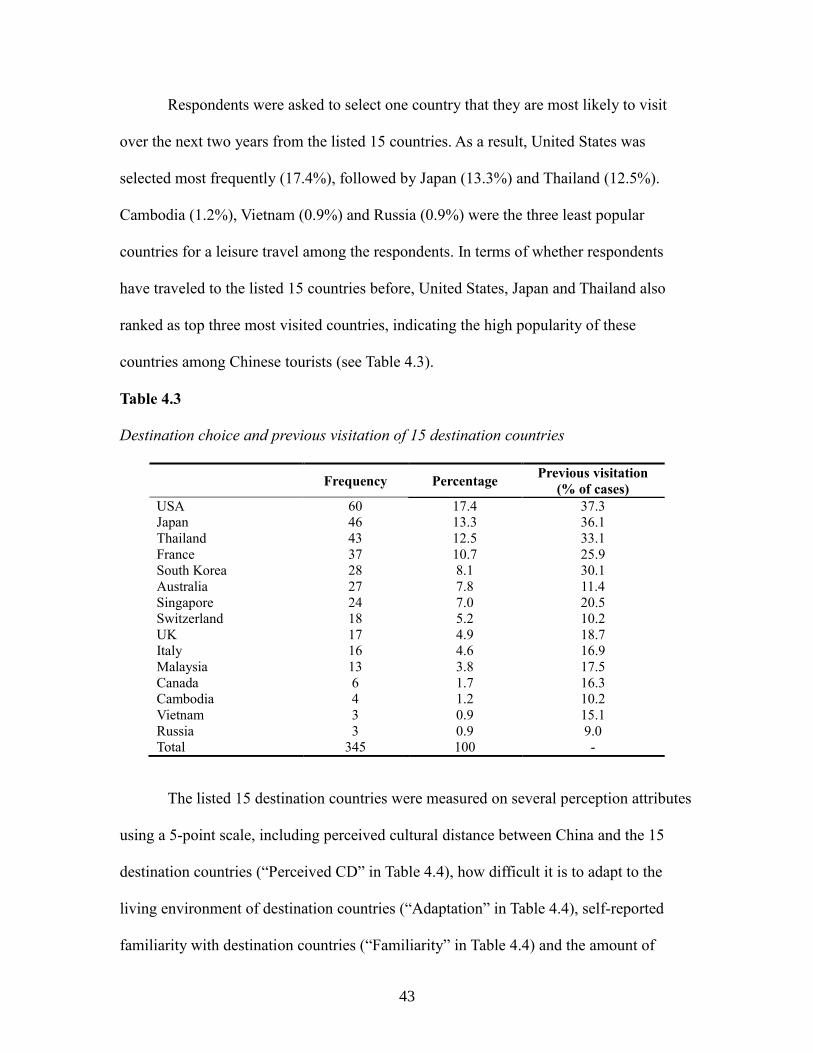
Table 4.3 Destination choice and previous visitation
of 15 destination countries .................................................................................43
Table 4.4 Perception attributes by countries ......................................................................44
Table 4.5 Descriptive statistics and reliability test
of research variables ..........................................................................................45
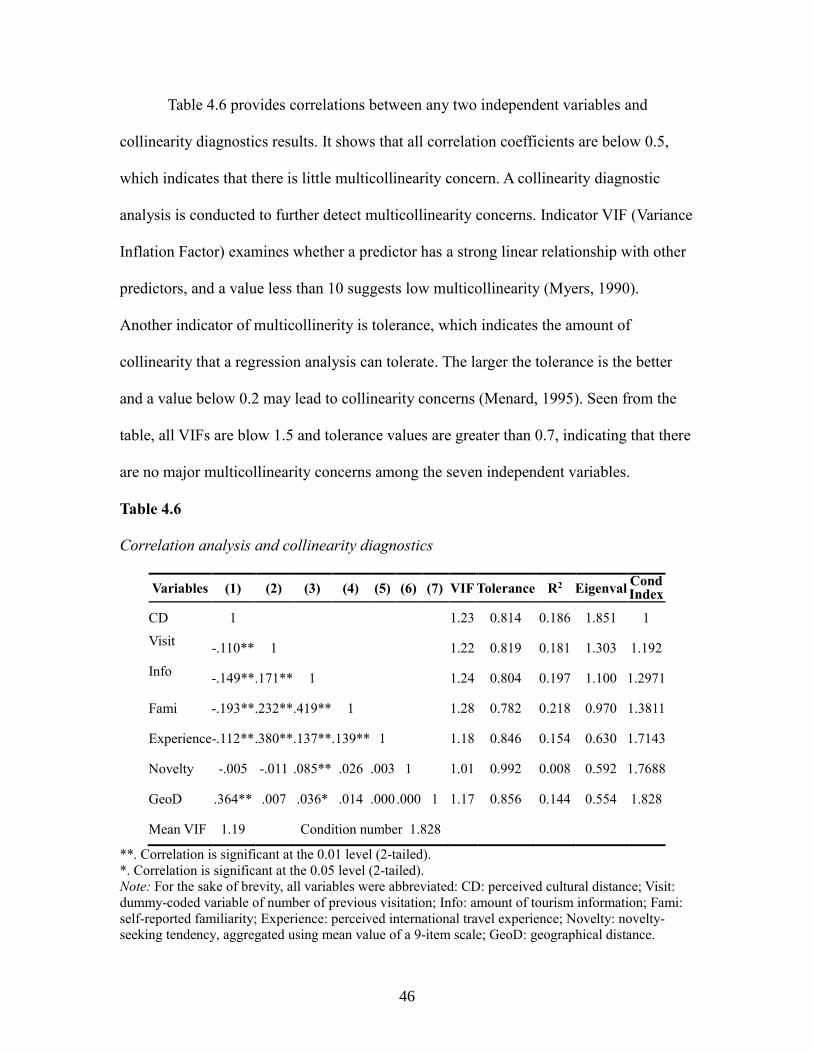
Table 4.6 Correlation analysis and collinearity diagnostics ..............................................46
Table 4.7 Model 1 ..............................................................................................................47
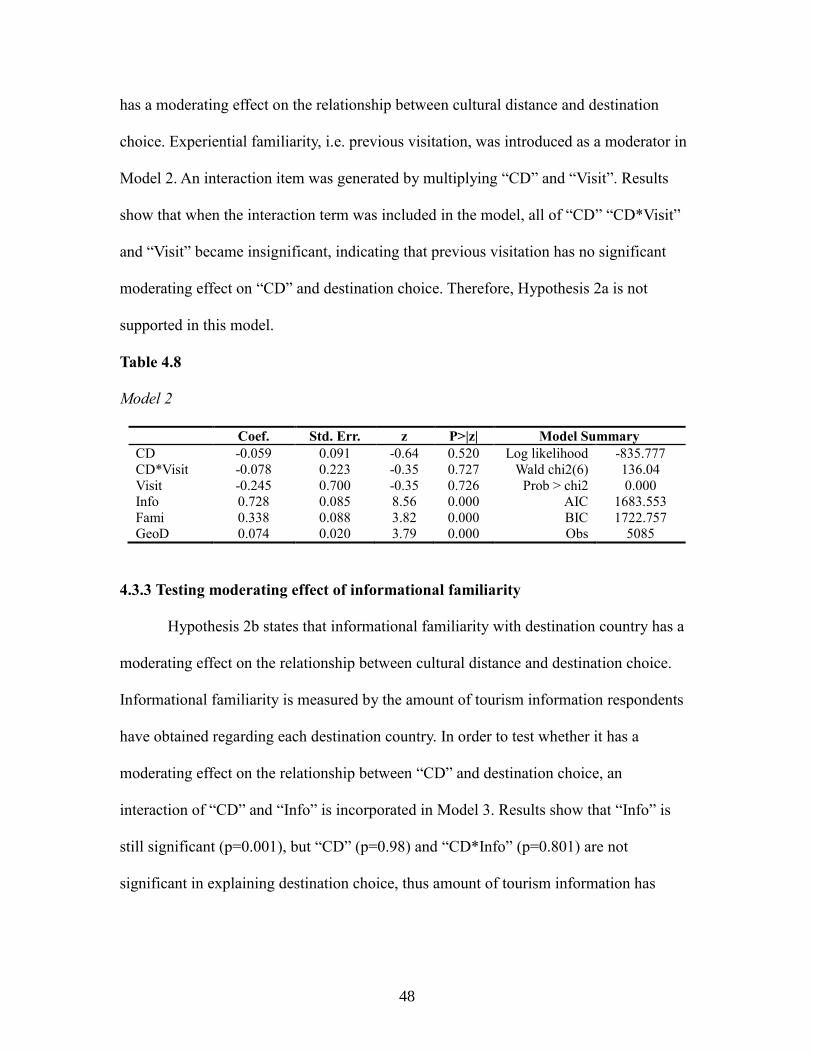
Table 4.8 Model 2 ..............................................................................................................48
Table 4.9 Model 3 ..............................................................................................................49
Table 4.10 Model 4 ............................................................................................................49
Table 4.11 Model 5 ............................................................................................................50
Table 4.12 Model 6 ............................................................................................................52
Table 4.13 Model 7 ............................................................................................................53
Table 4.14 Summary of Model 1–Model 7 ........................................................................55
Table 4.15 Summary of hypothesis test results .................................................................56
Page 11
x
LIST OF FIGURES
Figure 1.1 Number and expenditure of China’s
outbound tourists during 1992-2012 ...................................................................4
Figure 2.1 Theoretical model of this study ........................................................................29
Figure 3.1 Map of study site ..............................................................................................38
Figure 4.1 Predicted probabilities by country (regional travel) .........................................51
Figure 4.2 Predicted probabilities by country (long-haul travel) .......................................52
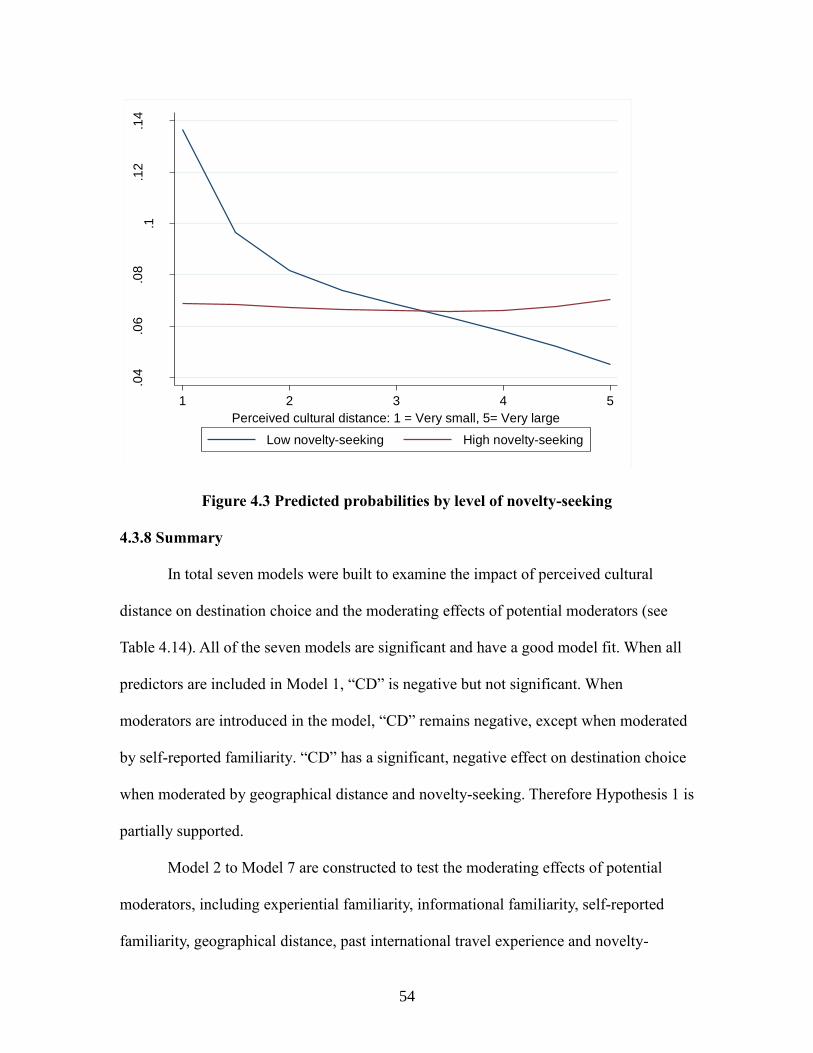
Figure 4.3 Predicted probabilities by level of novelty-seeking .........................................54
Page 12
1
CHAPTER 1
INTRODUCTION
1.1 Background of this study
International tourism has experienced rapid expansion in the past two decades.
According to a report from Word Tourism Organization (UNWTO), international tourist
arrivals has increased from 0.44 billion in 1990 to 1.04 billion in 2012, and it is expected
to reach nearly 1.6 billion by the year 2020 (UNWTO, 2013). Tourism has become one of
the major parts of international business. This is attributed to, for one thing, the advances
in economy and technology, which make outbound travel more affordable and
convenient; for another, the expansion of economic globalization and international
commerce, which stimulates business trips among different countries to a great extent. In
light of the global background of tourism development, understanding tourist behaviors
from cultural perspectives is becoming increasingly important for both industry and
academic researchers. National culture has been consistently shown as an important
factor that shapes and influences consumer behaviors (McCracken, 1986; Sojka &
Tansuhaj 1995). Taking cultural influences into consideration, tourism marketers and
managers would be able to better capture tourists’ characteristics and needs, further could
predict tourists’ behavioral intention, and provide more satisfactory tourist experiences.
Destination choice is one of the key elements in tourists’ travel decision-making
process (Wu, Zhang & Fujiwara, 2012). Studying tourists’ destination choice behaviors
and identifying factors affecting tourists’ destination decisions is of critical importance
Page 13
2
for destination marketers in order to attract tourists to visit and revisit the destinations.
Tourists’ destination decision-making has been extensively explored and numerous
variables have been recognized as explanatory variables of destination choice. These
variables could be generally classified into two categories: individual trait factors, such as
personal characteristics and social-demographic profiles, etc.; and environmental factors,
like marketing information and destination attributes, etc. (Hill, 2000). In previous
studies, cultural factors seem to be somewhat overlooked, although they could have
significant impacts on tourists’ destination decisions through acting as tourists’ social-
demographic background, psychological traits, as well as destination attributes.
Compared with other variables, like budget and spare time, it is not easy to detect the
effects of cultural factors on tourists’ destination choice, as cultural values are deeply
embedded in people’s minds along with their growth, and tend to be reflected in their
behaviors unconsciously.
In order to study cultural influences quantitatively, the notion of cultural distance
is introduced, which represents the extent of cultural differences between any two distinct
cultural systems. National cultural distance is defined as the extent to which cultural
norms and practices differ or to which a cultural gap exists among different countries
(Kogut & Singh, 1988). National cultural differences could inadvertently affect tourists’
destination choice through two ways, on one hand, tourists from different cultural groups
could behave differently in destination decision-making process; on the other hand,
cultural differences or similarities could be important destination selection criteria. Up to
present, very few studies have particularly focused on the impact of cultural difference on
destination choice, most of which conclude that tourists are more likely to choose
Page 14
3
culturally similar countries as destinations (Crouch, 1994; Ng et al. 2007; Yang & Wong,
2012). However, one study by Jackson (2001) reported a mixed result on the relationship
between cultural distance and destination choice: people from highly individualistic
countries tend to choose culturally similar destinations, and people from highly
collectivistic countries tend to choose culturally different destinations. The inconsistent
results make the topic worth of further research.
In the most recent decade, the rise of emerging markets has drawn world-wide
attention. The emerging markets are characterized by rapid economic growth, fast-pace
modernization, urbanization, large middle class, and increased consumer expenditure
(Waheeduzzaman, 2011). The growth of economy, middle class and consumer
expenditure in such nations like Brazil, Russia, India and China are enabling them to
become major and high-yielding international tourist source markets. According to the
newest UNWTO Tourism Highlights report, the market share of emerging economies
increased from 30% in 1980 to 47% in 2012, and it is expected to reach 57% by 2030,
equivalent to over one billion international tourist arrivals (UNWTO, 2013). Among the
major emerging economies, China is especially remarkable as the world’s fastest growing
and biggest-spending tourist source market (Reuters, 2013).
Page 15
4
Figure 1.1 Number and expenditure of China’s outbound tourists during 1992-2012
Source: China National Tourism Administration
China’s outbound tourism to foreign countries officially started from 1990, with
Singapore, Malaysia and Thai first opened to Chinese citizens. It has experienced
dramatic and continuous growth since then (Figure 1.1). The number of China’s
outbound tourists has increased from 2.93 million in 1992 to 83.18 million in 2012, and it
is estimated to exceed 100 million in year 2015 by UNWTO. In terms of international
tourism expenditure, China has surpassed German and United States to become the
worlds’ biggest spenders, with the spending increased from $2.51 billion in 1992 to $102
billion in 2012. Undoubtedly, China is growing to be the largest contributor of
international tourism, and Chinese tourists have become quite popular in the global
market that every destination marketer wants to compete for (Li, Harrill, Uysal, Burnett,
& Zhan, 2010). In this context, understanding the characteristics of Chinese outbound
tourists, and identifying the factors that affect Chinese travelers’ destination choice is of
significant interest to destination countries that are targeting Chinese tourists.
0
20
40
60
80
100
120
0
20
40
60
80
100
1992
1993
1994
1995
1996
1997
1998
1999
2000
2001
2002
2003
2004
2005
2006
2007
2008
2009
2010
2011
2012
Outbound tourists (Million) Spending (Billion)
Page 16
5
1.2 Objectives of this study
To this date, there is still a relative lack of empirical research specifically on the
relationship between cultural distance and destination choice, and the existing studies
have reported inconsistent conclusions about this topic, as mentioned earlier. Similar
contradictory conclusions about the relationship between cultural distance and entry
mode choices of multinational enterprises can also be found in international business
field (K. Brouthers & L. Brouthers, 2001; Cho & Padmanabhan, 2005; Chang, Kao, Kuo,
& Chiu, 2012, etc.), a phenomenon aptly termed as “National cultural distance paradox”:
some studies show that enterprises are more likely to choose joint ventures in culturally
distant countries, while other studies indicate wholly owned subsidiaries are more
preferred in culturally distant countries. It is suggested that potential moderators could be
incorporated in order to explain the cultural distance paradox (López-Duarte & Vidal-
Suárez, 2010; Shenkar, 2001). This study is interested in exploring the cultural distance
paradox in the context of tourists’ international destination choice through including
several potential moderators. The potential moderators, including familiarity,
geographical distance, past travel experience and novelty-seeking tendency, were selected
based on literature. Specifically, the objectives of the study are as follows:
(1) Examine the empirical significance of existing research on the relationship
between cultural distance and destination choice, and contribute to the lack of
empirical research on this topic.
(2) Test whether the selected potential moderators have effects on, and how they
affect the relationship between cultural distance and destination choice. Under
the moderating effects of other variables, what the relationship between cultural
Page 17
6
distance and destination choice will be like, and whether the cultural distance
paradox phenomenon exist in tourism context.
(3) Understand what Chinese outbound tourists’ destination preference will be like
in the future several years, and identify the factors (including cultural distance
and potential moderators) that could affect their destination choice.
(4) Provide insights for understanding tourists’ destination choice behaviors from a
cultural distance perspective, and further provide marketing implications for
global destination marketers, especially those who are targeting Chinese tourists.
Research hypothesis are as follows:
Hypothesis 1: Tourists are more likely to choose culturally similar countries as
destinations.
Hypothesis 2: Level of familiarity with destination country has a moderating
effect on the relationship between cultural distance and destination choice.
H2a: Experiential familiarity with destination country has a moderating effect on
the relationship between cultural distance and destination choice.
H2b: Informational familiarity with destination country has a moderating effect on
the relationship between cultural distance and destination choice.
H2c: Self-rated familiarity with destination country has a moderating effect on the
relationship between cultural distance and destination choice.
Hypothesis 3: Geographical distance between home country and destination
country has a moderating effect on the relationship between cultural distance and
destination choice.
Hypothesis 4: Past international travel experience has a moderating effect on the
Page 18
7
relationship between cultural distance and destination choice.
Hypothesis 5: Novelty-seeking tendency has a moderating effect on the
relationship between cultural distance and destination choice.
1.3 Justifications of this study
This study could make important contributions due to the following reasons:
Firstly, although extensive studies have been done on tourists’ destination choice,
very few studies have particularly involved cultural distance as an explanatory variable,
which makes the results from existing research still inconclusive. This study is expected
to make a contribution in this regard.
Secondly, most of previous studies used Kogut and Singh’s (1988) formula based
on Hofstede’s (1980) cultural scores to measure cultural distance, which is standardized,
unchanged and symmetric (Shenkar, 2001), and may not reflect the actual influence of
national culture on decision makers. Perceived cultural distance is employed in this study,
as a more individualized alternative.
Thirdly, in order to examine and further explain the cultural distance paradox in
destination choice, several variables were selected as potential moderators. Predicting
destination choice using cultural distance could be more powerful and convincing when
potential moderators are taken into account, as cultural distance will not work on its own,
many variables actually work together as a complex mechanism.
Lastly, many previous studies on this topic adopted tourist flow as dependent
variable in their studies on destination choice (Jackson, 2000, 2001; Yang & Wong,
2012). However, the inbound and outbound tourist flow could include trips for any
purposes, like business, visiting friends and relatives, etc. and many of them are not real
Page 19
8
leisure travelers. Notably, non-leisure travelers generally go through very different
destination decision-making process from their leisure counterparts. This study use
potential outbound tourists’ stated leisure destination choice as the dependent variable,
which could be more effective in studying leisure tourists’ destination choice.
1.4 Limitations & delimitations
This study is subjected to several limitations and delimitations:
First of all, this study is delimited to a convenience sample of potential mainland
Chinese outbound tourists in Shanghai, China who are planning to take a leisure trip
outside mainland China, Hong Kong, Macau and Taiwan. This delimitation makes the
study result not necessarily representative of the general Chinese population or people
from other societies or countries.
Secondly, the number of choice alternatives is restricted by the main method used
in this study: conditional logit model. Only 15 destination countries were listed in the
questionnaire to ask respondents to choose from (an option of “Other, please specify” is
also provided), as a result, respondents’ destination choices were limited by the list, and
further study results are also delimited to the 15 countries involved in this study.
Thirdly, tourists’ destination choice is delimited to tourists’ stated choice.
Although this could be superior to tourist flow as a measure of destination choice, the
stated choice records might be inconsistent with their actual choice due to many
situational factors (McKercher & Guillet, 2011).
Page 20
9
1.5 Definition of terms
(1) Destination choice
Destination choice is conceptualized as a tourist’s selection of a destination from
a set of alternatives (Hsu, Tsai & Wu, 2009). Usually it is considered as a decision-
making process from need recognition to final decision, during which it is affected by
various factors (Woodside & Lyonski, 1989; Um & Crompton, 1990; Crompton &
Ankomah, 1993).
(2) Culture
Culture is “the collective programming of the mind which distinguishes the
members of one human group from another” (Hofstede, 1980, p21).
(3) National cultural distance
National cultural distance is defined as the extent to which cultural norms and
practices in one country are different from another (Kogut & Singh, 1988).
(4) Familiarity
Familiarity is defined as the number of product-related experiences or the amount
of product-related information (Toyama & Yamada, 2012). Destination familiarity is
hence the number of experiences or amount of information received regarding a given
destination.
(5) Novelty-seeking
Novelty seeking is referred to a curiosity drive, sensation seeking, and an
exploratory drive that motivates tourists to travel (Jang & Feng, 2007). A novel travel is a
trip characterized by new and unfamiliar experiences that differ from prior life experience
(Faison, 1977).
Page 21
10
(6) Great circle distance
Great circle distance or orthodromic distance is the shortest distance between two
points on the surface of a sphere ((Berry, Guillén & Zhou, 2010).
1.6 Organization of this Study
This thesis consists of five chapters. Chapter 1 provides an introduction to the
research background, research objectives, the study’s importance, and definitions of
major terms. Chapter 2 presents a literature review of both the theoretical and empirical
studies concerning cultural distance, destination choice and potential moderating
variables. Chapter 3 describes the methods used in this study, including sampling, survey
development, data collection and analysis methods. Chapter 4 presents the data analysis
and hypothesis testing. Finally, Chapter 5 presents the conclusions and discussion.
Page 22
11
CHAPTER 2
LITERATURE REVIEW
2.1 Introduction
This literature review includes four sub-sections, namely (1) destination choice,
(2) cultural distance, (3) the connection between destination choice and cultural distance
and (4) potential moderators of the relationship between destination choice and cultural
distance.
The first section gives a brief introduction of destination choice. The definition
and influencing factors of destination choice are presented in this section. Cultural
distance is an important but understudied predictor of destination choice.
The second section reviews the conceptualization and measurement of cultural
distance. The Kogut and Singh’s (1988) cultural index based on Hofstede’s cultural
scores and perceived cultural distance are adopted in this study.
The third section presents the connection between destination choice and cultural
distance. Selected studies indicating the connection between national cultural background
and tourist behavior, and the connection between cultural distance and destination choice
are reviewed. In order to explain the destination choice and cultural distance paradox,
four potential moderators are selected from the literature: familiarity, geographical
distance, past travel experience and novelty-seeking. The last section discusses how each
of these moderators might affect the relationship between destination choice and cultural
distance and corresponding hypotheses are proposed after the discussion.
Page 23
12
2.2 Destination choice
Destination choice has always been one of the popular research topics in tourism
academic field (Crompton, 1977; Woodside & Lyonski, 1989; Um & Crompton, 1990;
Crompton, 1992; Keating & Kriz, 2008; Ahn, Ekinci, & Li, 2013, etc.), as it is of crucial
importance to destination marketing organizations (DMOs). By definition, destination
choice is a tourist’s decision on which destination to travel from multiple alternatives.
However, researchers often see consumers’ decision making as a sequential process,
which involves several steps from need recognition, information search, evaluation and
comparison of products, and then to final purchase decision (Kotler, 1997, Schiffman &
Kanuk, 1997; Solomon, 1996). In the context of tourism, tourists’ destination choice is
also a sorting out process, which contains a series of steps, including obtaining passive
information, initial choice considering situational constraints, evaluation of an evoked
set, active information searching and the final destination selection (Um & Crompton,
1990). This sorting out process could be influenced by a number of various internal
(motivations, attitudes, needs, etc.) and external factors (information, price, spare time,
etc.) (Woodside & Lyonski, 1989; Um & Crompton, 1990; Crompton & Ankomah,
1993).
Several similar frameworks have been developed to understand the process of
destination decision based on the behavioral decision theory (Mathieson & Wall, 1982;
Woodside & Lysonski, 1989; Um & Crompton, 1990; Crompton, 1992; Mansfeld, 1992;
Crompton & Ankomah, 1993; Moutinho, 1987). Overall, these frameworks (destination
choice process) are driven by various influencing factors of destination choice, and these
basic factors were classified by Lang, O’Leary, and Morrison (1997) as: 1) socio-
Page 24
13
demographic background (age, income, life cycle, etc.); 2) psychographic profiles
(benefit pursued, preference, attitude, etc.); 3) marketing variables (product design,
pricing, advertising, etc.); 4) destination-related attributes (attractions, situational
variables, etc.) and 5) destination awareness. Hill (2000) simply put these influencing
factors in two sets: environmental factors and individual trait factors. Environmental
factors refer to external forces like sources of information, culture, family, lifestyle, and
destination features, while individual trait factors refer to tourists’ personal characteristics
such as personal motivation, personality, and past experiences, etc. (Hill, 2000).
Among the various factors that affect tourists’ destination choice decision, culture
is an important one but remains understudied. The effect of culture on destination choice
is reflected in two aspects: firstly, tourists from different cultural backgrounds behaved
differently in choosing destinations (Richardson & Crompton, 1988; Wong & Lau, 2001);
secondly, cultural similarities or differences is an important preference criteria in
selecting a destination, some prefer destinations that are culturally similar to their home
country (Crouch, 1994), while others who are interested in cultural knowledge and
seeking novelty might be interested in culturally distant destinations. As an important
determinant of human behaviors and business practices in global market, cultural distance
has received substantial attention in international business and multinational corporate
management literature, but cultural distance research in tourism is still at its infancy in
tourism research. So far few studies have paid attention to the specific effect of cultural
distance on tourists’ destination choice (Jackson, 2000, 20001; Ng, Lee, & Soutar, 2007,
2009; Yang & Wong, 2012).
Page 25
14
2.3 Cultural distance
2.3.1 Definition
Culture is the “collective programming of the mind which distinguishes the
members of one human group from another” (Hofstede, 1980, p21). One way of dividing
people in the world is by their nationalities. Cultural differences and similarities may
exist among different nationalities. National cultural distance measures this gap, i.e. the
extent to which cultural norms and practices differ or to which a cultural gap exists
among different countries (Kogut & Singh, 1988). Culture is a very broad and complex
concept, hence to be more specific, national cultural distance describes differences
between any two countries with respect to the following aspects (Reisinger, 2009):
Human environment
Social heritage and traditions
Way of life.
Behavior
Rules of social life
Dress and appearance
Food and eating habits
Sense of self
Relationships
Values and norms
Beliefs and attitudes.
Ways of thinking and doing things
Work and leisure habits.
Time
Page 26
15
Cognitive knowledge
Mental process and learning
Information and communication
Symbols and meanings
Perceptions
Differences and similarities between people
From the perspective of knowledge flow, cultural distance is defined as “the sum of
factors creating, on the one hand, a need for knowledge, and on the other hand, barriers to
knowledge flow and hence also for other flows between the home and the target
countries” (Luostarinen, 1979, p131-132).
Cultural distance is derived from the comparison between national cultures. Many
frameworks have been developed to characterize national cultures and could be useful for
understanding and operationalizing differences across national cultures (e.g. Hofstede,
1980, 1991; Trompenaars, 1994, 1998; Schwartz, 1994). The most famous national
cultural framework is Hofstede’s (1980, 1991, 2010).
2.3.2 Hofstede’s (1980, 1991, 2010) cultural framework
Hofstede analyzed a large database of employee value scores collected by IBM
between 1967 and 1973 covering more than 70 countries, and found that employee values
in different countries could be statistically grouped into four clusters: 1) Power Distance
(PDI), 2) Individualism versus Collectivism (IDV); 3) Masculinity versus Femininity
(MAS), 4) Uncertainty Avoidance (UAI) (Hofstede, 1980). Later, a fifth dimension was
added in 1991 based on an international study by Michael Harris Bond among students
with a survey instrument that was developed within Chinese culture. This dimension was
Page 27
16
labeled as “Long-term/short-term orientation (LTO)” (Hofstede & Bond, 1988; Hofstede,
1991). Most recently, a sixth dimension “Indulgence versus Restraint (IVR)” was added
to the framework based on Michael Minkov's analysis of the World Values Survey data
for 93 countries (G. Hofstede, G. J. Hofstede, & Minkov, 2010) (See Table 2.1).
Table 2.1
Hofstede’s cultural framework
Dimensions Descriptions
Power Distance
(PDI)
The extent to which the less powerful members of institutions
and organizations within a country expect and accept that
power is distributed unequally (Hofstede, 1994, p. 28).
Individualism versus
Collectivism (IDV)
Individualism pertains to societies in which the ties between
individuals are loose: everyone is expected to look after
himself and his or her immediate family. Collectivism as its
opposite pertains to societies in which people from birth
onwards are integrated into strong, cohesive in groups, which
throughout people's lifetime continue to protect them in
exchange for unquestioning loyalty (Hofstede, 1994, p. 51)
Masculinity versus
Femininity (MAS)
Masculinity pertains to societies in which social gender roles
are clearly distinct (i.e. men are supposed to be assertive,
tough, and focused on material success whereas women are
supposed to be more modest, tender, and concerned with the
quality of life); femininity pertains to societies in which social
gender roles overlap (i.e., both men and women are supposed
to be modest, tender, and concerned with the quality of life
(Hofstede, 1994, p. 82-83).
Uncertainty
Avoidance (UAI)
The extent to which the members of a culture feel threatened
by uncertain or unknown situations (Hofstede, 1994, p. 113).
Long-term/short-
term orientation
(LTO)
Long Term Orientation stands for the fostering of virtues
oriented towards future rewards, in particular perseverance
and thrift. It’s opposite pole, Short Term Orientation, stands
for the fostering of virtues related to the past and present, in
particular, respect for tradition, preservation of ‘face’ and
fulfilling social obligations (Hofstede, 2001, p. 356).
Indulgence versus
Restraint (IVR)
Indulgence stands for a society that allows relatively free
gratification of basic and natural human drives related to
enjoying life and having fun. Restraint stands for a society
that suppresses gratification of needs and regulates it by
means of strict social norms (Hofstede et al., 2010, p. 281)
Page 28
17
Besides Hofstede’s framework, other researchers (Hall, 1976; Trompenaars, 1993;
Schwartz, 1994; Inglehart, 1997; House et al., 2004) have also developed some other
cultural frameworks. Overall, there is much overlap and similarity among these
frameworks, and many scholars (e.g. Hofstede, 1991; Morden, 1999; Groeschl &
Doherty, 2000; Schwartz, 1994, etc.) have pointed out that these cultural dimensions are
closely interrelated. Among these frameworks, Hofstede’s (1980, 1991, 2010) is the most
widely used in cross-culture research (Gales, 2008). It is also reported as the most
influential and comprehensive one (Smith, Dugan, & Trompenaars, 1996; Sivakumar &
Nakata, 2001). Nevertheless, Hofstede’s framework is not without its criticism. Schwartz
(1994) argues that Hofstede’s sample of countries did not accurately reflect the full
spectrum of national cultures, and the IBM employees surveyed by Hofstede were not
representative of the general population of their countries in terms of education, scientific
and technological background. Steenkamp (2001) pointed out that Hofstede's items refer
to work-related values, which might not completely represent values of people in other
roles (e.g. consumers). Plus, Hofstede's dimension of masculinity/femininity has been
criticized as being time- and context- specific (Steenkamp, 2001). Also Terlutter, Diehl,
and Mueller (2006) criticized that Hofstede (1980, 2001) confused values and behaviors
(practices) in his dimensions, which is a further weakness of his framework.
Nevertheless, Hofstede’s framework is still the most widely used one with well-
confirmed validity and reliability so far.
2.3.3 Measurement of Cultural Distance
Cultural distance has been studied as a determinant of various behaviors in cross-
cultural research for many years, such as foreign direct investment (FDI) entry (Du, Lu,
Page 29
18
& Tao, 2012), cross-border acquisition (Dikova & Sahib, 2013), international tourism
(Yang & Wong, 2012), expatriate job satisfaction (Froese & Peltokorpi, 2011), etc. A
variety of quantitative methods for measuring cultural distance as an independent
variable have been developed since early 1980s (Ng et al., 2007).
To sum up, there are mainly three categories of measures of cultural distance that
have been used so far. The first category is named as multi-dimensional cultural index,
including Kogut and Singh’s (1988) cultural index and Jackson (2001)’s cultural
diversity index. This type of methods composite multiple cultural dimensions into a
single overall scale. The second type is labeled as “proxy measures of cultural distance”.
Out of different understandings towards cultural distance, some researchers tend to
measure cultural distance using a related distance measure as a proxy of cultural distance,
such as linguistic distance (West & Graham, 2004), cultural clusters (Clark & Pugh,
2001; Yamin & Golesorkhi, 2010), and psychic distance (Fletcher & Bohn, 1998; Peng,
Hill, & Wang, 2000, etc.). The third measure of cultural distance is perceived cultural
distance, namely individuals’ perception of national cultural differences.
Kogut and Singh’s (1988) cultural index has been the most popular and widely
used method to measure cultural distance up to date, almost three quarters of studies in
this area used this measure according to Ng et al. (2007). This formula features
compositing multiple dimensions of national culture into a single construct, and
originally based on Hofstede’s (1980) four cultural dimensions. The overall cultural
difference between two countries is achieved through the following formula:
CD =1
𝑛∑{(𝐼𝑖𝐴 − 𝐼𝑖𝐵)2/𝑉𝑖}
4
𝑖=1
Where, CD stands for the cultural difference between Country A and Country B, 𝐼𝑖𝐴 is
Page 30
19
Hostede’s score of the 𝑖𝑡ℎ dimension of Country A, while 𝐼𝑖𝐵 is the same dimension’s
cultural score of Country B. 𝑉𝑖 is the score variance of all involved countries on the 𝑖𝑡ℎ
dimension, and n is the number of cultural dimensions.
The measurement of perceived cultural distance is achieved through interview or
questionnaire survey. Although this approach is more time-consuming and costly
compared with other methods (Ng et al., 2007), a group of researchers in the international
business field have recommended employing individual perceptual method to measure
cultural differences, as managers’ perceptions drive their strategic decisions and behavior
(Drogendijk & Slangen, 2006). Three types of instruments are identified in previous
perceived cultural distance studies: most researchers, such as Meschi (1997), Nesdale and
Mak (2003), Galchenko and Vijver (2007), Drogendijk and Slangen, (2006), etc. adopted
a single question design: “How large are the national cultural differences between
Country A and Country B?” to measure the overall perceived cultural distance between
two countries. Respondents are requested to respond using a five or seven point Likert
scale from “very large” to “very small”. The second instrument is multi-dimensional
questionnaire, which contains questions regarding different dimensions of national
culture (Babiker, Cox, & Miller, 1980). A third type of instrument is scenario
questionnaire measure (Chirkov, Lynch, & Niwa, 2005), which allows researchers to
capture the automatic or subconscious cognitive processing and responses that represent
the nature of respondents’ cultural orientations. Ng et al. (2007) found that perceived
cultural distance was most significantly correlated with tourists’ intentions to visit
holiday destinations (dependent variable) compared with other cultural distance measures
in their study. More importantly, perceived cultural distance measure is expected to
Page 31
20
overcome the illusions of symmetry and stability proposed by Shenkar (2001), as people
in Country A do not necessarily perceive Country B the same cultural distance as their
counterparts in Country B perceive Country A. Besides, surveys and interviews can
always get the newly updated perceived cultural distance.
2.4 Connection between destination choice and cultural distance
Many researchers have found that national cultural background makes a
difference in various aspects of tourist behavior, such as tourist motivation (You,
O’Leary, Morrison, & Hong, 2000), information search, planning, and purchase of
international travel vacations (Money & Crotts, 2003), evaluation of travel services
(Crotts & Erdmann, 2000), consumption patterns (Rosenbaum & Spears, 2005), travel
behaviors (Crotts, 2004), and destination choice (Jackson, 2000, 2001; Ng et al., 2007,
2009; Yang & Wong, 2012). Consisting in “patterned ways of thinking, feeling, and
reacting”, which could be acquired and transmitted by symbols under a certain cultural
background (Kluckhohn, 1961, p 86), national culture is undoubtedly one of the many
forces influencing consumer behavior (Crotts & Erdmann, 2000; Litvin, Crotts, &
Hefner, 2004; Crotts, 2004). Researchers have generated a great deal of evidence
suggesting that national cultural characteristics or nationality influences tourist behavior
(Richardson & Crompton, 1988; Ritter, 1987; Pizam & Sussmann, 1995; Pizam & Jeong,
1996). For example, aiming to answer the question "Does nationality influence tourist's
behavior”, Pizam and his co-authors (Pizam & Sussmann, 1995; Pizam & Reichel, 1996;
Pizam & Jeong, 1996; Pizam, Jansen-Verbeke, & Steel, 1997; Pizam, 1999) conducted a
series of surveys on tour guides’ perceptions towards the behavioral characteristics of
tourists from different countries. Results strongly support that nationality does affect
tourist behavior, and there are differences and similarities between behaviors of tourists
Page 32
21
from different countries: Japanese and Korean tourists were perceived to be similar in
traveling behaviors, while French and American tourists’ behaviors were perceived as
quite different from each other.
Cultural distance between the origin and destination has been suggested as one of
the four key cultural elements influencing tourists’ behaviors; the other three elements are
tourist’s national culture, individual culture and destination culture (Ng et al., 2007; Yang
& Wong, 2012). Crotts and his colleagues (Crotts & Erdmann, 2000; Crotts, 2004; Litvin
et al., 2004; Money & Crotts, 2003) have conducted a series of studies on the influence of
cultural distance on different tourists’ behaviors based on Hofstede’s national cultural
dimensions. They paid special attention to the role of uncertainty of avoidance (UAI), and
found that consumers from national cultures of higher levels of UAI prefer to use
information sources that are related to the distribution channels (e.g., travel agent),
instead of personal, destination marketing-related, or mass media sources; they also more
frequently purchase prepackaged tours, travel in larger groups, stay shorter, and visit
fewer number of destinations. Results also show that consumers from less masculine
cultures were found more loyal, while consumers from more masculine societies are
more likely to show higher customer defection (Crotts & Erdmann, 2000). Reisinger and
Turner (2002a, 2002b) analyzed the cultural differences between Asian tourists and
Australian service providers (destination hosts), and further empirically confirmed that
cultural differences between tourists and the host in values and rules of social behavior
have a significant influence on tourist satisfaction, and cultural differences in perceptions
have a direct effect on social interaction.
Page 33
22
Several scholars have made special efforts to explore the relationship between
cultural distance and destination choice. Most of the existing studies indicate that tourists
are more likely to choose culturally similar destinations (Jackson, 2000; Ng et al., 2007,
2009; Yang & Wong, 2012), for example Saudi tourists prefer to visit Muslim countries
(Yavas, 1987). The initial literature support, according to Ng et al. (2007), comes from
social psychology. Byrne and Nelson (1965) suggested people are usually attracted to
others who have similar attitudes and beliefs with them; this explains why people are
always trying to find common points while making friends. Cultural differences in food,
language, habits, pace of life, recreation, standard of living, transportation etc., could give
rise to uncomfortable feelings and unpleasant experiences, such as stress, anxiety and
uncertainty (Reisinger & Turner, 1998; Spradley & Philips, 1972); this is the so called
culture shock. In addition, cultural differences could also lead to misunderstandings and
interfere with communications between tourists and hosts, and even lead to cultural
conflicts. While small cultural distance makes it easier to interact with local people, and
enhances tourists’ experiences. Under this inference, Yang and Wong (2012) involved
cultural distance in their tourism demand analysis, and found that cultural distance has a
significant negative effect on tourism flows, which means cultural distance is a barrier for
international travel. Jackson (2000) also adopted tourist flow as a measurement of
destination choice, and found cultural distance is negatively related with Australia’s
international tourism flow. Ng et al. (2007, 2009) conducted two studies on the impacts
of cultural distance on tourists’ visit intention and likelihood; results again support the
negative impact of cultural distance on destination choice. Therefore, it is hypothesized
that:
Page 34
23
H1: Tourists are more likely to choose culturally similar countries as destinations.
However, there is also a study reporting mixed results regarding the relationship
between cultural distance and destination choice. The study Jackson conducted in 2001
reported that people from highly individualistic countries (such as Australia, Canada,
New Zealand and the United States) tend to choose culturally similar destinations, while
people from highly collectivistic countries (such as Colombia, El Salvador, Ecuador and
South Korea) tend to choose culturally dissimilar destinations. Considering the influence
of other variables, like novelty-seeking, the relationship between cultural distance and
destination choice could become positive, which is against with previous studies. Driven
by the human nature of curiosity, sensation and exploration (Jang & Feng, 2007), some
people could be more interested in exotic cultures. It is worth noting that international
business literature has found similar inconsistent conclusions about the relationship
between cultural distance and investment entry mode choice: some researchers indicate
that companies more likely to choose full control of entry modes in culturally distant
countries (Shane, 1994; Anand & Delios, 1997; Padmanabhan & Cho, 1996, etc.); while
others show that companies are more likely to adopt joint ventures (JVs), or collaborative
mode of entry in culturally distant countries (Chang & Rosenzweig, 2001; Erramilli &
Rao, 1993, etc.). This phenomenon is termed as “cultural distance paradox”.
These inconsistent results, according to Shenkar (2001), may result from some
theoretical and methodological concerns of cultural distance. He argued that it is
groundless to assume that the cultural distance between two countries is symmetric and
constant, and that the relationship between cultural distance and investment, entry mode,
and performance is linear and causal. In order to explain this cultural distance paradox,
Page 35
24
international business researchers suggested incorporating potential moderators, such as
foreign investor's accrued experience (Cho & Padmanabhan, 2005), investment risk (K.
Brouthers & L. Brouthers, 2001), language diversity between the home and host
countries (López-Duarte & Vidal- Suárez, 2010), and host country’s governance quality
(Chang et al., 2012), which could cast impacts on the relationship between cultural
distance and entry mode choice. Shenkar (2001) was also against that culture is the only
determinant of distance with relevance to other dependent variables and suggest
incorporating other related factors (e.g., language) to better capture socio-cultural
differences. Therefore, familiarity, past travel experience, novelty-seeking and
geographical distance were selected as potential moderations based on literature review
in this study.
2.5 Potential Moderators
2.5.1 Familiarity
Familiarity is defined as the number of product-related experiences or the amount
of product-related information (Toyama & Yamada, 2012). Familiarity with destination is
an important psychological and cognitive factor influencing tourists’ destination selection
process (Lee & Tussyadiah, 2012; Baloglu, 2001). In tourism, the construct of familiarity
is divided into several dimensions, and the commonly accepted dimensions include level
of knowledge, amount of information, previous visitation (Hu & Ritchie, 1993; Baloglu,
2001; Prentice, 2004). Previous empirical studies indicate that familiarity could positively
affect tourists’ interest and likelihood of visiting a destination (Yang, Yuan, & Hu, 2009).
For one thing, out of safety and security concerns, tourists tend to avoid uncertainty in
unfamiliar destinations (Yang et al., 2009). For another, it has been empirically confirmed
that familiarity is positively related to the formation and modification of destination
Page 36
25
image (Prentice & Andersen, 2000; Baloglu, 2001), which could be affected by both
knowledge level and amount of information acquired before visitation (Baloglu, 2001),
and actual visit experience (Hu & Ritchie, 1993; Milman & Pizam, 1995; Dann, 1996).
Moreover, familiarity could also affect tourists’ information acquisition, reactions to
advertising, and the choice of decision rules by consumers (Johnson & Russo, 1984).
Many studies report that people who are less familiar with a destination are more likely to
seek for more information (Woodside & King, 2001; Carneiro & Crompton, 2010).
Tourists are usually more comfortable and confident when they acquired enough
knowledge about a destination while making a destination choice (Mackay &
Fesenmaier, 1997).
Based on the above discussion, Hypothesis 2 is presented as:
H2: Level of familiarity with destination country has a moderating effect on the
relationship between cultural distance and destination choice.
H2a: Experiential familiarity with destination country has a moderating effect on
the relationship between cultural distance and destination choice.
H2b: Informational familiarity with destination country has a moderating effect on
the relationship between cultural distance and destination choice.
H2c: Self-rated familiarity with destination country has a moderating effect on the
relationship between cultural distance and destination choice.
2.5.2 Geographical distance
The distance between tourists’ usual living area and the destination is an
important criterion of destination choice (Nicolau & Más, 2006; Lee, Guillet, Law, &
Leung, 2012). Geographical distance affects tourists’ destination decision through travel
Page 37
26
time and costs. Distant destinations usually represent long traveling time, higher traveling
expenses, as well as possible physical and mental fatigue resulted from the long journey.
But some scholars revealed that tourism demand increases along with the increase of
distance at first until reaching a certain level, after which the tourists’ demand begins to
decline as geographical distance increases (Greer & Wall, 1979; Bull, 1991; McKercher,
1998). McKercher and Lew (2003) and Lee et al. (2012) later identified that there are
more fluctuations after the first peak in tourism demand along with the increase of
traveling distance. Cultural geography implies that people in a certain area may share
similar cultural factors (Heatwole, 2006); for example, most countries within the Middle
East area share similar cultures. Hence it is possible that people might perceive two
countries that are close in geographic proximity also as close in cultural distance. It is
confirmed by a study on international stock market that cultural distance measured by
Kogut and Singh index is positively correlated with geographical distance (Lucey &
Zhang, 2010). Therefore, it is hypothesized that
H3: Geographical distance between home country and destination country has a
moderating effect on the relationship between cultural distance and destination choice.
2.5.3 Past travel experience
Past travel experience has been acknowledged as a strong stimulus of future
behavioral intentions (Mazursky, 1989; Sönmez & Graefe, 1998; Nyaupane, Paris, &
Teye, 2011). Mazursky (1989) argued that travel decision can be influenced both by the
extent as well as the nature of past travel experience. Satisfactory travel experience could
enhance one’s intention to revisit the same or similar destinations. Meanwhile, past travel
experience can also reduce one’s desire to visit some destinations either because of
Page 38
27
unpleasant experience with the same or similar destinations, or simply because tourists’
needs or willingness of visiting a destination have been fulfilled, then they will switch to
other destinations for next trip.
After visiting a country, there is a gap between actual experiences and pre-trip
knowledge, and the gap could make a difference on one’s perception about cultural
distance before and after the trip. Meanwhile, the level of past international travel
experience could affect tourists’ judgment towards cultural difference between two
countries, as the more a person have traveled internationally, the more adaptive the
person could be to cultural differences among different countries. Cho and Padmanabhan
(2005) proposed that “decision-specific experience-moderated cultural distance” is a
better variable to measure the real effect of cultural distance on foreign ownership mode
choice than the “absolute cultural distance” variable (p. 307). Past experience is included
as a control variable in many cultural distance studies in international business domain
(e.g. Chang et al., 2012; Dikova & Rao Sahib, 2013, etc.). Based on the discussion about
past travel experience, the fourth hypothesis is proposed,
H4: Past international travel experience has a moderating effect on the relationship
between cultural distance and destination choice.
2.5.4 Novelty-seeking tendency
Driven by the human nature of curiosity, sensation and exploration (Jang & Feng,
2007), novelty-seeking is not only one of the key travel motivations, but also an
important aspect of human’s personality trait (Cohen 1972; Crompton 1979; Basala &
Klenosky, 2001). It is widely accepted that novelty-seeking could affect tourists’
decision-making process (Petrick, 2002). Jang and Feng (2007) pointed out that, the
Page 39
28
influence of novelty-seeking on tourists’ destination choice lies in that tourists may have
different levels of novelty-seeking while making a destination decision and different
destinations may satisfy similar desires for novelty. Novelty-seeking tendency of tourists
is reflected as behaviors seeking for new and unfamiliar experiences, as well as new
knowledge (Crompton, 1979; Faison, 1977), which means that tourists with higher level
of novelty-seeking tendency might be interested in culturally distant destinations. Several
scholars, such as Cohen (1972) and Plog (1974), have developed tourist typology models
based on the familiarity-novelty continuum. According to Plog (1974, 2001)’s typology,
tourists who are adventurous, outgoing, novelty-seeking and explorative were labeled as
“venturers”. Culturally dissimilar destinations could be more attractive to those
“venturers”, who are young, adventurous, and educated (Reisinger, 2009). On the basis of
the foregoing analysis, Hypothesis 5 is stated as:
H5: Novelty-seeking tendency has a moderating effect on the relationship between
cultural distance and destination choice.
2.6 Summary of literature review
This chapter reviewed previous theoretical and empirical studies on the main
constructs of this study: destination choice, cultural distance, familiarity, geographical
distance, past travel experience and novelty-seeking. Relevant theories, empirical
findings were reported and the relationships between these variables were analyzed, a
theoretical model is hence provided here:
Page 40
29
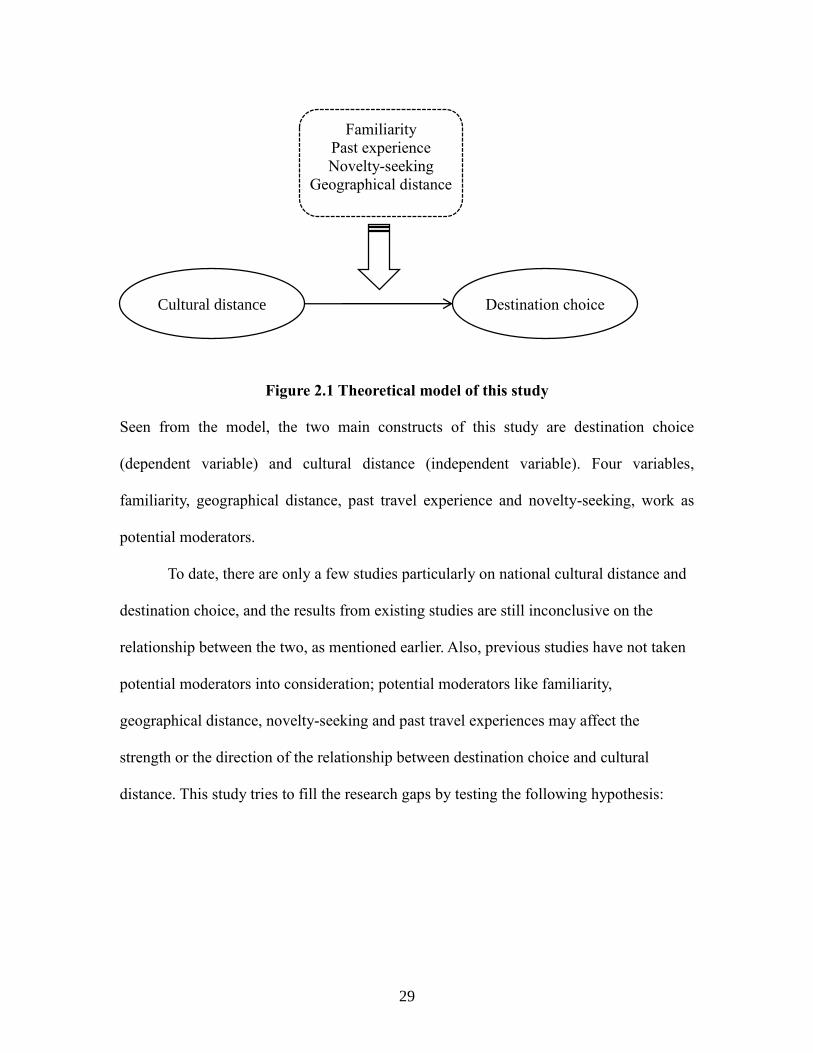
Figure 2.1 Theoretical model of this study
Seen from the model, the two main constructs of this study are destination choice
(dependent variable) and cultural distance (independent variable). Four variables,
familiarity, geographical distance, past travel experience and novelty-seeking, work as
potential moderators.
To date, there are only a few studies particularly on national cultural distance and
destination choice, and the results from existing studies are still inconclusive on the
relationship between the two, as mentioned earlier. Also, previous studies have not taken
potential moderators into consideration; potential moderators like familiarity,
geographical distance, novelty-seeking and past travel experiences may affect the
strength or the direction of the relationship between destination choice and cultural
distance. This study tries to fill the research gaps by testing the following hypothesis:
Destination choice Cultural distance
Familiarity Past experience
Novelty-seeking
Geographical distance
Page 41
30
Table 2.2
Summary of hypothesis development
Hypothesis 1 Tourists are more likely to choose culturally similar countries
as destinations.
Hypothesis 2 Level of familiarity with destination country has a moderating
effect on the relationship between cultural distance and
destination choice.
Experiential familiarity with destination country
has a moderating effect on the relationship between cultural
distance and destination choice.
Informational familiarity with destination country
has a moderating effect on the relationship between cultural
distance and destination choice.
Self-rated familiarity with destination country has
a moderating effect on the relationship between cultural
distance and destination choice.
Hypothesis 3 Geographical distance between home country and destination
country has a moderating effect on the relationship between
cultural distance and destination choice.
Hypothesis 4 Past international travel experience has a moderating effect on
the relationship between cultural distance and destination
choice.
Hypothesis 5 Novelty-seeking tendency has a moderating effect on the
relationship between cultural distance and destination choice.
Page 42
31
CHAPTER 3
METHODOLOGY
This chapter discusses the methodology used to conduct this study, specifically
including research design, definition of target population and sampling, measurement of
constructs and variables, questionnaire design, data collection and data analysis.
3.1 Research design
This study aims to explore the relationship between perceived cultural distance
and international destination choice; several moderators are selected to explain this
relationship. Taking Chinese potential outbound tourists as a case study, this study
defines its target population as: adult Mainland Chinese citizens who plan to take a
leisure trip outside Mainland China, Hong Kong, Macau and Taiwan in the next two
years (Adapted from Li, Cheng, Kim & Li, in press). A self-administered survey research
approach is adopted in this study. A quantitative structured questionnaire is designed
based on the literature review to collect data. The questionnaire consists of a series of
questions regarding respondents’ outbound destination choice, perceived cultural
distance, experiential familiarity, informational familiarity and self-report familiarity —
all specifically about the alternative countries they will choose as the destination over the
next two years; other questions are about respondents’ demographic, tripographic, and
psychographic characteristics, including novelty-seeking tendency, past international
Page 43
32
travel experiences and demographic information. A conditional logit regression model is
the main method for data analysis.
3.2 Sampling
Taking Chinese potential outbound tourists as a case study, this study targets adult
Chinese citizens who are planning to take an international trip for leisure purpose over
the next two years (Li et al., in press). The international trip refers to an overseas trip
outside Mainland China, Hong Kong, Macau and Taiwan. Leisure trips in this study refer
to those trips in which the primary purpose is seeking for leisure and pleasure; business
trips which combines with leisure activities are not included, as the business affairs
would limit their destination choice. The Chinese citizens in this study are considered as
people whose country of origin is China.
Convenience sampling was employed in this study, as the target population is too
large to get an explicit sampling frame (Li & Stepchenkova, 2012). Based on the
definition of target population, the sample was drawn from three sources:
(1) High-end commercial districts and Hongqiao Airport in Shanghai were selected to
conduct street interceptions, as there is a high likelihood to find potential
respondents who could afford overseas trips. Shanghai is one of the major
outbound tourist generating cities of China.
(2) Social network sites (SNS) where there are many potential outbound tourists and
backpackers were also used. Three SNSs: Weibo (http://www.weibo.com),
Douban (http://www.douban.com), and Tianya (http://www.qyer.com/) are
selected for electronic questionnaire distribution. Weibo and Douban are the most
popular SNS in China due to their great number of active members and high
Page 44
33
volume of website traffic (Ranked as top 2 among China’s SNS, China
Webmaster, 2013). Tianya is a famous online forum in China (Ranked as second
among Chinese forums, China Webmaster, 2013), which contains several
outbound tourism related sections. The contents are frequently updated and
members are active participants of discussions and experience-sharing on these
three SNSs, which makes it suitable for conducting online survey.
(3) Networking/referral: potential respondents who qualify the research are
approached through the referral of existing study subjects (snowball sampling).
3.3 Measurement
3.3.1 Dependent variable
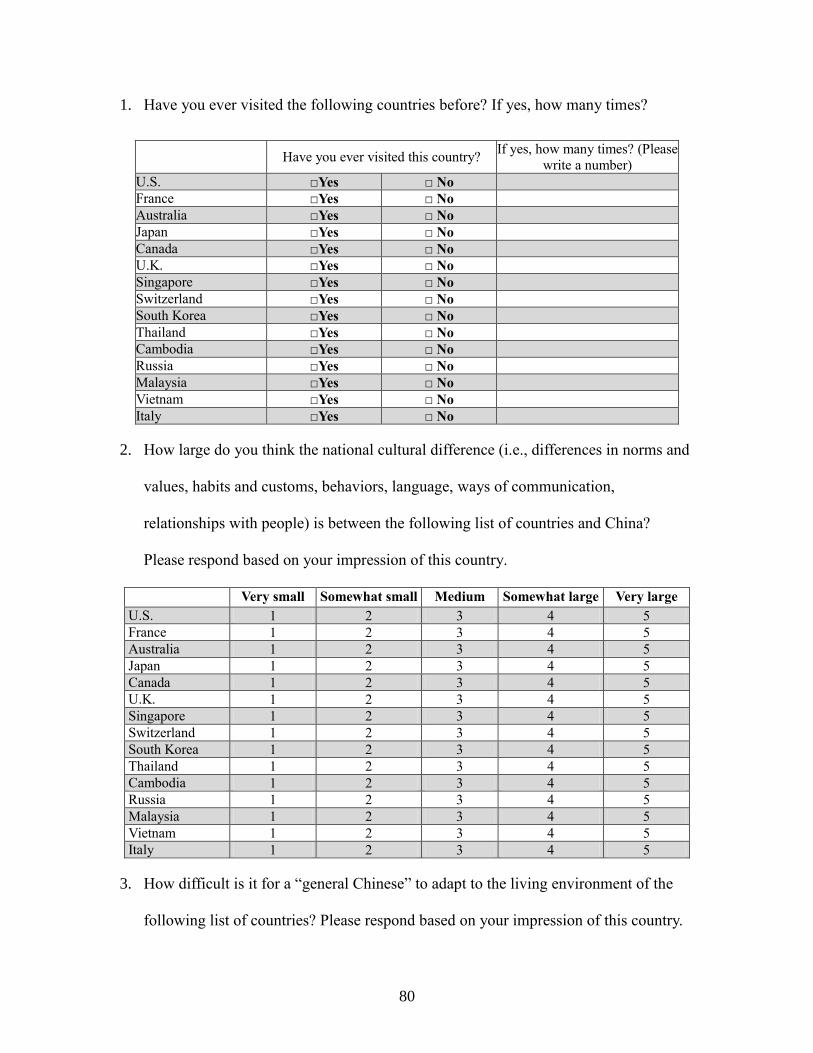
The dependent variable in this study is international destination choice. A list of
15 countries were selected from a combination of top 15 Chinese citizens’ outbound
destination countries in terms number of arrivals in 2012 (China National Tourism
Administration, 2013) and top 15 most selected countries when asked for Chinese
citizens’ dream destination countries in a previous survey (Sheatsley, Li, & Harrill,
2009). Respondents were asked to select only one country that they will most possibly
visit for a leisure trip over the next two years from the list. The 15 countries are: United
States, Canada, Russia, UK, Switzerland, Italy, France, South Korea, Vietnam,
Cambodia, Malaysia, Singapore, Australia, Thailand, and Japan. Countries are
randomized in all relevant questions in the online survey.
3.3.2 Independent variable
The independent variable is perceived cultural distance. Two items were used to
measure perceived cultural distance: the first one asks respondents to rate how large the
Page 45
34
cultural distance is between China and the list of alternative destination countries using a
5-point scale ranging from “very small” to “very large” (Drogendijk & Slangen, 2006);
the second one asks respondents to rate how difficult it is for average Chinese people to
adapt to the life and living environment of the destination countries on a 5-point scale
ranging from “very easy” (1) to “very difficult” (5) (Boyacigille, 1990).
3.3.3 Moderators
(1) Familiarity
Familiarity with destination countries is measured by three items: experiential
familiarity, informational familiarity and self-rated familiarity. Measurement of
experiential familiarity was adapted from Baloglu’s (2001) study. Baloglu (2001)
measured experiential familiarity with a first-time visit or repeat visit, and repeat visitors
in this study are also asked to specify how many times they have visited the destination
country before. Informational familiarity is measured through asking respondents to rate
the amount of tourism related information they have heard about the destination countries
(Jeong, 2009; Balogu, 2001). The self-rated familiarity is about the respondents’ overall
familiarity with their destination countries, and it is measured by a 5-point scale ranging
from “very unfamiliar” (1) to “very familiar” (5) (Fridgen, 1987; MacKay & Fesenmaier,
1997).
(2) Geographical distance
Geographical distance is measured by great circle distance (Berry et al., 2010).
Great circle distance is the shortest distance between two points on the surface of a
sphere (Berry et al., 2010), and it is calculated by the distance between the geographical
center points of China and the 15 destination countries (data available in CIA Factbook).
Page 46
35
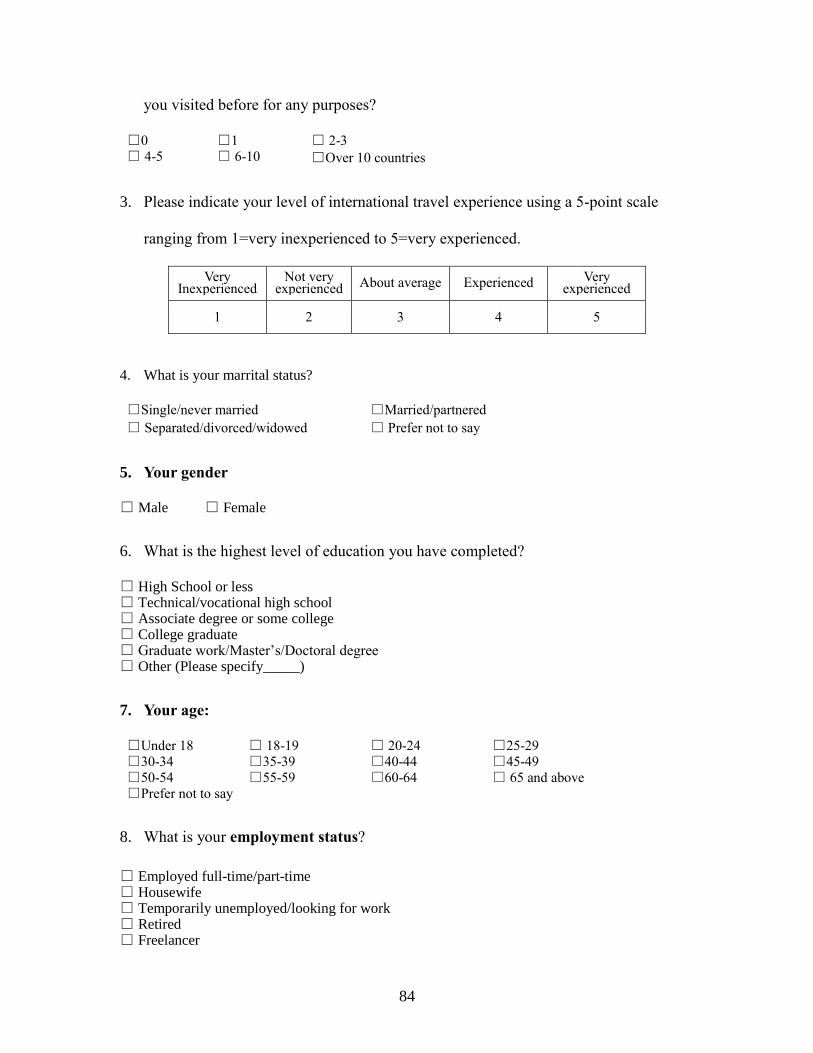
(3) Past international travel experience
Past international travel experience is measured by perceived past travel
experience, which is derived from Kozak, Crotts and Law’s (2007) study. Respondents
are asked to rate their level of past international travel experience through a 5-point scale
ranging from “very inexperienced” (1) to “very experienced” (5).
(4) Novelty-seeking tendency
Respondents’ novelty-seeking tendency is measured by a widely-cited scale
developed by McIntosh, Goeldner & Ritchie (1995). This scale includes 9 criteria
regarding seeking novelty in choosing a tourist destination, such as different culture, local
food and handcrafts, local people, etc. (See Appendix-Questionnaire). Respondents are
asked to rate the importance of these criteria to them while selecting a destination on a 5-
point Likert scale ranging from “very unimportant” (1) to “very important” (5).
3.4 Questionnaire design
The questionnaire is designed based on an extensive literature review of the
constructs and variables involved in this study. The questionnaire mainly consists three
parts: the first part is a cover letter, including the study title, survey purpose, statements
about voluntary participation, anonymity, confidentiality, and any other researchers’ and
respondents’ rights and obligations, as well as the researchers’ contact information. The
second part includes questions about tourists’ destination choice, perceived cultural
distance, familiarity and novelty-seeking. The third part of the questionnaire is mainly
about respondents’ tripograpic and demographic information, such as outbound travel
experience, age, occupation, educational background, etc. Most variables are measured
Page 47
36
using multiple items with five-point rating responses, but a couple of open-ended
questions are included.
Five faculty members who are expert in destination marketing and consumer
behavior studies were invited to review the questionnaire in order to examine the
accuracy and internal consistency of the measurement. The original English questionnaire
was translated into Chinese. In order to ensure the Chinese translation’s accuracy, the
questionnaire was back-translated from Chinese to English by another graduate student
who is bilingual at English and Chinese and has no prior knowledge to the study
objectives (Li, Meng, Uysal, & Mihalik, 2013). The translated Chinese questionnaire was
also reviewed by two bilingual professors in tourism field. A pilot test was conducted
among 20 subjects drawn from the target population, who can comment on the
questionnaire design. The questionnaire was improved and finalized after the expert
review and pilot test (See Appendix for the questionnaire).
3.5 Data collection
The data were collected through self-administered questionnaire survey. The
electronic version was distributed through email to networking respondents and posting
survey links at the three selected online communities mentioned before. Seven student
volunteers from local universities were recruited to do the street interception in Shanghai,
China. The student volunteers were provided with careful guidance and training before
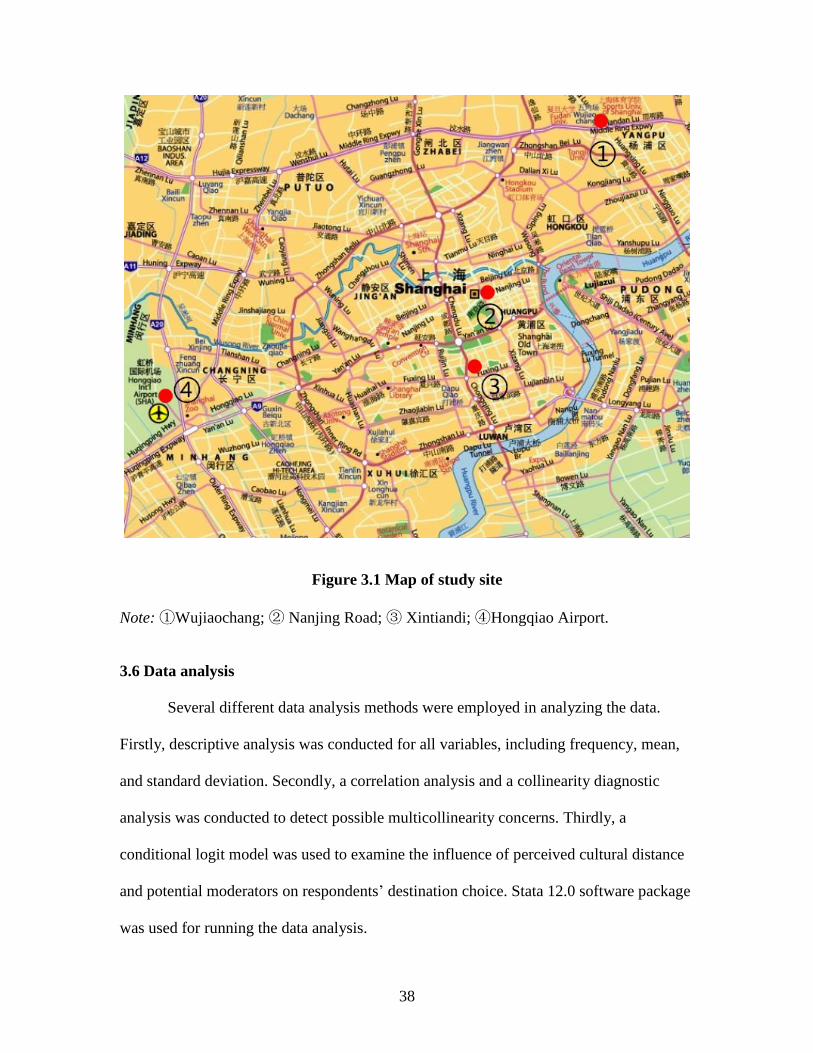
the data collection. Street interception was conducted between March 8 to March16, 2014
at Wujiangchang, Xintiandi, East Nanjing Road and Hongqiao Airport in Shanghai (See
Figure 3.1). Online survey was distributed from March 7 to March 19, 2014. Two
screening questions were asked while approaching the respondents, 1) Do you plan to
Page 48
37
take a leisure trip outside Mainland China, Hong Kong, Macau and Taiwan? 2) Are you
an adult Chinese citizen (older than 18 years old)? If the answers to these two questions
were both yes, then the respondents were qualified to participate in the survey.
As a consequence, 262 questionnaires were distributed through street interception,
of which, 229 are completed, generating an effective response rate of 87.4%; 204 online
responses were collected, of which, 61 were incomplete, and 143 were completed and
effective, generating an effective rate of 70%. Among the total 372 completed
questionnaires, 24 respondents selected other countries as destinations that were not in
the specified 15-country list. These data are not applicable to the conditional logit model
used in this study, so they were excluded in the study. Three outliers were detected in the
preliminary analysis due to patterned responses, and were deleted from the dataset.
Therefore, the final sample size was 345, including 132 from online, and 213 from street
interception.
Page 49
38
Figure 3.1 Map of study site
Note: ①Wujiaochang; ② Nanjing Road; ③ Xintiandi; ④Hongqiao Airport.
3.6 Data analysis
Several different data analysis methods were employed in analyzing the data.
Firstly, descriptive analysis was conducted for all variables, including frequency, mean,
and standard deviation. Secondly, a correlation analysis and a collinearity diagnostic
analysis was conducted to detect possible multicollinearity concerns. Thirdly, a
conditional logit model was used to examine the influence of perceived cultural distance
and potential moderators on respondents’ destination choice. Stata 12.0 software package
was used for running the data analysis.
Page 50
39
Conditional logit model is suitable for multiple discrete choice problems, which
contain both attributes of the choice alternatives and characteristics of the individuals
who make the choices as explanatory variables (Hoffman & Duncan, 1988). Modeling
destination choice with a conditional logit model is based on utility maximization theory,
which means that people are always seeking maximum benefits in their destination
decision making process. Let 𝑈𝑖𝑗 denote the utility obtained for respondent i choosing
country j as a destination, then
𝑈𝑖𝑗 = 𝑥𝑖𝑗𝛽 + 𝜀𝑖𝑗
Where 𝑥𝑖𝑗 is the observable component of 𝑈𝑖𝑗, 𝛽 is the parameter of 𝑥𝑖𝑗, and 𝜀𝑖𝑗 is the
random unobservable component of 𝑈𝑖𝑗. 𝜀𝑖𝑗 are assumed to be independent across
respondents and countries, and assumed to follow the Type I Extreme Value distribution
(Bonin & Schneider, 2006). The probability of respondent i choosing country m as
destination could be presented as follows:
𝑃𝑖𝑚 = 𝑃[𝑈𝑖𝑚 > 𝑈𝑖𝑗, ∀ 𝑚 ≠ 𝑗] =exp [𝑥𝑖𝑗𝛽 + 𝜀𝑖𝑗]
∑ exp [𝑥𝑖𝑗𝛽 + 𝜀𝑖𝑗]𝑖𝑗
The parameters in the observable component of the model can be estimated by maximum
likelihood method.
Page 51
40
CHAPTER 4
DATA ANALYSIS AND RESULTS
This chapter presents findings from the data analysis. Three sections are included
in this chapter: the first section presents the demographic and tripographic profile of the
respondents through descriptive statistics; the second section exhibits descriptive
statistics reliability and correlations of research variables; hypothesis tests and results are
provided in the third section.
4.1 Demographic and tripographic profiles
According to Table 4.1, the ratio of male to female respondents in this study was
55:45, which is relatively balanced. Most of the respondents are young-aged, with nearly
80% aged 20-34, namely the 80s and 90s generations; this is consistent with the
UNWTO’s report on Chinese outbound travel market: Chinese outbound travelers are
relatively young (UNWTO, 2012). High education level is another obvious characteristic
of the respondents: the majority of the respondents have received college graduate degree
or above (82%), which is also consistent with the UNWTO report: over 80% of Chinese
outbound travelers reportedly have at least a college degree (UNWTO, 2012). In terms of
occupation, half of the respondents are employed full-time/part-time (50%), followed by
students, accounting for 36.5% of the total sample. For monthly income, respondents who
are students or housewives were investigated by monthly household income; all other
occupations were recorded using monthly individual income. Overall, the majority of
Page 52
41
respondents reported a monthly income between 4,000 and 19,999 RMB (52.5%), and
which presumably generates a high disposal income and outbound travel demand.
Table 4.1
Demographic profile of the sample
Demographic Category Frequency Percentage
Gender Male 187 54.4
Female 157 45.6
Total 344 100
Age 18-19 17 4.9
20-24 104 30.2
25-29 120 34.9
30-34 45 13.1
35-39 20 5.8
40-44 11 3.2
45-49 10 2.9
50-54 7 2.0
55-59 4 1.2
60-64 0 0
65 or above 0 0
Prefer not to say 6 1.7
Total 344 100
Education High School or less 17 4.9
Technical/vocational high school 4 1.2
Associate degree or some college 31 9.0
College graduate 186 54.1
Graduate work/Master’s/ Doctoral degree 96 27.9
Other 1 0.3
Prefer not to say 9 2.6
Total 344 100
Occupation Employed full-time/part-time 171 50.0
Housewife 4 1.2
Freelancer 21 6.1
Student 125 36.5
Retired 1 0.3
Temporarily unemployed/looking for work 1 0.3
Other 4 1.2
Prefer not to say 15 4.4
Monthly income
Total 342 100
Below 2,000 RMB 14 4.1
Page 53
42
According to Table 4.2, over half of the respondents have some international
travel experiences, i.e. they have taken at least one outbound trip and visited at least one
foreign country. Still, a considerable number of respondents lack international travel
experience: 43.7% have not traveled to any foreign countries before, over half of the
respondents rated themselves as “very inexperienced” (51.5%), and very few respondents
think themselves as “somewhat experienced” (4.1%) or “very experienced” (2.3%).
Table 4.2
Tripographic profile of the sample
Number of past outbound travel Frequency Percentage
0 150 43.5
1 63 18.3
2-3 71 20.6
4-5 19 5.5
6-10 16 4.6
Over 10 26 7.5
Total 345 100
Number of visited countries
0 150 43.5
1 63 18.3
2-3 75 21.7
4-5 20 5.8
6-10 23 6.7
Over 10 14 4.1
Total 345 100
Self-reported international travel experience
Very inexperienced 177 51.5
Somewhat inexperienced 95 27.6
About average 50 14.5
Somewhat experienced 14 4.1
Very experienced 8 2.3
Total 344 100
2,000 to 3999 RMB 40 11.7
4,000 to 6,999 RMB 67 19.5
7,000 to 9,999 RMB 63 18.4
10,000 to 19,999 RMB 50 14.6
20,000 to 29,999 RMB 16 4.7
30,000 to 39,999 RMB 7 2.0
40,000 to 49,999 RMB 11 3.2
50,000 RMB or above 6 1.7
Prefer not to say 69 20.1
Total 343 100
Page 54
43
Respondents were asked to select one country that they are most likely to visit
over the next two years from the listed 15 countries. As a result, United States was
selected most frequently (17.4%), followed by Japan (13.3%) and Thailand (12.5%).
Cambodia (1.2%), Vietnam (0.9%) and Russia (0.9%) were the three least popular
countries for a leisure travel among the respondents. In terms of whether respondents
have traveled to the listed 15 countries before, United States, Japan and Thailand also
ranked as top three most visited countries, indicating the high popularity of these
countries among Chinese tourists (see Table 4.3).
Table 4.3
Destination choice and previous visitation of 15 destination countries
Frequency Percentage
Previous visitation
(% of cases)
USA 60 17.4 37.3
Japan 46 13.3 36.1
Thailand 43 12.5 33.1
France 37 10.7 25.9
South Korea 28 8.1 30.1
Australia 27 7.8 11.4
Singapore 24 7.0 20.5
Switzerland 18 5.2 10.2
UK 17 4.9 18.7
Italy 16 4.6 16.9
Malaysia 13 3.8 17.5
Canada 6 1.7 16.3
Cambodia 4 1.2 10.2
Vietnam 3 0.9 15.1
Russia 3 0.9 9.0
Total 345 100 -
The listed 15 destination countries were measured on several perception attributes
using a 5-point scale, including perceived cultural distance between China and the 15
destination countries (“Perceived CD” in Table 4.4), how difficult it is to adapt to the
living environment of destination countries (“Adaptation” in Table 4.4), self-reported
familiarity with destination countries (“Familiarity” in Table 4.4) and the amount of
Page 55
44
tourism information respondents have heard regarding the 15 countries (“Information” in
Table 4.4). The mean value of each attribute for each country is listed in Table 4.4;
countries are listed in alphabetical order. According to the table, perceived cultural
distance ranges from 2.62 to 4.12; France, USA and UK were perceived as the most
culturally distant countries from China, while Malaysia, South Korea and Singapore were
the most culturally similar countries. Despite the cultural differences, it seems to be not
so difficult to adapt to the living environment of the destination countries: perceived
difficulty of adaptation ranges from 2.37 to 3.51; Italy, France and Russia are perceived
as most the difficult to adapt to. In terms of familiarity with destination countries,
respondents are most familiar with Japan, South Korea and United States, while least
familiar with Vietnam, Switzerland and Cambodia. Respondents knew more tourism-
related information about South Korea, Japan and Thailand, while were less informed
about Russia, Cambodia and Vietnam.
Table 4.4
Perception attributes by countries
Country Perceived CD Adaptation Familiarity Information
Australia 3.80 2.99 2.68 3.27
Cambodia 3.15 2.95 2.31 2.46
Canada 3.80 3.13 2.66 2.90
France 4.12 3.49 2.66 3.21
Italy 4.01 3.51 2.48 2.88
Japan 3.06 2.84 3.20 3.61
Malaysia 2.96 2.68 2.57 3.06
Russia 3.70 3.49 2.50 2.45
Singapore 2.62 2.37 2.95 3.31
South Korea 2.72 2.59 3.14 3.68
Switzerland 3.98 3.44 2.42 2.77
Thailand 3.10 2.77 2.88 3.57
UK 4.06 3.32 2.83 3.15
USA 4.08 3.12 3.13 3.46
Vietnam 2.99 2.91 2.44 2.47
Note: Perceived CD: 1= very small, 5 = very large;
Adaptation: 1 = very easy, 5 = very difficult; Familiarity: 1 = very unfamiliar, 5 = very familiar;
Information: 1= very little, 5=very much.
Page 56
45
4.2 Descriptive statistics, reliability and correlations of explanatory variables
Table 4.5 provides the descriptive statistics of all items involved in this study and
reliability test results for each scale with more than one item. Cronbach’s 𝛂 coefficients
range from 0.513 to 0.806, indicating an acceptable internal consistency of all the scales.
Two scales were averaged based on the reliability test: the variable “perceived cultural
distance” is coded as the average value of its two items, including perceived cultural
distance and perceived difficulty of adaptation; variable “novelty-seeking” is coded as the
average value of its nine items. Number of previous visitation is recoded as a dummy
variable due to it is highly right skewed: 1 if respondents have visited the country before,
0 if not.
Table 4.5
Descriptive statistics and reliability test
Items Mean S.D. Variables Cronbach’s
𝛂
Perceived cultural distance 3.48 1.07 Perceived
cultural distance 0.624
Perceived difficulty of adaptation 3.04 1.02
Self-reported familiarity 2.72 0.95
Familiarity 0.513 Amount of tourism information 3.08 1.07
Previous visitation 0.16 0.689
Experiencing a different culture 3.95 0.93
Novelty-seeking
tendency 0.806
Local crafts and handiwork 3.20 0.99
Local cuisine and new food 3.96 0.94
Interesting and friendly local people 3.60 0.98
Opportunity to see or experience people from
different ethnic backgrounds
3.56 1.02
Opportunity to see or experience unique
aboriginal or native groups
3.45 1.05
Opportunity to increase your knowledge about
places, people, and things in this country
3.78 0.98
A variety of things to see and do 3.83 .95
Visiting a place you can talk about when you
get home
3.40 1.06
Perceived international travel experience 1.78 0.99 Past international
travel experience -
Great circle distance 5.46 3.07 Geographical
distance -
Page 57
46
Table 4.6 provides correlations between any two independent variables and
collinearity diagnostics results. It shows that all correlation coefficients are below 0.5,
which indicates that there is little multicollinearity concern. A collinearity diagnostic
analysis is conducted to further detect multicollinearity concerns. Indicator VIF (Variance
Inflation Factor) examines whether a predictor has a strong linear relationship with other
predictors, and a value less than 10 suggests low multicollinearity (Myers, 1990).
Another indicator of multicollinerity is tolerance, which indicates the amount of
collinearity that a regression analysis can tolerate. The larger the tolerance is the better
and a value below 0.2 may lead to collinearity concerns (Menard, 1995). Seen from the
table, all VIFs are blow 1.5 and tolerance values are greater than 0.7, indicating that there
are no major multicollinearity concerns among the seven independent variables.
Table 4.6
Correlation analysis and collinearity diagnostics
Variables (1) (2) (3) (4) (5) (6) (7) VIF Tolerance R2 Eigenval Cond Index
CD 1 1.23 0.814 0.186 1.851 1
Visit -.110** 1 1.22 0.819 0.181 1.303 1.192
Info -.149** .171** 1 1.24 0.804 0.197 1.100 1.2971
Fami -.193** .232** .419** 1 1.28 0.782 0.218 0.970 1.3811
Experience -.112** .380** .137** .139** 1 1.18 0.846 0.154 0.630 1.7143
Novelty -.005 -.011 .085** .026 .003 1 1.01 0.992 0.008 0.592 1.7688
GeoD .364** .007 .036* .014 .000 .000 1 1.17 0.856 0.144 0.554 1.828
Mean VIF 1.19 Condition number 1.828
**. Correlation is significant at the 0.01 level (2-tailed).
*. Correlation is significant at the 0.05 level (2-tailed).
Note: For the sake of brevity, all variables were abbreviated: CD: perceived cultural distance; Visit:
dummy-coded variable of number of previous visitation; Info: amount of tourism information; Fami:
self-reported familiarity; Experience: perceived international travel experience; Novelty: novelty-
seeking tendency, aggregated using mean value of a 9-item scale; GeoD: geographical distance.
Page 58
47
4.3 Hypothesis testing
4.3.1 The baseline model
The first model contains all alternative-specific variables, including perceived
cultural distance, previous visitation, amount of tourism information, familiarity and
geographical distance. According to Table 4.7, “CD” has a negative but insignificant
impact on destination choice. All other variables in this model are reported to be
significant in predicting destination choice; among them, “Info” (p<0.0001), “Fami”
(p<0.0001) and “GeoD” (p<0.0001) have positive impacts on destination choice,
meaning that respondents are more likely to choose a country which they have more
tourism information about, which they are more familiar with, or with a larger
geographical distance. Previous visitation (p=0.030) has a significant negative impact on
destination choice, indicating that respondents would more likely to visit a destination
they have not been to before.
Table 4.7
Model 1
Coef. Std. Err. z P>|z| Model Summary
CD -0.067 0.089 -0.75 0.452 Log likelihood -835.838
Visit -0.479 0.221 -2.17 0.030 Wald chi2(6) 136.03
Info 0.728 0.085 8.56 0.000 Prob > chi2 0.000
Fami 0.335 0.088 3.8 0.000 AIC 1681.675
GeoD 0.074 0.020 3.79 0.000 BIC 1714.346
Obs 5085
4.3.2 Testing moderating effect of experiential familiarity
Hypothesis 2 states that level of familiarity with destination country has a
moderating effect on the relationship between cultural distance and destination choice.
Specifically, Hypothesis 2a states that experiential familiarity with destination country
Page 59
48
has a moderating effect on the relationship between cultural distance and destination
choice. Experiential familiarity, i.e. previous visitation, was introduced as a moderator in
Model 2. An interaction item was generated by multiplying “CD” and “Visit”. Results
show that when the interaction term was included in the model, all of “CD” “CD*Visit”
and “Visit” became insignificant, indicating that previous visitation has no significant
moderating effect on “CD” and destination choice. Therefore, Hypothesis 2a is not
supported in this model.
Table 4.8
Model 2
Coef. Std. Err. z P>|z| Model Summary
CD -0.059 0.091 -0.64 0.520 Log likelihood -835.777
CD*Visit -0.078 0.223 -0.35 0.727 Wald chi2(6) 136.04
Visit -0.245 0.700 -0.35 0.726 Prob > chi2 0.000
Info 0.728 0.085 8.56 0.000 AIC 1683.553
Fami 0.338 0.088 3.82 0.000 BIC 1722.757
GeoD 0.074 0.020 3.79 0.000 Obs 5085
4.3.3 Testing moderating effect of informational familiarity
Hypothesis 2b states that informational familiarity with destination country has a
moderating effect on the relationship between cultural distance and destination choice.
Informational familiarity is measured by the amount of tourism information respondents
have obtained regarding each destination country. In order to test whether it has a
moderating effect on the relationship between “CD” and destination choice, an
interaction of “CD” and “Info” is incorporated in Model 3. Results show that “Info” is
still significant (p=0.001), but “CD” (p=0.98) and “CD*Info” (p=0.801) are not
significant in explaining destination choice, thus amount of tourism information has
Page 60
49
insignificant moderating effect on “CD” and destination choice, Hypothesis 2b is
rejected.
Table 4.9
Model 3
Coef. Std. Err. z P>|z| Model Summary
CD -0.005 0.261 -0.02 0.985 Log likelihood -835.806
CD*Info -0.017 0.067 -0.25 0.801 Wald chi2(6) 136.24
Visit -0.478 0.221 -2.17 0.030 Prob > chi2 0.000
Info 0.783 0.234 3.35 0.001 AIC 1683.612
Fami 0.335 0.088 3.8 0.000 BIC 1722.816
GeoD 0.074 0.020 3.79 0.000 Obs 5085
4.3.4 Testing moderating effect of self-reported familiarity
A third dimension of familiarity is measured by self-reported overall familiarity
with the destination countries. H2c states that self-rated familiarity with destination
country has a moderating effect on the relationship between cultural distance and
destination choice. A product term of “CD” and “Fami” is included in Model 4. Similar to
Model 4, “CD” (p=0.560) and “CD*Fami” (p=0.345) are not statistically significant, but
“Fami” is still significant in predicting destination choice (p=0.023). Hypothesis 2c is
rejected in this model.
Table 4.10
Model 4
Coef. Std. Err. z P>|z| Model Summary
CD 0.135 0.231 0.58 0.560 Log likelihood -835.393
CD*Fami -0.065 0.069 -0.94 0.345 Wald chi2(6) 136.97
Visit -0.477 0.221 -2.16 0.031 Prob > chi2 0.000
Info 0.731 0.085 8.58 0.000 AIC 1682.787
Fami 0.546 0.240 2.27 0.023 BIC 1721.991
GeoD 0.075 0.020 3.82 0.000 Obs 5085
Page 61
50
4.3.5 Testing moderating effect of geographical distance
It is predicated that geographical distance between home country and destination
country has a moderating effect on the relationship between cultural distance and
destination choice in Hypothesis 3. Hence geographical distance is incorporated in Model
5 as a moderator. Results illustrate that “CD” (p=0.042) is significant and negative in
predicting destination choice, and interaction term “CD*GeoD” (p=0.051) is marginally
significant and positive in predicting destination choice. Therefore, Hypothesis 3 is
supported in this model.
Table 4.11
Model 5
Coef. Std. Err. Z P>|z| Model Summary
CD -0.324 0.159 -2.04 0.042 Log likelihood -833.928
CD*GeoD 0.048 0.024 1.95 0.051 Wald chi2(6) 139.86
Visit -0.475 0.221 -2.15 0.031 Prob > chi2 0.000
Info 0.720 0.085 8.45 0.000 AIC 1679.857
Fami 0.321 0.088 3.64 0.000 BIC 1719.061
GeoD -0.083 0.083 -0.99 0.321 Obs 5085
In order to see the moderating effect of geographical distance on “CD” and
destination choice more clearly, the predicted probabilities for selecting each country
were plotted against perceived cultural distance in Figure 4.1 and 4.2. The 15 countries
were divided into two groups by mean of “GeoD”. Figure 4.1 exhibits the predicted
probabilities of eight countries with smaller geographical distance from China being
selected, such as Japan, South Korea etc., and Figure 4.2 exhibits the predicted
probabilities of seven countries that are further from China being selected, like United
States and Canada. The line graphs show that when geographical distance is small,
respondents are more likely to choose culturally similar destinations; while when
Page 62
51
geographical distance is large, there is no big difference for most countries in terms of
perceived cultural distance. The exception of United States, which shows an obvious
positive relationship between predicted probabilities and perceived cultural distance,
could be affected by other factors, like familiarity and awareness of the country.
Figure 4.1 Predicted probabilities by country (regional travel)
0
.05
.1.1
5
Fitte
d P
roba
bili
ty
1 2 3 4 5
Perceived cultural distance: 1 = Very small, 5= Very large
Singapore Japan SouthKorea
Cambodia Malaysia Vietnam
Russia Thailand
Page 63
52
Figure 4.2 Predicted probabilities by country (long-haul travel)
4.3.6 Testing moderating effect of past international travel experience
Hypothesis 4 states that past international travel experience has a moderating effect
on the relationship between cultural distance and destination choice. An interaction term
of “CD” and “Experience” is introduced in Model 6 in order to examine the moderating
effect of perceived past international travel experience. Results show that neither “CD”
(p=0.161) nor the interaction term (p=0.327) is significant in predicting destination choice.
Therefore, Hypothesis 4 is not supported in this model.
Table 4.12
Model 6
Coef. Std. Err. z P>|z| Model Summary
CD -0.260 0.186 -1.4 0.161 Log likelihood -800.868
CD*
Experience 0.093 0.095 0.98 0.327 Wald chi2(6) 172.49
Visit -0.651 0.229 -2.84 0.004 Prob > chi2 0.000
Info 0.601 0.088 6.82 0.000 AIC 1641.736
Fami 0.274 0.091 3.02 0.003 BIC 1772.358
GeoD 0.086 0.039 2.19 0.029 Obs 5070
0
.05
.1.1
5
Fitte
d P
roba
bili
ty
1 2 3 4 5Perceived cultural distance: 1 = Very small, 5= Very large
USA UK Canada
Australia France Switzerland
Italy
Page 64
53
4.3.7 Testing moderating effect of novelty-seeking tendency
Novelty-seeking tendency is hypothesized to have a moderating effect on the
relationship between cultural distance and destination choice in Hypothesis 5. In Model
7, a product term of “CD” and “Novelty” is included to test Hypothesis 5. According to
the model estimates, both CD (p=0.035) and the interaction term (p=0.048) have a
significant effect on destination choice at a 0.05 significance level. The negative role of
perceived cultural distance on destination choice is largely enhanced under the
moderating effect of novelty-seeking (b=-1.062). The predicted probabilities of selecting
destination countries for low level of novelty-seeking and high level of novelty-seeking
were plotted separately: respondents whose novelty-seeking is below the mean (3.63) are
regarded as “Low novelty-seeking”, and those have a novelty-seeking above 3.63 are
regarded as “High novelty-seeking”. As can be seen from Figure 4.3, there is an obvious
negative relationship between perceived cultural distance and destination choice among
respondents with a low level of novelty-seeking tendency, while people who are more
novelty-seeking have no significant preference in cultural difference while selecting a
destination country. As a result, novelty-seeking has a significant moderating effect on
perceived cultural distance and destination choice, hence Hypothesis 5 cannot be
rejected.
Table 4.13
Model 7
Coef. Std. Err. z P>|z| Model Summary
CD -1.062 0.504 -2.11 0.035 Log likelihood -790.762
CD*Novelty 0.267 0.135 1.97 0.048 Wald chi2(6) 182.82
Visit -0.608 0.223 -2.73 0.006 Prob > chi2 0.000
Info 0.547 0.090 6.09 0.000 AIC 1621.524
Fami 0.250 0.092 2.72 0.006 BIC 1752.205
GeoD 0.072 0.113 0.64 0.521 Obs 5085
Page 65
54
Figure 4.3 Predicted probabilities by level of novelty-seeking
4.3.8 Summary
In total seven models were built to examine the impact of perceived cultural
distance on destination choice and the moderating effects of potential moderators (see
Table 4.14). All of the seven models are significant and have a good model fit. When all
predictors are included in Model 1, “CD” is negative but not significant. When
moderators are introduced in the model, “CD” remains negative, except when moderated
by self-reported familiarity. “CD” has a significant, negative effect on destination choice
when moderated by geographical distance and novelty-seeking. Therefore Hypothesis 1 is
partially supported.
Model 2 to Model 7 are constructed to test the moderating effects of potential
moderators, including experiential familiarity, informational familiarity, self-reported
familiarity, geographical distance, past international travel experience and novelty-
.04
.06
.08
.1.1
2.1
4
Fitte
d P
roba
bili
ty
1 2 3 4 5
Perceived cultural distance: 1 = Very small, 5= Very large
Low novelty-seeking High novelty-seeking
Page 66
55
seeking tendency. Among these models, interaction terms “CD*GeoD” (Model 5), and
“CD*Novelty” (Model 7) are significant in predicting destination choice, indicating that
geographical distance and novelty-seeking have significant moderating effects on the
relationship of perceived cultural distance and destination choice. To be specific, when
geographical distance is small, respondents are more likely to choose culturally similar
destinations, and respondents with a low level of novelty-seeking are more likely to
choose culturally similar countries as destinations. A summary of hypothesis test results
are described in Table 4.15.
Table 4.14
Summary of Model 1 –Model 7
Model 1 Model 2 Model3 Model4 Model 5 Model 6 Model 7
CD -0.067 -0.059 -0.005 0.135 -0.324** -0.260 -1.062**
Visit -0.479** -0.245 -0.478** -0.477** -0.475** -0.651*** -0.608***
Info 0.728*** 0.728*** 0.783*** 0.731*** 0.720*** 0.601*** 0.547***
Fami 0.335*** 0.338*** 0.335*** 0.546** 0.321*** 0.274*** 0.250***
GeoD 0.074*** 0.074*** 0.074*** 0.075*** -0.083 0.086** 0.072
CD*Visit -0.078
CD*Info -0.017
CD*Fami -0.065
CD*GeoD 0.048*
CD*Experience 0.093
CD*Novelty 0.267**
Log likelihood -835.838 -835.777 -835.806 -835.393 -833.928 -800.868 -790.762
Wald chi2 136.03*** 136.04*** 136.24*** 136.97*** 139.86*** 172.49*** 182.82***
AIC 1681.675 1683.553 1683.612 1682.787 1679.857 1641.736 1621.524
BIC 1714.346 1722.757 1722.816 1721.991 1719.061 1772.358 1752.205
Obs 5085 5085 5085 5085 5085 5070 5085
Note: *p<0.1, **p<0.05, ***p<0.01
Page 67
56
Table 4.15
Hypothesis test results
Hypothesis Test results
H1 Tourists are more likely to choose culturally similar countries as destinations.
Partially
supported
H2 Level of familiarity with destination country has a moderating effect on
the relationship between cultural distance and destination choice. Not supported
H2a Experiential familiarity with destination country has a moderating effect
on the relationship between cultural distance and destination choice. Not supported
H2b Informational familiarity with destination country has a moderating
effect on the relationship between cultural distance and destination
choice.
Not supported
H2c Self-rated familiarity with destination country has a moderating effect on the relationship between cultural distance and destination choice.
Not supported
H3 Geographical distance between home country and destination country
has a moderating effect on the relationship between cultural distance and destination choice.
Supported
H4 Past international travel experience has a moderating effect on the
relationship between cultural distance and destination choice. Not supported
H5 Novelty-seeking tendency has a moderating effect on the relationship between cultural distance and destination choice.
Supported
Page 68
57
CHAPTER 5
CONCLUSIONS AND DISCUSSION
This chapter provides a summary of the study findings and discussion based on the
data analysis results; implications, limitations and suggestions for future studies are
presented after the discussion.
5.1 Review of key findings
Taking potential Chinese outbound leisure travelers as a case study, this study
mainly explored the impact of perceived cultural distance on destination choice,
particularly, this study focused on the impacts of selected moderators on the relationship
between perceived cultural distance and destination choice. Moderators involved in this
study include familiarity (experiential familiarity, informational familiarity, self-rated
familiarity), geographical distance, past international travel experience and novelty-
seeking tendency. This empirical study concluded that perceived cultural distance could
have a negative effect in predicting Chinese tourists’ international destination choice in
the presence of selected moderators; experiential familiarity, informational familiarity,
self-rated familiarity and past international travel experience failed to show significant
moderating effects on the relationship between perceived cultural distance and
destination choice; geographical distance and novelty-seeking tendency are confirmed to
moderate the effects of cultural distance on destination choice, and the negative effect of
perceived cultural distance is greatly enhanced when geographical distance is smaller and
novelty-seeking tendency is lower.
Page 69
58
Perceived cultural distance
Most of the models (except Model 4) showed a negative coefficient of perceived
cultural distance, that is, perceived cultural distance has a negative impact on destination
choice, which is consistent with most of previous studies (Jackson, 2000; Ng et al., 2007,
2009; Yang & Wong, 2012). Using a sample of tourists from a typical collectivist country,
this study fails to confirm the conclusion from Jackson’s (2001) study, which reported a
positive relationship between cultural distance and destination choice among tourists
from highly collectivist countries.
However, the coefficient of CD is not significant in most models, except when
geographical distance and novelty-seeking tendency are included as moderators (Model 5
and Model 7). This could be attributed to several reasons: first of all, although the
reliability test shows an acceptable 𝛂 coefficient (0.624) for the measurement of
perceived cultural distance, this study did not go through a rigorous scale development
procedure. Two items were used for measuring perceived cultural distance from two
separate studies; on one hand, the inconsistency between the two items may affect the
results, and on the other hand, two items may be not enough to cover all aspects of
cultural differences, as culture is such a broad and complex concept. Secondly, perceptual
or self-report measures may contain some biases (Donaldson & Grant-Vallone, 2002;
Drogendijk & Slangen, 2006). Different respondents might have different understandings
and different rating standards to the same question; some respondents might also have
certain habits while answering scale questions, like extreme values or central tendency
(Tellis & Chandrasekaran, 2010), response bias like this would certainly affect the
consistency and validity of the data, and further affect the data analysis results. Thirdly,
Page 70
59
the small sample size (345) may be another reason leading to the insignificant
coefficients of perceived cultural distance. Overall, it appears the findings regarding the
role of cultural distance in destination selection remain inconclusive, which warrants
further research attention.
Familiarity
Familiarity has three dimensions: experiential familiarity (i.e. previous visitation),
informational familiarity (i.e. amount of tourism information) and self-rated overall
familiarity. Model 1 reported significant but mixed impacts among the three dimensions
on destination choice: experiential familiarity has a significant negative impact on
destination choice, while informational familiarity and self-rated familiarity has
significant positive impacts on destination choice. In other words, tourists are more likely
to visit an outbound destinations that they have not been to before, and they are more
likely to choose countries that they have more information or are more acquainted with.
The results are not necessarily contradictory. Previous literature also suggests individual
tourists rarely revisit international destinations (McKercher & Guillet, 2011), even when
they revisit the same country, they are very likely to switch to different destinations in the
same country from their previous visit (Lee & Tussyadiah, 2012). Thus, it is not
surprising that tourists are more likely to visit a country that they have not been to before.
For the other two dimensions, a certain amount of information and some familiarity is
necessary during the destination choice process, through which they could judge whether
a country is worthy of visiting or not. Even after the destination decision, they still need
to collect more specific information in order to reduce uncertainty and improve their
travel experience. In addition, the halo effect may be another reason, Chinese tourists are
Page 71
60
more likely to visit famous and popular destinations, and they tend to be more familiar
with those famous and popular destination countries such as the United States, Thailand
and South Korea.
Geographical distance
Geographical distance is reported to have a significant and positive impact on
tourists’ destination choice. This conclusion could be delimited to the 15 destination
countries used in this study, as previous literature indicated mixed results regarding the
impact of geographical distance on tourism demand: (1) in the famous Distance Decay
theory, tourism demand decreases along with the increase of geographical distance (Bull,
1991; Eldridge & Jones, 1991); (2) some empirical studies found that there is a threshold
in the demand curve, namely, geographical distance is positive in predicting destination
choice at first, after and certain threshold, the relationship between geographical distance
and tourism demand becomes negative (Greer & Wall, 1979; Bull, 1991; McKercher,
1998); (3) however, most recently researchers found that more fluctuations may exist
after the first threshold in the tourism demand curve (McKercher & Lew, 2003; Lee et al.,
2012), which makes the relationship between geographical distance and destination
choice much more complicated. The mixed results about the role of geographical distance
in predicting destination choice make it an interesting topic worthy of more exploration.
This study also reveals that geographical distance has a significant moderating
effect on the relationship between perceived cultural distance and destination choice:
tourists are more likely to choose culturally similar destinations among the countries that
are geographically closer to China; when geographical distance is beyond a certain
threshold, the impact of cultural distance on destination choice becomes weak. The
Page 72
61
United States stands out as an exception— as a country far from China, it shows an
obvious positive relationship between perceived cultural distance and destination choice.
This might be affected by other factors, such as the popularity of American culture and
entertainment among Chinese tourists.
Past international travel experience
Past international travel experience was speculated as potential moderator of
cultural distance and destination choice. However, this study failed to support that
international travel experience has a statistically significant moderating effect on the
relationship between cultural distance and destination choice. This is could be due to the
fact that the majority of the respondents lack outbound travel experience. To further study
the moderating effect of international travel experience, more experienced outbound
travelers need to be included in future studies.
Novelty-seeking tendency
The hypothesis that novelty-seeking tendency has a moderating effect on the
relationship between perceived cultural distance and destination choice is well supported
in this study, meaning the negative impact of perceived cultural distance on destination
choice could be elevated under the moderating effect of novelty-seeking tendency. More
specifically, tourists who have a lower level of novelty-seeking tendency tend to choose
culturally similar countries as destinations, while there is no obvious preference in terms
of cultural difference for those who have a higher level of novelty-seeking tendency
while selecting a destination. According to previous literature, people who have a higher
novelty-seeking tendency might be more likely to choose culturally distant countries as
destinations, as they are more adventurous, outgoing and explorative (Plog, 1974, 2001;
Page 73
62
Reisinger, 2009). However, this study found the negative effect of cultural distance is
weakened when novelty-seeking tendency is high, instead of the positive relationship
inferred in previous literature. The effect of high level of novelty-seeking could be more
salient when a larger sample size is employed.
5.2 Managerial implications
Although a convenience sampling method was used in this study, the sample
turned out to be relatively representative of the Chinese outbound travel market: young,
well educated, with relatively higher income, which is consistent with the UNWTO
report on Chinese outbound travel market (UNWTO, 2012). As such, the study results
could provide some meaningful marketing intelligence for destination marketers who
target Chinese market. The demographic information shows that young people is
dominating the Chinese outbound travel market, specifically people between 20 to 35
years old, who are generally born after 1980s (Generation Y). Unlike most Chinese
travelers who prefer group tours (Wong & Lau, 2001), Chinese youth tend to prefer
individual travel. Grown up in the internet era, the young generation are more tech-
savvy— they can share their travel experience and search for tourism information
anywhere at any time, meanwhile they are passionate to do so, and they are increasingly
sophisticated at travel planning (Jin, Lin, & Hung, 2014; Thraenhart, 2012). Therefore,
destination marketers should take advantage of new technology, such as social media
marketing, and provide more self-organized and customized outbound travel products for
Chinese young travelers. In addition, alternative tourism activities are also favored by
young travelers, like volunteer tourism, backpacking, etc., as they seek for unique and
memorable experiences and more interaction with locals. Another obvious characteristic
Page 74
63
of the Chinese outbound travel market could be the lack of outbound travel experience,
and the majority of the potential outbound travelers have no previous outbound travel
experience. Tourists in this segment tend to start with regional trips to closer regions and
countries, like Hong Kong, South Korea and Japan, etc.; they usually start outbound
travel with package tours and famous destinations (Lui, Kuo, Fung, Jap, & Hsu, 2011).
Hence, destination marketers targeting this market segment should work on improving
the awareness and popularity of their destinations, and promote their traditional products
including those must-go destinations in each country, for example, Paris in France and
Eiffel Tower in Paris.
Seen from a cultural distance perspective, destination marketers should develop
different marketing and product strategies for source markets with smaller and greater
cultural distance. For those tourists who come from cultural distant countries, destination
marketers should highlight the differences and uniqueness of tourism resources, but also
make tourists feel comfortable in a culturally distant environment, as cultural differences
could act more as a travel constraint than motivation. Outbound tourism products
designed to meet Chinese tourists’ expectations and preferences, will help improve
Chinese tourists’ travel experience and satisfaction (Li, Lai, Harrill, Kline, & Wang,
2011).
Results show that tourists are more likely to visit destinations that they are more
familiar with, as Chinese tourists tend to flock to famous and trendy destinations, so
destination marketers need to improve the destination countries’ awareness and
popularity among Chinese tourists, in order to increase the probability of being selected.
In addition, Chinese tourists are more likely to choose countries that they have not been
Page 75
64
to before, indicating that destination marketers need to develop different strategies for
first-timers and repeat visitors based on the different motivations and preferences of the
two groups: first-time visitors are more likely to visit famous destinations, while repeat
visitors may switch to other destinations in the same country that they have not been to
previously (Li, Cheng, Kim, & Patrick, 2008).
5.3 Limitations and future research
Theoretically, this study makes a contribution in examining the empirical
significance of existing studies and providing new insights in understanding destination
choice from a cultural distance perspective. Yet this study clearly contains several
limitations. Firstly, in terms of sampling, the sample size (345) is relatively small, and
convenience sampling is less than ideal. Future studies could use a larger sample size and
employ random sampling—once the sampling frame becomes available— in order to
improve the generalizability of the findings. Secondly, the measurement of perceived
cultural distance did not go through a rigorous scale development procedure, which could
be one possible reason for the insignificant effect of perceived cultural distance in most
models. Further studies need to modify and improve the perceptual measurement of
cultural distance. Thirdly, due to the restriction of conditional logit model used in this
study, only 15 countries are involved in the choice alternatives, which could not reflect
tourists’ actual destination choices. Future studies could explore other methods that could
include more choice alternatives and make the destination choice data closer to reality.
Fourthly, stated destination choice over the next two years is not necessarily equal to
actual behavior, as future intentions could be overstated (Ewing, 2000; Chandon,
Morwitz, & Reinartz, 2005; McKercher & Tse, 2012). Tourists may also change their
Page 76
65
mind due to many other factors while they are really making the decisions. Future studies
can include past outbound travelers as a control group in the study of cultural distance
and destination choice. Lastly, this study only include perceived cultural distance and
four moderators in the model. It is possible that other factors may be omitted from the
model, as destination choice could be affected by many factors. It is necessary to test
more other factors as potential moderators in order to get a more comprehensive
understanding of the impact of cultural distance on destination choice. In addition, most
of the respondents in this study had no outbound travel experience. More experienced
outbound tourists could be involved in future studies to test the robustness of the
findings.
In conclusion, this study could make an important contribution to the current few
attempts on cultural distance and destination choice. This study provided empirical
evidences that, cultural distance measured through a perceptual approach also has a
negative impact on international destination choice, which is consistent with most of
previous studies on this topic (Jackson, 2000; Ng et al. 2007, 2009; Yang & Wong, 2012).
Taking potential outbound tourists from a highly collectivistic country as a case study, it
failed to confirm the findings in Jackson’s (2001) study that people from highly
collectivist countries are more likely to choose culturally distant countries as destinations.
However, it provided a new perspective to understand cultural distance and destination
choice and showed that the relationship between cultural distance and destination choice
could be moderated by other factors, such as geographical distance and tourists’ novelty-
seeking tendency in this study. The author believes that more factors could be explored
Page 77
66
in future studies in order to obtain a deeper understanding of cultural distance and
destination choice.
Page 78
67
REFERENCES
Ahn, T., Ekinci, Y. & Li, G. (2013). Self-congruence, functional congruence, and
destination choice. Journal of Business Research, 66 (6), 719-723.
Anand, J., & Delios, A. (1997). Location specificity and the transferability of
downstream assets to foreign subsidiaries. Journal of International Business
Studies, 28(3), 579-603.
Babiker, I. E., Cox, J. L.,& Miller, P. M. (1980). The measurement of cultural distance
and its relationship to medical consultations, symptomatology and examination
performance of overseas students at Edinburgh University. Social Psychiatry,
15(3), 109-116.
Baloglu, S. (2001). Image variations of Turkey by familiarity index: informational and
experiential dimensions. Tourism Management, 22(2),127-133.
Basala, S. L., & Klenosky, D. B. (2001). Travel-style preferences for visiting a novel
destination: A conjoint investigation across the novelty-familiarity continuum.
Journal of Travel Research, 40(2), 172-182.
Berry, H., Guillén, M. F., & Zhou, N. (2010). An institutional approach to cross-national
distance. Journal of International Business Studies, 41(9), 1460–1480.
Bonin, H., & Schneider, H. (2006). Analytical prediction of transition probabilities in the
conditional logit model. Economics Letters, 90(1), 102-107.
Boyacigille, N. (1990). The role of expatriates in the management of interdependence,
complexity and risk in multinational corporations. Journal of International
Business Studies, 21(3), 357-381.
Brouthers, K. D., & Brouthers, L. E. (2001). Explaining the national cultural distance
paradox. Journal of International Business Studies, 32(1), 177–189.
Bull, A. (1991).The economics of travel and tourism. Pitman: Melbourne.
Byrne, D., & Nelson, D. (1965). Attraction as a linear function of proportion of positive
reinforcements. Journal of Personality and Social Psychology, 1(6), 659-663.
Carneiro, M. J., & Crompton, J. L. (2010). The Influence of involvement, familiarity and
constraints on the search for information about destinations. Journal of Travel
Research, 49(4), 451-470.
Page 79
68
Central Intelligency Agency (2014). World Fact Book, retrieved from
https://www.cia.gov/library/publications/the-world-factbook/fields/2011.html
Chandon, P., Morwitz, V. G., & Reinartz, W. J. (2005). Do intentions really predict
behavior? Self-generated validity effects in survey research. Journal of
Marketing, 69 (2), 1-14.
Chang, S. J., & Rosenzweig, P. M. (2001). The choice of entry mode in sequential
foreign direct investment. Strategic Management Journal, 22(8), 747–776.
Chang, Y-C., Kao, M-S., Kuo, A., & Chiu,C-F. (2012). How cultural distance influences
entry mode choice: the contingent role of host country's governance quality.
Journal of Business Research, 65(8), 1160-1170.
China National Tourism Administration (2013). China’s Tourism Statistical Bulletin.
Retrieved from http://www.cnta.gov.cn/html/2013-9/2013-9-12-%7B@hur%7D-
39-08306.html
China Webmster (2013, December 16). Retrieved from http://top.chinaz.com/
Chirkov, V. I., Lynch, M., & Niwa, S. (2005). Application of the scenario questionnaire
of horizontal and vertical individualism and collectivism to the assessment of
cultural distance and cultural fit. International Journal of Intercultural Relations,
29(4), 469-490.
Cho, K. R., & Padmanabhan, P. (2005). Revisiting the role of cultural distance in MNC's
foreign ownership mode choice: the moderating effect of experience attributes.
International Business Review, 14(3), 307-324.
Clark, T., & Pugh, D. S. (2001). Foreign country priorities in the internationalization
process: a measure and an exploratory test on British firms. International
Business Review, 10(3), 285–303.
Cohen, E. (1972). Towards a sociology of international tourism. Social Research, 39(1),
164-182.
Crompton, J. L. (1977). A system model of the tourist’s destination selection decision
process with particular reference to the role of image and perceived constraints.
Ph.D. dissertation. Texas A&M University, College Station.
Crompton, J. L. (1979). Motivations for pleasure vacation. Annals of Tourism Research,
6(4), 408-424.
Crompton, J. L. (1992). Structure of vacation destination choice sets. Annals of Tourism
Research, 19(3), 420-434.
Crompton, J. L., & Ankomah, P. K. (1993). Choice set propositions in destination
decisions. Annals of Tourism Research, 20(3), 461-476.
Page 80
69
Crotts, J. C. (2004). The effect of cultural distance on overseas travel behaviors. Journal
of Travel Research, 43(1), 83-88.
Crotts, J., & R. Erdmann (2000). Does national culture influence consumers’ evaluations
of travel services? A test of Hofstede’s model of cross-cultural differences.
Managing Service Quality, 10 (6), 410-419.
Crouch, G. I. (1994). The study of international tourism demand: A review of findings.
Journal of Travel Research, 33(1), 12-23.
Dann, G. M. S. (1996). Tourist images of a destination: An alternative analysis. In D. R.
Fesenmaier, J. T. O'Leary, & M. Uysal, Recent advances in tourism marketing
research(pp. 41-55). New York: The Haworth Press.
Dikova, D., & Rao Sahib, P. (2013). Is cultural distance a bane or a boon for cross-border
acquisition performance? Journal of World Business, 48(1), 77-86.
Donaldson, S. I., & Grant-Vallone, E. J. (2002). Understanding self-report bias in
organizational behavior research. Journal of Business and Psychology, 17(2),
245-260.
Drogendijk, R., & Slangen, A. (2006). Hofstede, Schwartz, or managerial perceptions?
The effects of different cultural distance measures on establishment mode choices
by multinational enterprises. International Business Review, 15(4), 361-380.
Du, J., Lu, Y., & Tao, Z. (2012). Institutions and FDI location choice: The role of cultural
distances. Journal of Asian Economics, 23(3), 210-223.
Erramilli, M. K., & Rao, C. P. (1993). Service firms' international entry-mode choice: a
modified transaction-cost analysis approach. Journal of Marketing, 57(3), 19-38.
Ewing, M. T. (2000). Brand and retailer loyalty: past behavior and future intentions.
Journal of Product & Brand Management, 9(2), 120-127.
Faison, E. (1977). The neglected variety drive: A useful concept for consumer behavior.
Journal of Consumer Research, 4(3), 172–175.
Fletcher, R., & Bohn, J. (1998). The impact of psychic distance on the
internationalisation of the Australian firm. Journal of Global Marketing, 12(2),
47-68.
Fletcher, R., & Bohn, J. (1998). The Impact of Psychic Distance on the
Internationalisation of the Australian Firm. Journal of Global Marketing, 12(2),
47-68.
Fridgen, J. D. (1987). Use of cognitive maps to determine perceived tourism region.
Leisure Sciences, 9(2), 101-117.
Page 81
70
Froese, F. J., & Peltokorpi, V. (2011). Cultural distance and expatriate job satisfaction.
International Journal of Intercultural Relations, 35(1), 49-60.
Galchenko, I., & van de Vijver, F. J. R. (2007). The role of perceived cultural distance in
the acculturation of exchange students in Russia. International Journal of
Intercultural Relations, 31(2), 181-197.
Gales, L. (2008). The role of culture in technology management research: National
Character and Cultural Distance frameworks. Journal of Engineering and
Technology Management, 25(1-2), 3-22.
Greer, T., & Wall, G. (1979). Recreational Hinterlands: Atheoretical and empirical
analysis. In G. Wall (ed.), Recreational land use in Southern Ontario (pp.227–
246). Department of Geography, University of Waterloo.
Groeschl, S., & Doherty, L. (2000). Conceptualizing culture. Cross Cultural
Management: An International Journal, 7(4), 12-17.
Hall, E. T. (1976). Beyond culture. New York: Doubleday.
Heatwole, C. (2006) Culture: A geographical perspective. In World Communities: What
Is a Culture? An Online teacher resource guide for grade 3 social studies. The
University of the State of New York, The State Education Department, Albany,
New York.
Hill, T. H. (2000). Investigating cognitive distance and long-haul destinations. Tourism
Analysis, 5, 83-90.
Hofstede, G. (1980). Culture’s consequences: international difference in work-related
values. Beverly Hills, CA: sage publications.
Hofstede, G. (1991). Cultures and organizations: Software of the mind. London, UK:
McGraw-Hill.
Hofstede, G., & M. H. Bond (1988). The Confucius connection: From cultural roots to
economic growth. Organizational Dynamics, 16(4), 5-21.
Hofstede, G., Hofstede, G. J., & Minkov, M. (2010). Cultures and Organizations:
Software of the Mind (3rd ed.). New York: McGraw-Hill.
House, R. J., Hanges, P. J., Javidan, M., Dorfman, P. W., & Gupta, V. (Eds.). (2004).
Culture, leadership, and organizations: The GLOBE study of 62 societies.
Thousand Oaks, CA: Sage Publications.
Hsu, T.-K., Tsai, Y.-F., & Wu, H.-H. (2009). The preference analysis for tourist choice of
destination: A case study of Taiwan. Tourism Management, 30(2), 288-297.
Hu, Y., & Ritchie, J. R. B. (1993). Measuring destination attractiveness: A contextual
Page 82
71
approach. Journal of Travel Research, 32(2), 25-34.
Inglehart, R. & Welzel, C. (2005). Modernization, cultural change and democracy: The
human development sequence. Cambridge University Press: New York.
Inglehart, R. (1997). Modernization and postmodernization: Cultural, economic and
political change in 43 societies. Princeton: Princeton University Press.
Inglehart, R., & Baker, W. E. (2000). Modernization, cultural change, and the persistence
of traditional values. American Sociological Review, 65(1), 19-51.
Inglehart, R., Basañez, M. & Moreno, A. (1998). Human values and beliefs: A cross-
cultural sourcebook. Ann Arbor: University of Michigan Press.
Jackson, M. (2000). Predicting Australian mass tourism flow using Hofstede s cultural
model. In: M. Ewen (Ed.). CAUTHE 2000: Peak Performance in Tourism and
Hospitality Research; Proceedings of the Tenth Australian Tourism and
Hospitality Research Conference. Bundoora: School of Tourism and Hospitality,
La Trobe University.
Jackson, M. (2001). Cultural influences on tourist destination choices of 21 Pacific Rim
nations. Proceedings of the 11th Australian Tourism and Hospitality Research
Conference, CAUTHE 2001: Capitalising on Research. Canberra, Australia:
University of Canberra Press.
Jang, S. C. & Feng, R. (2007). Temporal destination revisit intention: The effects of
novelty seeking and satisfaction. Tourism Management, 28(2), 580-590.
Jeong, C. (2009). Effects of exposure time to travel information sources on familiarity,
destination image, and intention to visit. Retrieved from ProQuest Digital
Dissertations. (UMI: 3467740)
Jin, T., Lin, V. S., & Hung, K. (2014). China's Generation Y's expectation on outbound
group package tour. Asia Pacific Journal of Tourism Research, 19(6), 617-644.
Johnson, E. J., & Russo, J. E. (1984). Product familiarity and learning new information.
Journal of Consumer Research, 11(1), 542-550.
Keating, B., & Kriz, A. (2008). Outbound tourism from China: Literature review and
research agenda. Journal of Hospitality and Tourism management, 15(1), 32-41.
Kluckhohn, F. R. & Strodtbeck, F. L. (1961). Variations in value orientations. Westport.
CT: Greenwood Press.
Kogut, B., & Singh, H. (1988). The effect of national culture on the choice of entry
mode. Journal of International Business Studies, 19(3), 411–432.
Kotler, P. (1997). Marketing Management (9th ed.). New Jersey: Prentice Hall.
Page 83
72
Kozak, M., Crotts, J. C., & Law, R. (2007). The impact of the perception of risk on
international travellers. International Journal of Tourism Research, 9(4), 233-242.
Lang, C., O’Leary, J. T., & Morrison, A. M. (1997). Distinguishing the destination
choices of pleasure travelers from Taiwan. Journal of Travel & Tourism
Marketing, 6(1), 21-40.
Lee, G., & Tussyadiah, I. P. (2012). Exploring familiarity and destination choice in
international tourism. Asia Pacific Journal of Tourism Research, 17(2), 133-145.
Lee, H. A., Guillet, B. D., Law, R., & Leung, R. (2012). Robustness of distance decay for
international pleasure travelers: A longitudinal approach. International Journal of
Tourism Research, 14(5), 409-420.
Li, X. & Stepchenkova, S. (2012). Chinese outbound tourists’ destination image of
America: Part I. Journal of Travel Research, 51(3), 250-266.
Li, X., Cheng, C-K., Kim, H., & Li, X. (2013). Positioning USA in the Chinese outbound
travel market. Journal of Hospitality & Tourism Research (In press).
Li, X., Cheng, C-K., Kim, H., & Petrick, J. (2008). A systematic comparison of first-
time and repeat visitors via a two-phase online survey. Tourism Management,
29(2), 278-293.
Li, X., Harrill, R., Uysal, M., Burnett, T., & Zhan, X. (2010). Estimating the size of the
Chinese outbound travel market: A demand-side approach. Tourism Management,
31(2), 250-259.
Li, X., Lai, C. Harrill, R., Kline, S. & Wang, L. (2011). When East meets West: An
exploratory study on Chinese outbound tourists’ travel expectations. Tourism
Management, 32(4), 741-749.
Li, X., Meng, F., Uysal, M., & Mihalik, B. (2013). Understanding China's long-haul
outbound travel market: An overlapped segmentation approach. Journal of
Business Research, 66(6), 786-793.
Litvin, S., Crotts, J., & Hefner, F. (2004). Cross cultural tourist behavior: Revisiting
Hofstede’s uncertainty avoidance dimension. International Journal of Tourism
Research, 6(1), 29-37.
López-Duarte, C., & Vidal-Suárez, M. M. (2010). External uncertainty and entry mode
choice: Cultural distance, political risk and language diversity. International
Business Review, 19(6), 575-588.
Lucey, B. M., & Zhang, Q. (2010). Does cultural distance matter in international stock
market comovement? Evidence from emerging economies around the world.
Emerging Markets Review, 11(1), 62-78.
Page 84
73
Lui, V., Kuo, Y., Fung, J., Jap, W., & Hsu, H. (2011). Taking off: Travel and tourism in
China and beyond. The Boston Consulting Group. Retrieved from
http://www.bcg.com.cn/export/sites/default/en/files/publications/reports_pdf/BCG
_Taking_Off_Mar_2011_ENG.pdf
Luostarinen, R. (1979). Internationalization of the firm. Helsinki, the Netherlands:
Helsinki School of Economics.
MacKay, K. J., & Fesenmaier, D. R. (1997). Pictorial element of destination in image
formation. Annals of Tourism Research, 24(3), 537-565.
MacKay, K. J., & Fesenmaier, D. R. (1997). Pictorial element of destination in image
formation. Annals of Tourism Research, 24(3), 537-565.
Mansfeld, Y. (1992). From motivation to actual travel. Annals of Tourism Research,
19(3), 399-419.
Mathieson, A., & Wall, G. (1982). Tourism: Economic, physical and social impacts.
London: Longman.
Mazursky, D. (1989). Past experience and future tourism decisions. Annals of Tourism
Research,16(3), 333-344
McCracken, Grant. (1986). Culture and consumption: A theoretical account of the
structure and movement of the cultural meaning of consumer goods. Journal of
Consumer Research, 13(1), 71-84.
McIntosh, R. W., Goeldner, C. R., & Ritchie, J. R. B. (1995). Tourism principles,
practices, philosophies. New York: John Wiley.
McKercher, B. (1998). The effect of distance decay on visitor mix at coastal destinations.
Pacific Tourism Review, 2(3/4), 215-224.
McKercher, B., & Guillet B. D. (2011). Are tourists or markets destination loyal? Journal
of Travel Research, 50(2), 121-132.
McKercher, B., & Lew, A. (2003). Distance decay and the impact of effective tourism
exclusion zones on in international travel flows. Journal of Travel Research,
42(2),159 – 165.
McKercher, B., & Tse, T. S. (2012) Is intention to return a valid proxy for actual repeat
visitation? Journal of Travel Research, 51(6), 671-686.
Menard, S. (2001). Applied Logistic Regression Analysis (Quantitative Applications in
the Social Sciences) (2nd ed.). Thousand Oaks, CA:Sage.
Meschi, P. X. (1997). Longevity and cultural differences of international joint ventures:
Toward time-based cultural management. Human Relations, 50(2), 211–228.
Page 85
74
Milman, A., & Pizam, A. (1995). The role of awareness and familiarity with a
destination: The central Florida case. Journal of Travel Research, 33(3), 21-27.
Money, R. B., & Crotts, J. C. (2003). The effect of uncertainty avoidance on information
search, planning, and purchases of international travel vacations. Tourism
Management, 24(2), 191-202.
Morden, T. (1999). Models of national culture – a management review. Cross Cultural
Management: An International Journal, 6(1), 19-44.
Moutinho, L. (1987). Consumer behavior in tourism. European Journal of Marketing,
21(10), 2-44.
Myers, R.H. (1990). Classical and modern regression application (2nd ed.). CA:
Duxbury press.
Nesdale, D., & Mak, A. S. (2003). Ethnic identification, self-esteem and immigrant
psychological health. International Journal of Intercultural Relations, 27(1), 23-
40.
Ng, S. I., Lee, J. A., & Soutar, G. N. (2007). Tourists’ intention to visit a country: The
impact of cultural distance. Tourism Management, 28(6), 1497-1506.
Ng, S. I., Lee, J. A., & Soutar, G. N. (2009). The influence of cultural similarity and
individual factors on visitation. TEAM Journal of Hospitality & Tourism, 6(1),
68-81.
Nicolau, J. L., & Más, F. J. (2006). The influence of distance and prices on the choice of
tourist destinations: The moderating role of motivations. Tourism Management,
27(5), 982-996.
Nyaupane, G. P., Paris, C. M., & Teye, V. (2011). Study abroad motivations, destination
selection and pre-trip attitude formation. International Journal of Tourism
Research, 13(3), 205-217.
Padmanabhan, P., & Cho, K. R. (1996). Ownership strategy for a foreign affiliate: An
empirical investigation of Japanese firms. Management International Review,
36(1), 45-65.
Peng, M. W., Hill, C. W. L., Wang, D. Y. L. (2000). Schumpeterian dynamics versus
Williamsonian considerations: A test of export intermediary performance Journal
of Management Studies, 37(2), 167-184.
Petrick, J. F. (2002). An examination of golf vacationers’ novelty. Annals of Tourism
Research, 29(2), 384-400.
Pizam, A. (1999). The American group tourist as viewed by British, Israeli, Korean and
Dutch tour guides. Journal of Travel Research, 38(2), 119-126.
Page 86
75
Pizam, A., & Jeong, G. (1996). Cross-cultural tourist behavior. Tourism Management,
17(4),277-286.
Pizam, A., & Reichel, A. (1996). The effect of nationality on tourism behavior: Israeli
tour guide perceptions. Journal of Hospitality and Leisure Marketing, 4(1), 23-49.
Pizam, A., & Sussman, S. (1995). Does nationality affect tourist behaviour? Annals of
Tourism Research, 22(4), 901-917.
Pizama, A., Jansen-Verbekeb, M., & Steel, L. (1997). Are all tourists alike, regardless of
nationality? The perceptions of Dutch tour-guides. Journal of International
Hospitality, Leisure & Tourism Management, 1(1), 19-38.
Plog, S. (1974). Why destination areas rise and fall in popularity? Cornell Hotel and
Restaurant Administration Quarterly, 14(4), 55-58.
Plog, S. (2001). Why destination areas rise and fall in popularity: an update of a Cornell
Quarterly classic. Cornell Hotel and Restaurant Administration Quarterly, 42(3),
13-24.
Prentice, R. (2004). Tourist familiarity and imagery. Annals of Tourism Research, 31(4),
923-945.
Prentice, R., & Andersen, V. (2000). Evoking Ireland: Modeling tourist propensity.
Annals of Tourism Research, 27(2), 490-516.
Reisinger, Y. (2009). International tourism: Cultures and behavior. Oxford, UK:
Butterworth-Heinemann.
Reisinger, Y., & Turner, L. (1998). Cultural differences between Mandarin-speaking
tourists and Australian hosts and their impact on cross-cultural tourist-host
interaction. Journal of Business Research, 42(2), 175–187.
Reisinger, Y., & Turner, L. W. (2002a). Cultural differences between Asian tourist
markets and Australian hosts, Part 1. Journal of Travel Research, 40(3), 295-315.
Reisinger, Y., & Turner, L. W. (2002b). Cultural differences between Asian tourist
markets and Australian hosts: Part 2. Journal of Travel Research, 40(4), 374-384.
Reuters (2013). Chinese overtake Germans as biggest spending tourists. Retrieved from
http://www.reuters.com/article/2013/04/04/us-china-tourism-spending-
idUSBRE9330TJ20130404
Richardson, S. L., & Crompton, J. L. (1988). Cultural variations in perceptions of
vacation attributes. Tourism Management, 9(2), 128-136.
Ritter, W. (1987). Styles of tourism in the modern world. Tourism Recreation
Research,12(1), 3-8.
Page 87
76
Rosenbaum, M., & Spears, D. (2005). Who buys what? Who does what? Analysis of
cross-cultural consumption behaviors among tourists in Hawaii. Journal of
Vacation Marketing, 11(3), 235–247.
Schiffman, L. G., & Kanuk, L. L. (1997). Consumer Behavior. New Jersey: Prentice
Hall.
Schwartz, S. H. (1994). Beyond individualism/collectivism: New cultural dimensions of
values. In U. Kim, H. C. Triandis, C. Kagitçibasi, S. C. Choi & G. Yoon (Eds.),
Individualism and collectivism: Theory, method and applications. Thousand
Oaks, CA: Sage.
Shane, S. (1994). The effect of national culture on the choice between licensing and
direct foreign investment. Strategic Management Journal, 15(8), 627-642.
Sheatsley, D., Li, X., & Harrill, R. (2009). Emerging international travel markets:
China— Part II. Report published by the United States Travel Association.
Shenkar, O. (2001). Cultural distance revisited: Towards a more rigorous
conceptualization and measurement of cultural differences. Journal of
International Business Studies, 32(3), 519-535.
Sivakumar, K., & Nakata, C. (2001). The stampede toward Hofstede’s framework:
Avoiding the sample design pit in cross-cultural research. Journal of International
Business Studies, 32(3), 555-574.
Smith, P. B,, Dugan, S., & Trompenaars, F. (1996). National culture and the values of
organizational employees: A dimensional analysis across 43 nations. Journal of
Cross-Cultural Psychology, 27(2):231-264.
Sojka, J.Z. & Tansuhaj P.S. (1995). Cross-cultural consumer research: A twenty-year
review. Advances in Consumer Research, 22, 461-474.
Solomon, M. R. (1996). Consumer behavior: Buying, having, and being. New Jersey:
Prentice Hall.
Sönmez, S., & Graefe, A. R. (1998). Determining future travel behavior from past travel
experience and perceptions of risk and safety. Journal of Travel Research, 37(2),
172-177.
Spradley, J. P., & Philips, M. (1972). Culture and stress: A quantitative analysis.
American Anthropologist, 74(3), 518–529.
Steenkamp, J. E. M. (2001). The role of national culture in international marketing
research. International Marketing Review, 18(1), 30–44.
Tellis, G. J. & Chandrasekaran, D. (2010). Does culture matter? Assessing biases in
cross-national survey research. International Journal of Research in Marketing,
Page 88
77
27(4), 329-341.
Terlutter, R., Diehl, S., & Mueller, B. (2006). The GLOBE study – applicability of a new
typology of cultural dimensions for cross-cultural marketing and advertising
research. In Sandra Diehl, Ralf Terlutter (Eds.), .International Advertising and
Communication (pp.419-438). Wiesbaden: Gabler.
Thraenhart, J. (2012). Behold the tech-savvy, young and affluent Chinese traveler,
coming to a country near you. Retrieved from
http://www.tnooz.com/article/behold-the-tech-savvy-young-and-affluent-chinese-
traveller-coming-to-a-country-near-you/
Toyama, M., Yamada, Y. (2012). The Relationships among Tourist Novelty, Familiarity,
Satisfaction, and Destination Loyalty: Beyond the Novelty-familiarity
Continuum. International Journal of Marketing Studies, 4(6), 10-18.
Trompenaars, F. (1994). Riding the waves of culture: understanding diversity in global
business. Chicago, IL: Irwin.
Trompenaars, F., & Hampden-Turner, C. (1998). Riding the waves of culture (2nd ed.).
London: Nicholas Brealey Publishing Ltd.
Um, S., & Crompton, J. L. (1990). Attitude determinants in tourism destination choice.
Annals of Tourism Research, 17(3), 432-448.
UNWTO (2012). The Chinese Outound Travel Market 2012 Update. Retreved from
http://www.google.com/url?sa=t&rct=j&q=&esrc=s&frm=1&source=web&cd=1
9&cad=rja&uact=8&ved=0CHEQFjAIOAo&url=http%3A%2F%2Ftourism-
intelligence.com%2Fcatalog%2Fdownload_product.php%3Fdfn%3DMjY5&ei=-
0U6U4PkNNGzsAS3k4HoBw&usg=AFQjCNE9amLAvBu9XyGOC6Vk2XsFa
Y0ssg&sig2=zk9XRtG0s7t0RoMdJem7Gw&bvm=bv.63934634,d.cWc
UNWTO (2013). Facts and figures. Retrieved from
http://www.unwto.org/facts/menu.html
UNWTO (2013). Tourism highlights (2013 Edition). Retrieved from
http://dtxtq4w60xqpw.cloudfront.net/sites/all/files/pdf/unwto_highlights13_en_lr
_0.pdf
Waheeduzzaman, A. N. M. (2011). Are emerging markets catching up with the
developed markets in terms of consumption? Journal of Global Marketing, 24(2),
136-151.
West, J., & Graham, J. L. (2004). A linguistic-based measure of cultural distance and its
relationship to managerial values. Management International Review, 44(3), 239–
260.
Wong, S., & Lau, E. (2001). Understanding the behavior of Hong Kong Chinese tourists
Page 89
78
on group tour packages. Journal of Travel Research, 40(1), 57-67.
Woodside, A. G., & King, R. (2001). Tourism consumption systems: theory and
empirical research. Journal of Travel and Tourism Research, 10(1), 3-27.
Woodside, A. G., & Lysonski, S. (1989). A general model of traveler destination choice.
Journal of Travel Research, 27(4), 8-14.
Wu, L., Zhang, J., & Fujiwaraa, A. (2012). A tourist's multi-destination choice model
with future dependency. Asia Pacific Journal of Tourism Research, 17(2), 121-
132.
Yamin, M., & Golesorkhi, S. (2010). Cultural distance and the pattern of equity
ownership structure in international joint ventures. International Business Review,
19(5), 457-467.
Yang, J., Yuan, B., & Hu, P. (2009). Tourism destination image and visit intention:
Examining the role of familiarity. Journal of China Tourism Research, 5(2), 174-
187.
Yang, Y., & Wong, K. K.F. (2012). The influence of cultural distance on China inbound
tourism flows: A panel data gravity model approach. Asian Geographer, 29(1),
21-37.
Yavas, U. (1987). Foreign Travel behaviour in a growing vacation market: Implications
for tourism marketers. European Journal of Marketing, 21(5), 57-69.
You, X., O’ Leary, J., Morrison, A., & Hong, G. (2000). A cross-cultural comparison of
travel push and pull factors: United Kingdom versus Japan. International Journal
of Hospitality and Tourism Administration, 1(2), 1–26.
Page 90
79
APPENDIX A – QUESTIONNAIRE DESIGN
Outbound Destination Choice Survey
Dear respondents:
Thank you for agreeing to participate in this survey. My name is Hongbo Liu, a
Master’s student at the University of South Carolina, USA. I am carrying out a survey for
my Master’s thesis. The survey is about Chinese tourists’ outbound travel destination
choice. It should take about 15 minutes to complete the survey.
Your participation in this survey is completely voluntary and you may stop the survey
at any time. Neither your name nor any other identifying information will be recorded on
the survey, and your responses will be kept completely anonymous. There is no known
risk involved in this. In order to keep the information completely confidential, please do
not put your name on the questionnaire.
If you have any questions, please feel free to contact me ([email protected] or
(803)-665-5433) or my advisor, Dr. Xiang (Robert) Li ([email protected] or (803)
777-2764) of the School of Hotel, Restaurant, and Tourism Management at University of
South Carolina.
Sincerely,
Hongbo Liu
School of Hotel, Restaurant, and Tourism Management
University of South Carolina
701 Assembly Street, Columbia, SC 29208
Email: [email protected]
Cell: (803)665-5433
Page 91
80
1. Have you ever visited the following countries before? If yes, how many times?
Have you ever visited this country?
If yes, how many times? (Please
write a number)
U.S. □Yes □ No
France □Yes □ No
Australia □Yes □ No
Japan □Yes □ No
Canada □Yes □ No
U.K. □Yes □ No
Singapore □Yes □ No
Switzerland □Yes □ No
South Korea □Yes □ No
Thailand □Yes □ No
Cambodia □Yes □ No
Russia □Yes □ No
Malaysia □Yes □ No
Vietnam □Yes □ No
Italy □Yes □ No
2. How large do you think the national cultural difference (i.e., differences in norms and
values, habits and customs, behaviors, language, ways of communication,
relationships with people) is between the following list of countries and China?
Please respond based on your impression of this country.
Very small Somewhat small Medium Somewhat large Very large
U.S. 1 2 3 4 5
France 1 2 3 4 5
Australia 1 2 3 4 5
Japan 1 2 3 4 5
Canada 1 2 3 4 5
U.K. 1 2 3 4 5
Singapore 1 2 3 4 5
Switzerland 1 2 3 4 5
South Korea 1 2 3 4 5
Thailand 1 2 3 4 5
Cambodia 1 2 3 4 5
Russia 1 2 3 4 5
Malaysia 1 2 3 4 5
Vietnam 1 2 3 4 5
Italy 1 2 3 4 5
3. How difficult is it for a “general Chinese” to adapt to the living environment of the
following list of countries? Please respond based on your impression of this country.
Page 92
81
Very easy Somewhat easy Medium Somewhat
difficult Very
difficult U.S. 1 2 3 4 5
France 1 2 3 4 5
Australia 1 2 3 4 5
Japan 1 2 3 4 5
Canada 1 2 3 4 5
U.K. 1 2 3 4 5
Singapore 1 2 3 4 5
Switzerland 1 2 3 4 5
South Korea 1 2 3 4 5
Thailand 1 2 3 4 5
Cambodia 1 2 3 4 5
Russia 1 2 3 4 5
Malaysia 1 2 3 4 5
Vietnam 1 2 3 4 5
Italy 1 2 3 4 5
4. How familiar are you with these countries? Please indicate your overall familiarity
with these countries using a 5-point scale ranging from 1=Very unfamiliar to 5=
Very familiar.
Very
unfamiliar Somewhat unfamiliar
Neither familiar nor unfamiliar
Somewhat familiar
Very Familiar
U.S. 1 2 3 4 5
France 1 2 3 4 5
Australia 1 2 3 4 5
Japan 1 2 3 4 5
Canada 1 2 3 4 5
U.K. 1 2 3 4 5
Singapore 1 2 3 4 5
Switzerland 1 2 3 4 5
South Korea 1 2 3 4 5
Thailand 1 2 3 4 5
Cambodia 1 2 3 4 5
Russia 1 2 3 4 5
Malaysia 1 2 3 4 5
Vietnam 1 2 3 4 5
Italy 1 2 3 4 5
5. Thinking about the tourism information you received about foreign countries, to what
extent have you heard tourism related information about the following countries as
tourism destinations? Please respond using a 5-point scale where 1=Not at all to
5=Very much.
Page 93
82
Not at all Very little Some Much Very Much
U.S. 1 2 3 4 5
France 1 2 3 4 5
Australia 1 2 3 4 5
Japan 1 2 3 4 5
Canada 1 2 3 4 5
U.K. 1 2 3 4 5
Singapore 1 2 3 4 5
Switzerland 1 2 3 4 5
South Korea 1 2 3 4 5
Thailand 1 2 3 4 5
Cambodia 1 2 3 4 5
Russia 1 2 3 4 5
Malaysia 1 2 3 4 5
Vietnam 1 2 3 4 5
Italy 1 2 3 4 5
6. Which ONE country are you most likely to visit for leisure purposes over the next
two years? Please select only one country.
□U.S □Singapore □Thailand □Cambodia
□Japan □Australia □Vietnam □Russia
□Italy □Malaysia □Canada □Switzerland
□France □U.K □South Korea
□None of the above. Please specify the country name:____________
If you chose “None of the above. Please specify the country name:” in Q6,
please continue to answer from Q7; if you chose any of other options in Q6, please
skip to Q8.
7. Please answer the following questions based on the country you specified in Q6.
a. Have you ever visited this country before? If yes, how many times?
□ Yes □ No Times
b. How large do you think the national cultural difference (i.e., differences in norms and values,
habits and customs, behaviors, language, ways of communication, relationships with people) is
between this country and China? Very small Somewhat small Medium Somewhat large Very large
1 2 3 4 5
c. How difficult is it for a “general Chinese” to adapt to the living environment of this country?
Very easy Somewhat easy Medium Somewhat difficult Very difficult
1 2 3 4 5
d. How familiar are you with this country? Please indicate your overall familiarity using a 5-
point scale ranging from 1=Very unfamiliar to 5= Very familiar.
Very unfamiliar Somewhat unfamiliar
Neither familiar nor unfamiliar
Somewhat familiar Very Familiar
1 2 3 4 5
e. Thinking about the tourism information you received about this country, to what extent have
you heard tourism related information about this country?
Page 94
83
Not at all Very little Some Much Very Much
1 2 3 4 5
8. How likely is it that you will actually make this trip over the next two years? Please
use a percentage ranging from 0% to 100% to specify your likelihood of actually
taking this trip.
_______________________________%
9. How important are the following criteria to you when deciding which overseas
destination to visit? Please use a 5-point scale ranging from 1 = very unimportant
to 5 = very important.
Very
Unimportant Unimportant Neutral Important Very important
Experiencing a different culture 1 2 3 4 5
Local crafts and handiwork 1 2 3 4 5
Local cuisine and new food 1 2 3 4 5
Interesting and friendly local
people 1 2 3 4 5
Opportunity to see or experience
people from different ethnic
backgrounds
1 2 3 4 5
Opportunity to see or experience
unique aboriginal or native groups 1 2 3 4 5
Opportunity to increase your
knowledge about places, people,
and things in this country
1 2 3 4 5
A variety of things to see and do 1 2 3 4 5
Visiting a place you can talk about
when you get home 1 2 3 4 5
Demographics
1. How many times have you traveled outside Mainland China, Hong Kong, Macau and
Taiwan so far?
□0 □1 □ 2-3
□ 4-5 □ 6-10 □ Over 10 times
2. How many countries outside Mainland China, Hong Kong, Macau and Taiwan have
Page 95
84
you visited before for any purposes?
□0 □1 □ 2-3
□ 4-5 □ 6-10 □Over 10 countries
3. Please indicate your level of international travel experience using a 5-point scale
ranging from 1=very inexperienced to 5=very experienced.
Very Inexperienced
Not very experienced About average Experienced Very
experienced
1 2 3 4 5
4. What is your marrital status?
□Single/never married □Married/partnered
□ Separated/divorced/widowed □ Prefer not to say
5. Your gender
□ Male □ Female
6. What is the highest level of education you have completed?
□ High School or less □ Technical/vocational high school □ Associate degree or some college □ College graduate □ Graduate work/Master’s/Doctoral degree □ Other (Please specify_____)
7. Your age:
□Under 18 □ 18-19 □ 20-24 □25-29
□30-34 □35-39 □40-44 □45-49
□50-54 □55-59 □60-64 □ 65 and above
□Prefer not to say
8. What is your employment status?
□ Employed full-time/part-time □ Housewife □ Temporarily unemployed/looking for work □ Retired □ Freelancer
Page 96
85
□ Student □ Other (please specify_________________)
If you chose “Housewife” or “Student” in Occupation, please skip to Q10; if you chose any of other options in occupation, please answer Q9 and skip Q10.
9. Which of the following broad categories best describes your approximate monthly
individual income in 2013, before taxes (RMB)?
□ Below 2,000 □ 2,000 to 3,999 □ 4,000 to 6,999
□ 7,000 to 9,999 □ 10,000 to 19,999 □ 20,000 to 29,999
□ 30,000 to 39,999 □ 40,000 to 49,999 □ 50,000 or above
□ Prefer not to say
10. Which of the following broad categories best describes your approximate monthly
household income in 2013, before taxes (RMB)?
□ Below 2,000 □ 2,000 to 3,999 □ 4,000 to 6,999
□ 7,000 to 9,999 □ 10,000 to 19,999 □ 20,000 to 29,999
□ 30,000 to 39,999 □ 40,000 to 49,999 □ 50,000 or above
□ Prefer not to say
Thank you so much for your time and participation!