29
Understanding Financial Statements, Taxes and Cash Flows Chapter 3
Understanding Financial Statements, Taxes and Cash Flows
Chapter 3
Learning Objectives
1. Describe the content of the four basic financial statements and discuss the importance of financial statement analysis to the financial manager.
2. Evaluate firm profitability using the income statement.
3. Estimate a firm’s tax liability using the corporate tax schedule and distinguish between the average and marginal tax rate.
4. Use the balance sheet to describe a firm’s investments in assets and the way it has financed them.
5. Identify the sources and uses of cash for a firm using the firm’s cash flow statement
2
Principles Used in This Chapter
• Principle 1: Money Has a Time Value.
• Principle 3: Cash Flows Are the Source of Value.
• Principle 4: Market Prices Reflect Information.
• Principle 5: Individuals Respond to Incentives.
3
Basic Financial Statements The accounting and financial regulatory authorities mandate that firms provide the following four types of financial statements:
1. Income statement
2. Balance sheet
3. Cash flow statement
4. Statement of shareholders’ equity
1. Not useful for finance
4
Why Study Financial Statements?
Analyzing a firm’s financial statement can help managers carry out three important tasks:
1. assess the financial condition of the firm2.monitor and control operations, and
3. financial forecasting and planning.
5
What are the Accounting Principles Used to Prepare Financial Statements?
• Accountants use the following three fundamental principles when preparing financial statements:
1. The revenue recognition principle,2. The matching principle, and
3. The historical cost principle.
6
An Income Statement
An income statement (also called a profit and loss statement) measures the amount of profits generated by a firm over a given time period (usually a year or a quarter). It can be expressed as follows:
Revenues (or Sales) – Expenses = Profits
7
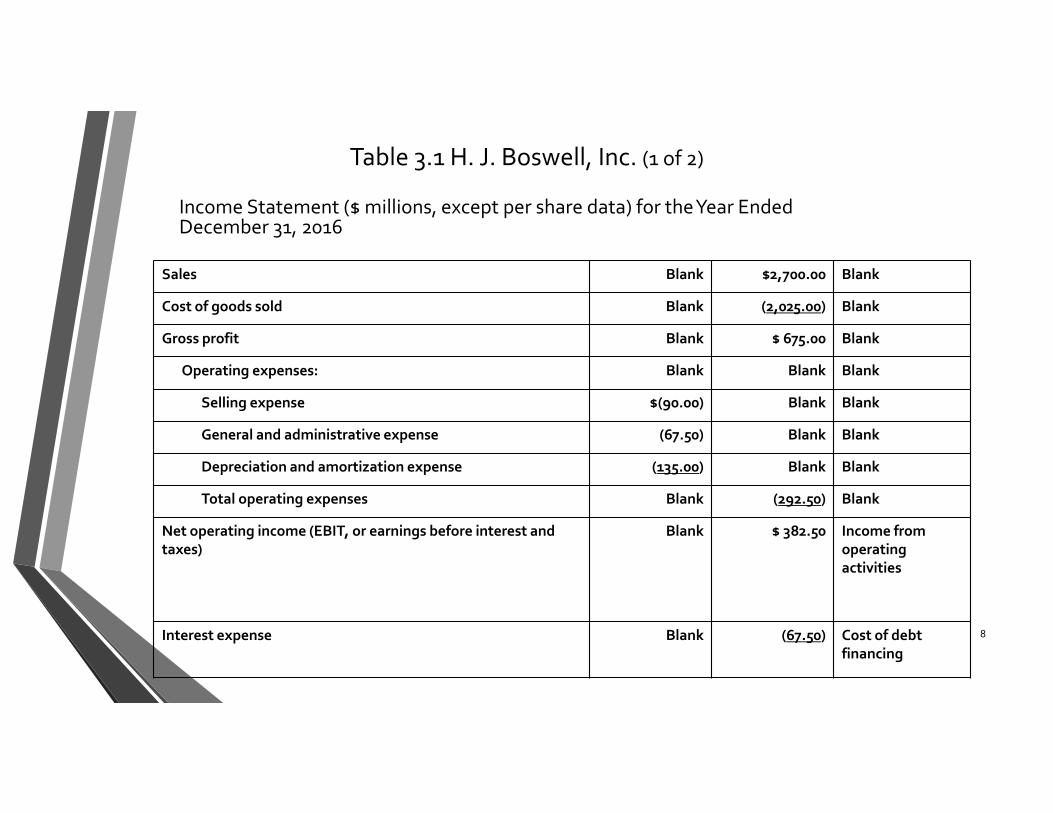
Table 3.1 H. J. Boswell, Inc. (1 of 2)
Income Statement ($ millions, except per share data) for the Year Ended December 31, 2016
8
Sales Blank $2,700.00 Blank
Cost of goods sold Blank (2,025.00) Blank
Gross profit Blank $ 675.00 Blank
Operating expenses: Blank Blank Blank
Selling expense $(90.00) Blank Blank
General and administrative expense (67.50) Blank Blank
Depreciation and amortization expense (135.00) Blank Blank
Total operating expenses Blank (292.50) Blank
Net operating income (EBIT, or earnings before interest and taxes)
Blank $ 382.50 Income from operatingactivities
Interest expense Blank (67.50) Cost of debt financing
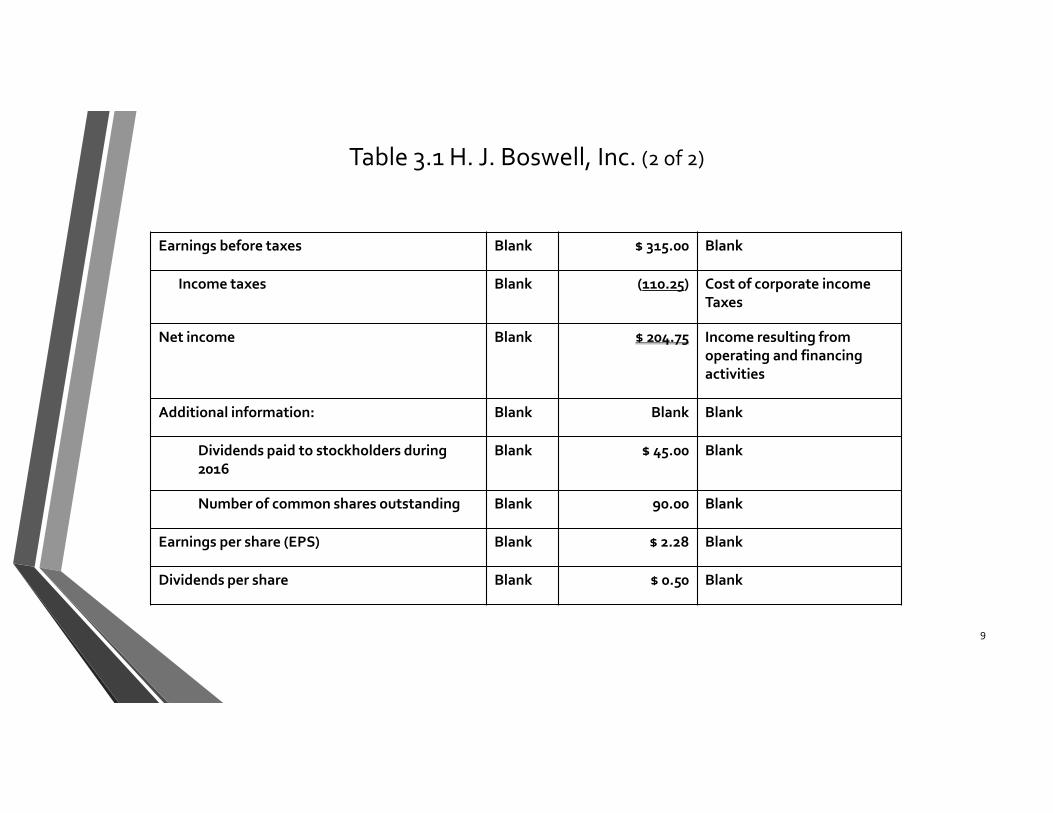
Table 3.1 H. J. Boswell, Inc. (2 of 2)
9
Earnings before taxes Blank $ 315.00 Blank
Income taxes Blank (110.25) Cost of corporate income Taxes
Net income Blank $ 204.75 Income resulting from operating and financing activities
Additional information: Blank Blank Blank
Dividends paid to stockholders during 2016
Blank $ 45.00 Blank
Number of common shares outstanding Blank 90.00 Blank
Earnings per share (EPS) Blank $ 2.28 Blank
Dividends per share Blank $ 0.50 Blank
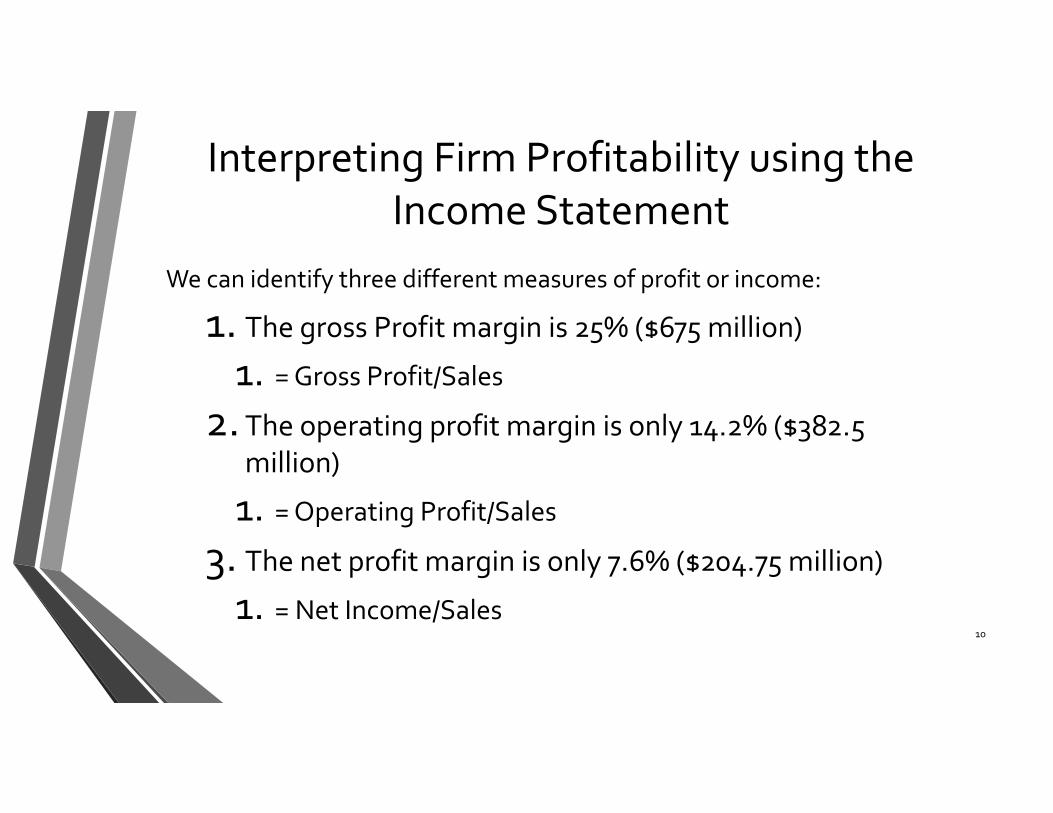
Interpreting Firm Profitability using the Income Statement
We can identify three different measures of profit or income:
1. The gross Profit margin is 25% ($675 million)
1. = Gross Profit/Sales2. The operating profit margin is only 14.2% ($382.5
million)
1. = Operating Profit/Sales
3. The net profit margin is only 7.6% ($204.75 million)
1. = Net Income/Sales10
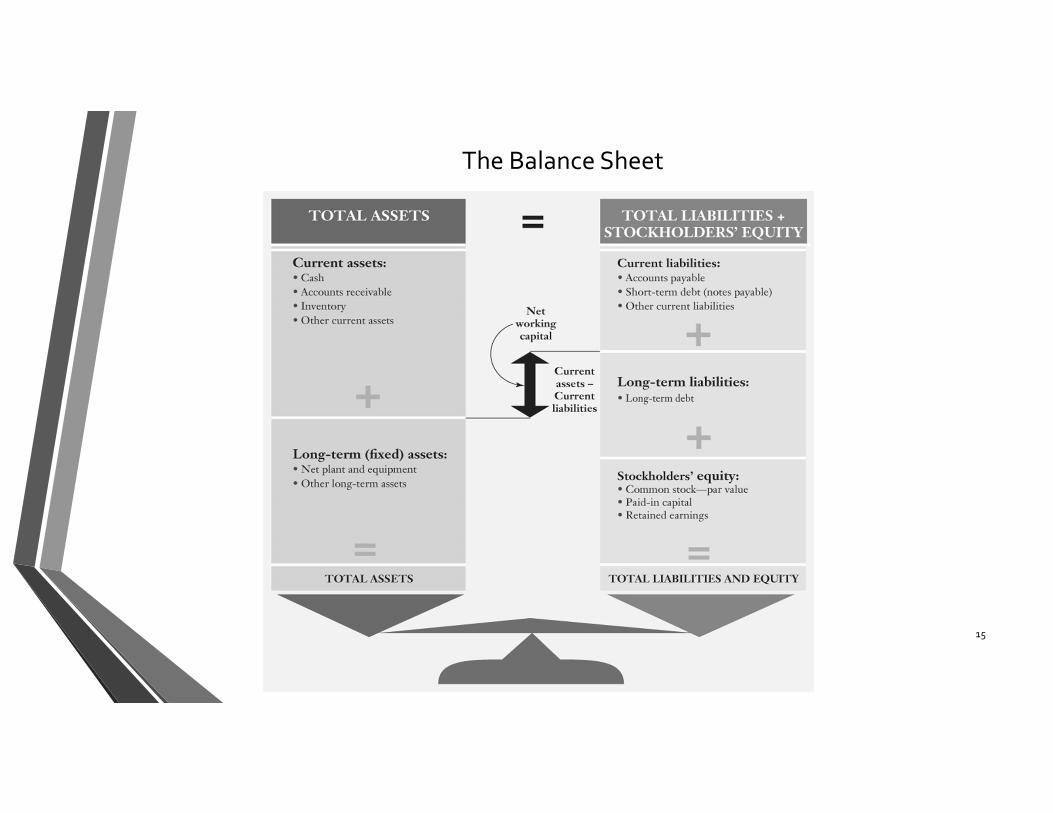
The Balance Sheet
The balance sheet is a snapshot of the firm’s financial position on a specific date. It is defined by the following equation:
Total Assets = Total Liabilities + Total Shareholders Equity
Very Important: Balance Sheet must balance!
11
The Balance Sheet
• Total assets, sum of total shareholders’ equity and total liabilities, represents the resources owned by the firm.
• Total liabilities represent the total amount of money the firm owes its creditors
• Total shareholders’ equity refers to the difference in the value of the firm’s total assets and the firm’s total liabilities.
12
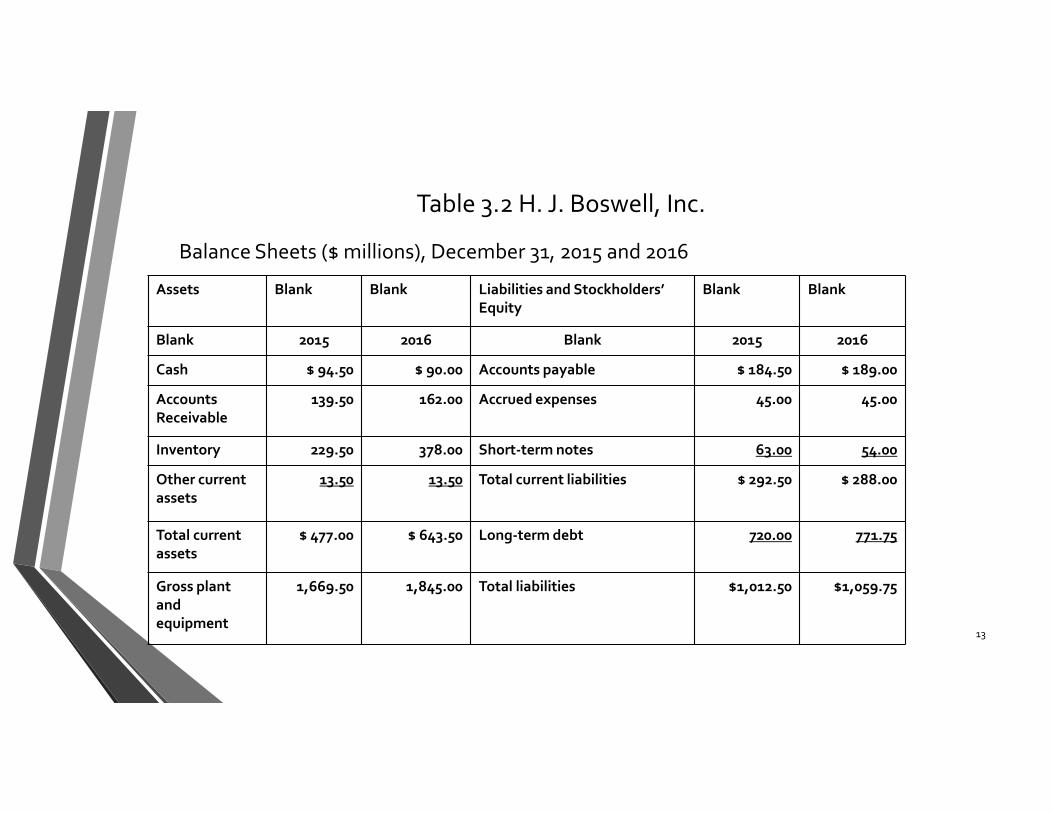
Table 3.2 H. J. Boswell, Inc.
Balance Sheets ($ millions), December 31, 2015 and 2016
13
Assets Blank Blank Liabilities and Stockholders’ Equity
Blank Blank
Blank 2015 2016 Blank 2015 2016
Cash $ 94.50 $ 90.00 Accounts payable $ 184.50 $ 189.00
AccountsReceivable
139.50 162.00 Accrued expenses 45.00 45.00
Inventory 229.50 378.00 Short‐term notes 63.00 54.00
Other currentassets
13.50 13.50 Total current liabilities $ 292.50 $ 288.00
Total current assets
$ 477.00 $ 643.50 Long‐term debt 720.00 771.75
Gross plant andequipment
1,669.50 1,845.00 Total liabilities $1,012.50 $1,059.75
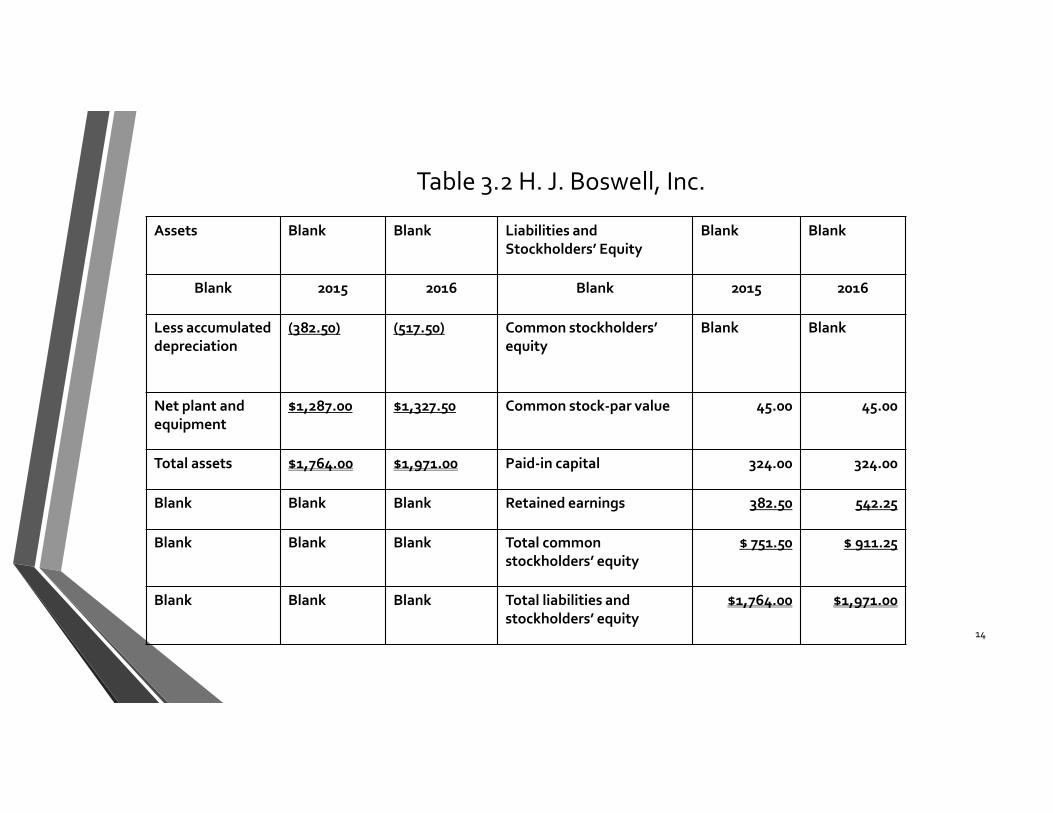
Table 3.2 H. J. Boswell, Inc.
14
Assets Blank Blank Liabilities and Stockholders’ Equity
Blank Blank
Blank 2015 2016 Blank 2015 2016
Less accumulateddepreciation
(382.50) (517.50) Common stockholders’ equity
Blank Blank
Net plant andequipment
$1,287.00 $1,327.50 Common stock‐par value 45.00 45.00
Total assets $1,764.00 $1,971.00 Paid‐in capital 324.00 324.00
Blank Blank Blank Retained earnings 382.50 542.25
Blank Blank Blank Total common stockholders’ equity
$ 751.50 $ 911.25
Blank Blank Blank Total liabilities and stockholders’ equity
$1,764.00 $1,971.00
The Balance Sheet
15
Book Values, Historical Costs, and Market Values
• Book values reported in the balance sheet can differ from market values for three reasons.
• Book values are reflect their historical cost at the time the asset was acquired, not their current market value.
• Depreciation expense used to reduce value of fixed assets reflects accounting and tax rules rather than actual changes in market values.
• Intangible assets are not reflected fully in the firm’s balance sheet.
16
The Cash Flow Statement
The cash flow statement is a report that firms use to explain changes in their cash balances over a specific period of time by identifying all of the sourcesand uses of cash for that period.
17
Sources and Uses of Cash
• A source of cash is any activity that brings cash into the firm. For example, sale of equipment.
• A use of cash is any activity that causes cash to leave the firm. For example, payment of taxes.
18
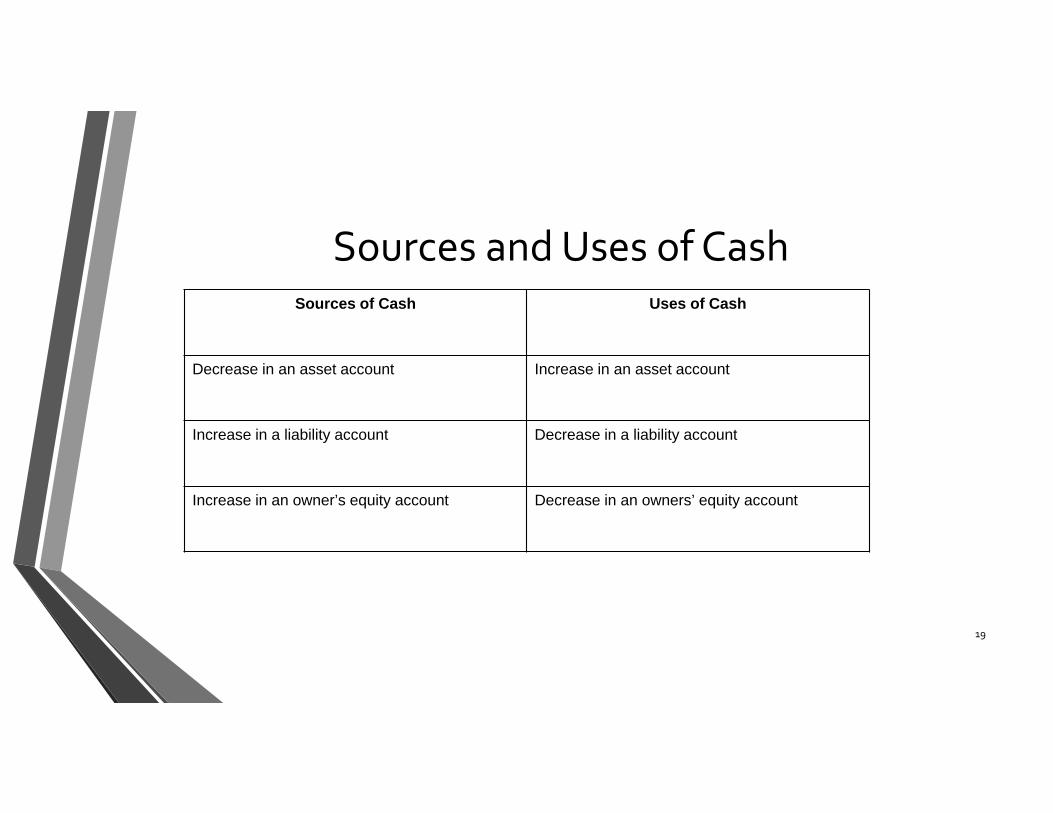
Sources and Uses of Cash
19
Sources of Cash Uses of Cash
Decrease in an asset account Increase in an asset account
Increase in a liability account Decrease in a liability account
Increase in an owner’s equity account Decrease in an owners’ equity account
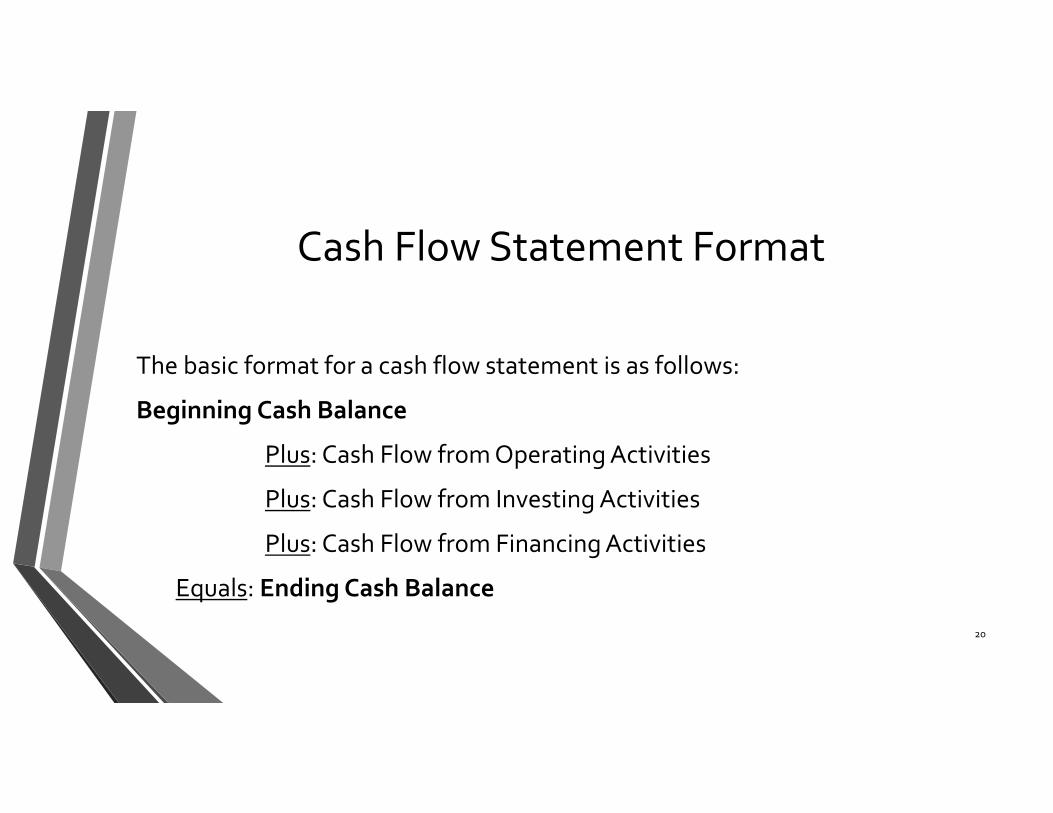
Cash Flow Statement Format
The basic format for a cash flow statement is as follows:
Beginning Cash Balance
Plus: Cash Flow from Operating Activities
Plus: Cash Flow from Investing Activities
Plus: Cash Flow from Financing Activities
Equals: Ending Cash Balance
20
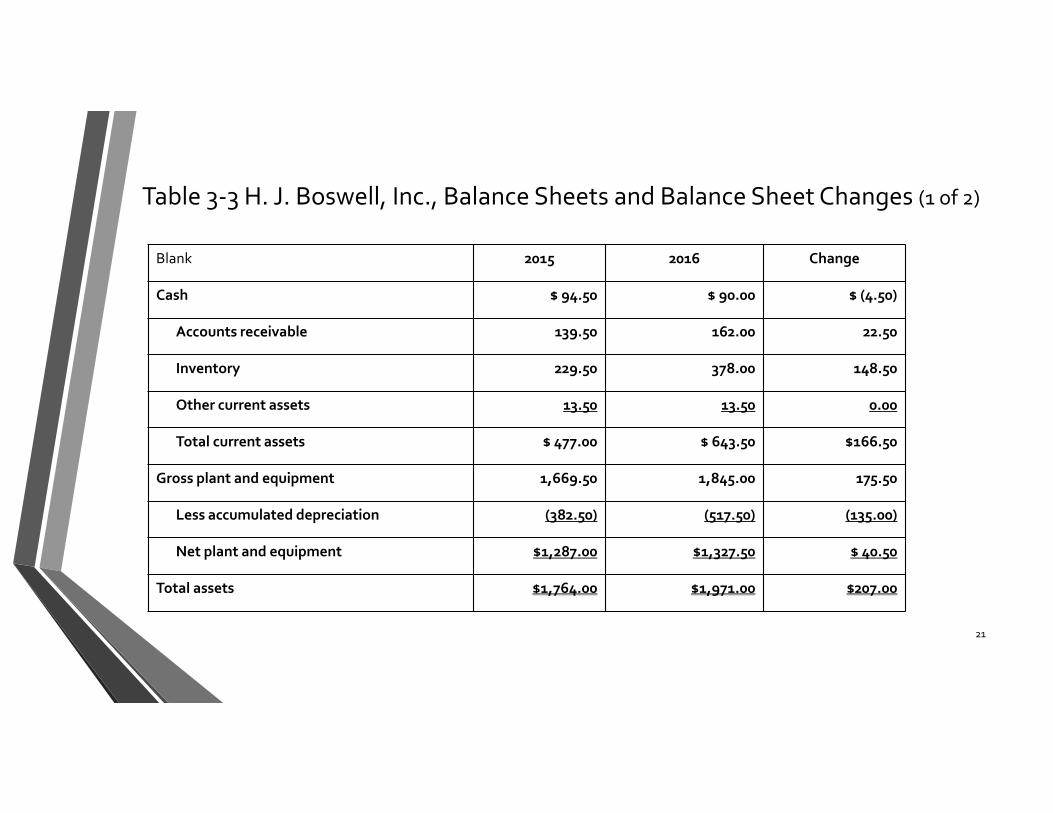
Table 3‐3 H. J. Boswell, Inc., Balance Sheets and Balance Sheet Changes (1 of 2)
21
Blank 2015 2016 Change
Cash $ 94.50 $ 90.00 $ (4.50)
Accounts receivable 139.50 162.00 22.50
Inventory 229.50 378.00 148.50
Other current assets 13.50 13.50 0.00
Total current assets $ 477.00 $ 643.50 $166.50
Gross plant and equipment 1,669.50 1,845.00 175.50
Less accumulated depreciation (382.50) (517.50) (135.00)
Net plant and equipment $1,287.00 $1,327.50 $ 40.50
Total assets $1,764.00 $1,971.00 $207.00
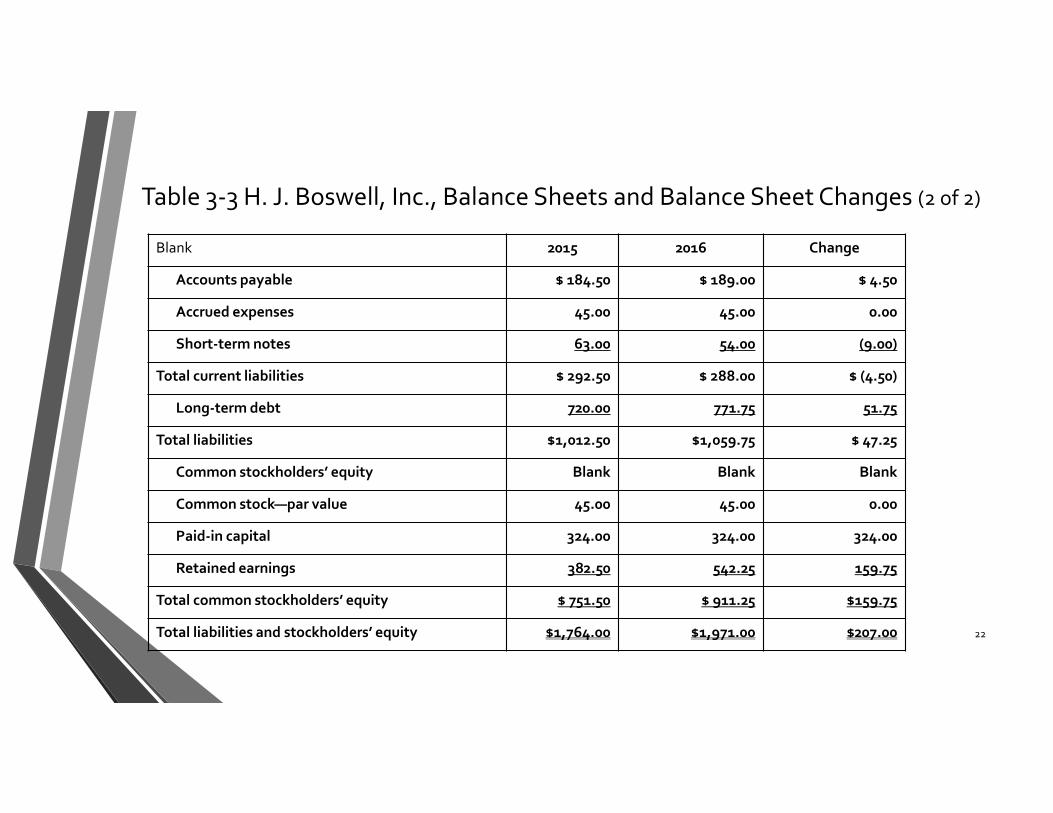
Table 3‐3 H. J. Boswell, Inc., Balance Sheets and Balance Sheet Changes (2 of 2)
22
Blank 2015 2016 Change
Accounts payable $ 184.50 $ 189.00 $ 4.50
Accrued expenses 45.00 45.00 0.00
Short‐term notes 63.00 54.00 (9.00)
Total current liabilities $ 292.50 $ 288.00 $ (4.50)
Long‐term debt 720.00 771.75 51.75
Total liabilities $1,012.50 $1,059.75 $ 47.25
Common stockholders’ equity Blank Blank Blank
Common stock—par value 45.00 45.00 0.00
Paid‐in capital 324.00 324.00 324.00
Retained earnings 382.50 542.25 159.75
Total common stockholders’ equity $ 751.50 $ 911.25 $159.75
Total liabilities and stockholders’ equity $1,764.00 $1,971.00 $207.00
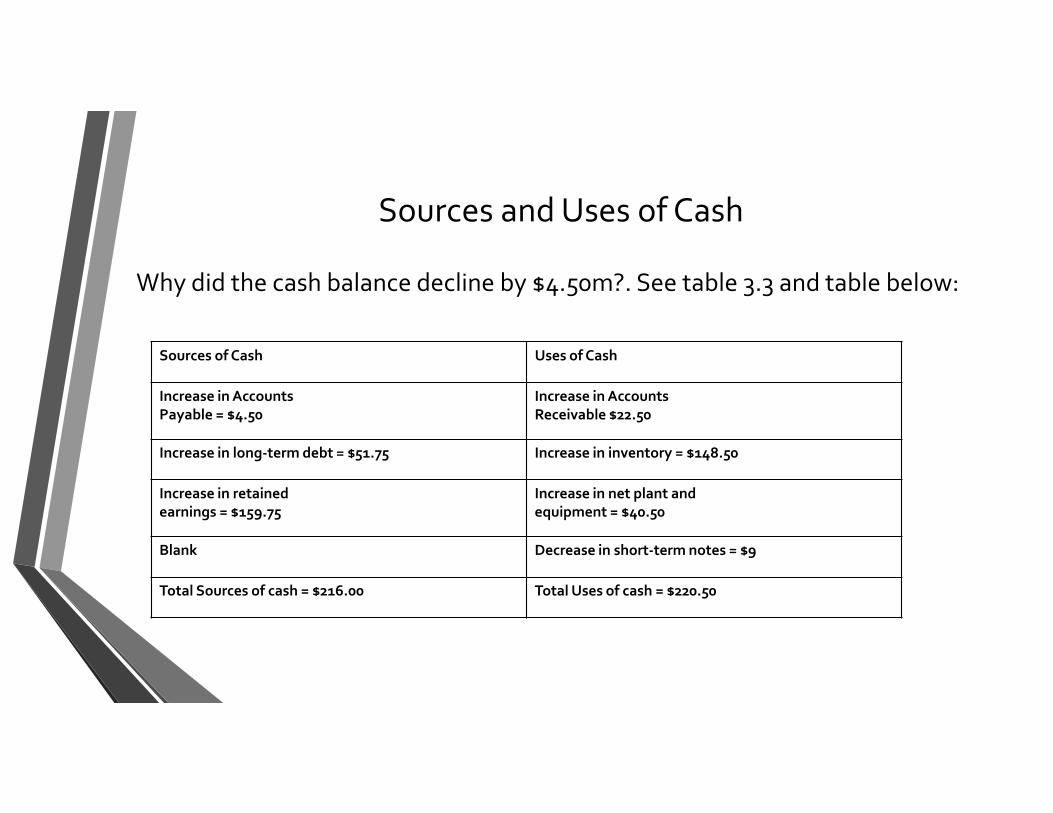
Sources and Uses of Cash
Why did the cash balance decline by $4.50m?. See table 3.3 and table below:
Sources of Cash Uses of Cash
Increase in Accounts Payable = $4.50
Increase in Accounts Receivable $22.50
Increase in long‐term debt = $51.75 Increase in inventory = $148.50
Increase in retained earnings = $159.75
Increase in net plant and equipment = $40.50
Blank Decrease in short‐term notes = $9
Total Sources of cash = $216.00 Total Uses of cash = $220.50
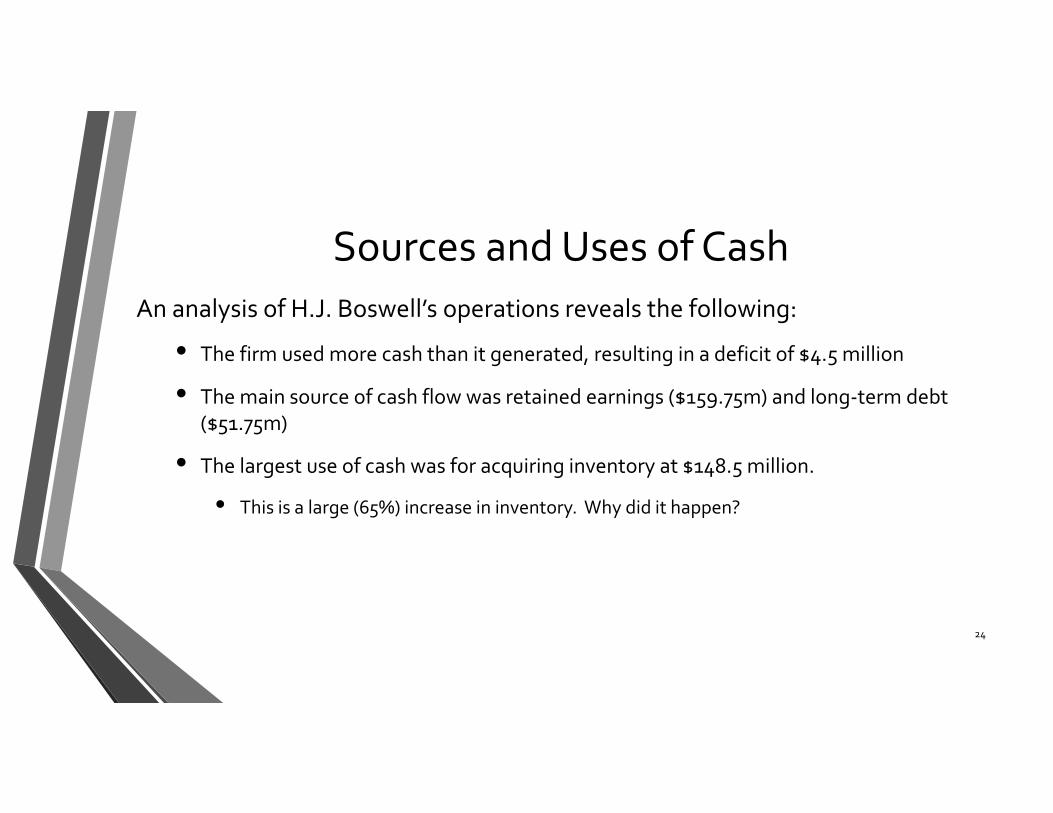
Sources and Uses of Cash An analysis of H.J. Boswell’s operations reveals the following:
• The firm used more cash than it generated, resulting in a deficit of $4.5 million
• The main source of cash flow was retained earnings ($159.75m) and long‐term debt ($51.75m)
• The largest use of cash was for acquiring inventory at $148.5 million.
• This is a large (65%) increase in inventory. Why did it happen?
24
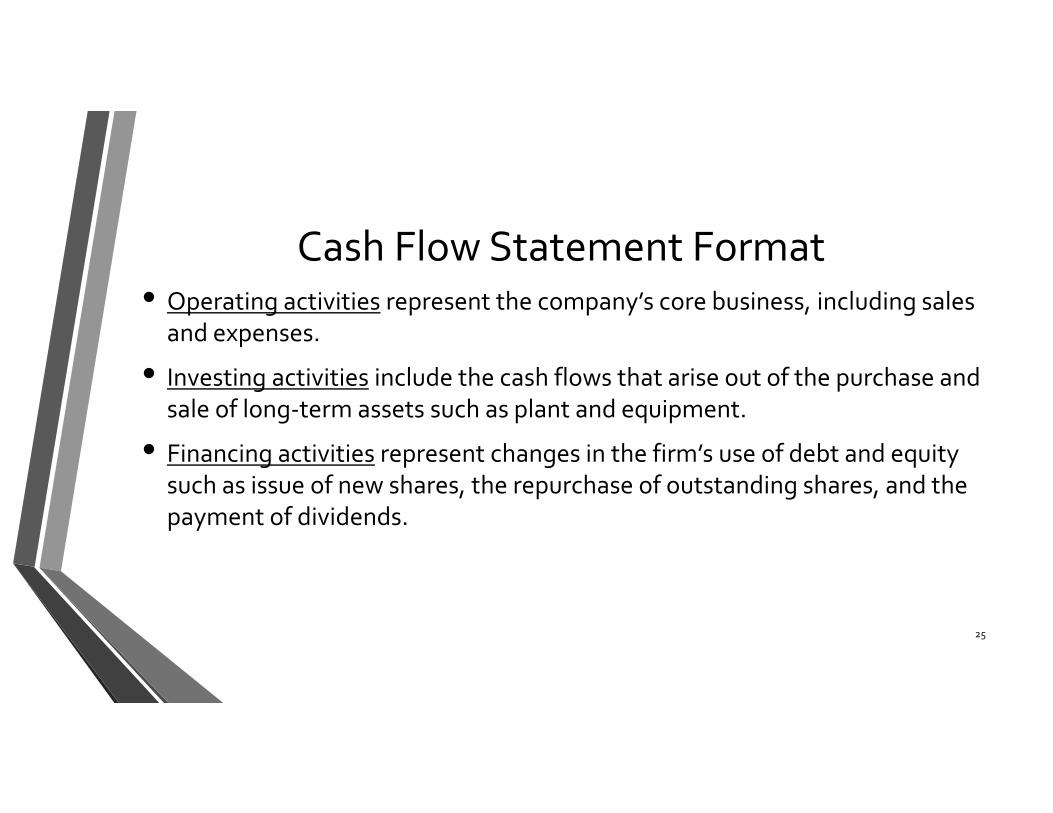
Cash Flow Statement Format • Operating activities represent the company’s core business, including sales
and expenses.
• Investing activities include the cash flows that arise out of the purchase and sale of long‐term assets such as plant and equipment.
• Financing activities represent changes in the firm’s use of debt and equity such as issue of new shares, the repurchase of outstanding shares, and the payment of dividends.
25
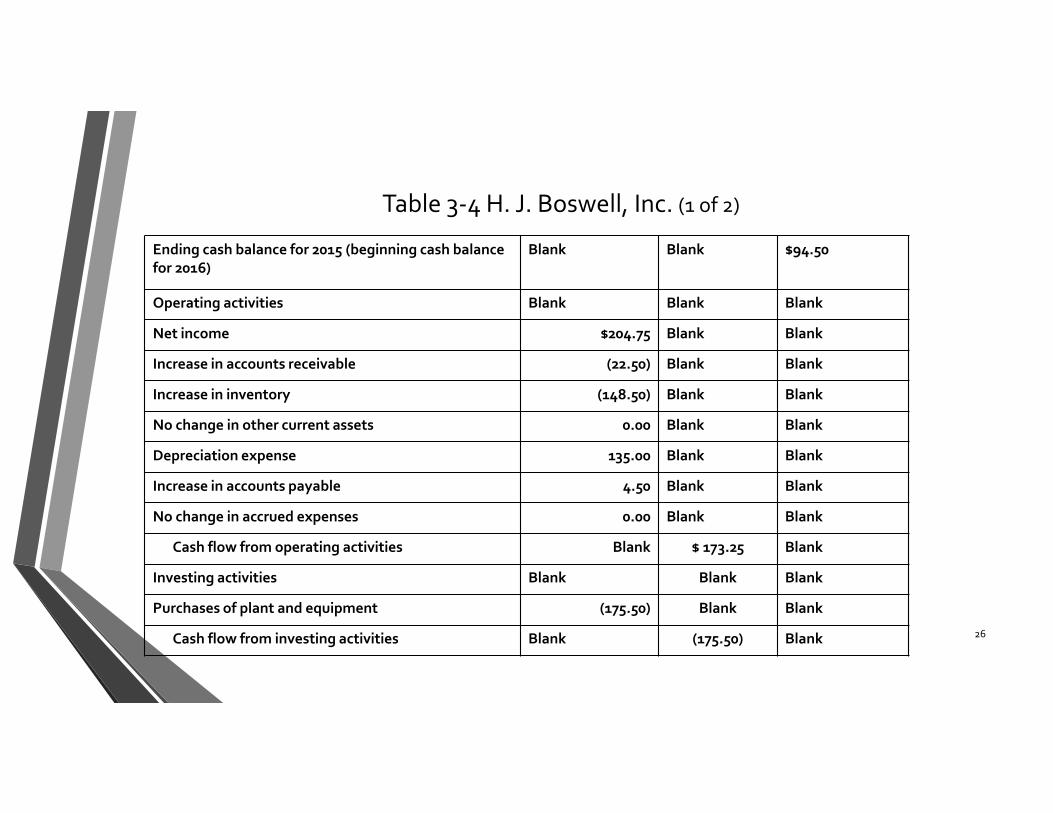
Table 3‐4 H. J. Boswell, Inc. (1 of 2)
26
Ending cash balance for 2015 (beginning cash balance for 2016)
Blank Blank $94.50
Operating activities Blank Blank Blank
Net income $204.75 Blank Blank
Increase in accounts receivable (22.50) Blank Blank
Increase in inventory (148.50) Blank Blank
No change in other current assets 0.00 Blank Blank
Depreciation expense 135.00 Blank Blank
Increase in accounts payable 4.50 Blank Blank
No change in accrued expenses 0.00 Blank Blank
Cash flow from operating activities Blank $ 173.25 Blank
Investing activities Blank Blank Blank
Purchases of plant and equipment (175.50) Blank Blank
Cash flow from investing activities Blank (175.50) Blank
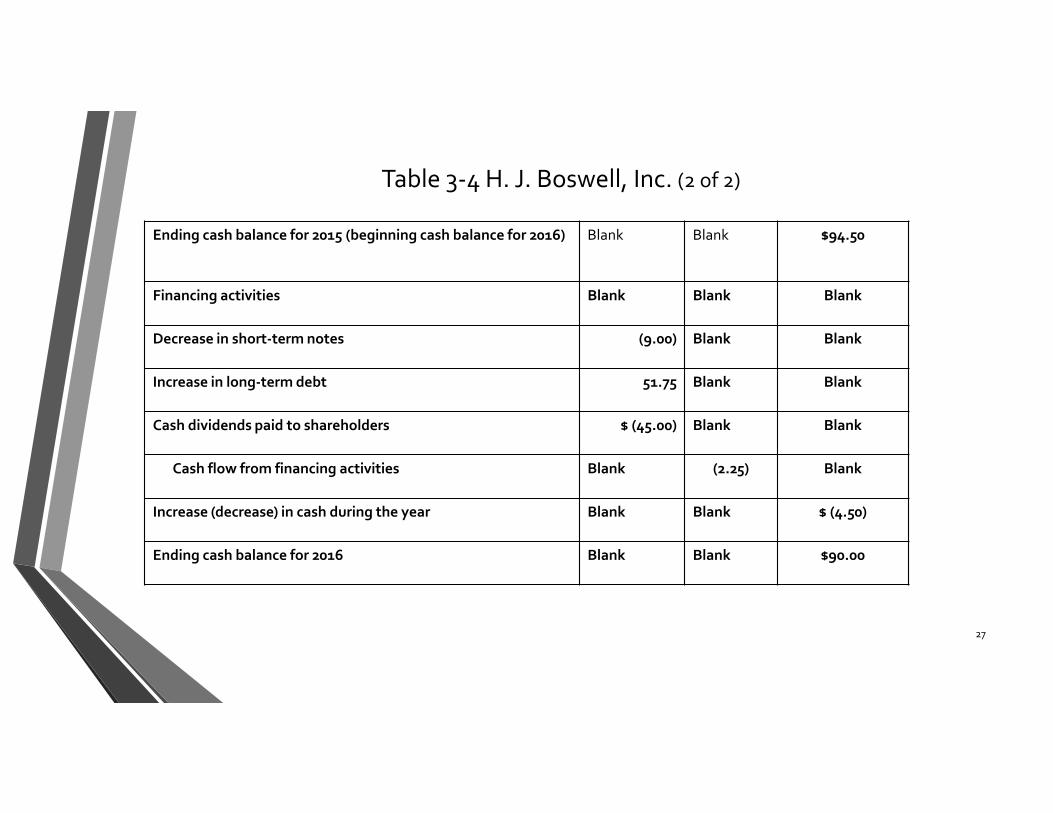
Table 3‐4 H. J. Boswell, Inc. (2 of 2)
27
Ending cash balance for 2015 (beginning cash balance for 2016) Blank Blank $94.50
Financing activities Blank Blank Blank
Decrease in short‐term notes (9.00) Blank Blank
Increase in long‐term debt 51.75 Blank Blank
Cash dividends paid to shareholders $ (45.00) Blank Blank
Cash flow from financing activities Blank (2.25) Blank
Increase (decrease) in cash during the year Blank Blank $ (4.50)
Ending cash balance for 2016 Blank Blank $90.00
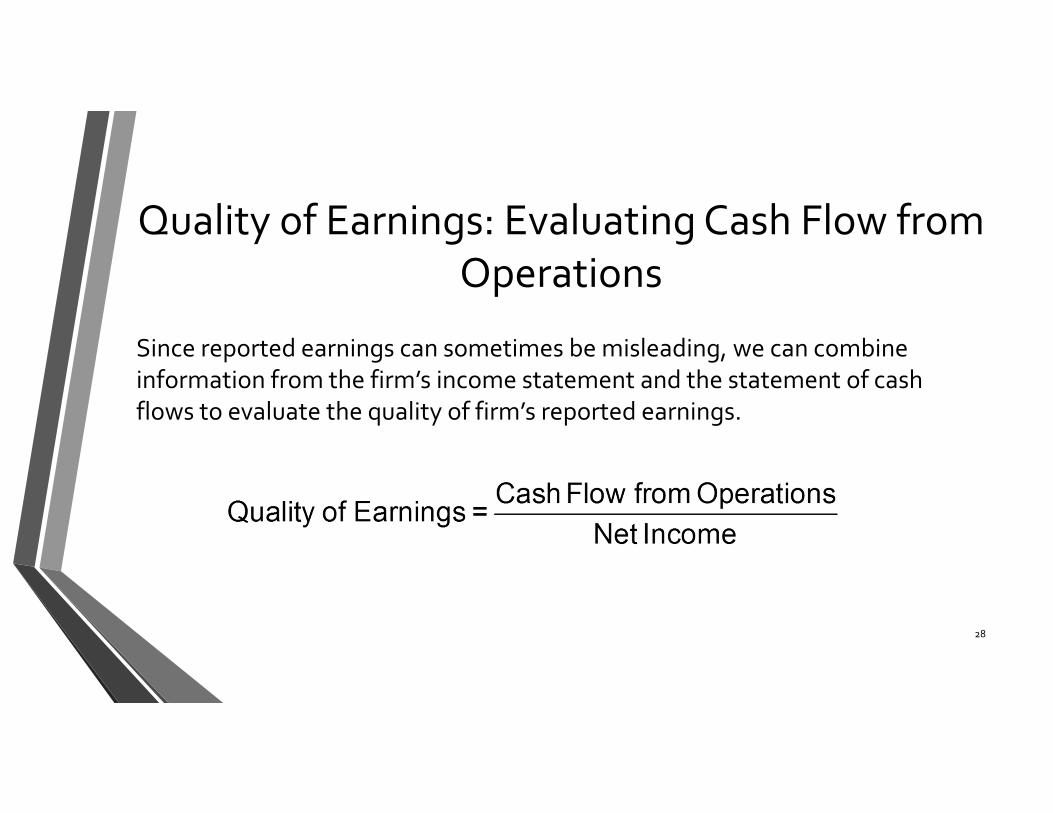
Quality of Earnings: Evaluating Cash Flow from Operations
Since reported earnings can sometimes be misleading, we can combine information from the firm’s income statement and the statement of cash flows to evaluate the quality of firm’s reported earnings.
28
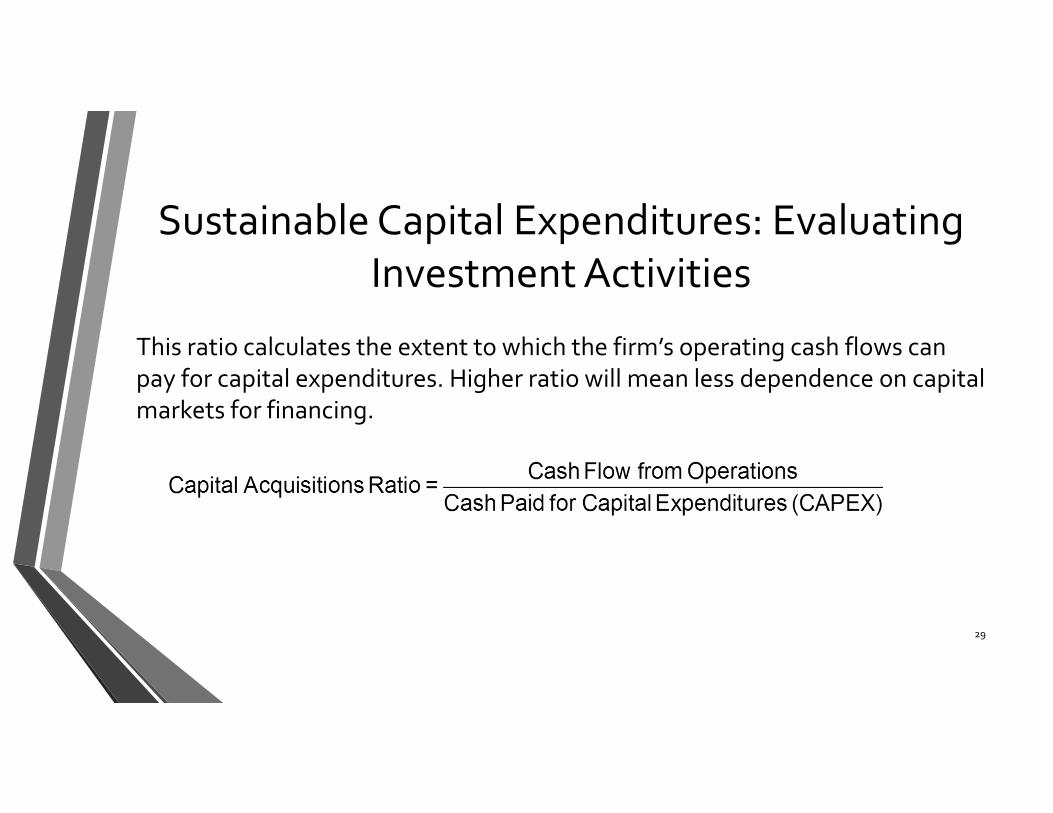
Sustainable Capital Expenditures: Evaluating Investment Activities
This ratio calculates the extent to which the firm’s operating cash flows can pay for capital expenditures. Higher ratio will mean less dependence on capital markets for financing.
29


