CS110 – Personal Computing 1 FORMULAS CS110 Personal Computing Understanding formulas The trainings are starting to introduce basic formulas and functions We’re also starting to look at the statistical analysis part of the class We noticed about ½ the class struggled with these basic formulas So… Percentages If a city has 20% growth per year: How do we calculate the estimated population? By multiplying 20% times the current number And add that to the current number 2013 has 4000 people For 2014, that number is equal to : Calculate the increase (4000 * 20%) = 800 Add that to 4000 = 4800
Transcript
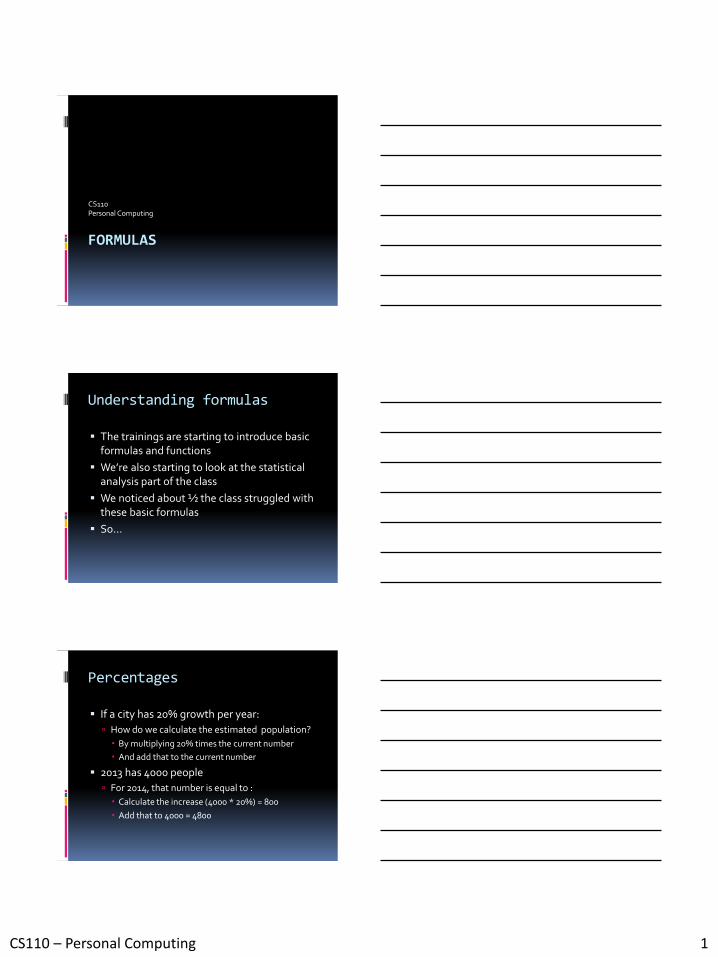
CS110 – Personal Computing 1
FORMULAS
CS110Personal Computing
Understanding formulas
The trainings are starting to introduce basic formulas and functions
We’re also starting to look at the statistical analysis part of the class
We noticed about ½ the class struggled with these basic formulas
So…
Percentages
If a city has 20% growth per year:
How do we calculate the estimated population?
By multiplying 20% times the current number
And add that to the current number
2013 has 4000 people
For 2014, that number is equal to :
Calculate the increase (4000 * 20%) = 800
Add that to 4000 = 4800
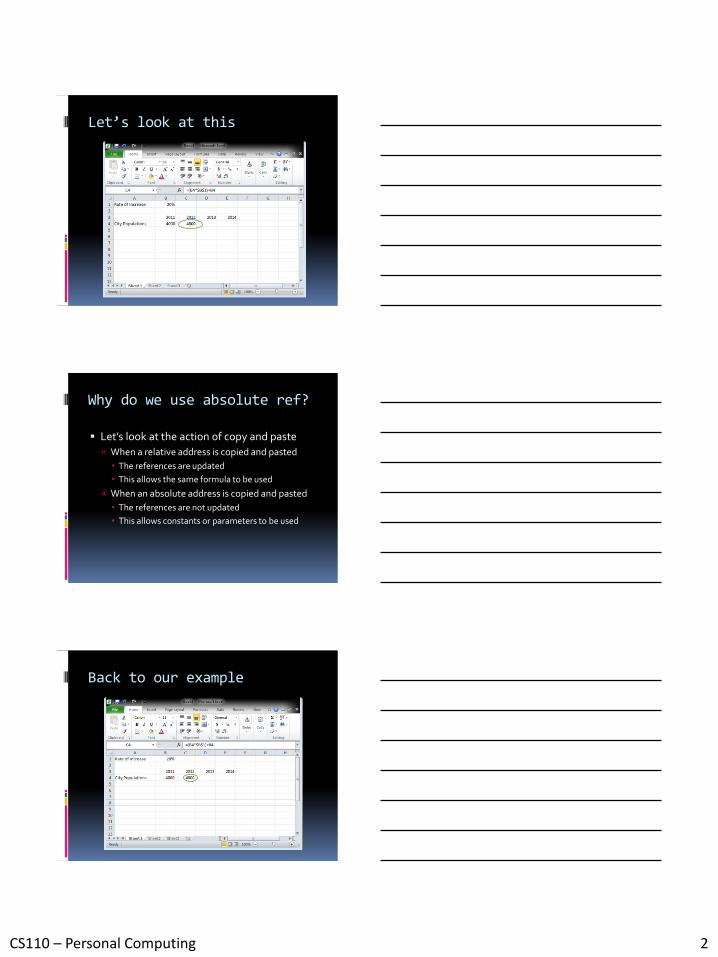
CS110 – Personal Computing 2
Let’s look at this
Why do we use absolute ref?
Let’s look at the action of copy and paste
When a relative address is copied and pasted
The references are updated
This allows the same formula to be used
When an absolute address is copied and pasted
The references are not updated
This allows constants or parameters to be used
Back to our example
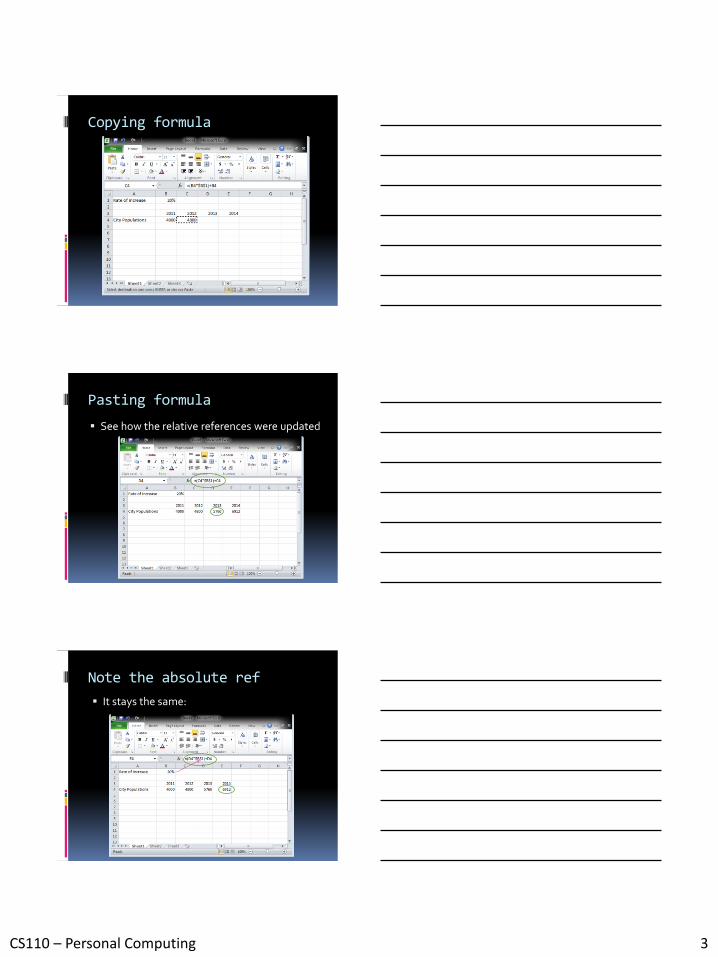
CS110 – Personal Computing 3
Copying formula
Pasting formula
See how the relative references were updated
Note the absolute ref
It stays the same:
CS110 – Personal Computing 4
Ratios
What is a ratio?
a ratio is a relationship between two numbers of the same kind
Usually expressed A to B or A:B
What does it mean?
The ratio of bananas to apples is 1:4
The ratio of children to couples is 2.3:1
How do we compute ratios?
If we want to know the ratio of cars to people
We know there are 400 cars
We know there are 200 people
What is the ratio?
400:200
Can this be simplified?
Yes, by dividing the first by the second
Gives us 2:1
What do we use ratios for?
To compare two quantities
To simplify them to understandable numbers
The ratio of children to couples is :
57,500:25,000 or
2.3:1
Which is easier to understand
To extrapolate future numbers
If the ratio of bananas to apples in a delivery is 4:1
A delivery has 50 apples
CS110 – Personal Computing 5
Averages
How do we determine averages?
The sum of the values divided by the number of the values
So if :
Bob as 4 bananas
Terri has 2 bananas
Sammy has 3 bananas
What is the average number of bananas each of them has?
What do we use averages for?
To extrapolate numbers
If each person need an average of 2 liters /day, how much water will 10,000 people need?
The more samples there are, the more reliable the average
Bob – 5 liters
Sammy – 1 liters
Average is 3 liters
Small numbers have trouble with outliers
What is an outlier?
An observation that is numerically distant from the rest of the data
What causes outliers?
Error in measurement, outside influences
Example – if my study is tracking time to compute an algorithm, an outlier could be caused by someone else on the computer using the computer cycles or memory
CS110 – Personal Computing 6
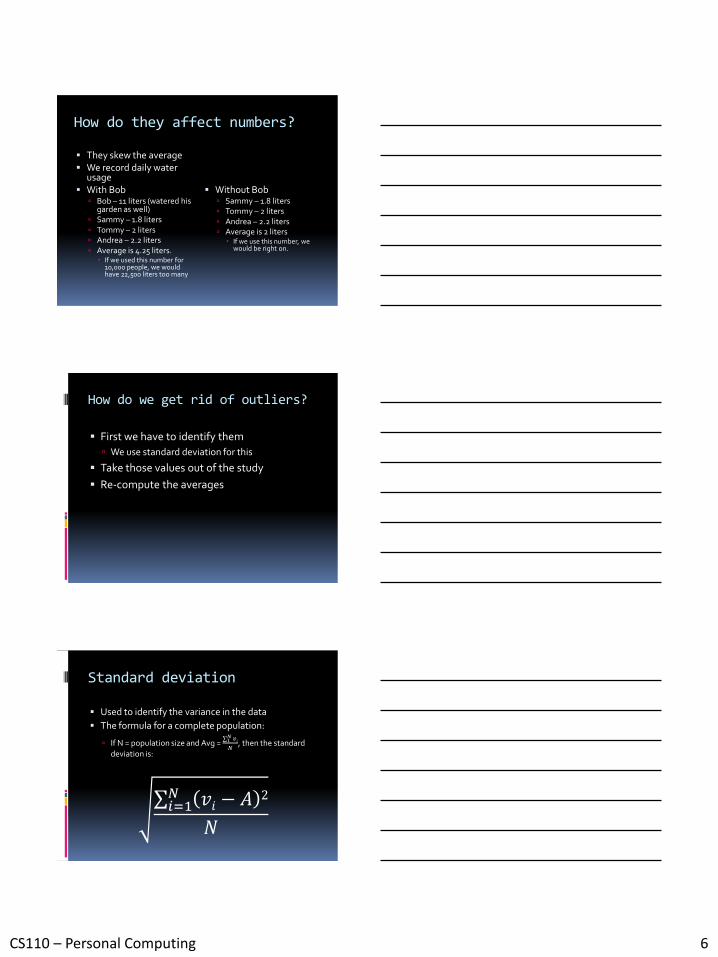
How do they affect numbers?
They skew the average We record daily water
usage With Bob
Bob – 11 liters (watered his garden as well)
Sammy – 1.8 liters Tommy – 2 liters Andrea – 2.2 liters Average is 4.25 liters.
If we used this number for 10,000 people, we would have 22,500 liters too many
Without Bob Sammy – 1.8 liters Tommy – 2 liters Andrea – 2.2 liters Average is 2 liters
If we use this number, we would be right on.
How do we get rid of outliers?
First we have to identify them
We use standard deviation for this
Take those values out of the study
Re-compute the averages
Standard deviation
Used to identify the variance in the data
The formula for a complete population:
If N = population size and Avg = 1𝑁 𝑣𝑖𝑁
, then the standard
deviation is:
𝑖=1𝑁 𝑣𝑖 − 𝐴
2
𝑁
CS110 – Personal Computing 7
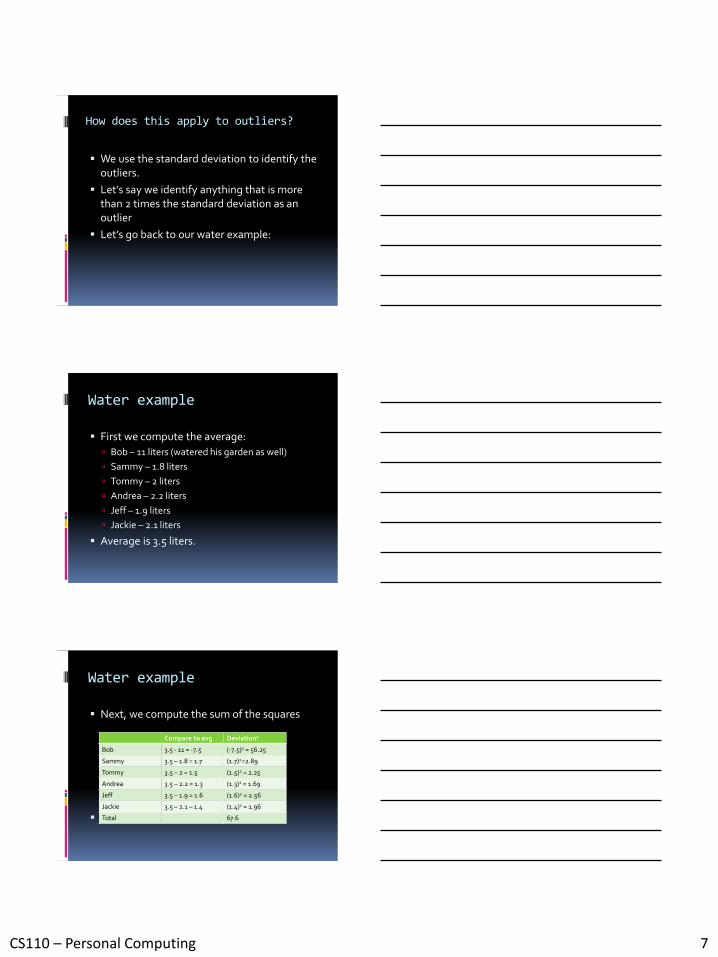
How does this apply to outliers?
We use the standard deviation to identify the outliers.
Let’s say we identify anything that is more than 2 times the standard deviation as an outlier
Let’s go back to our water example:
Water example
First we compute the average:
Bob – 11 liters (watered his garden as well)
Sammy – 1.8 liters
Tommy – 2 liters
Andrea – 2.2 liters
Jeff – 1.9 liters
Jackie – 2.1 liters
Average is 3.5 liters.
Water example
Next, we compute the sum of the squares
So Standard Deviation = 50.64 4
Compare to avg Deviation2
Bob 3.5 - 11 = -7.5 (-7.5)2 = 56.25
Sammy 3.5 – 1.8 = 1.7 (1.7)2=2.89
Tommy 3.5 – 2 = 1.5 (1.5)2 = 2.25
Andrea 3.5 – 2.2 = 1.3 (1.3)2 = 1.69
Jeff 3.5 – 1.9 = 1.6 (1.6)2 = 2.56
Jackie 3.5 – 2.1 – 1.4 (1.4)2 = 1.96
Total 67.6
CS110 – Personal Computing 8
Finishing standard deviation
With the sum of the squares – 67.6
67.6
6= 3.35
So our standard deviation is 3.35
Identifying the outliers
Standard deviation
3.35
2x standard deviation
6.7
Average = 3.5
Throw out anything
Over 10.2
Under -3.2
Value
Bob 11
Sammy 1.8
Tommy 2
Andrea 2.2
Jeff 1.9
Jackie 2.1
Value with Bob isgreater than 10.2
Re-compute the average
Value
Sammy 1.8
Tommy 2
Andrea 2.2
Jeff 1.9
Jackie 2.1
CS110 – Personal Computing 9
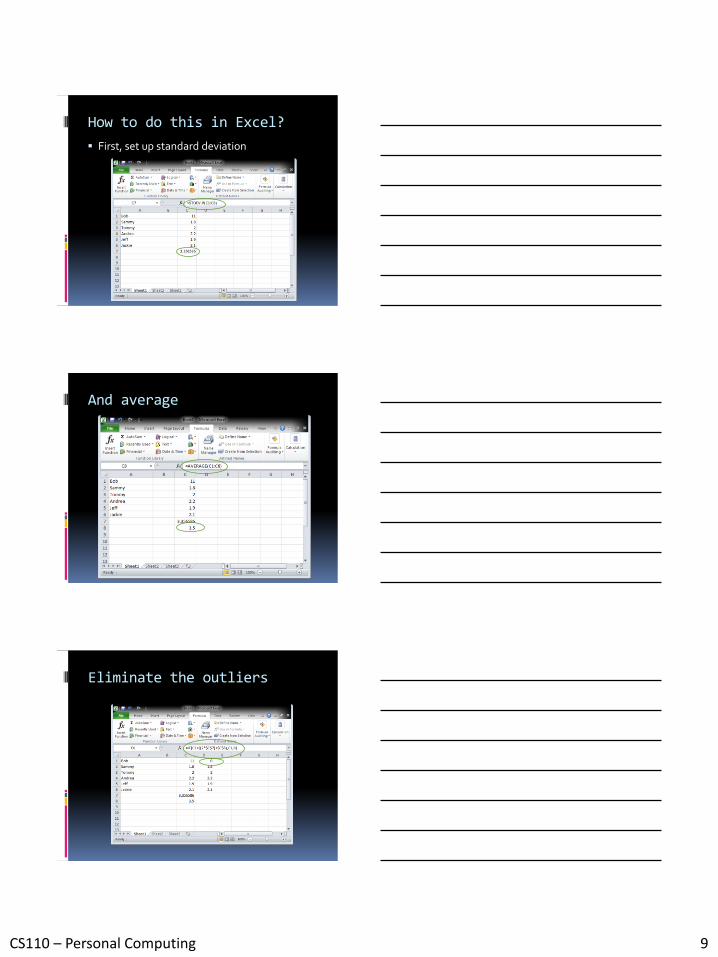
How to do this in Excel?
First, set up standard deviation
And average
Eliminate the outliers
CS110 – Personal Computing 10
And now compute new average
Confidence interval
Given in a range and a percentage.
Says that with the percentage given, the actual value will fall within the range
I.E. given:
A normal distribution
a 95% confidence interval
A range between 9 and 11
Says that at least 95% of the time, the value calculated will fall between 9 and 11.
What is a normal distribution?
CS110 – Personal Computing 11
How is this helpful?
When you calculate averages, you assign them a confidence interval and a range.
This tells your readers how reliable your data is
Calculated by:
Assumes normal distribution
Standard deviation
Given a specific confidence level
Number of data point
Calculate in Excel
Improve the interval
By increasing the number of samples
CS110 – Personal Computing 12
Improve the intervalDecrease the confidence level
Median
The numerical value separating the higher half of a sample, a population, or a probability distribution, from the lower half.
The median can be used as a measure of location when a distribution is skewed
when end-values are not known
when one requires reduced importance to be attached to outliers
A disadvantage of the median is the difficulty of handling it theoretically
Median
Given the following sequence, what would be the median of the values:
1,2,2,3,3,3,4,5,5,6,6,6,14
CS110 – Personal Computing 13
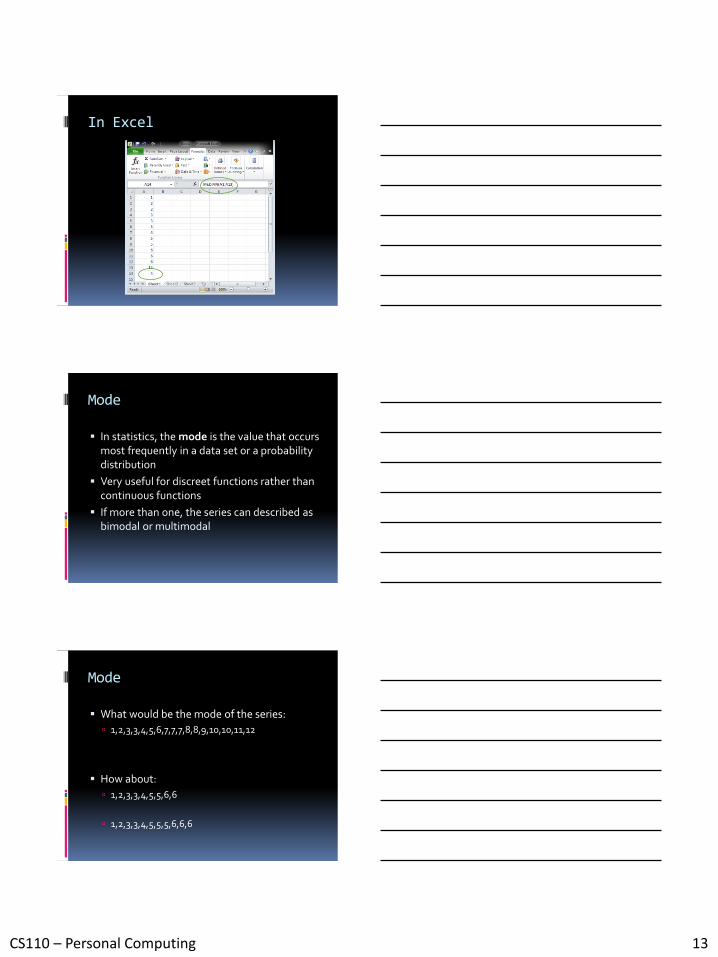
In Excel
Mode
In statistics, the mode is the value that occurs most frequently in a data set or a probability distribution
Very useful for discreet functions rather than continuous functions
If more than one, the series can described as bimodal or multimodal