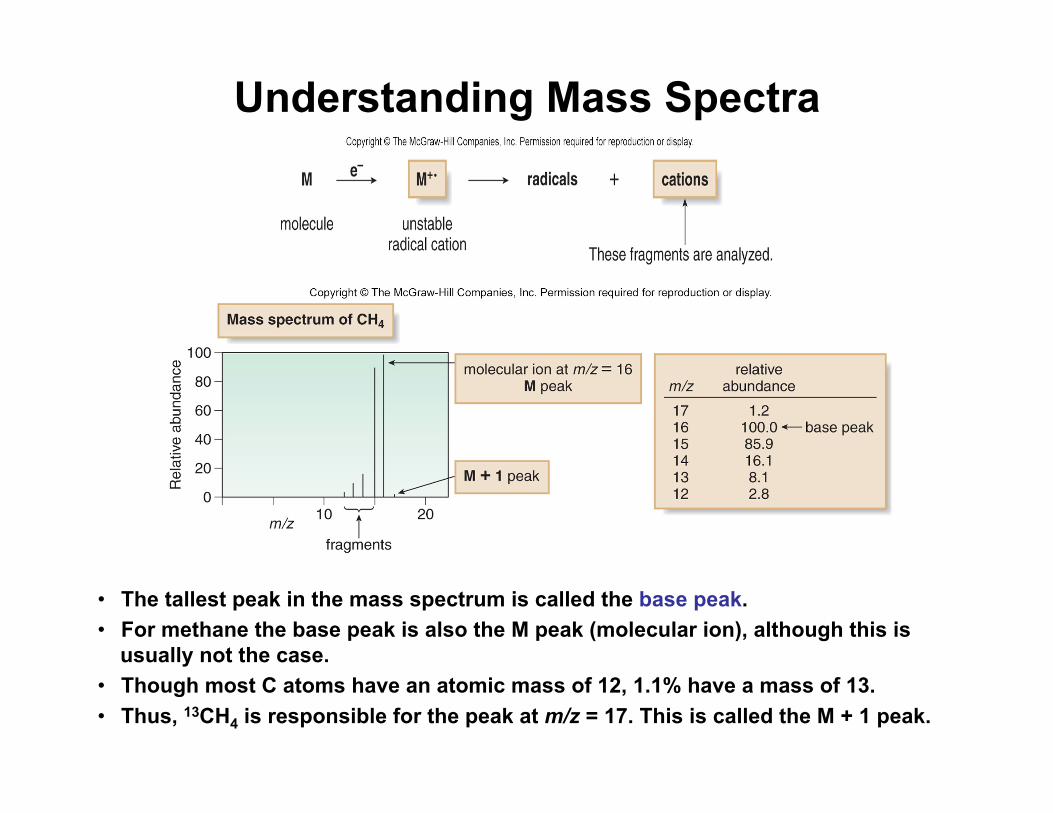
• The tallest peak in the mass spectrum is called the base peak. • For methane the base peak is also the M peak (molecular ion), although this is usually not the case. • Though most C atoms have an atomic mass of 12, 1.1% have a mass of 13. • Thus, 13 CH 4 is responsible for the peak at m/z = 17. This is called the M + 1 peak. Understanding Mass Spectra
Transcript
• The tallest peak in the mass spectrum is called the base peak. • For methane the base peak is also the M peak (molecular ion), although this is
usually not the case. • Though most C atoms have an atomic mass of 12, 1.1% have a mass of 13. • Thus, 13CH4 is responsible for the peak at m/z = 17. This is called the M + 1 peak.
Understanding Mass Spectra
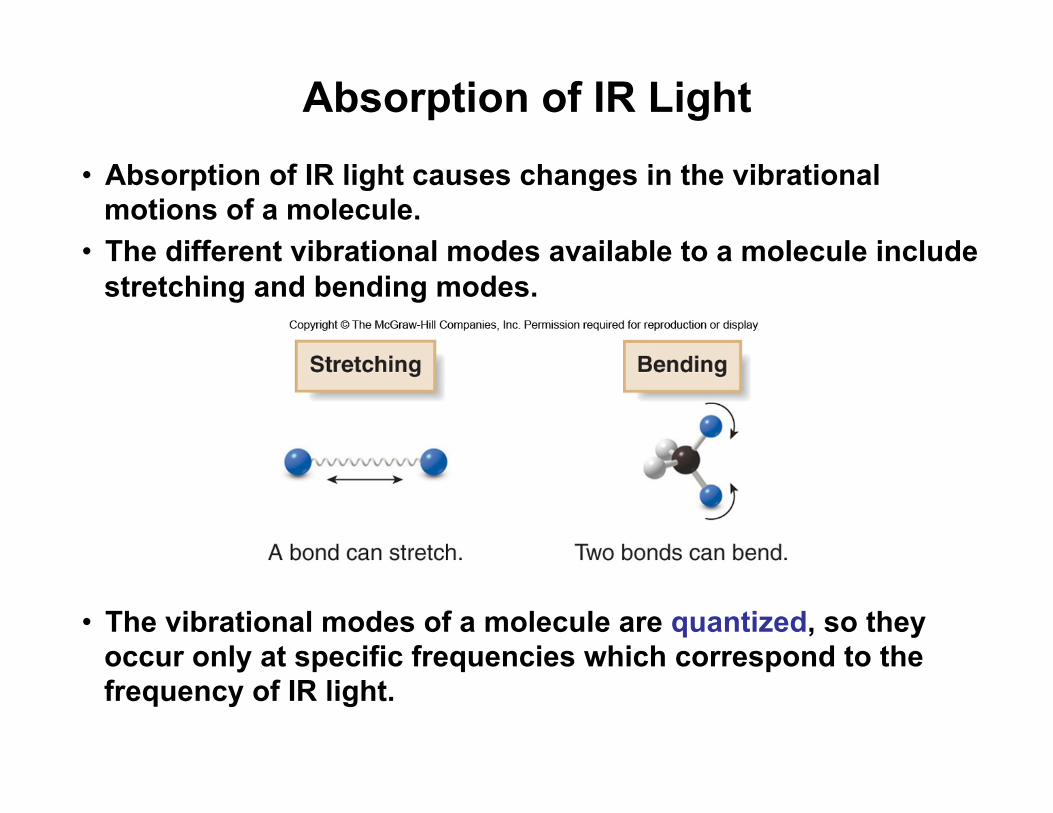
• Absorption of IR light causes changes in the vibrational motions of a molecule.
• The different vibrational modes available to a molecule include stretching and bending modes.
• The vibrational modes of a molecule are quantized, so they occur only at specific frequencies which correspond to the frequency of IR light.
Absorption of IR Light
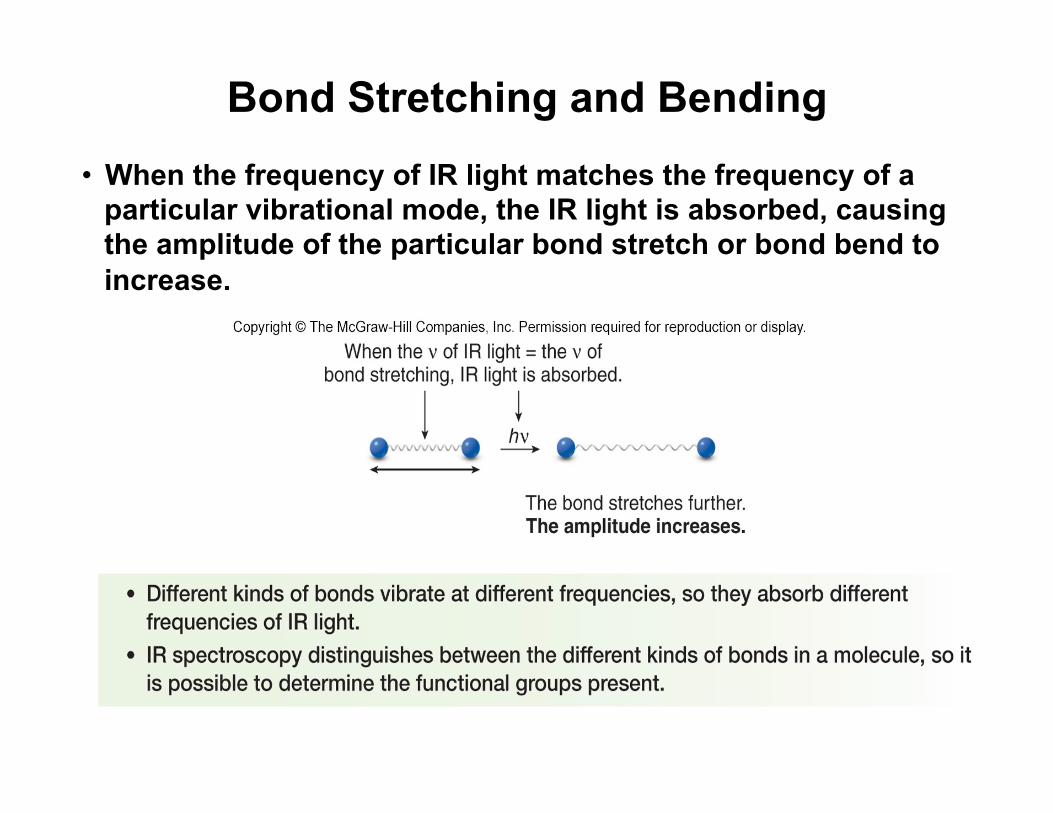
• When the frequency of IR light matches the frequency of a particular vibrational mode, the IR light is absorbed, causing the amplitude of the particular bond stretch or bond bend to increase.
Bond Stretching and Bending
4
• In an IR spectrometer, light passes through a sample. • Frequencies that match the vibrational frequencies are absorbed,
and the remaining light is transmitted to a detector. • An IR spectrum is a plot of the amount of transmitted light versus
its wavenumber. • Most bonds in organic molecules absorb in the region of 4000 cm−1
to 400 cm−1.
Characteristics of an IR Spectrum
5
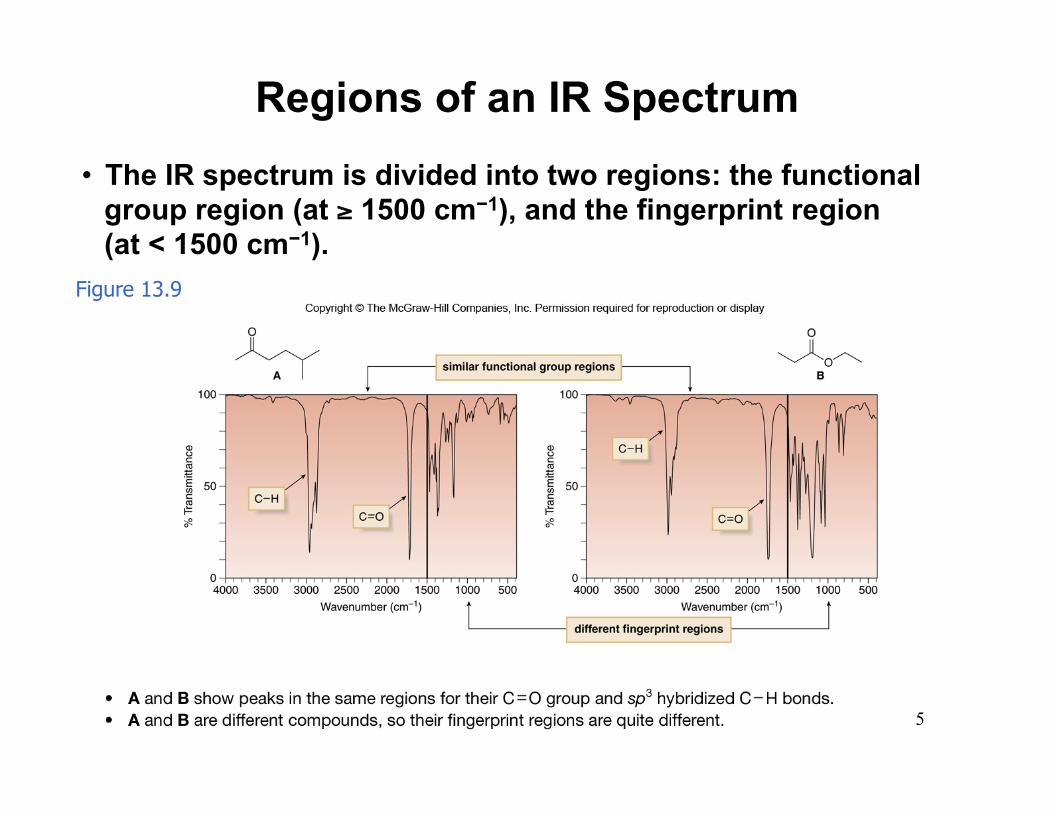
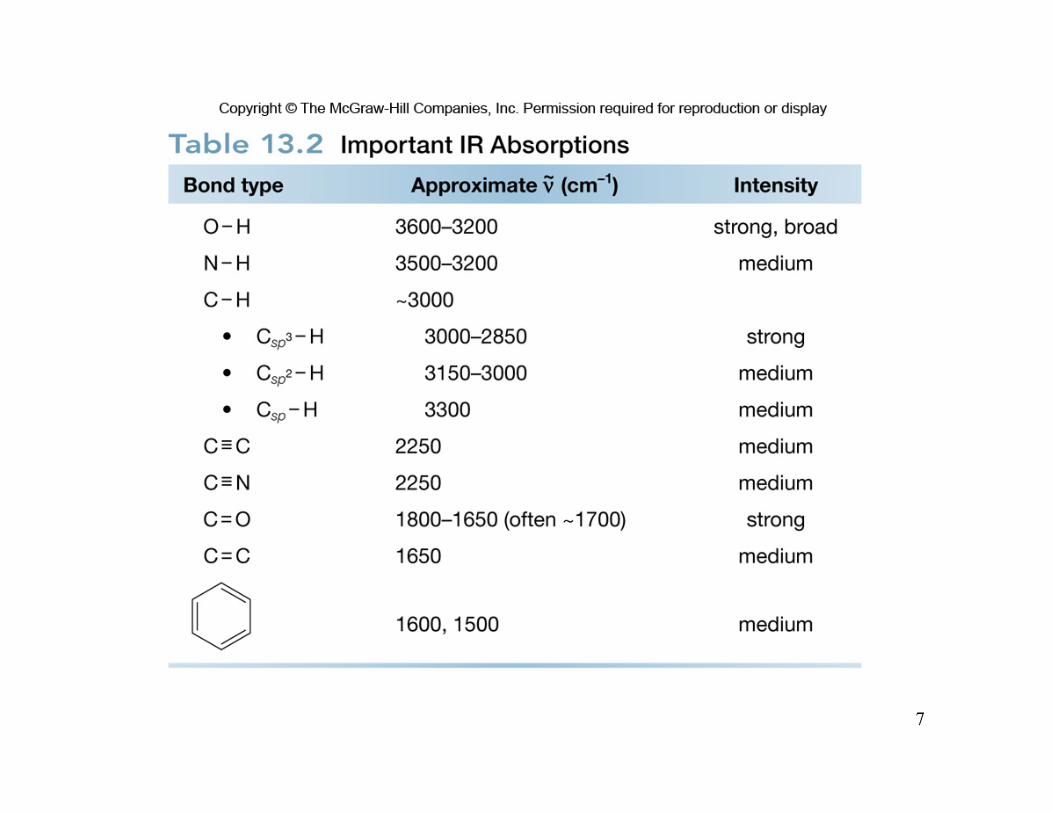
• The IR spectrum is divided into two regions: the functional group region (at ≥ 1500 cm−1), and the fingerprint region (at < 1500 cm−1).
Figure 13.9
Regions of an IR Spectrum
6
• Bonds absorb in four predictable regions of an IR spectrum.
Figure 13.11
Four Regions of an IR Spectrum
7
8
• The OH group of the alcohol shows a strong absorption at 3600-3200 cm−1.
• The peak at ~ 3000 cm−1 is due to sp3 hybridized C−H bonds.
IR Spectrum of 2-Butanol
9
• The C=O group in the ketone shows a strong absorption at ~ 1700 cm−1.
• The peak at ~ 3000 cm-1 is due to sp3 hybridized C−H bonds.
IR Spectrum of 2-Butanone
10
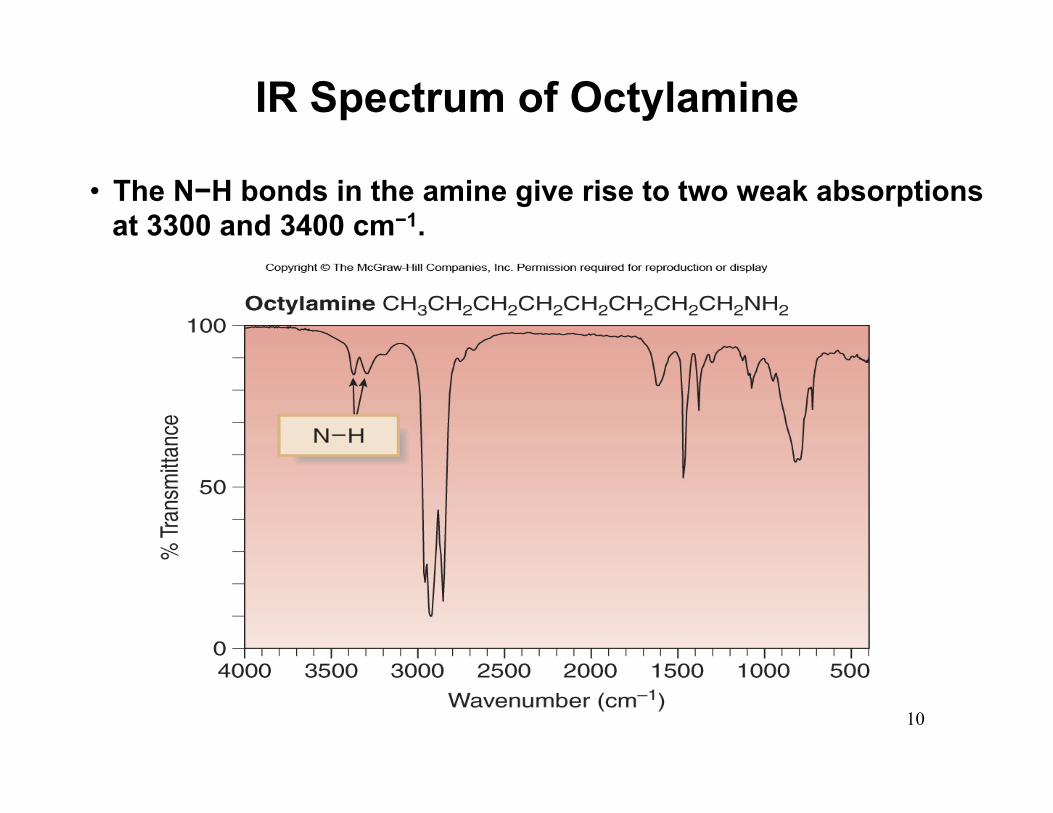
• The N−H bonds in the amine give rise to two weak absorptions at 3300 and 3400 cm−1.
IR Spectrum of Octylamine
11
• The amide exhibits absorptions above 1500 cm−1 for both its N−H and C=O groups: N−H (two peaks) at 3200 and 3400 cm−1; C=O at 1660 cm−1.
IR Spectrum of Propanamide
12
• The C≡N of the nitrile absorbs in the triple bond region at ~ 2250 cm−1.
IR Spectrum of Octanenitrile
13
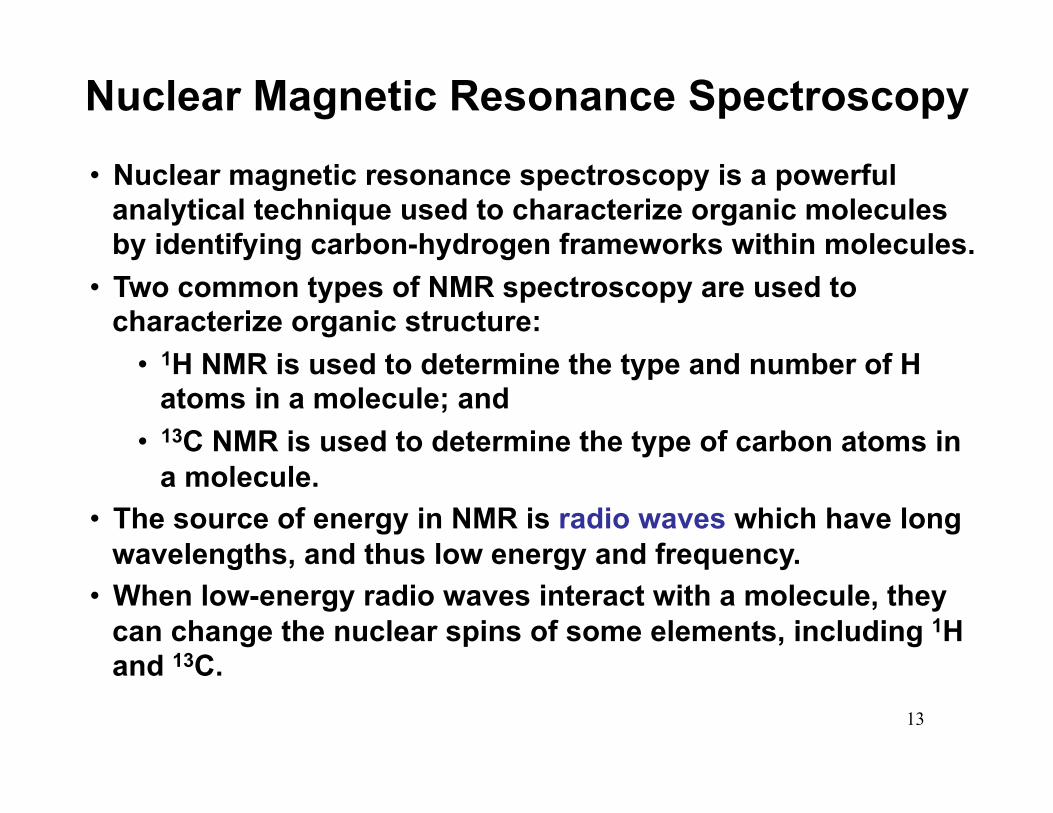
Nuclear Magnetic Resonance Spectroscopy
• Nuclear magnetic resonance spectroscopy is a powerful analytical technique used to characterize organic molecules by identifying carbon-hydrogen frameworks within molecules.
• Two common types of NMR spectroscopy are used to characterize organic structure:
• 1H NMR is used to determine the type and number of H atoms in a molecule; and
• 13C NMR is used to determine the type of carbon atoms in a molecule.
• The source of energy in NMR is radio waves which have long wavelengths, and thus low energy and frequency.
• When low-energy radio waves interact with a molecule, they can change the nuclear spins of some elements, including 1H and 13C.
14
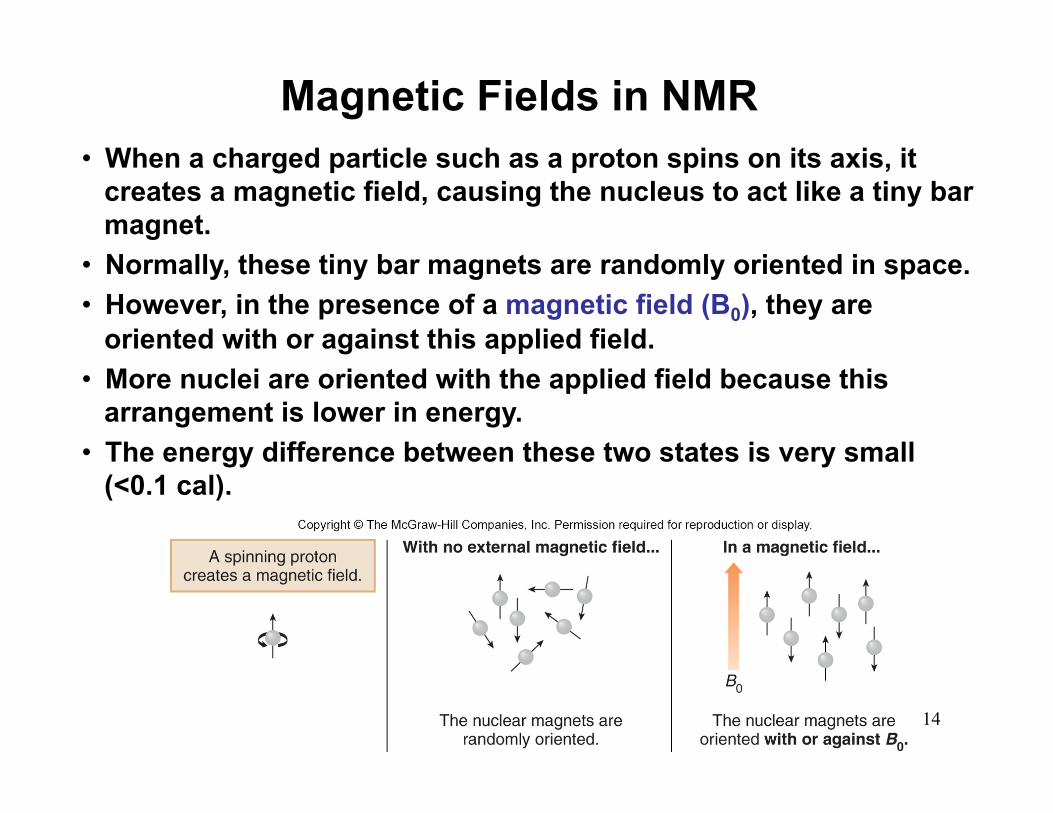
• When a charged particle such as a proton spins on its axis, it creates a magnetic field, causing the nucleus to act like a tiny bar magnet.
• Normally, these tiny bar magnets are randomly oriented in space. • However, in the presence of a magnetic field (B0), they are
oriented with or against this applied field. • More nuclei are oriented with the applied field because this
arrangement is lower in energy. • The energy difference between these two states is very small
(<0.1 cal).
Magnetic Fields in NMR
15
• The frequency at which a particular proton absorbs is determined by its electronic environment.
• Protons in different environments absorb at slightly different frequencies, so they are distinguishable by NMR.
• The size of the magnetic field generated by the electrons around a proton determines where it absorbs.
• Modern NMR spectrometers use a constant magnetic field strength B0, and then a narrow range of frequencies is applied to achieve the resonance of all protons.
• Only nuclei that contain odd mass numbers (such as 1H, 13C, 19F, and 31P) or odd atomic numbers (such as 2H and 14N) give rise to NMR signals.
Electron Environment
16
• An NMR spectrum is a plot of the intensity of a peak against its chemical shift, measured in parts per million (ppm).
1H NMR Spectra
17
• NMR absorptions generally appear as sharp peaks. • Most protons absorb between 0-10 ppm. • The terms “upfield” and “downfield” describe the relative
location of peaks. • Upfield means to the right (higher magnetic field). • Downfield means to the left (lower magnetic field).
• An external standard, (CH3)4Si (tetremethylsilane) is added to the sample tube prior to the NMR measurement.
• NMR absorptions are measured relative to the position of a reference peak at 0 ppm on the δ scale due to tetramethylsilane (TMS).
• TMS is a volatile inert compound that gives a single peak upfield from typical NMR absorptions.
Interpreting NMR Spectra
18 18
• Number of signals: indicates the number of different types of hydrogen in a molecule.
• Position of signals: indicates what types of hydrogen the molecule contains.
• Intensity of signals: indicates the relative amounts (how many) of each kind of hydrogen in the molecule.
• Spin-spin splitting of signals: gives further information of the neighboring environment for the various hydrogens in the molecule.
Structural Information from Features of a 1H NMR Spectrum
19
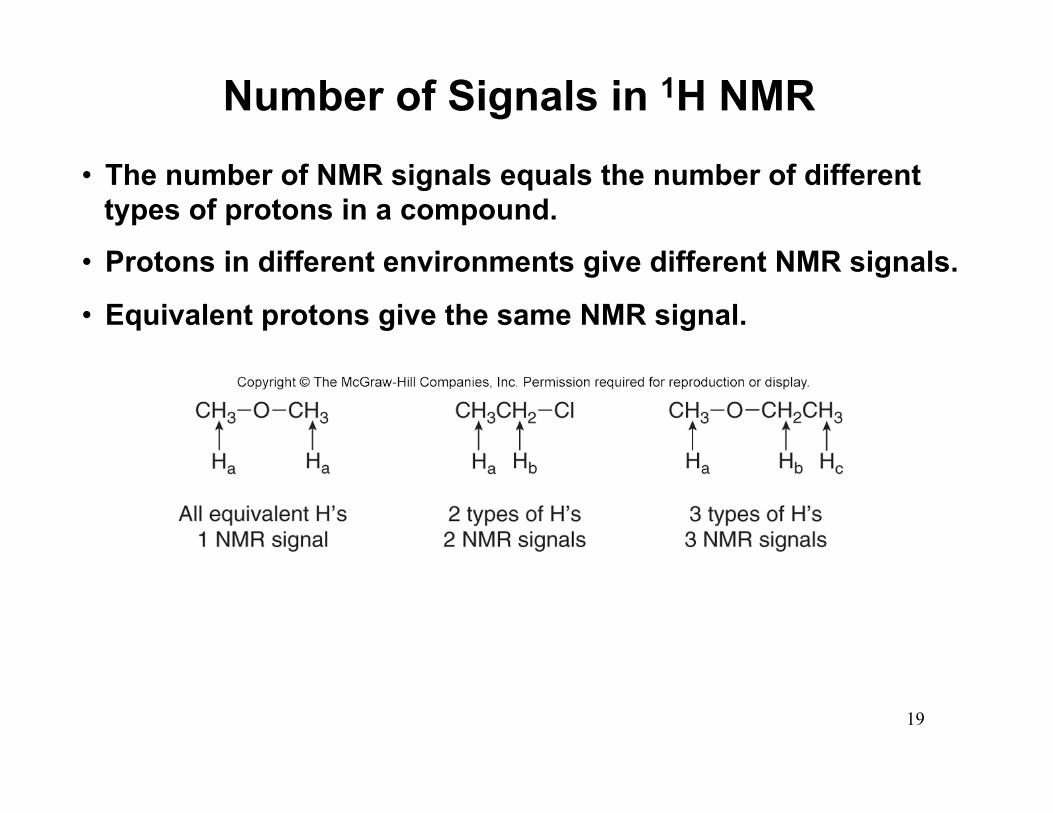
• The number of NMR signals equals the number of different types of protons in a compound.
• Protons in different environments give different NMR signals.
• Equivalent protons give the same NMR signal.
Number of Signals in 1H NMR
20
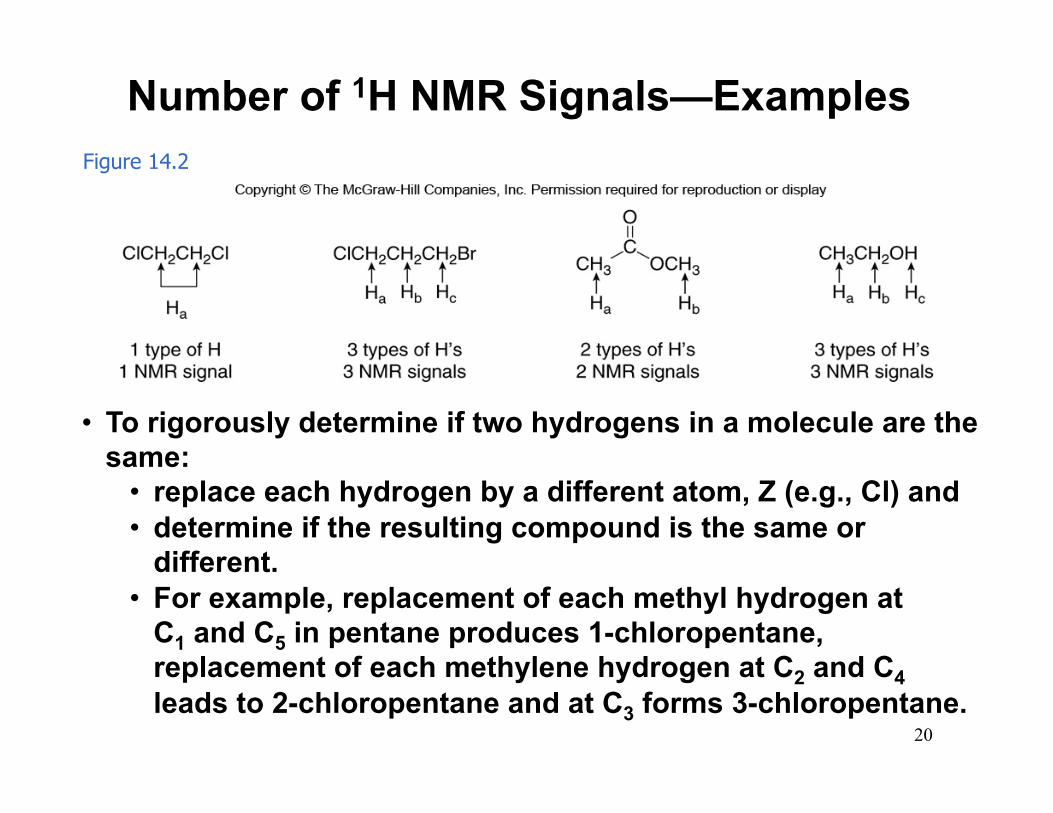
Figure 14.2
Number of 1H NMR Signals—Examples
• To rigorously determine if two hydrogens in a molecule are the same:
• replace each hydrogen by a different atom, Z (e.g., Cl) and • determine if the resulting compound is the same or
different. • For example, replacement of each methyl hydrogen at
C1 and C5 in pentane produces 1-chloropentane, replacement of each methylene hydrogen at C2 and C4 leads to 2-chloropentane and at C3 forms 3-chloropentane.
21
Shielding and Signal Position
22
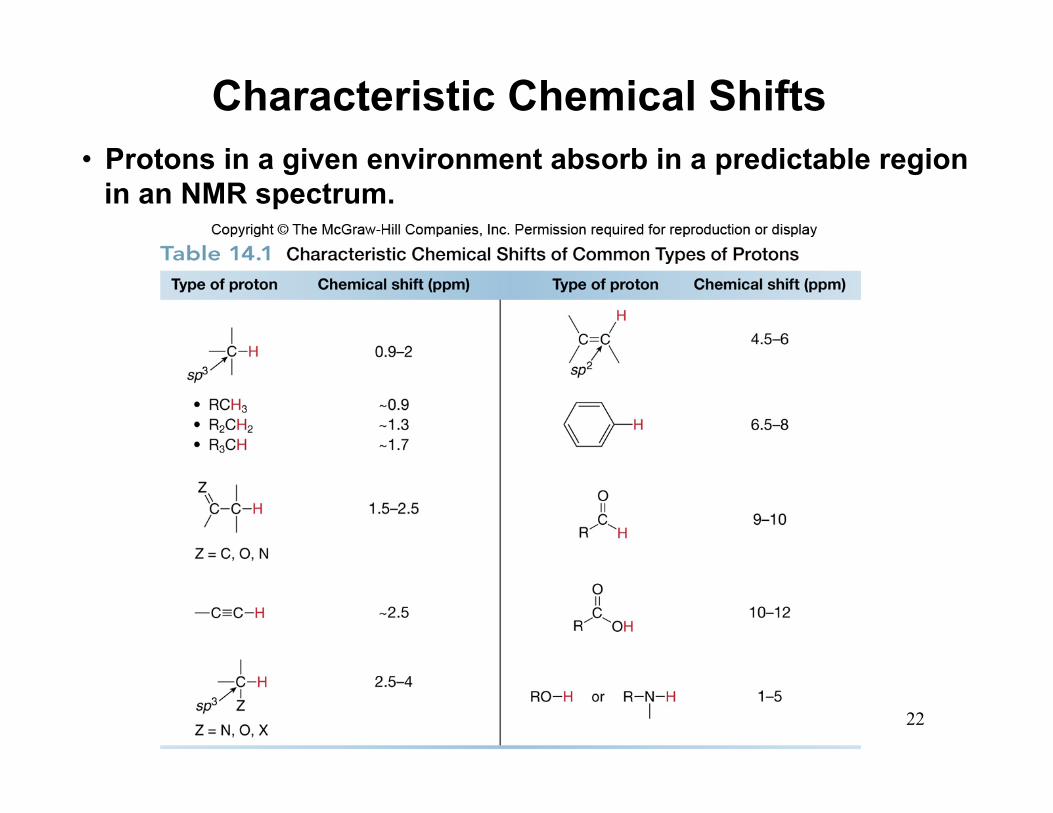
• Protons in a given environment absorb in a predictable region in an NMR spectrum.
Characteristic Chemical Shifts
23
Summary of π Electron and Chemical Shift
24
Figure 14.5
Regions in the 1H NMR Spectrum
25
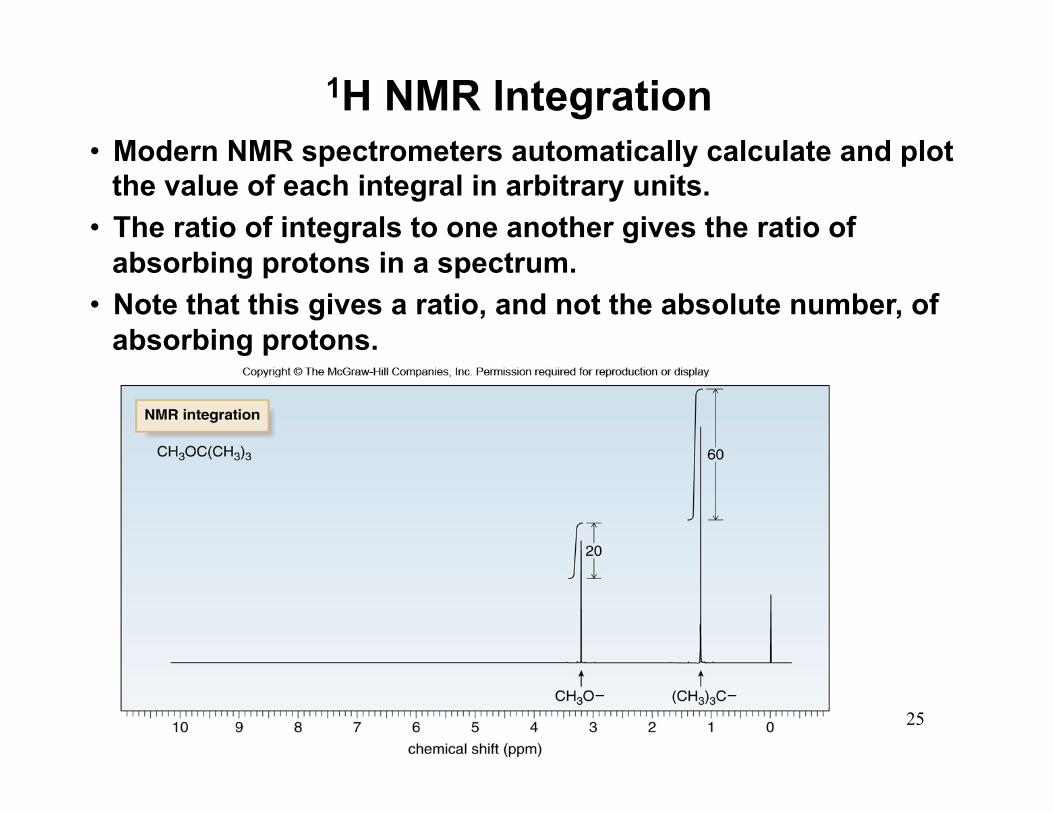
1H NMR Integration • Modern NMR spectrometers automatically calculate and plot
the value of each integral in arbitrary units. • The ratio of integrals to one another gives the ratio of
absorbing protons in a spectrum. • Note that this gives a ratio, and not the absolute number, of
absorbing protons.
26
1H NMR—Spin-Spin Splitting
• The spectra up to this point have been limited to single absorptions called singlets.
• Often signals for different protons are split into more than one peak.
27
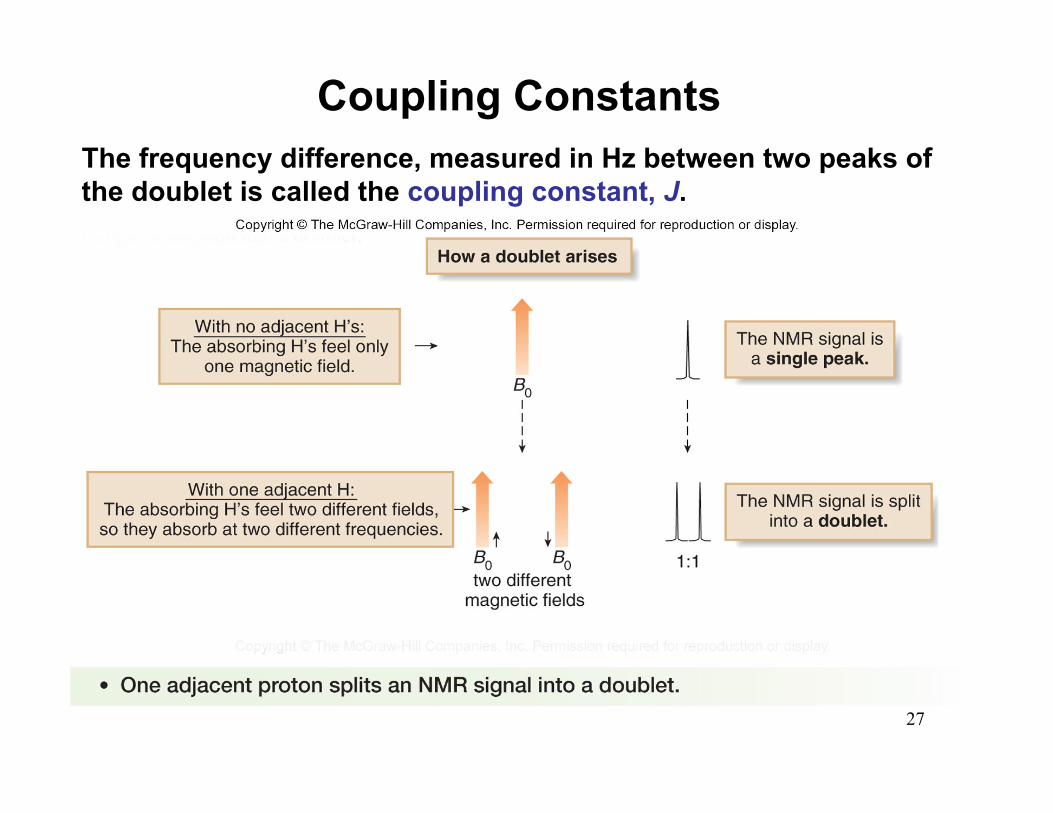
The frequency difference, measured in Hz between two peaks of the doublet is called the coupling constant, J.
Coupling Constants
28
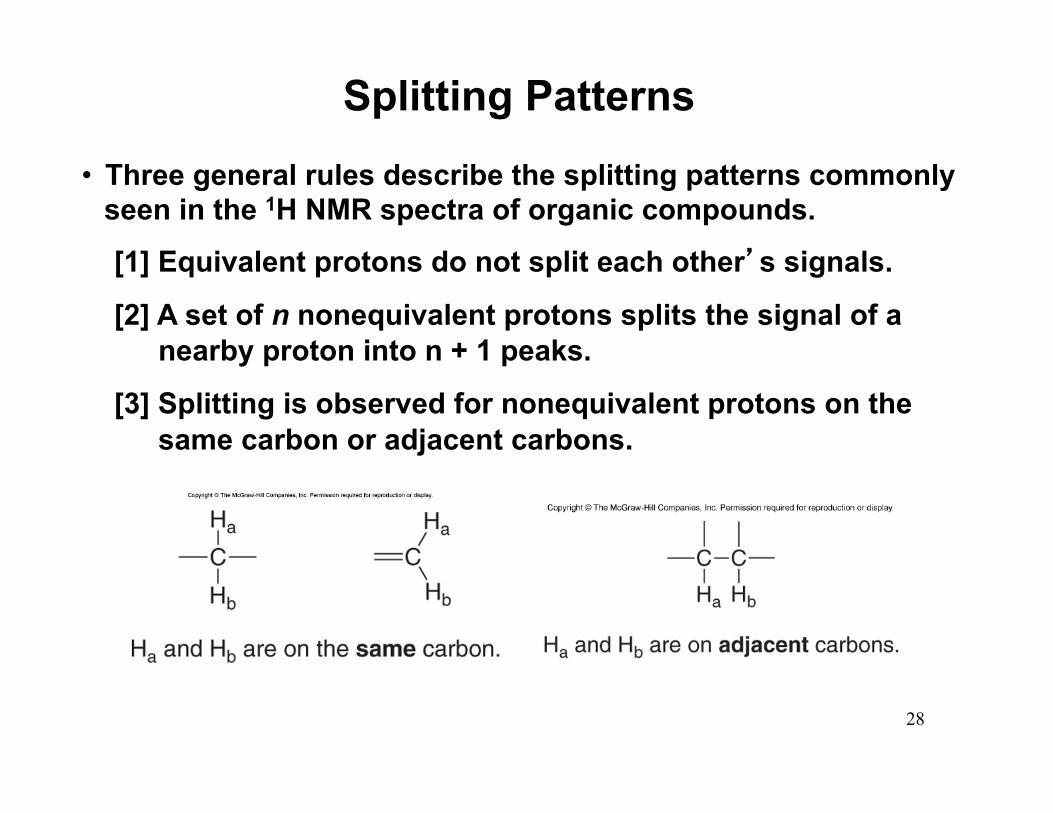
• Three general rules describe the splitting patterns commonly seen in the 1H NMR spectra of organic compounds.
[1] Equivalent protons do not split each other’s signals.
[2] A set of n nonequivalent protons splits the signal of a nearby proton into n + 1 peaks.
[3] Splitting is observed for nonequivalent protons on the same carbon or adjacent carbons.
Splitting Patterns
29
Splitting is not generally observed between protons separated by more than three σ bonds.
Proximity and Splitting
30
Figure 14.6
1H NMR of 2-Bromopropane
• The 6 Ha protons are split by the one Hb proton to give a doublet. • The Hb proton is split by 6 equivalent Ha protons to yield a septet.
31
• Since Ha and Hc are not equivalent to each other, we cannot always add them together and use the n + 1 rule.
• However, since the coupling constants, Jab and Jbc, are very similar, the signal for Hb is a sextet (follows the n + 1 rule).
Figure 14.8
1H NMR of 1-Bromopropane
32
• Under usual conditions, an OH proton does not split the NMR signal of adjacent protons.
• The signal due to an OH proton is not split by adjacent protons.
Figure 14.12
1H NMR of OH Protons
33
• Benzene has six equivalent deshielded protons and exhibits a single peak in its 1H NMR spectrum at 7.27 ppm.
• Monosubstituted benzenes contain five deshielded protons that are no longer equivalent, and the appearance of these signals is highly variable, depending on the identity of Z.
Figure 14.13
Protons on Benzene Rings
34
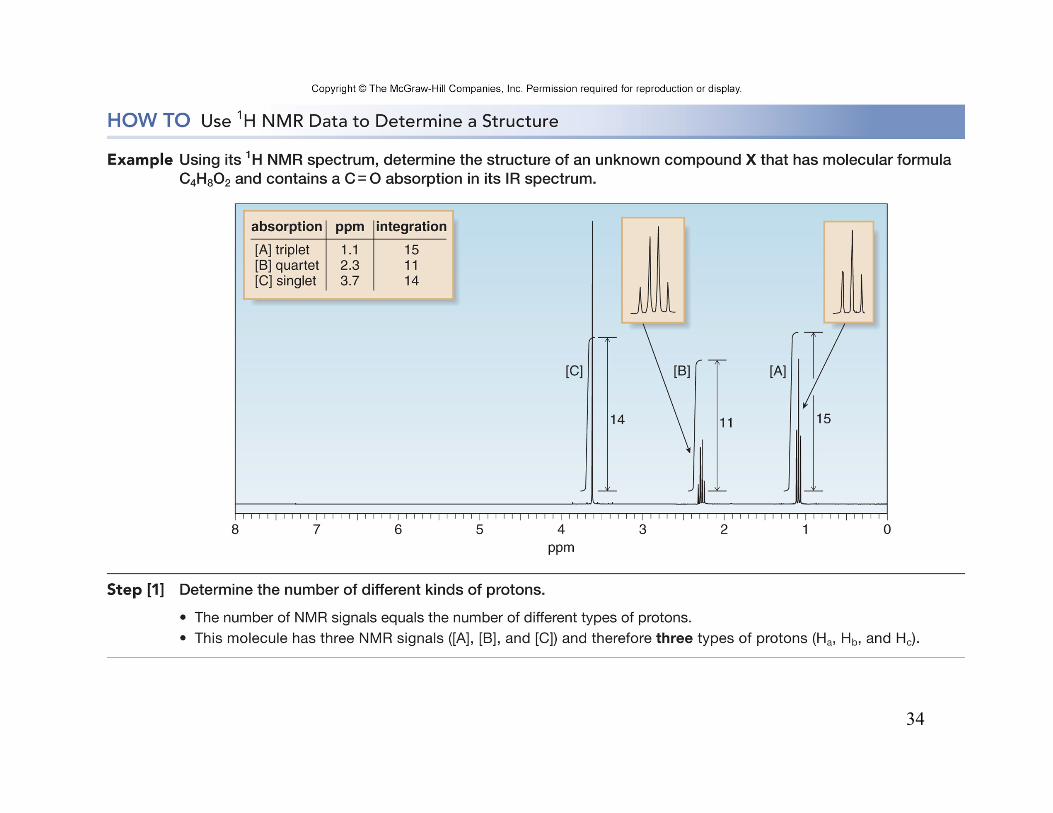
35
1H NMR—Structure Determination, continued
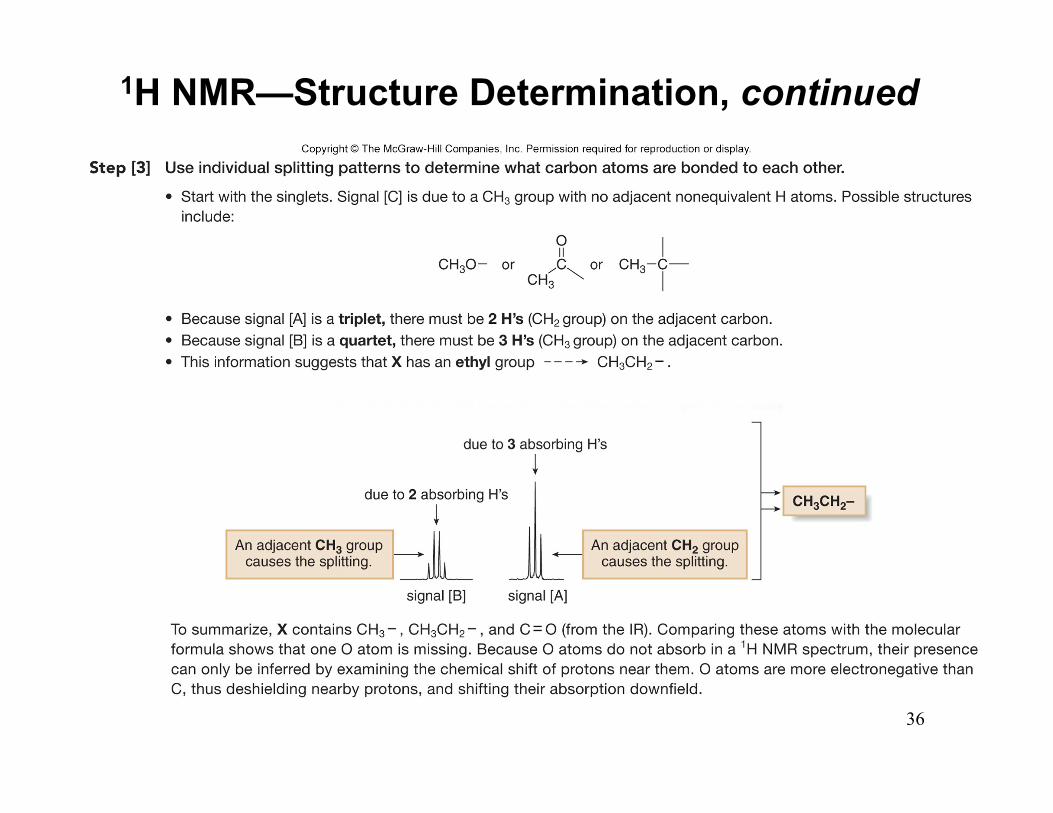
36
1H NMR—Structure Determination, continued
37
1H NMR—Structure Determination, continued
38
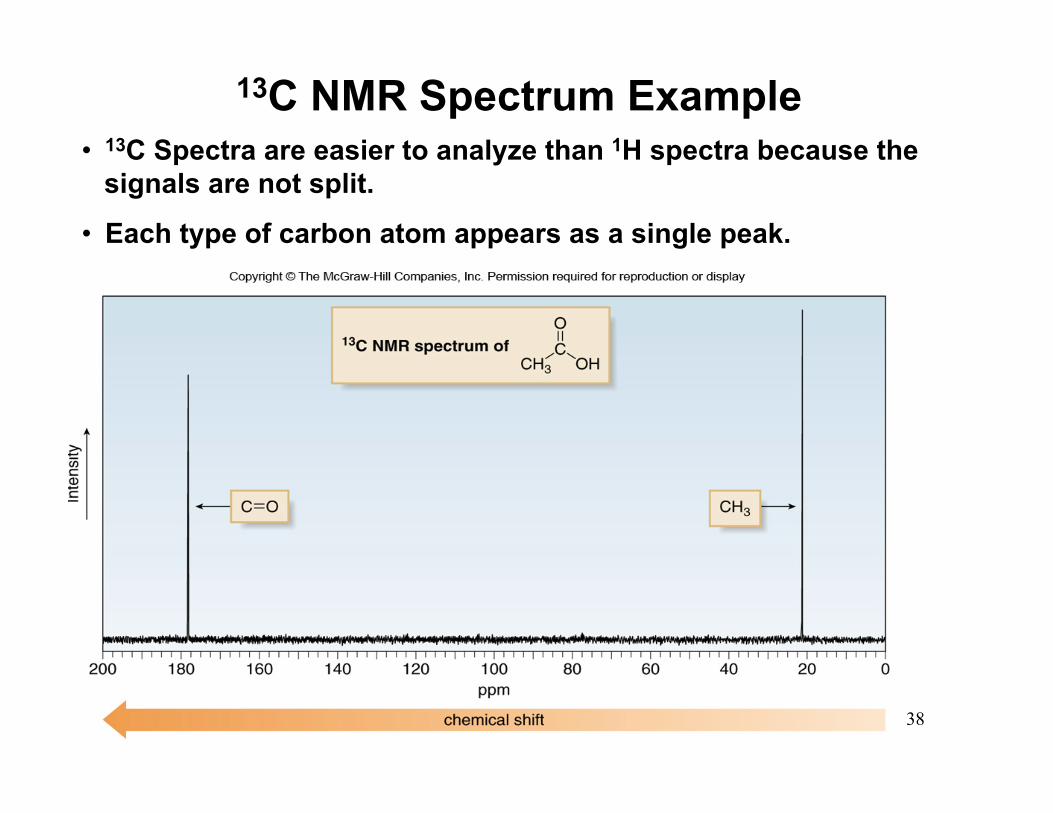
• 13C Spectra are easier to analyze than 1H spectra because the signals are not split.
• Each type of carbon atom appears as a single peak.