58
Confidential & Proprietary Copyright © 2007 The Nielsen Company Understanding Telecom Usage in Bahrain Business Module Findings July 2007

Confidential & Proprietary Copyright © 2007 The Nielsen Company
Understanding Telecom Usage in Bahrain Business Module Findings
July 2007

U & A Research Findings –Business Module
Page 2August 9, 2007
Confidential & Proprietary Copyright © 2007 The Nielsen Company
Agenda
Background &
Methodology
Background &
MethodologyTelecom Usage
Telecom Usage
TRA Under-standing
TRA Under-standing ConclusionsConclusions

U & A Research Findings –Business Module
Page 3August 9, 2007
Confidential & Proprietary Copyright © 2007 The Nielsen Company
Agenda
Background &
Methodology
Background &
Methodology
Telecom Scenario within the
Organization
Telecom Scenario within the
Organization
TRA Under-standing
TRA Under-standing ConclusionsConclusions
Study Background
Research Objectives
Research Design
Sample Profile

U & A Research Findings –Business Module
Page 4August 9, 2007
Confidential & Proprietary Copyright © 2007 The Nielsen Company
Background • Bahrain Telecommunications Regulatory Authority (TRA) was formed in October 2002. The
TRA is an independent body which has a direct responsibility to ensure effective liberalization of the telecommunications market.
• Bahrain TRA is in the process of carrying out an extensive strategic review of the telecommunications sector in the Kingdom of Bahrain for which it needs to collect and analyze information about the sector.
• TRA commissioned Nielsen to conduct a market research study with the objective of understanding the detailed usage behavior across various user segments in Bahrain.
• The telecom users are divided into two broad segments i.e. Residential and Corporate thus two separate modules were conducted to collect the required information.
• This presentation details the findings of the research conducted amongst the Corporate / Businesses to achieve TRA’s information needs.

U & A Research Findings –Business Module
Page 5August 9, 2007
Confidential & Proprietary Copyright © 2007 The Nielsen Company
Research Objectives
• The key objectives of this phase of the study is to understand the following within the corporate:
Detailed Usage of all Telecom Services -Fixed Line, Mobile and Data Services
Satisfaction with various services and Switching Behavior
Awareness of TRA and its activities

U & A Research Findings –Business Module
Page 6August 9, 2007
Confidential & Proprietary Copyright © 2007 The Nielsen Company
Research Design
Target Respondent• Responsible for telecom needs in the
organization ( Decision makers or Influencers).
• Following sectors were included in research:– Construction and building
– Financial, insurance, real estate and business services
– Health care
– Hotels and Restaurants
– Manufacturing Industries
– Transport and Communication
– Wholesale and Retail trade
– Business Services (Ad agencies, Consultants) / Professional services, etc
Research Methodology
• 159 Quantitative face to face interviewsacross various industries were conducted amongst the target respondents using a structured questionnaire.
• Interviews were conducted in English / Arabic as convenient to the respondent.
• Interview length was approximately of 40-45 minutes.
• Field work Timing : May 2007

U & A Research Findings –Business Module
Page 7August 9, 2007
Confidential & Proprietary Copyright © 2007 The Nielsen Company
Sample ProfileIndustry Type Sample
SizeSample
Proportions
Wholesale and Retail trade 25 16%
Business Services (Ad agencies / Consultants) etc 14 9%
Construction and building 23 14%
Financial, Insurance, Real estate & Business services 33
5
32
21
6
159
21%
Health care 3%
Hotels + Restaurants 20%
Manufacturing industries 13%
Transport, IT and Communication 4%
Total 100
20-99 employees
40%
100+ employees
18%Less than
20 employees
42%
Employee Size
Base: All respondents = 159

U & A Research Findings –Business Module
Page 8August 9, 2007
Confidential & Proprietary Copyright © 2007 The Nielsen Company
Agenda
Background &
Methodology
Background &
MethodologyTelecom Usage
Telecom Usage
TRA Under-standing
TRA Under-standing ConclusionsConclusions
Fixed Line Status
Mobile Status
International Calls
Internet / Data Services
Imperatives
Telecom expenses

U & A Research Findings –Business Module
Page 9August 9, 2007
Confidential & Proprietary Copyright © 2007 The Nielsen Company
Agenda
Background &
Methodology
Background &
MethodologyTelecom Usage
Telecom Usage
TRA Under-standing
TRA Under-standing ConclusionsConclusions
Fixed Line Status
Mobile Status
International Calls
Internet / Data Services
Imperatives
Telecom expenses
U & A Research Findings –Business Module
Page 10August 9, 2007
Confidential & Proprietary Copyright © 2007 The Nielsen Company
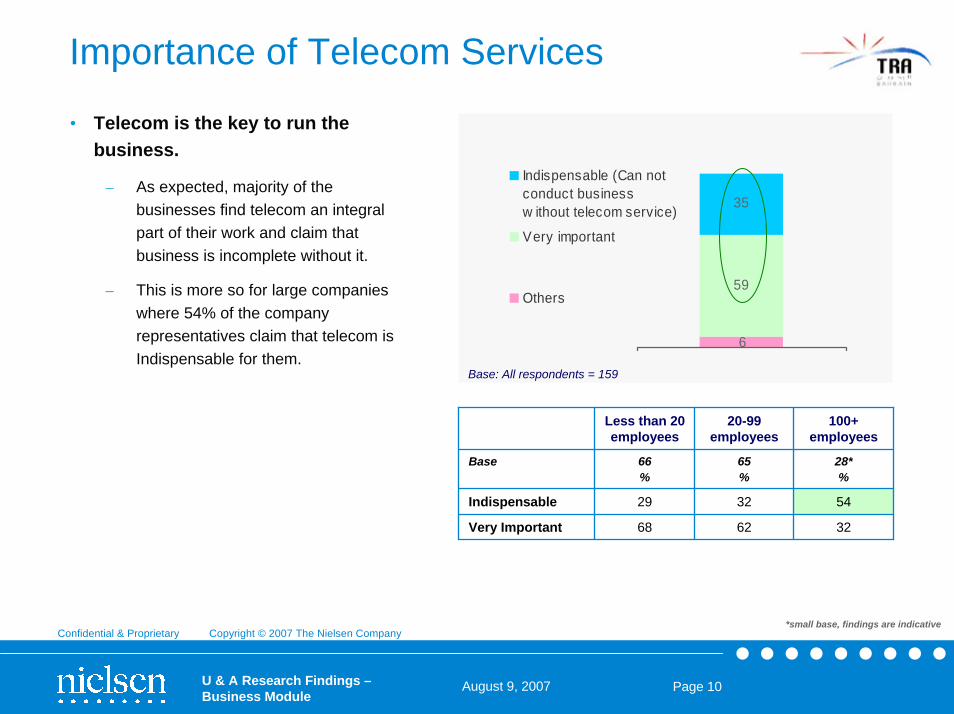
Importance of Telecom Services
• Telecom is the key to run the business.
– As expected, majority of the businesses find telecom an integral part of their work and claim that business is incomplete without it.
– This is more so for large companies where 54% of the company representatives claim that telecom is Indispensable for them.
59
35
6
Indispensable (Can notconduct businessw ithout telecom service)
Very important
Others
Base: All respondents = 159
Less than 20 employees
20-99 employees
100+ employees
Base 66%
65%
32
62
28*%
54
Very Important 68 32
29Indispensable
*small base, findings are indicative

U & A Research Findings –Business Module
Page 11August 9, 2007
Confidential & Proprietary Copyright © 2007 The Nielsen Company
Important Factors
• ‘Tariffs/Charges’ is the most important element followed by the ‘Quality of services’ across industries.
– With the increasing employee size, criteria changes, Quality of Services and Brand Reputation play larger role
– Financial services sector attach greater significance to the pricing aspect, where 66% of the company representatives mentioned Tariffs are the No. 1 parameter
– ‘Health & Social’ sector consider brand reputation as more important than the others.
43
35
1183
Customer/account care
Range of business servicesavailableBrand/reputation
Quality of services
Tarif fs/charges
Rank 1 scores
Base: All respondents = 159
Rank 1 Less than 20 employees
20-99 employees
100+ employees
Base 66%
65%
43
Quality of Services
29 35 46
Brand Reputation 9 6 25
28*%
2553Tariffs / Charges
*small base, findings are indicative

U & A Research Findings –Business Module
Page 12August 9, 2007
Confidential & Proprietary Copyright © 2007 The Nielsen Company
Existing Number Importance
• Existing number is very crucial for businesses.
– More than 70% say it is extremely important and consider it essential for smooth running of the business.
Retaining the old number
Important22%
Not Important5%
No response2%
Very Important (It is essential for
business)71%
Base: All respondents = 159

U & A Research Findings –Business Module
Page 13August 9, 2007
Confidential & Proprietary Copyright © 2007 The Nielsen Company
Agenda
Background &
Methodology
Background &
Methodology
Telecom Scenario
with Organization
Telecom Scenario
with Organization
TRA Under-standing
TRA Under-standing ConclusionsConclusions
Fixed Line Status
Mobile Status
International Calls
Internet / Data Services
Imperatives
Telecom expenses

U & A Research Findings –Business Module
Page 14August 9, 2007
Confidential & Proprietary Copyright © 2007 The Nielsen Company
Type of Fixed line Connection
• Analog Fixed Voice and Fax lines are most commonly used across business.
– As expected the average number of lines increase with the increase in employee size.
– Financial sector has the maximum
Average Number of Lines
Total Less than 20 employees
20-99 employees
100+ employees
Base 159%
66%
4
2
Fixed Voice lines
28*%
65%
4
Fax lines 1 2
11
4
2
number of fixed lines.
• Batelco is universally recognized as a fixed line provider.
• Other brands have low awareness as fixed line service providers
Other Service Providers - Awareness
26
14 144
Mena Kalaam 2Connect Nuetel
Base: All respondents = 159
*small base, findings are indicative

U & A Research Findings –Business Module
Page 15August 9, 2007
Confidential & Proprietary Copyright © 2007 The Nielsen Company
Value Added Services
• Caller Line Identification is most commonly used value added service by business fixed line users.
• Conference Call is used by nearly 1/3rd of the businesses
• More value added services used by large companies.
Fixed line VAS used
61
33
27
24
18
5
Call Line Identif ication
Conference Calls
Bahrain Direct
Home Direct
Voicemail
V ideo Conference Calls
Base: All respondents – 159

U & A Research Findings –Business Module
Page 16August 9, 2007
Confidential & Proprietary Copyright © 2007 The Nielsen Company
Number of National Calls made daily
63 70
15136 46 6
10 7
Fixed to f ixed Fixed to Mobile
200+ calls
151-200 calls
101-150 calls
51-100 calls
upto 50 calls
• Most of businesses make up to 50 National calls per day to both fixed line and mobile.
• As expected larger companies make more number of calls compare to smaller firms.
Base: All respondents – 159
Average No. of Calls
Less than 20 employees
20-99 employees
100+ employees
Base 66%
65%
90
Fixed to Mobile 35 65 140
28*%
13530Fixed to Fixed
*small base, findings are indicative

U & A Research Findings –Business Module
Page 17August 9, 2007
Confidential & Proprietary Copyright © 2007 The Nielsen Company
Duration of National Calls from Fixed Line
• Majority of the calls made last for 3-10 minutes. However a significant portion (45%) of calls are up to 3 minutes of duration.
• Some differences have been recorded between industries.
– Finance companies make longer calls, where 72% of calls made are more than 3 minutes.
– Large companies (employee size more than 100) also tend to make longer calls, where 64% of calls made are more than 3 minutes.
19
35
46
9
Fixed line
More than 10 minutes
More than 3 minutes up to 10minutes
2 to 3 minutes
1 to 2 minutes
Less than 1 minute
Average scores across respondents
Base: All respondents – 159
45%

U & A Research Findings –Business Module
Page 18August 9, 2007
Confidential & Proprietary Copyright © 2007 The Nielsen Company
Fixed Line Billing Pulse Awareness
• Most corporate customers think that the billing pulse for fixed line is ‘Per minute’ calls to Fixed line and Mobile.
• The individual customers also perceive the same as seen in residential research module.
817
82 67
1
7 1512
Fixed to Fixed Fixed to Mobile
Others/ Don't know
Per 3 Minutes
Per 90 Seconds
Per Minute
Per Second
Base: All respondents – 159

U & A Research Findings –Business Module
Page 19August 9, 2007
Confidential & Proprietary Copyright © 2007 The Nielsen Company
Private Network (LAN) to make National Calls
Base: All respondents – 159
• Overall low response recorded for Private Network (LAN) usage.
– Seems to be popular only amongst the large organizations.
Use24%
Do not use76%
Less than 20 employees 20-99 employees 100+ employees
Base – All respondents 66%
65%
22
28*%
649Using a Private Network (LAN) to make national calls between offices
*small base, findings are indicative

U & A Research Findings –Business Module
Page 20August 9, 2007
Confidential & Proprietary Copyright © 2007 The Nielsen Company
Satisfaction Levels
• Most Corporate customers are satisfied with Fixed Line services at an overall level.
• Some have expressed uncertainties about ‘Customer Care Parameters’. Maximum dissatisfaction is observed for Tariffs.
Satisfaction Levels - Fixed Line Parameters
3 4 4 7 531
9 11 1320 23
2355 4351
42 44
27
33 42 32 31 28 19
Overall servicelevel
Range o fservices pro vided
Quality o f service Respo nse whendealing withpro blems
Custo mer care Charges fo rNatio nal Calls
Very Satisf ied
Fairly Satisf ied
Neither satisf iednor dissatisf ied
Not satisf ied
Base: All respondents – 159

U & A Research Findings –Business Module
Page 21August 9, 2007
Confidential & Proprietary Copyright © 2007 The Nielsen Company
Switching Inclination - Fixed line provider
• Majority of the corporate customers are not likely to switch fixed line service provider in case of choice availability
• The resistance is higher amongst the large companies (more than 100 employees) where 60% state that they are not likely to change.
Likeliness to switch
47
35
18Likely
Neither likely nor unlikely
Not likely
Base: All those who are not willing to switch – 75
Reasons for not switching the provider…• Don’t want to change the number 36%• Satisfied with Batelco – 27%• Current provider offer good services – 25%• Have good features – 7%
Base: All respondents – 159
Reasons for switching the provider…• Cheaper prices – 50 %• Better services – 43%
Base: All those who are willing to switch – 28*
*small base, findings are indicative

U & A Research Findings –Business Module
Page 22August 9, 2007
Confidential & Proprietary Copyright © 2007 The Nielsen Company
To sum up
Fixed line Status
Fixed line Status
• All corporate customers use fixed and fax line services. High volume of national calls for both : Fixed to Fixed and Fixed to Mobile.
• While Batelco subscription is universal, there is a low awareness for other players.
• Value Added Services subscription limited to a few services like CLIP and conference calls
• Majority of the calls made last for 3-10 minutes. However a significant portion (45%) of calls are less than 3 minutes of duration.
• Very few businesses use Private Network (LAN) to make national calls.
• Overall Satisfaction levels are high, however some express uncertainties about customer care. Tariffs is a concern for many.
• On probing for inclination to switch, most company representatives feel it in unlikely because they do not want to change their numbers and are satisfied with the services provided by their current operator.

U & A Research Findings –Business Module
Page 23August 9, 2007
Confidential & Proprietary Copyright © 2007 The Nielsen Company
Agenda
Background &
Methodology
Background &
Methodology
Telecom Scenario
with Organization
Telecom Scenario
with Organization
TRA Under-standing
TRA Under-standing ConclusionsConclusions
Fixed Line Status
Mobile Status
International Calls
Internet / Data Services
Imperatives
Telecom expenses

U & A Research Findings –Business Module
Page 24August 9, 2007
Confidential & Proprietary Copyright © 2007 The Nielsen Company
Mobile Allocation
• Most companies have mobile connections in the company's name.
• Lower incidence observed amongst Traders (wholesale and retail) and Hotels vis-à-vis the other businesses.
• Post-paid connections preferred more than pre-paid by the large companies.
• The company representatives quote ‘Mobile workforce’ as the key reason for using mobile phones.
Base: All respondents – 159
Mobile Connections in Company's Name
Have mobile connections
in comapany's name64%
No mobile connections in company's
name36%
Base: All companies who have mobile connections in their name - 102
Average No of Connections
Less than 20 employees
20-99 employees
100+ employees
Base 41 36
%
6
8
%
25*
%
24
13Prepaid connection 3
3Postpaid
Reason for using Mobile phones…• Mobile workforce – 75 %• Quality of service – 31 % • Availability of additional services – 25 % • Can control spending – 14 %
*small base, findings are indicative

U & A Research Findings –Business Module
Page 25August 9, 2007
Confidential & Proprietary Copyright © 2007 The Nielsen Company
Service Provider / Type of Package
• Batelco has a very strong presence amongst the corporate customers as compared to the second service provider MTC.
• The basic pre-paid and post-paid packages are more popular with the customers
Percentage of companies subscribing various packages
53
50
17
4
13
7
2
2
Batelco Prepaid
Batelco Contract (Post Paid)
Batelco Valuetime
Batelco Free Data
MTC Prepaid
MTC Contract (Post Paid)
MTC Business Plus
MTC Business Value
Base: All companies who have mobile connections in their name - 102

U & A Research Findings –Business Module
Page 26August 9, 2007
Confidential & Proprietary Copyright © 2007 The Nielsen Company
Value Added Services Mobile VAS used
50
41
21
15
4
3
SMS+
InternationalRoaming
Bulk SMS
Voicemail
MENAFNSMS
SMS BillPayment
Base: All companies who have mobile connections in their name - 102
• Only a moderate use of value added services by the corporate users.
• SMS+, International Roaming are the most availed service.
U & A Research Findings –Business Module
Page 27August 9, 2007
Confidential & Proprietary Copyright © 2007 The Nielsen Company
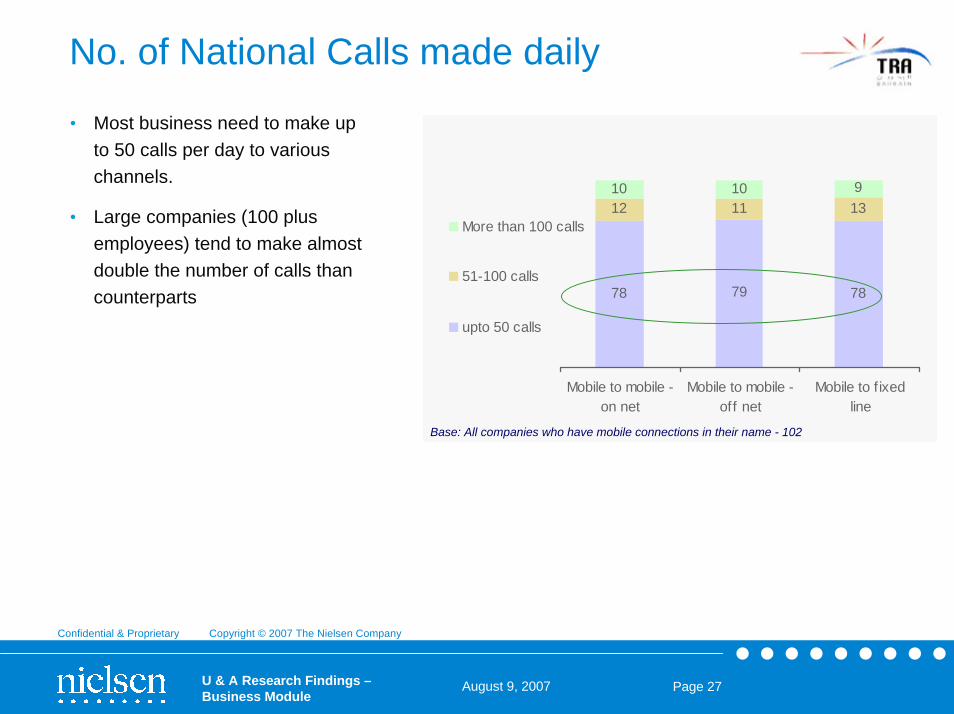
No. of National Calls made daily
• Most business need to make up to 50 calls per day to various channels.
• Large companies (100 plus employees) tend to make almost double the number of calls than counterparts 78 79 78
12 11 1310 10 9
Mobile to mobile -on net
Mobile to mobile -off net
Mobile to f ixedline
More than 100 calls
51-100 calls
upto 50 calls
Base: All companies who have mobile connections in their name - 102

U & A Research Findings –Business Module
Page 28August 9, 2007
Confidential & Proprietary Copyright © 2007 The Nielsen Company
Duration of National Calls from Mobile
• Duration of calls from mobile is very similar to the calls originating from fixed line, where maximum calls are between 3 to 10 minutes.
• As per the company representatives, nearly 49% of their calls from mobile are of durations up to 3 minutes.
114
34
43
8
Mobile
More than 10 minutes
More than 3 minutes up to 10minutes2 to 3 minutes
1 to 2 minutes
Less than 1 minute
Base: All companies who have mobile connections in their name - 102
Average scores across respondents
49%

U & A Research Findings –Business Module
Page 29August 9, 2007
Confidential & Proprietary Copyright © 2007 The Nielsen Company
Satisfaction Levels
• Like fixed line, high satisfaction recorded for Mobile service amongst businesses. No major issues with regards to customer care unlike Fixed Line services.
• Tariffs is the only concern area.
Satisfaction Levels - Mobile Service Parameters
1 2 2 2 8 3 5 16 269 15 20 21
20 22 2123
1957 3948 48 44 47 47
40 34
33 4430 29 28 28 27 21 21
Overallservice level
Range ofservices
Serviceavailability
Quality ofservice
No droppedcalls
Customercare
Dealing w ithproblems
SMS Charges National CallTarif fs
Very Satisf ied
Fairly Satisf ied
Neither satisf iednor dissatisf ied
Not satisf ied
Base: All companies who have mobile connections in their name - 102

U & A Research Findings –Business Module
Page 30August 9, 2007
Confidential & Proprietary Copyright © 2007 The Nielsen Company
Switching Inclination – Mobile Service
• As seen for fixed line, corporate customers are not keen to switch. This is more so for large companies.
• Unwillingness to change existing number seems to be a prime reason.
Likeliness to switch
53
31
16Likely
Neither likely nor unlikely
Not likely
Base: All companies who have mobile connections in their name - 102
Reasons for not switching the provider…• Don’t want to change the numbers – 41%• Satisfied currently with existing provider – 24%• Offer good services – 19% • Good Features – 7%
Base: All those who are not willing to switch – 54

U & A Research Findings –Business Module
Page 31August 9, 2007
Confidential & Proprietary Copyright © 2007 The Nielsen Company
To sum up
Mobile Status
Mobile Status
• Most companies subscribe to mobile connections primarily becauseof mobile workforce.
• Post-paid connections preferred over pre-paid. Batelco has a very strong presence amongst corporate customers.
• Value added services used only moderately.
• Higher number of calls per day. Most calls are of 3-10 minutes duration.
• High satisfaction observed for Mobile service amongst Corporate users.
• Users are quite loyal and are not likely to switch service providers.

U & A Research Findings –Business Module
Page 32August 9, 2007
Confidential & Proprietary Copyright © 2007 The Nielsen Company
Agenda
Background &
Methodology
Background &
Methodology
Telecom Scenario
with Organization
Telecom Scenario
with Organization
TRA Under-standing
TRA Under-standing ConclusionsConclusions
Fixed Line Status
Mobile Status
International Calls
Internet / Data Services
Imperatives
Telecom expenses

U & A Research Findings –Business Module
Page 33August 9, 2007
Confidential & Proprietary Copyright © 2007 The Nielsen Company
Channels used to make International Calls
• Majority of the international calls are made through Fixed line using the Direct IDD by the customers
• Small proportion use Mobile IDD to make calls abroad.
• Others options like pre-selected carrier, calling cards, VOIP are only marginally used by the corporate customers currently.
74
15443
Mobile - using prepaidcalling cards Fixed line - using prepaidcalling cardsFixed line - Pre-selectedcarrierMobile - Direct IDD
Fixed line - Direct IDD Calls
Average scores across respondents
Base: All those who make international calls – 138 respondents
Popular International Calling Cards - Used by the business customers
• MENA Talk• K Talk

U & A Research Findings –Business Module
Page 34August 9, 2007
Confidential & Proprietary Copyright © 2007 The Nielsen Company
Destinations called
• More than 70% of the companies call UAE and Saudi Arabia .
• Duration of international calls is
Top 8 countries called...
8473
52 49 4841 36
28
UAE
Saudi Arabia
India
Kuwait
Qatar
Oman
United Kingdom
USA
somewhat shorter than the local calls
1
40
38
12
9
More than 10 minutes
More than 3 minutesup to 10 minutes2 to 3 minutes
1 to 2 minutes
Less than 1 minute
Base: All those who make international calls – 138 respondents

U & A Research Findings –Business Module
Page 35August 9, 2007
Confidential & Proprietary Copyright © 2007 The Nielsen Company
Satisfaction – International Tariffs • Low satisfaction with international
tariffs - both fixed line and mobile.
• The disappointment is more prominent amongst the mid-size (20 to 99 employees) companies where the dissatisfaction score is more than 40%
Likeliness to switch
38 35
2011
2735
15 19
Fixed Line Mobile
Very Satisfied
Fairly Satisfied
Neither satisf ied nordissatisfiedNot Satisf ied
Base: All 159 102

U & A Research Findings –Business Module
Page 36August 9, 2007
Confidential & Proprietary Copyright © 2007 The Nielsen Company
To sum up
International Calls
International Calls
• The main channels used for international calls are Fixed Line and Mobile IDD calling.
• Amongst those companies which use calling cards, MENA Talk and K Talk are the most popular.
• KSA and UAE are the top called destinations, where most calls are in the range of 1-2 minutes.
• High dissatisfaction for international call tariffs, especially amongst mid-size companies.

U & A Research Findings –Business Module
Page 37August 9, 2007
Confidential & Proprietary Copyright © 2007 The Nielsen Company
Agenda
Background &
Methodology
Background &
Methodology
Telecom Scenario
with Organization
Telecom Scenario
with Organization
TRA Under-standing
TRA Under-standing ConclusionsConclusions
Fixed Line Status
Mobile Status
International Calls
Internet / Data Services
Imperatives
Telecom expenses

U & A Research Findings –Business Module
Page 38August 9, 2007
Confidential & Proprietary Copyright © 2007 The Nielsen Company
Data Service Usage
• Data services other than Broadband Internet have very low incidence of usage.
• The companies which do not use any data service are mainly traders and restaurants etc.
• Accessibility of advanced data / net services is limited to large sized firms.
Internet services used in organizations67
9 8 5
33
InternetBroadbandservices
BusinessData
services
E-Applications
ICT Solutions Do not useany dataservice
Base: All respondents – 159
Less than 20 employees
20-99 employees
100+ employees
Base 66%
65%
80
5
E-Applications 2 3 36
ICT Solutions - 2 25
28*%
93
Business Data 5 32
42Internet Broadband
*small base, findings are indicative

U & A Research Findings –Business Module
Page 39August 9, 2007
Confidential & Proprietary Copyright © 2007 The Nielsen Company
Broadband Packages% of companies susbcribing broadband
packages
11
7
10
9
37
10
8
15
INET Business Dialup
INET Direct Dial-up
Business 256k (2.5GB)
Business 256k (5GB)
Business 512k(10GB)
Business 512 (Unlimited)
Business 1028 (Unlimited)
Don’t know bandw idth
Base: All respondents – 106
• Broadband 512k (10 GB) is the package subscribed by most companies
Almost 100% have subscribed to services offered by Batelco
Base - 106
U & A Research Findings –Business Module
Page 40August 9, 2007
Confidential & Proprietary Copyright © 2007 The Nielsen Company
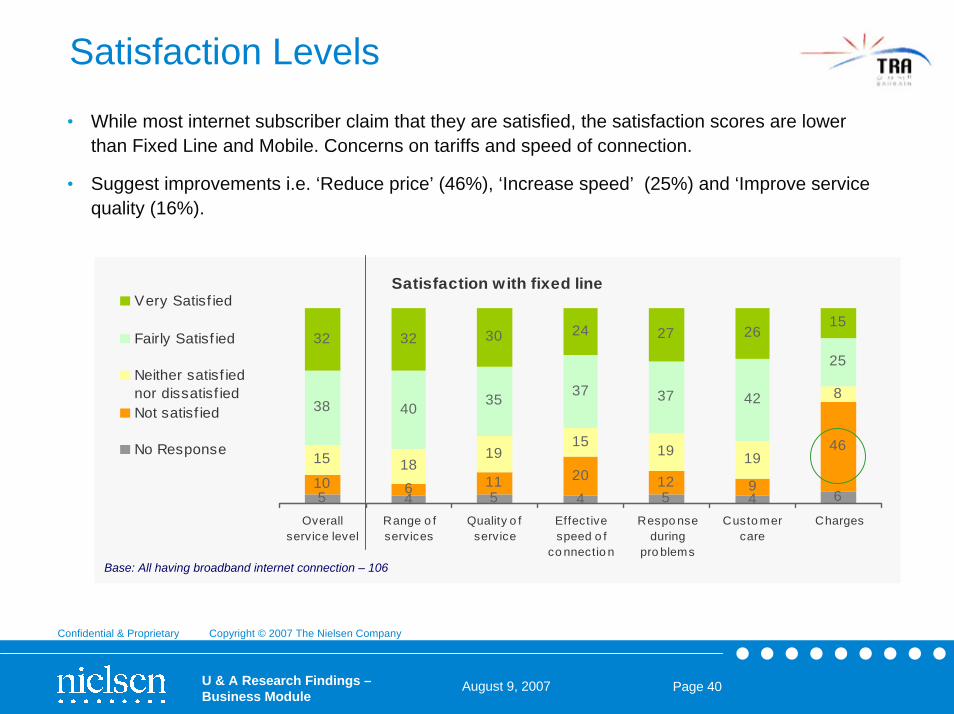
Satisfaction Levels • While most internet subscriber claim that they are satisfied, the satisfaction scores are lower
than Fixed Line and Mobile. Concerns on tariffs and speed of connection.
• Suggest improvements i.e. ‘Reduce price’ (46%), ‘Increase speed’ (25%) and ‘Improve service quality (16%).
Satisfaction with fixed line
5 4 5 4 5 4 610 6 11 20 12 9
4615 18
1915 19 19
838 40 35 37 37 42
2532 32 30 24 27 26
15
Overallservice level
Range o fservices
Quality o fservice
Effectivespeed o f
co nnectio n
Respo nseduring
pro blems
Custo mercare
Charges
Very Satisf ied
Fairly Satisf ied
Neither satisf iednor dissatisf iedNot satisf ied
No Response
Base: All having broadband internet connection – 106

U & A Research Findings –Business Module
Page 41August 9, 2007
Confidential & Proprietary Copyright © 2007 The Nielsen Company
To sum up
Data Services
Data Services
• Broadband Internet is the most common Internet service used by the businesses in Bahrain.
• Other advanced data services are availed only by large organizations.
• Fair satisfaction with the Internet service available, relatively lower than Fixed line and Mobile. Suggestions provided by the customers are related to reducing charges and providing faster speed.

U & A Research Findings –Business Module
Page 42August 9, 2007
Confidential & Proprietary Copyright © 2007 The Nielsen Company
Agenda
Background &
Methodology
Background &
Methodology
Telecom Scenario
with Organization
Telecom Scenario
with Organization
TRA Under-standing
TRA Under-standing ConclusionsConclusions
Fixed Line Status
Mobile Status
International Calls
Internet / Data Services
Imperatives
Telecom expenses

U & A Research Findings –Business Module
Page 43August 9, 2007
Confidential & Proprietary Copyright © 2007 The Nielsen Company
Telecom Expenses• Telecom expenses across services increase in line with size of the company.
• Nearly 20% of the fixed line and mobile spends are on International Calls.
Total Less than 20 employees
20-99 employees
100+ employees
Fixed Line Spends BD 530
BD 425
BD 380
BD 1,100
Mobile Spends (Amongst companies which have mobile connections in their name)
BD 625BD 200
BD 200 BD 300
BD 270 BD 320
BD 970
Data Spends (Amongst companies which use data services)
BD 600

U & A Research Findings –Business Module
Page 44August 9, 2007
Confidential & Proprietary Copyright © 2007 The Nielsen Company
Agenda
Background &
Methodology
Background &
MethodologyTelecom Usage
Telecom Usage
TRA Under-standing
TRA Under-standing ConclusionsConclusions
Awareness
Knowledge of TRA services
U & A Research Findings –Business Module
Page 45August 9, 2007
Confidential & Proprietary Copyright © 2007 The Nielsen Company
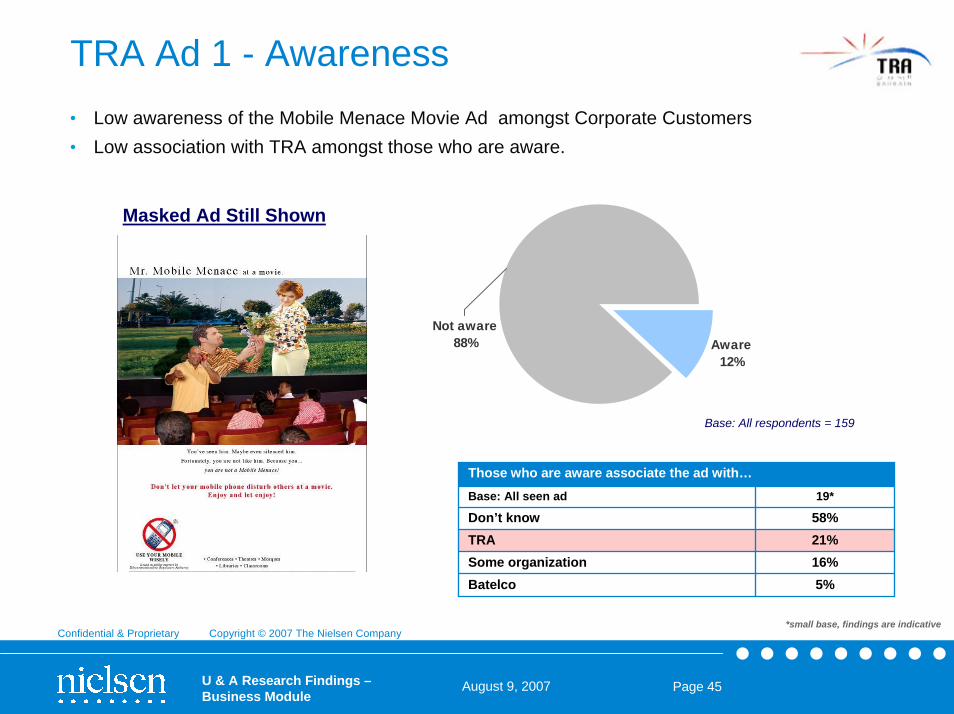
TRA Ad 1 - Awareness
Aware12%
Not aware88%
Masked Ad Still Shown
Those who are aware associate the ad with…Base: All seen ad 19*
TRA 21%Some organization 16%
Don’t know 58%
Batelco 5%
Base: All respondents = 159
• Low awareness of the Mobile Menace Movie Ad amongst Corporate Customers • Low association with TRA amongst those who are aware.
*small base, findings are indicative

U & A Research Findings –Business Module
Page 46August 9, 2007
Confidential & Proprietary Copyright © 2007 The Nielsen Company
TRA Ad 2 - Awareness
Aware38%
Not aware62%
Masked Ad Still Shown
Those who are aware associate the ad with…Base: All seen ad 68
TRA 7%
Movie 3%
Don’t know 80%
Batelco 5%
Bahrain TV 2%
Base: All respondents = 159
• Better awareness for Mobile Menace Conference Ad however association is comparatively lower.

U & A Research Findings –Business Module
Page 47August 9, 2007
Confidential & Proprietary Copyright © 2007 The Nielsen Company
Aware30%
Not aware70%
Logo shown to the respondent
Base: All respondents = 159
• Low awareness scores for TRA.– However, as expected, awareness is better amongst corporate than individual customers.
TRA Logo Awareness

U & A Research Findings –Business Module
Page 48August 9, 2007
Confidential & Proprietary Copyright © 2007 The Nielsen Company
TRA Booklet Awareness • Negligible awareness for TRA’s ‘Keep Asking’ Booklet within organizations.
Base: All respondents = 159
Aware of 'Keep Asking Booklet...
Yes4%
96%No

U & A Research Findings –Business Module
Page 49August 9, 2007
Confidential & Proprietary Copyright © 2007 The Nielsen Company
TRA – Source of Awareness
56
21
8
8
4
4
2
2
2
New spaper
Billboard
Cinema
Friends & Relatives
Internet
Leaf lets
Radio
Magazines
TV
% scores
• Newspaper is the main source of awareness for TRA.
• Score for other sources are negligible.
Base: All aware of TRA – 48 respondents

U & A Research Findings –Business Module
Page 50August 9, 2007
Confidential & Proprietary Copyright © 2007 The Nielsen Company
TRA – Website
• Very low awareness of the TRA website, amongst those who know the organization. Heard of TRA website?
19
81
Heard of
No
Yes
Base: All aware of TRA – 48 respondents

U & A Research Findings –Business Module
Page 51August 9, 2007
Confidential & Proprietary Copyright © 2007 The Nielsen Company
Agenda
Background &
Methodology
Background &
MethodologyTelecom Usage
Telecom Usage
TRA Under-standing
TRA Under-standing ConclusionsConclusions
Awareness
Knowledge of TRA services

U & A Research Findings –Business Module
Page 52August 9, 2007
Confidential & Proprietary Copyright © 2007 The Nielsen Company
Role of TRA • Fair understanding of TRA’s role and duties amongst those who known the organization.
Customer say on the role of TRA
Don’t know much about it 8
Just heard the name 8
%
To control service / telecom / communication 35
Regulate rules of a telecom companies 31
It control charges 6
They take care of our complaints 2
Base: All aware of TRA – 48 respondents

U & A Research Findings –Business Module
Page 53August 9, 2007
Confidential & Proprietary Copyright © 2007 The Nielsen Company
TRA Activities
Do you know that TRA asks comments from public on issues related to regulatiions?
19%
81%
Yes No
• Low awareness for requests for consultations.
Base: All heard of TRA as an organization – 48 respondents

U & A Research Findings –Business Module
Page 54August 9, 2007
Confidential & Proprietary Copyright © 2007 The Nielsen Company
TRA – Awareness
54
13
3
The Rights as a TelecomService Consumer
Can register complaintswith TRA
TRA Consumer AdvisoryGroups
Base: All aware of TRA - 48
• Sound awareness of Telecom Consumer Rights amongst the telecom users.
– Interestingly the word of mouth working for TRA as it seems to be the best source of awareness so far.
• The awareness of other activities / issues is fairly low even amongst those who are aware of TRA as an organization.
•Friends & relatives – 46%•TV – 19%
•Newspapers – 15%
Base: All aware of Consumer Rights – 26* respondents
*small base, findings are indicative

U & A Research Findings –Business Module
Page 55August 9, 2007
Confidential & Proprietary Copyright © 2007 The Nielsen Company
TRA Awareness Summary
Bahrain Consumers Survey Sample Size -
159
Aware of the Organization Name and Logo – 30%
Ad A –Awareness – 12%
Correct Association with TRA – 3%
Ad B–Awareness – 38%
Correct Association with TRA –3%
Website Awareness 6%
Keep Asking Booklet – 4% have seen it
AwarenessComments from
Public Awareness –6%
Register complaints with TRA – 4%

U & A Research Findings –Business Module
Page 56August 9, 2007
Confidential & Proprietary Copyright © 2007 The Nielsen Company
Agenda
Background &
Methodology
Background &
MethodologyTelecom Usage
Telecom Usage
TRA Under-standing
TRA Under-standing ConclusionsConclusions

U & A Research Findings –Business Module
Page 57August 9, 2007
Confidential & Proprietary Copyright © 2007 The Nielsen Company
Conclusions
Fixed Line (National Calls)High Usage of Fixed Line for voice. Only a moderate use of value added services other than call line ID. While overall high satisfaction, main concerns are
related to Tariffs and uncertainties on customer care. Low intention to switch. Low correct awareness of
billing pulse.
Mobile (National Calls)High usage, mainly of postpaid connections.
Batelco dominates amongst corporate customers. Only a moderate use of Value added services.
Satisfaction High, Concerns on Tariff, Intention to switch is low.
International Calls
Main usage restricted only to regular channels like Fixed Line or Mobile IDD Calls.
KSA and UAE are the top countries called.Low satisfaction with international tariff rates.
Data Services
Usage of data services mainly restricted to Internet. Advanced services used only by larger
organizations. Business 512K (10GB) package subscribed by most customers.
Satisfaction levels lower than other telecom services.
TRA Awareness and InteractionCurrently Corporate Customers have a low awareness and interaction with TRA.

U & A Research Findings –Business Module
Page 58August 9, 2007
Confidential & Proprietary Copyright © 2007 The Nielsen Company
Thank you
Confidential & Proprietary Copyright © 2007 The Nielsen Company


