1 Understanding the 2014 Manufacturing Energy and Carbon Footprints The U.S. Department of Energy Advanced Manufacturing Office Manufacturing Energy and Carbon Footprints map energy use and combustion greenhouse gas (GHG) emissions from energy supply to end use. Footprints are published for 15 manufacturing sectors (representing 94% of all manufacturing primary energy use and 94% of U.S. manufacturing combustion GHG emissions) and for U.S. manufacturing as a whole. These sectors are described in more detail in the document 2014 Manufacturing Energy and Carbon Footprints: Scope. Manufacturing Energy and Carbon Footprint sectors: All Manufacturing Foundries Alumina and Aluminum Glass and Glass Products Cement Iron and Steel Chemicals Machinery Computers, Electronics, and Electrical Equipment Petroleum Refining Fabricated Metals Plastics and Rubber Products Food and Beverage Textiles Forest Products Transportation Equipment Each footprint visualizes the flow of energy (in the form of fuel, electricity, or steam) to major end uses in manufacturing, including boilers, power generators, process heaters, process coolers, machine-driven equipment, facility heating, ventilation, and air conditioning (HVAC), and lighting. The footprints use manufacturing energy consumption data from the U.S. Energy Information Administration’s (EIA’s) 2014 Manufacturing Energy Consumption Survey (MECS), along with referenced energy loss and emission factors, and input from industry and subject matter experts. The footprints present data at two levels of detail. The first page provides a high-level view of primary energy for heat and power (offsite and onsite), while the second page shows details of how energy is distributed to onsite end uses. It is important to note that energy consumed for nonfuel purposes (i.e., energy feedstocks supplied to the facility that is converted to a manufactured product and not used for heat, power, or electricity generation) is not included in the primary energy or onsite energy values presented in footprints. 1 A sector-wide value of “energy for all purposes”, which includes primary energy for heat and power plus net energy consumed for nonfuel purposes (including feedstock use) is provided at the bottom of the first page of each footprint. Aggregate data provided in each of the sectors includes: • Electricity and steam generated offsite and transferred to the facility, as well as electricity and steam generated onsite • Fuel, electricity, and steam consumed by major end uses in a manufacturing facility • Offsite and onsite energy losses due to the generation, transmission and distribution, and end use consumption of energy (some losses are unrecoverable) • Greenhouse gas emissions released during the combustion of fuel. 1 Energy used as a nonfuel feedstock is quantified separately in EIA MECS Table 2.2; though caution should be exercised when combining nonfuel feedstock energy with primary or onsite energy use values due to potential double-counting issues.
Transcript
1
Understanding the 2014 Manufacturing Energy and Carbon Footprints
The U.S. Department of Energy Advanced Manufacturing Office Manufacturing Energy and Carbon Footprints map energy use and combustion greenhouse gas (GHG) emissions from energy supply to end use. Footprints are published for 15 manufacturing sectors (representing 94% of all manufacturing primary energy use and 94% of U.S. manufacturing combustion GHG emissions) and for U.S. manufacturing as a whole. These sectors are described in more detail in the document 2014 Manufacturing Energy and Carbon Footprints: Scope.
Manufacturing Energy and Carbon Footprint sectors:
All Manufacturing Foundries Alumina and Aluminum Glass and Glass Products Cement Iron and Steel Chemicals Machinery Computers, Electronics, and Electrical Equipment Petroleum Refining Fabricated Metals Plastics and Rubber Products Food and Beverage Textiles Forest Products Transportation Equipment
Each footprint visualizes the flow of energy (in the form of fuel, electricity, or steam) to major end uses in manufacturing, including boilers, power generators, process heaters, process coolers, machine-driven equipment, facility heating, ventilation, and air conditioning (HVAC), and lighting. The footprints use manufacturing energy consumption data from the U.S. Energy Information Administration’s (EIA’s) 2014 Manufacturing Energy Consumption Survey (MECS), along with referenced energy loss and emission factors, and input from industry and subject matter experts. The footprints present data at two levels of detail. The first page provides a high-level view of primary energy for heat and power (offsite and onsite), while the second page shows details of how energy is distributed to onsite end uses. It is important to note that energy consumed for nonfuel purposes (i.e., energy feedstocks supplied to the facility that is converted to a manufactured product and not used for heat, power, or electricity generation) is not included in the primary energy or onsite energy values presented in footprints.1 A sector-wide value of “energy for all purposes”, which includes primary energy for heat and power plus net energy consumed for nonfuel purposes (including feedstock use) is provided at the bottom of the first page of each footprint.
Aggregate data provided in each of the sectors includes:
• Electricity and steam generated offsite and transferred to the facility, as well as electricity and steamgenerated onsite
• Fuel, electricity, and steam consumed by major end uses in a manufacturing facility• Offsite and onsite energy losses due to the generation, transmission and distribution, and end use
consumption of energy (some losses are unrecoverable)• Greenhouse gas emissions released during the combustion of fuel.
1 Energy used as a nonfuel feedstock is quantified separately in EIA MECS Table 2.2; though caution should be exercised when combining nonfuel feedstock energy with primary or onsite energy use values due to potential double-counting issues.
UNDERSTANDING THE 2014 MANUFACTURING ENERGY AND CARBON FOOTPRINTS
2
The Role of Energy Efficiency The U.S. manufacturing sector depends heavily on energy resources to provide fuel, electricity, and steam for the conversion of raw materials into usable products. Energy efficiency, cost, and availability have a substantial impact on the competitiveness and economic health of U.S. manufacturers. More efficient use of energy lowers production costs, conserves limited energy resources, and increases productivity. The more efficient use of energy also has positive impacts on the environment, including reduced emissions of greenhouse gases (GHGs) and air pollutants.
Energy efficiency varies across the various process and nonprocess end uses within each sector. The physical and chemical parameters of a process, as well as equipment design, age, and operating and maintenance practices, can lead to real-world performance below the ideal efficiency. Less-than-optimal energy efficiency means some of the input energy is lost either mechanically or as waste heat. In the manufacturing sector, energy losses amount to billions of dollars of energy costs each year and millions of metric tons of GHG emissions.
Increasing energy efficiency could result in substantial benefits to both U.S. manufacturers and the nation. Unfortunately, the sheer complexity of the thousands of processes used in the manufacturing sector makes this a daunting task. However, there are significant opportunities to address energy efficiency in common energy systems used across manufacturing, such as onsite power systems, fired heaters, boilers, pumps, facility HVAC equipment, and others. A first step in realizing these opportunities is to identify how industry is using energy. Where does it come from? What form is it in? Where is it used? How much is lost? Answering these questions for U.S. manufacturing sectors is the focus of the footprint analysis.
Carbon Footprint Analysis In addition to energy, the footprint analysis also shows combustion GHG emissions in units of million metric tons of carbon dioxide equivalent. The GHG footprint calculations utilize fuel-specific emission factors from the U.S. Environmental Protection Agency’s (EPA’s) Mandatory Greenhouse Gas Reporting Rule. Unique emission factors were used for each sector based on fuel type breakdown. Process emissions are excluded from the analysis as these are not directly related to the use of energy as fuel. Emissions are reported as carbon dioxide-equivalent (CO2e), as per the GHG reporting requirements. CO2e consists of contributing CO2, methane (CH4), and nitrous oxide (N2O) emissions. More details on the carbon footprint analysis methodology are shown in the document 2014 Manufacturing Energy and Carbon Footprints: Definitions and Assumptions.
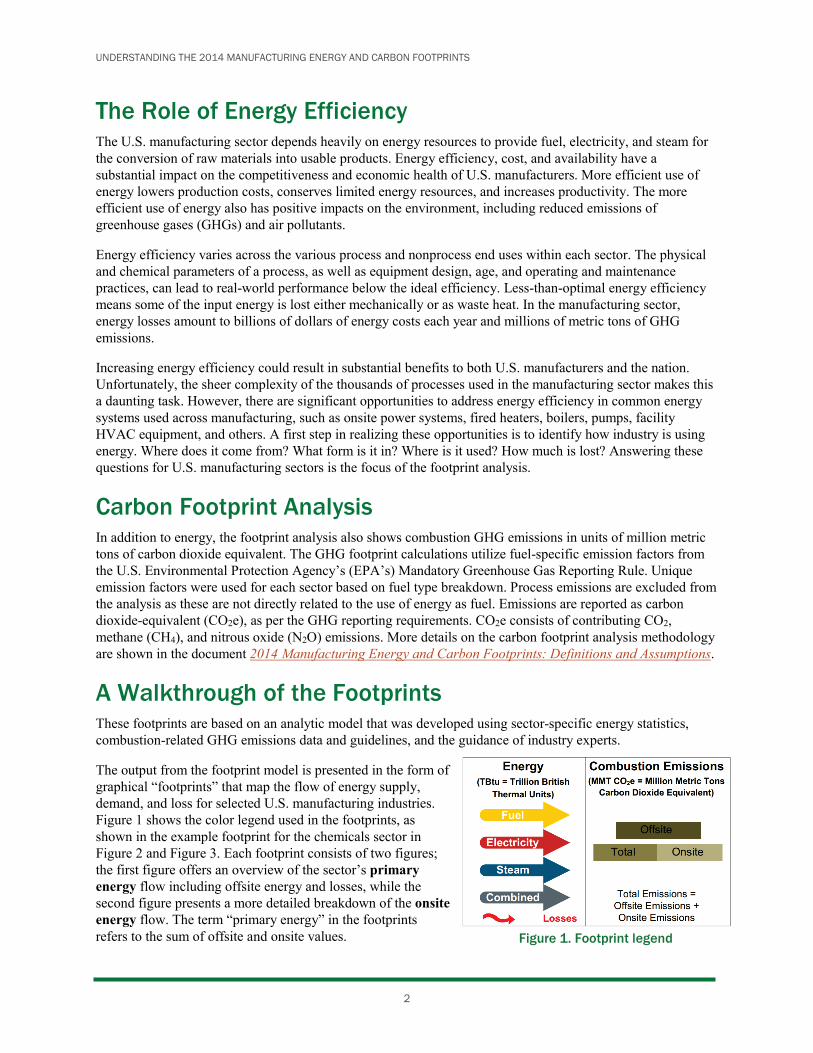
A Walkthrough of the Footprints These footprints are based on an analytic model that was developed using sector-specific energy statistics, combustion-related GHG emissions data and guidelines, and the guidance of industry experts.
The output from the footprint model is presented in the form of graphical “footprints” that map the flow of energy supply, demand, and loss for selected U.S. manufacturing industries. Figure 1 shows the color legend used in the footprints, as shown in the example footprint for the chemicals sector in Figure 2 and Figure 3. Each footprint consists of two figures; the first figure offers an overview of the sector’s primary energy flow including offsite energy and losses, while the second figure presents a more detailed breakdown of the onsite energy flow. The term “primary energy” in the footprints refers to the sum of offsite and onsite values. Figure 1. Footprint legend
UNDERSTANDING THE 2014 MANUFACTURING ENERGY AND CARBON FOOTPRINTS
3
Energy use is shown as input and output flow lines to the various pathway stages; energy values appear in white font within the flow arrows. Energy use is broken down by energy type and distinguished by color (as shown in Figure 1): dark gray = all energy, yellow = fuel, dark red = electricity, and blue = steam. Energy losses are represented as wavy red arrows. Combustion GHG emissions are shown in the brown boxes along the bottom of each pathway stage. Offsite, onsite, and total GHG emissions are distinguished by color as shown in the legend: dark brown = offsite GHG emissions, light brown = onsite GHG emissions, and medium brown = total GHG emissions (offsite + onsite).
The footprint pathway captures both energy supply and demand. On the supply side, the footprints provide details on energy purchases and transfers into a facility (including fuels derived from onsite produced byproducts), and onsite generation of steam and electricity. On the demand side, the footprints illustrate the end use of energy within a given sector, from process energy uses such as heaters and motors to nonprocess uses such as HVAC and lighting. The footprints identify where energy is lost due to generation and distribution losses and system inefficiencies, both inside and outside the facility boundary. Losses are critical, as they represent potential opportunities to improve efficiency and reduce energy consumption through best energy management practices and technologies.
In the primary energy footprint shown in Figure 2, the energy supply chain begins with the fuel, electricity, and steam supplied to the facility boundary from offsite sources (power plants, fuel and gas distributors, etc.). Many industries generate byproduct fuels, and these are also part of the energy supply. Notable examples of byproduct fuels include black liquor and wood byproducts in pulp and paper mills and still gas in petroleum refineries. Additionally, any renewable, non-combustion electricity output is included in the offsite energy supply.
As noted earlier in this document, a substantial amount of energy is consumed for nonfuel purposes in manufacturing, including feedstock use (e.g., liquefied petroleum gases in chemicals sector, coal feedstock in the iron and steel sector). Over five quadrillion British thermal units of nonfuel energy use is quantified for all of manufacturing in 2014 EIA MECS Table 2.2; though caution should be exercised when combining nonfuel energy with primary or onsite energy use values due to potential double-counting issues. The primary energy and onsite energy values exclude energy consumed for nonfuel purposes; however, a sector-wide value of “energy for all purposes”, which includes primary energy plus net energy consumed for nonfuel purposes (including feedstock use), is provided at the bottom of the first page of each footprint.
UNDERSTANDING THE 2014 MANUFACTURING ENERGY AND CARBON FOOTPRINTS
4
Figure 2. Primary energy use and total GHG combustion emissions for the chemicals sector In the onsite energy footprint shown in Figure 3, energy demand is shown by energy type and end use. The onsite energy that reaches the facility boundary is used indirectly for onsite generation or directly for process and nonprocess end uses. Onsite energy generation, which consists of conventional boilers, combined heat and power (CHP)/cogeneration systems controlled by a manufacturing facility, and other onsite electricity generation2, contributes to the electricity and steam demands of process and nonprocess end uses. A percentage breakdown of energy use by fuel type, including fuels derived from byproducts, is presented as a yellow call out box at the beginning of the onsite fuel pathway. Often, onsite generation of energy creates more energy than is needed at the facility, allowing any excess energy to be exported offsite to the local grid or other nearby facilities. Primary and onsite energy use values are based on net electricity and do not include exported electricity. Exported steam is accounted for in MECS net steam data, and thus is not explicitly shown in the footprint.
2 Other onsite electricity generation as depicted on the second page of the footprint excludes renewable, non-combustion electricity output, which is instead included in the electricity value entering the facility boundary. In the case of the chemicals footprint in Figure 3, the 0.1 trillion British thermal units (TBtu) of renewable electricity generation is included in the 458 TBtu of electricity entering the facility boundary (this latter value is also the total “net electricity” from MECS Table 5.2).
UNDERSTANDING THE 2014 MANUFACTURING ENERGY AND CARBON FOOTPRINTS
5
Figure 3. Onsite energy and GHG combustion emissions for the chemicals sector Process energy systems consist of the equipment necessary for process heating (e.g., kilns, ovens, furnaces, strip heaters, and associated burners), process cooling and refrigeration, electro-chemical processes (e.g., reduction processes), machine drive (e.g., motors and pumps associated with process equipment), and other direct process uses. Another end use energy pathway is the energy that is distributed to nonprocess activities. This involves the use of energy for facility HVAC, facility lighting, other facility support (e.g., water heating and office equipment), onsite transportation, and other nonprocess use.
Energy losses occur along the entire energy pathway from generation and delivery to end use. Energy is lost in generating and transmitting electricity and steam and in process and nonprocess end use of electricity, steam, and fuel. In the footprint analysis, these energy loss values are estimated based on literature search and peer review. Since energy losses vary greatly by industry and by facility, appropriate sector-wide and sector-specific energy loss estimate assumptions are made with the understanding that these estimates are highly dependent on the specific manufacturing facility. A summary of footprint loss assumptions is outlined in the document 2014 Manufacturing Energy and Carbon Footprints: Definitions and Assumptions. Energy losses do not equate to recoverable energy. While a portion of energy losses are recoverable, the footprints do not attempt to identify and distinguish between recoverable and non-recoverable losses.
The energy and carbon footprints are based on actual facility survey data and therefore represent a reasonable distribution of energy use and losses across the sector as a whole. Through them, we can begin to assess the magnitude of energy consumption and losses, both by end use and fuel type. They also provide a baseline from which to calculate the benefits of improving energy efficiency. The GHG combustion emissions in the footprint can be used to support GHG management planning and analysis.