Page 1
UNDERSTANDING THE IRISH BANKING CRISIS
Brendan J Collins
A Dissertation submitted to the National College of Ireland School Of Business in
partial fulfilment of the requirements for the award of the Master of Science
Degree in Management
Research Advisor
Dr Garvan Whelan
Dublin
August 2012
Declaration
I declare that all the material included in this dissertation is the end result of my
own work and that due acknowledgment has been given in the references to all
sources consulted in the completion of this research
Brendan Collins
1
Page 2
Submission of Thesis and Dissertation
Norma Smurfit Library National College of Ireland
Research Students Declaration Form (Thesis/Author Declaration Form)
Name: BRENDAN COLLINS_____________________________________
Student Number: 10208810________________________________________
Degree for which thesis is submitted: MSC IN MANAGEMENT_______
Material submitted for award
(a) I declare that the work has been composed by myself
(b) I declare that all verbatim extracts contained in the thesis have beendistinguished by quotation marks and the sources of information specifically acknowledged
(c) My thesis will be included in electronic format in the College Institutional Repository TRAP (thesis reports and projects)
(d) Either *1 declare that no material contained in the thesis has been used inany other submission for an academic award
Or *1 declare that the following material contained in the thesis formed part of a submission for the award of
(State the aw ard and the awarding body and list the m aterial below )
Signature of research student:
Date: _______
Norma Smurfit Library, National College of Ireland tel + 353 14498590 or email ltbrarv@ncirl le June 201
Page 3
ABSTRACT
The financial crisis that hit Ireland in 2008 was a severe event that will have a
lasting impact on the entire population This was not a unique event While the
scale of the collapse is significant, there are many parallels with other global
financial failures The purpose of this study is to understand how a system of
banking can continue to repeat seemingly systemic collapse The study reveals
that one difficulty compounding the financial sector is the failure to correctly
diagnose bank crises This failure results in the misapplication of corrective policy
treatment There are two types of bank failure, a classic and a secondary failure
Secondary failures are caused mainly by external macroeconomic events that
management are unable to control Classic failures are caused by internal events
such as reckless lending Classic failures are typically the product of banks that
lack organisational control and accountability The research highlights a structural
deficiency in the existing architecture of banking This deficiency creates an
agency problem as bank executives are not held accountable for poor
management, and supported by government during catastrophic failure This
weak structural system fosters an autocratic management style The effects of
external conditions such as a booming property market and deregulation, further
creates an environment where excessive and unsustainable growth leads to
crisis This study uses a combination of qualitative and quantitative research
2
I
Page 4
ACKNOWLEDGMENTS
I would like to express my sincere appreciation and gratitude to those who
assisted me in this process and without their help, the completion of this work
would not have been possible
To my wife Marie, who has always provided unconditional support particularly
over the last 2 years To Michael Collins, Fiona Collins and Emily Collins who
have been inspirational
To the many people who assisted in the research of this topic including Alan
Dukes, John McNally, Russell Waide, Pat Farrell, Clark McGinn, Patrick Peake,
Mike Shea, Marie Mangan, and to those who wish to remain anonymous
To the library staff and lecturers at the National College of Ireland, and to my
supervisor Dr Garvan Whelan
3
Page 5
11
1 2
1 3
2 1
222 3
24
2 5
26
2 7
2 8
29
2 10
2 11
2 12
2 13
2 14
J T
3 2
3 3
T T "
4 2
4 3
4 4
4 5
TABLE OF CONTENT
Title Page
Introduction
Structure
Background to the Irish Banking Crisis
8
9
10
Literature Review
Banking in Ireland, a Brief History
Analysis of Selective International Bank Failures
The Argentinean Crisis
US Bank Failures 1920-1930
The Japanese Crisis
The Asian Crisis
The Norwegian Crisis
US Savings & Loan Crisis
The Icelandic Crisis
The UK Crisis
Crisis in Ireland
Crisis in the US
Summary of History
15
18
24
24
27
39
32
32
33
34
35
36
40
42
Understanding Credit & Banking
Protecting Banks at all Cost
Capital Adequacy
46
49
50
Research Introduction
Research Objectives
Research Methodology
Research Methods
Research Conclusion
54
55
56
56
58
4
Page 6
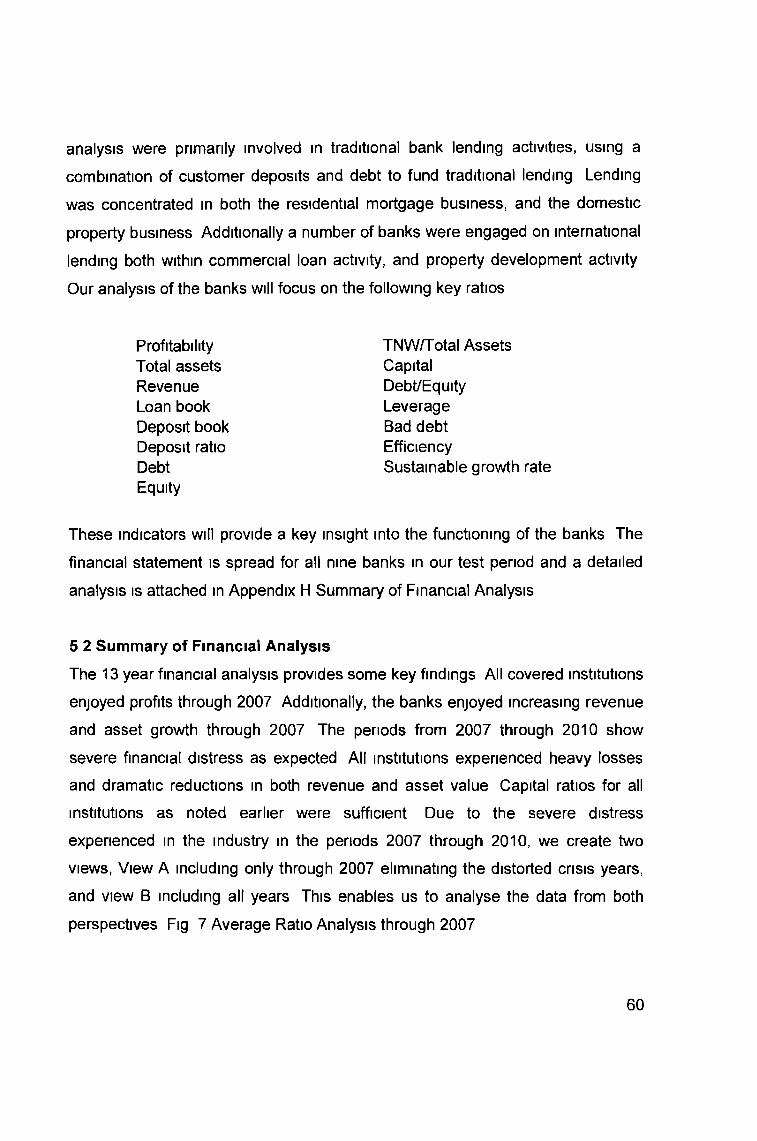
5 1
52
6T6 2
6 3
6 4
65
66
6 7
68
T ï
7 2
8791"
Title Page
Financial Analysis of Banks 59
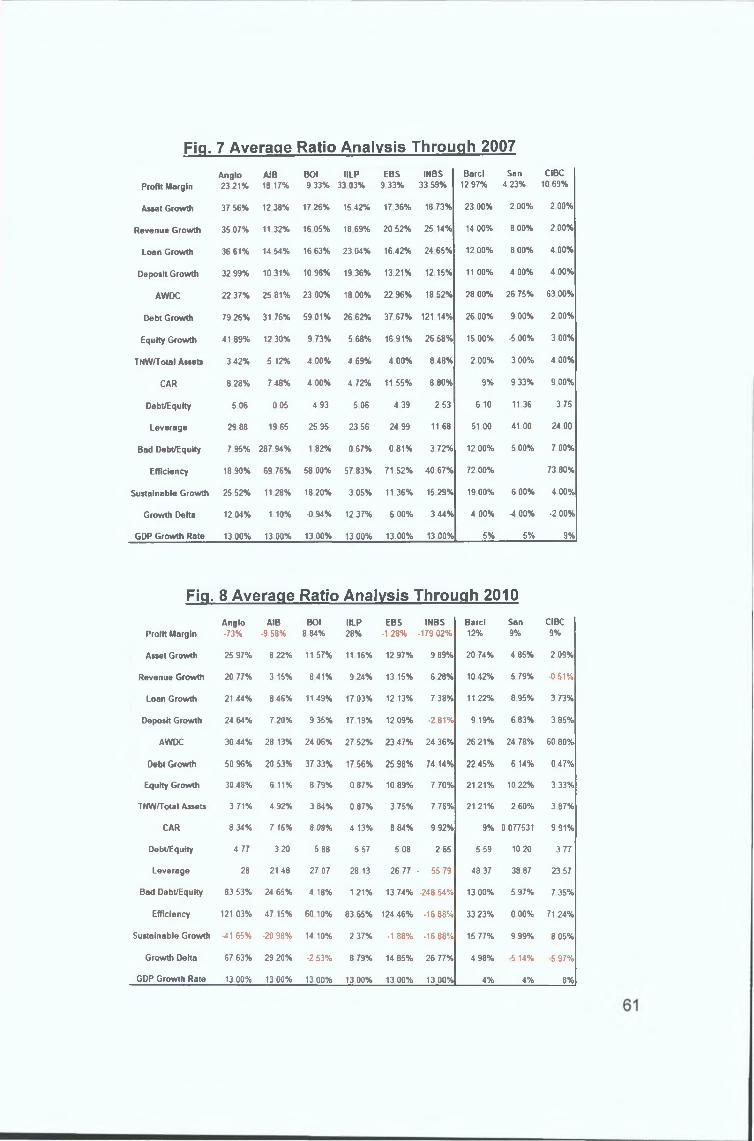
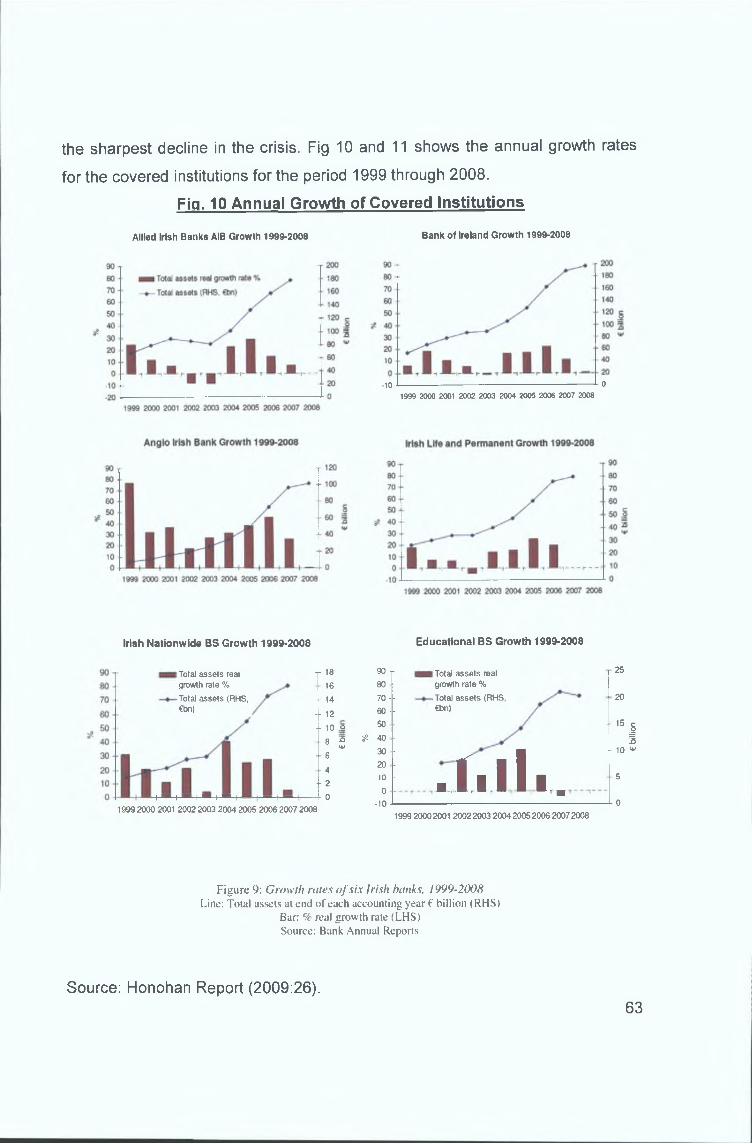
Summary of Financial Analysis 60
Introduction to Interview Analysis 68
Research Question 68
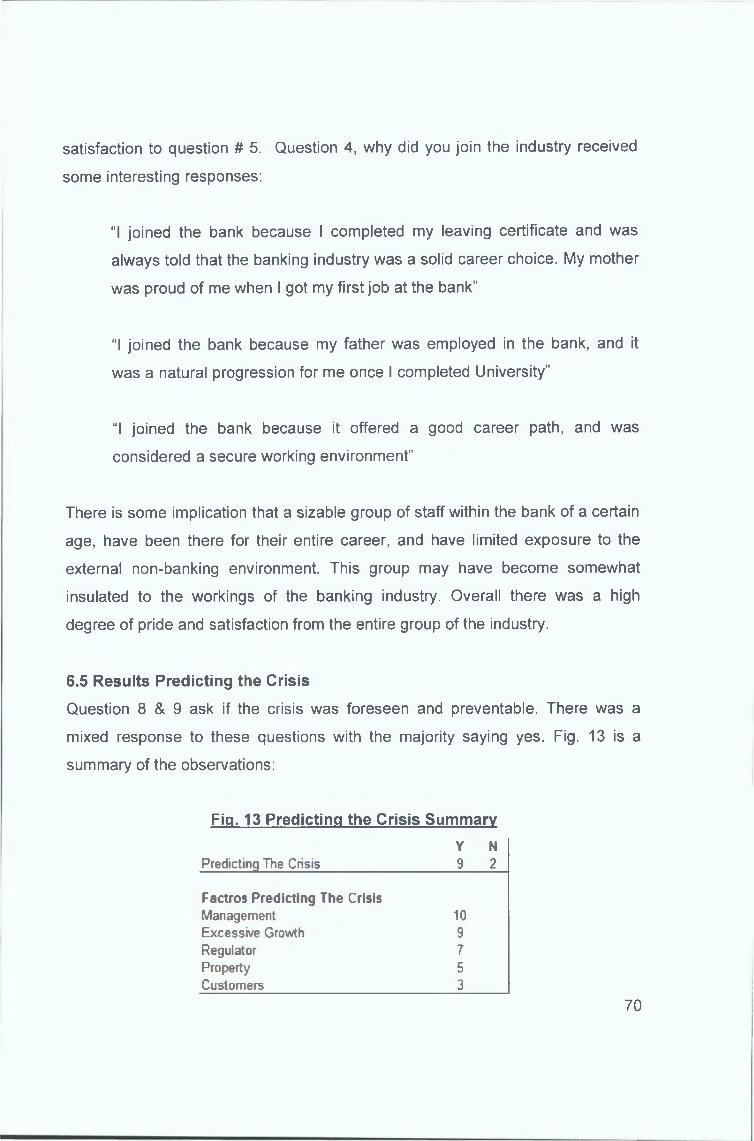
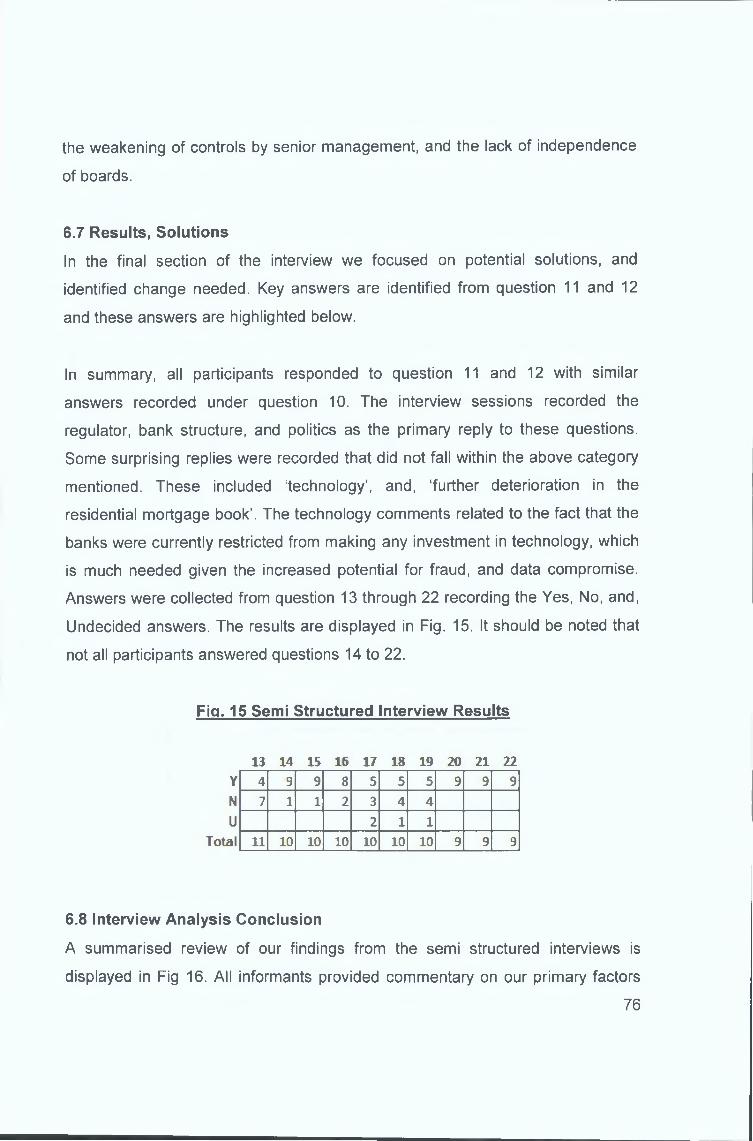
Interview Results Observations 69
Results, Quantitative Analysis 69
Results, Predicting the Crisis 70
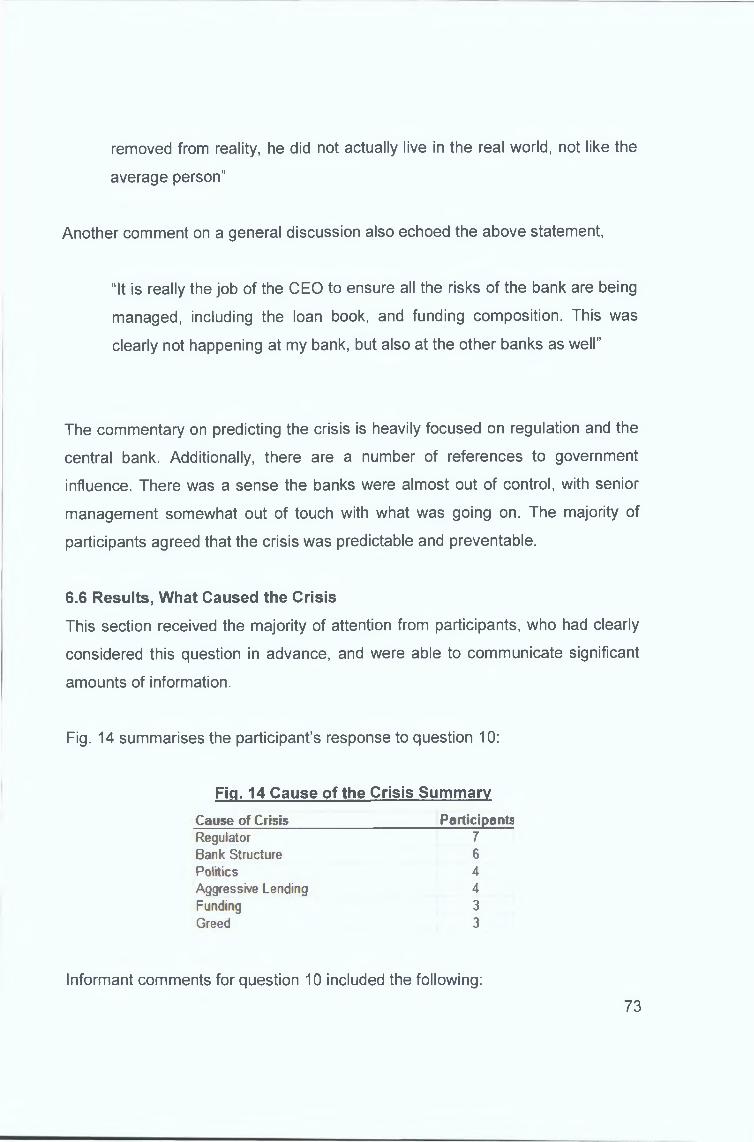
Results, What Caused the Crisis 73
Results, Solutions 76
Results Conclusion 76
Conclusion 79
Recommendation 81
Appendix 84
Bibliography 135
5
Page 7
11
29
30
36
37
39
61
61
62
63
64
65
70
73
76
78
83
TABLE OF FIGURES
Title_________________________________
Bank Guarantee Values
US Bank Failures, (FDIC)
Interest Rates in Japan
Bank Balance Sheet
GDP & National Debt
Irish Property Index
Average Ratio Analysis through 2007
Average Ratio Analysis through 2010
Sustainable Growth Formula
Annual Growth of Covered Institutions
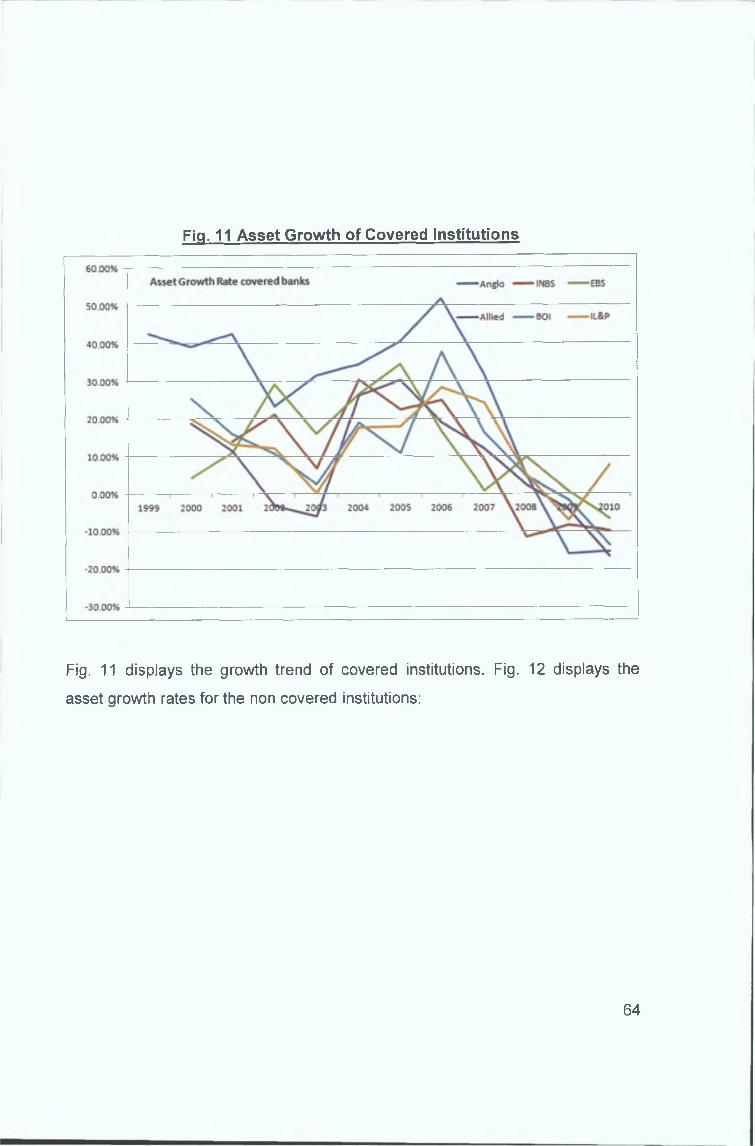
Asset Growth of Covered Institutions
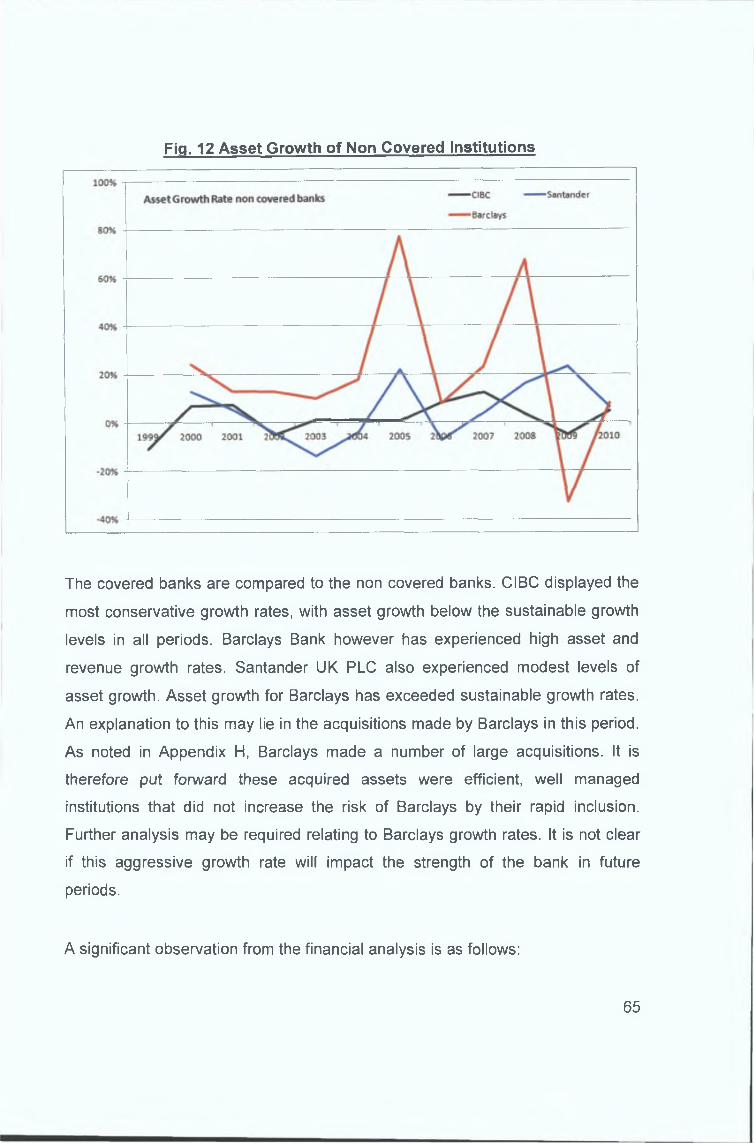
Asset Growth of Non Covered Institutions
Predicting the Crisis Summary
Cause of the Crisis Summary
Semi Structured Interview Results
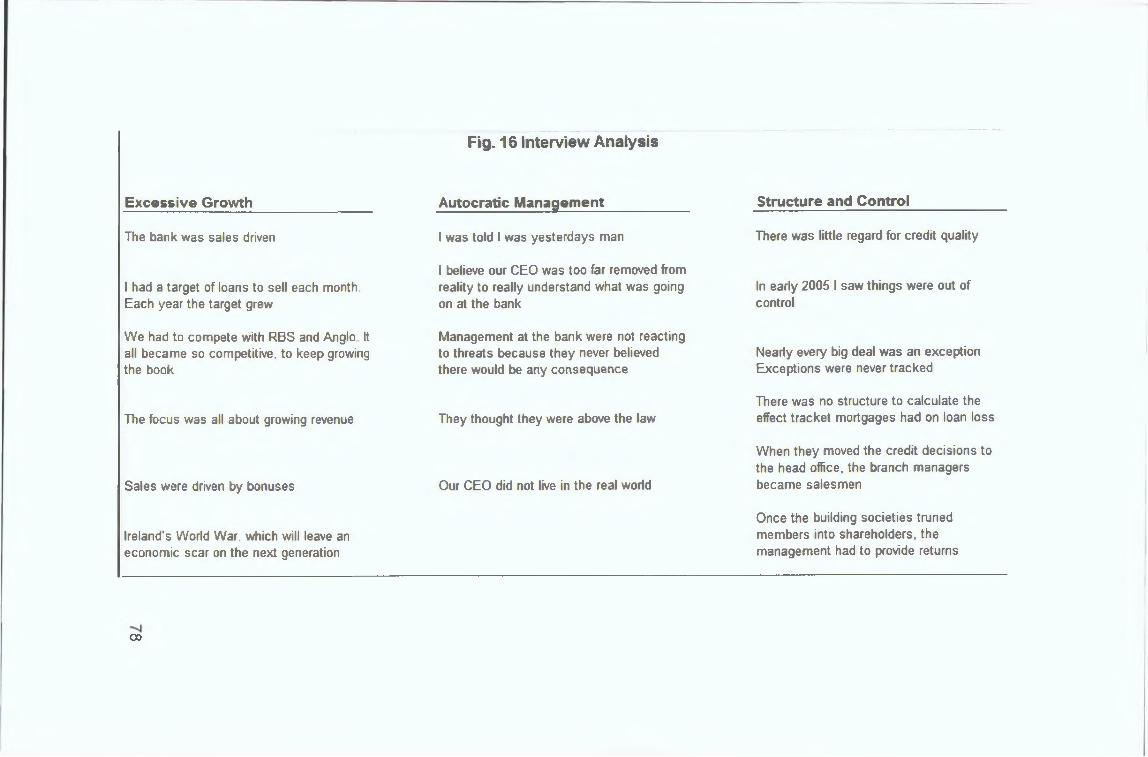
Interview Analysis
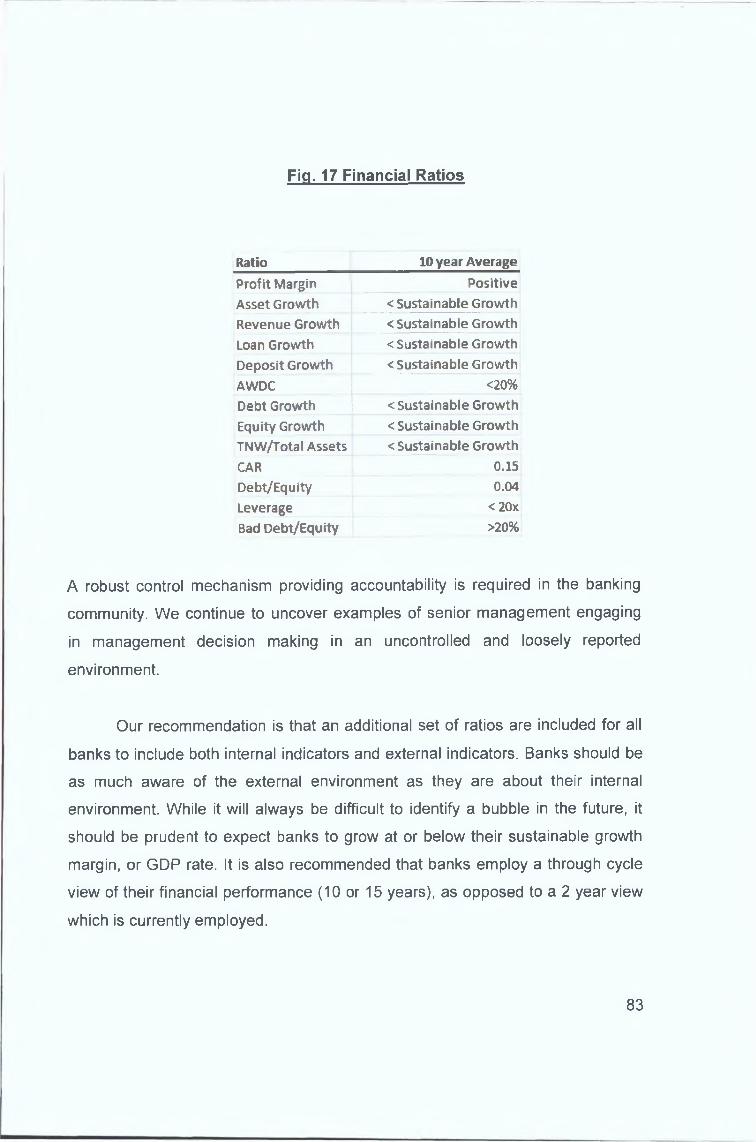
Financial Ratios
Page 8
TABLE OF APPENDIX
Appendix Title____________________________________________________________ Page
A Irish Banks in 1800 84
B The History of Joint Stock Banks 86
C Summary of Six Covered Institutions 88
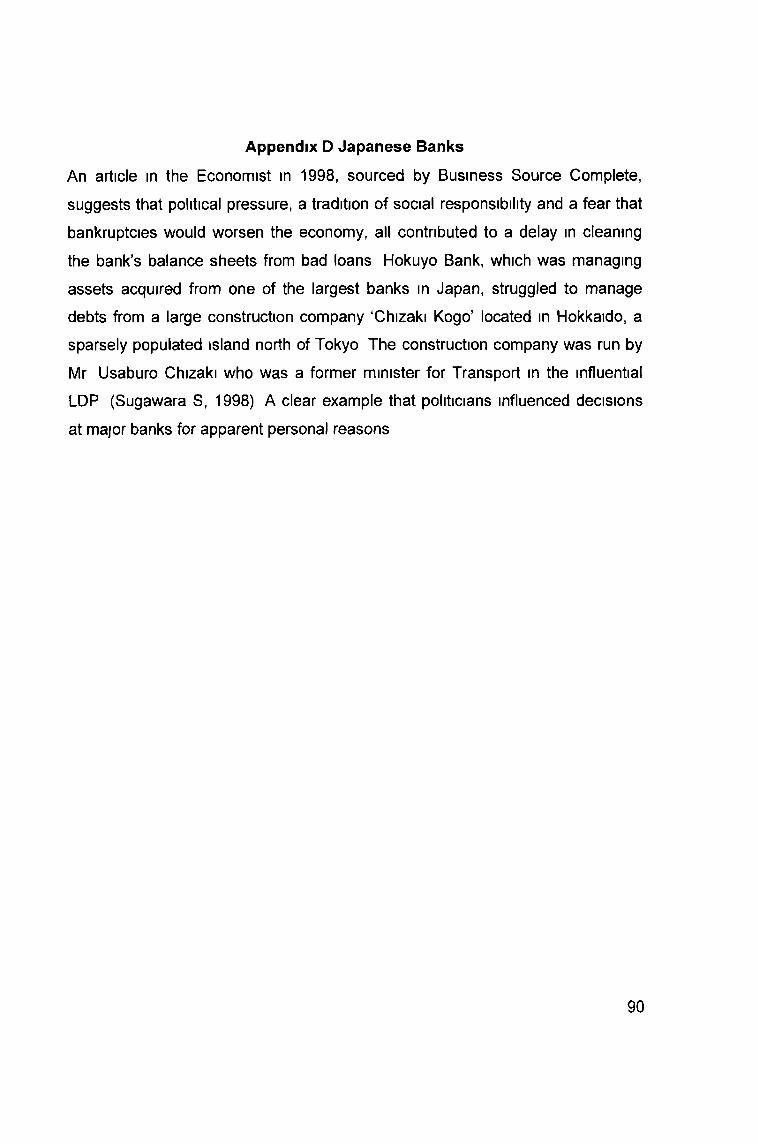
D Summary of the Six Covered Institutions 90
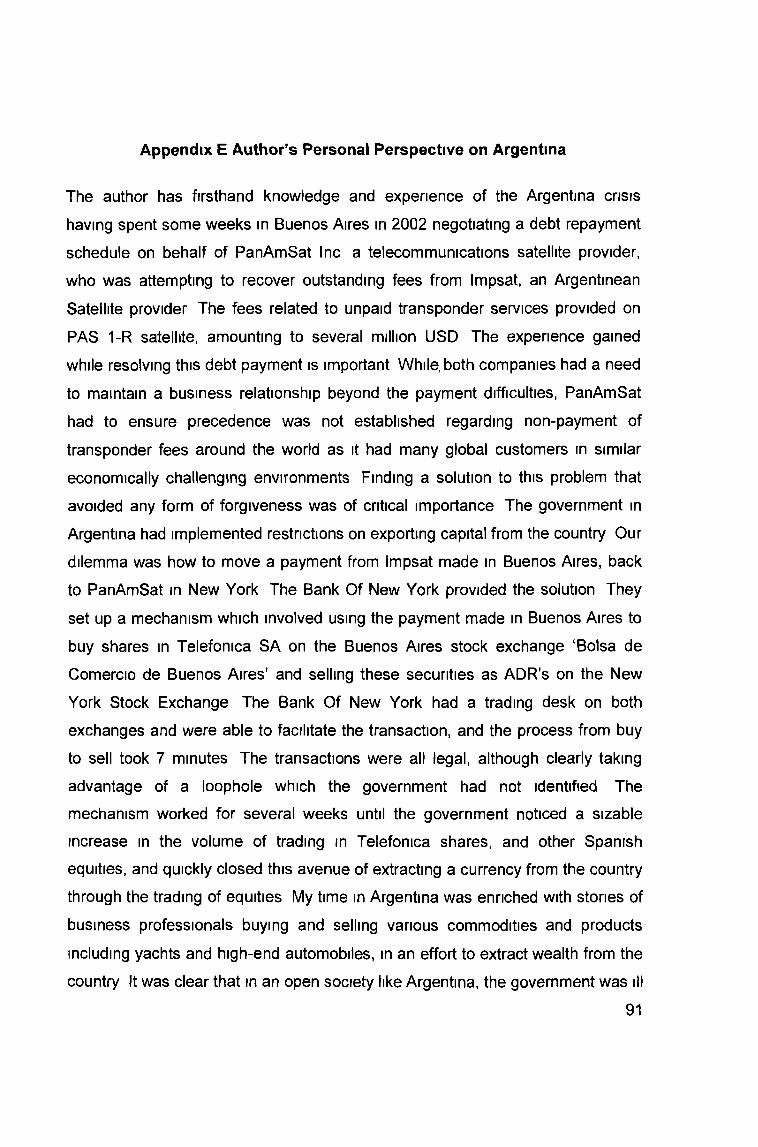
E Author’s Personal Perspective on Argentina 91
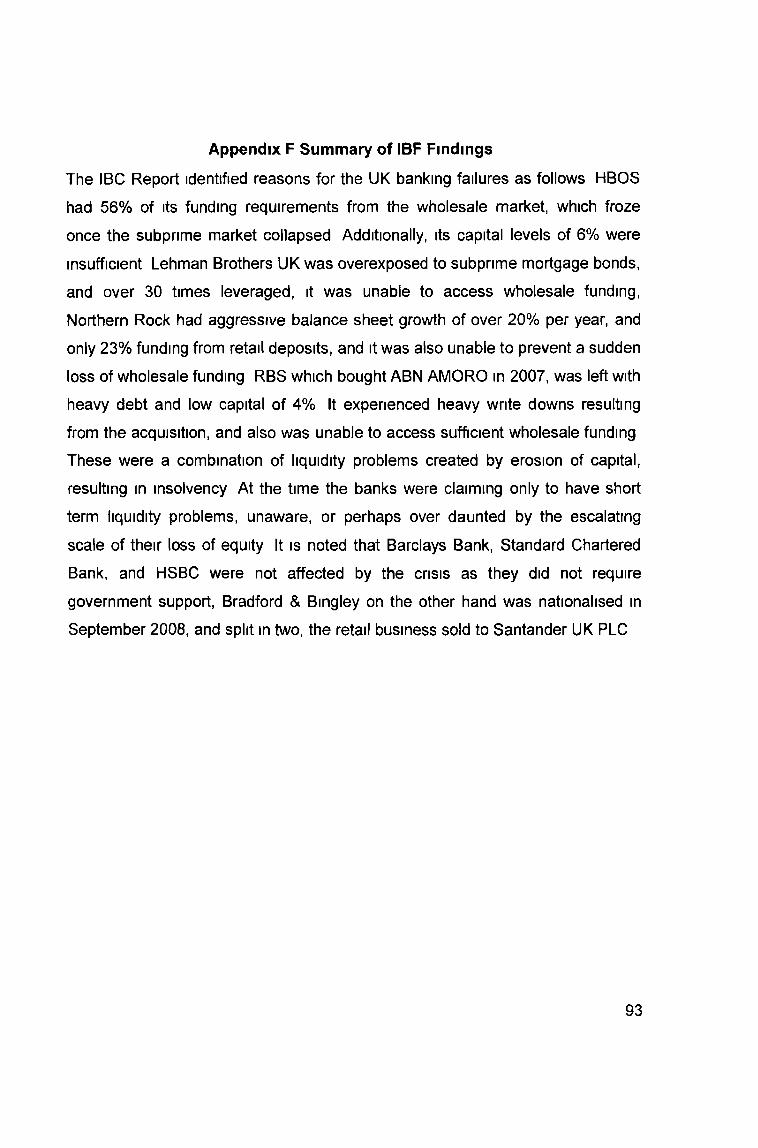
F Summary of IBF Findings 93
G The Five Elements of Credit 94
H Summary of Financial Analysis 96
I Key Informants Detail 108
J Interview Questions 112
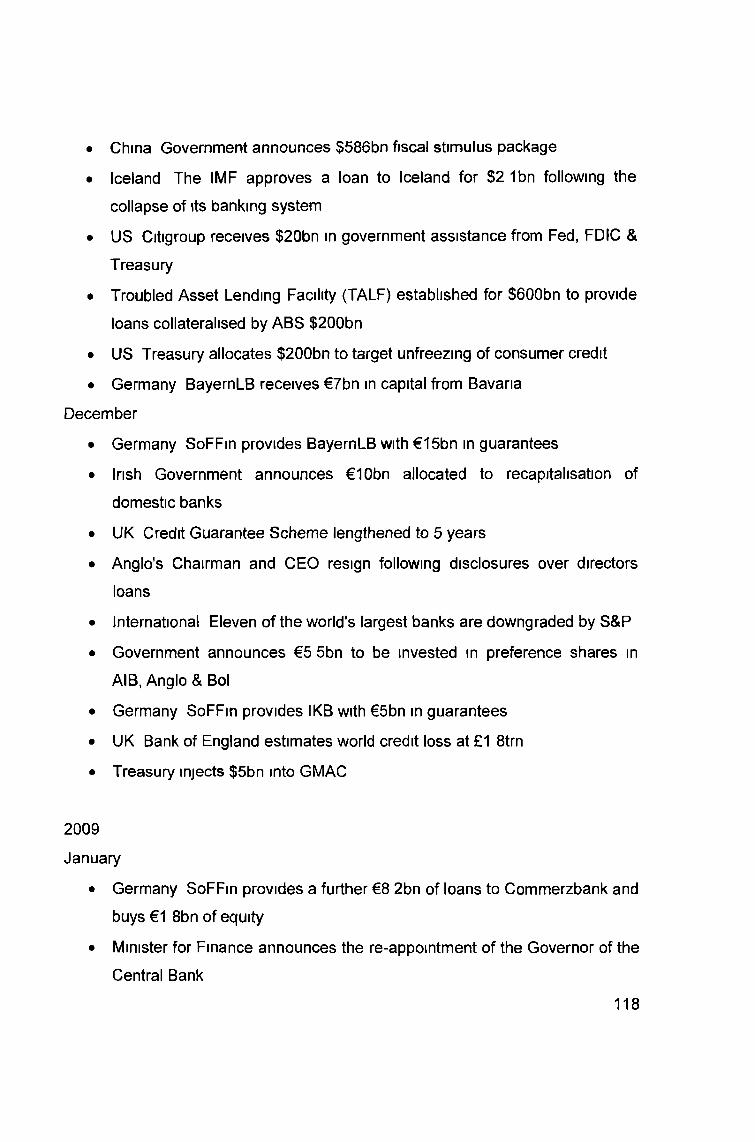
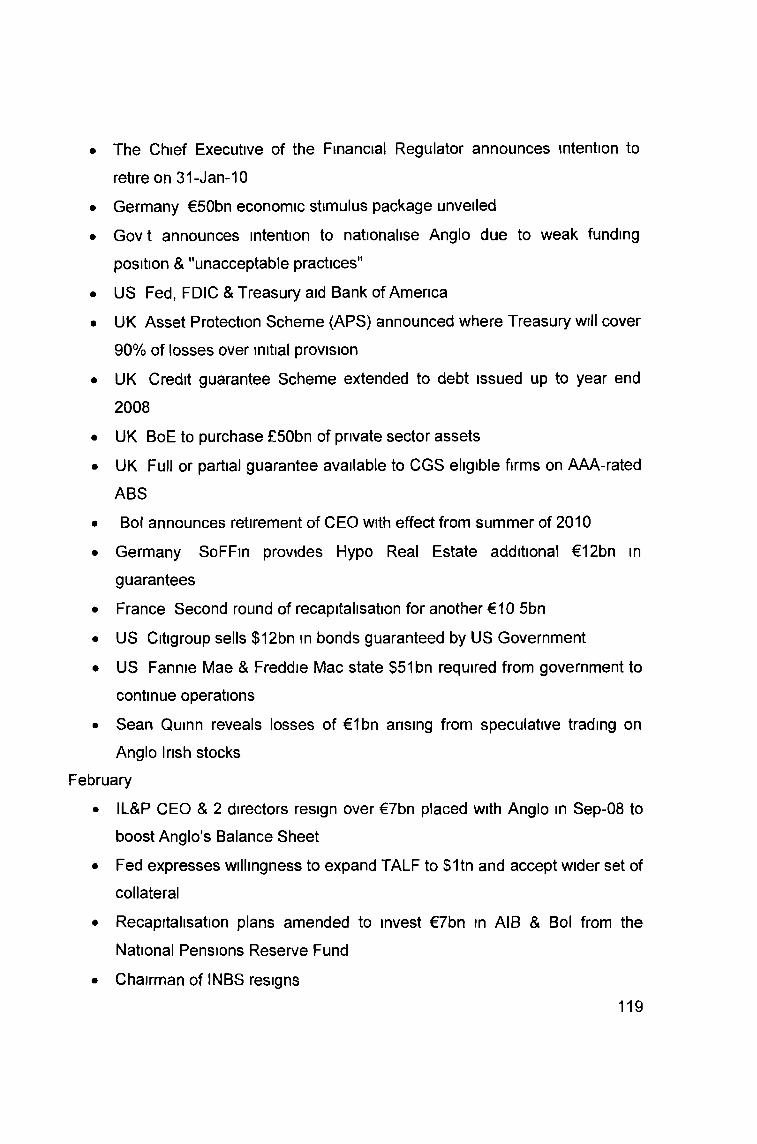
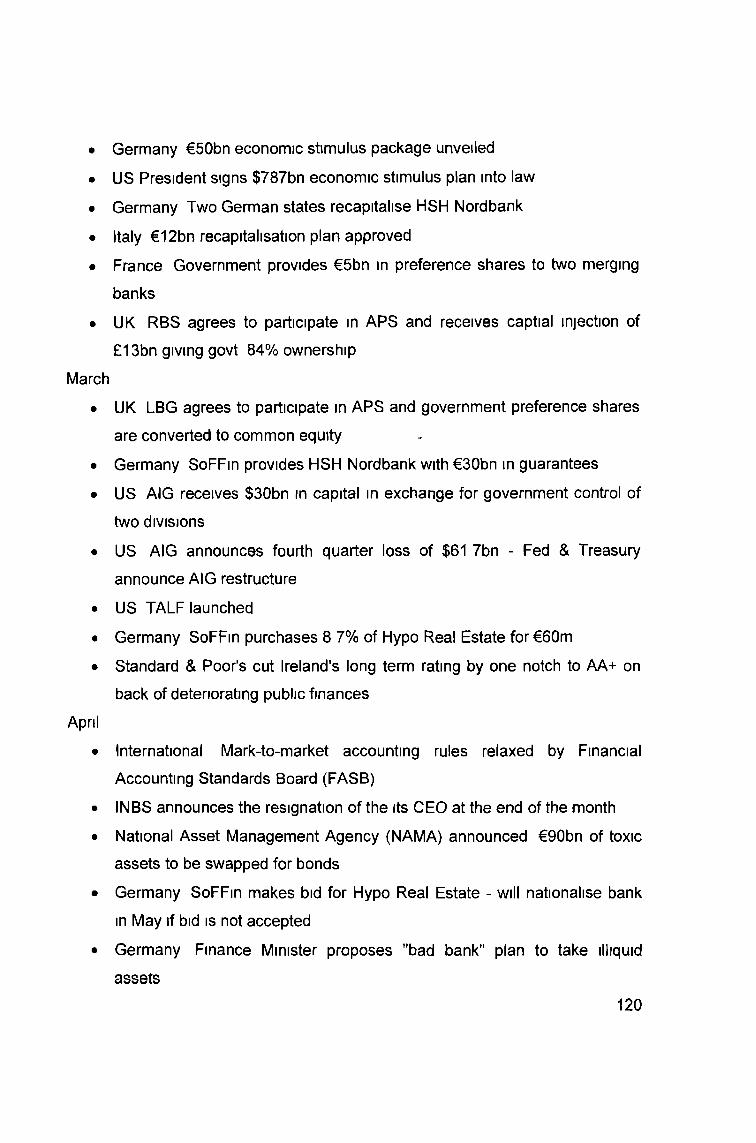
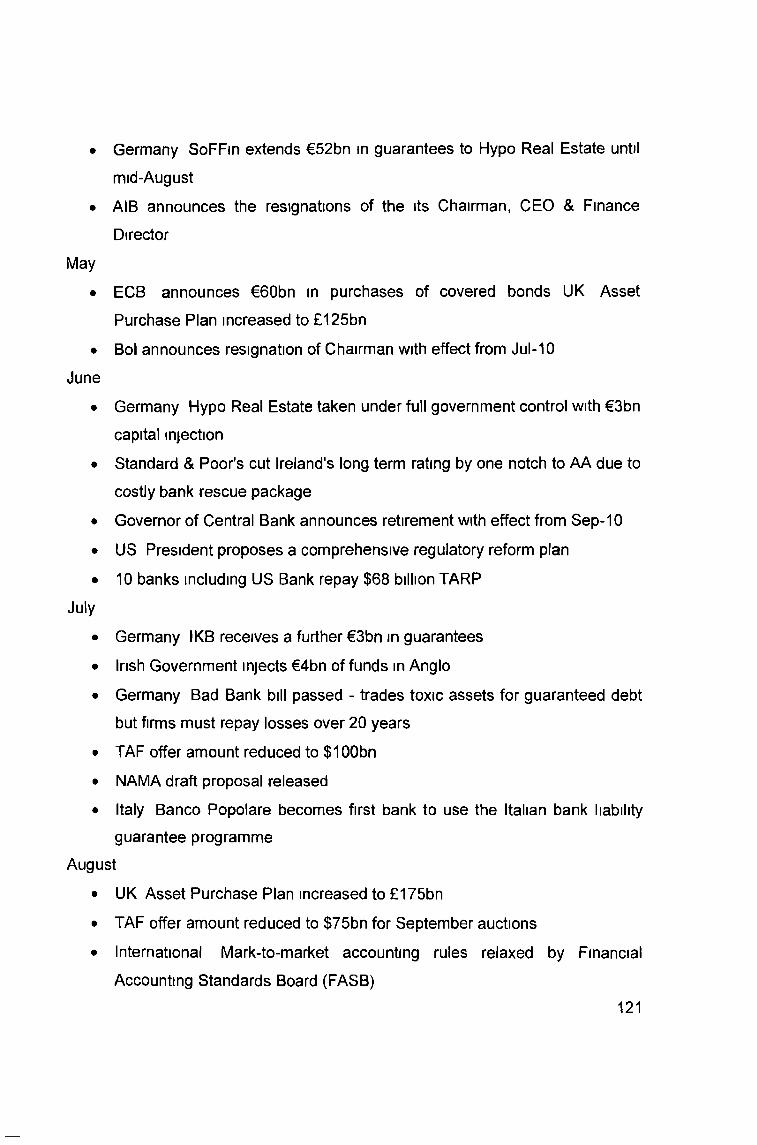
K Chronology of Events 113
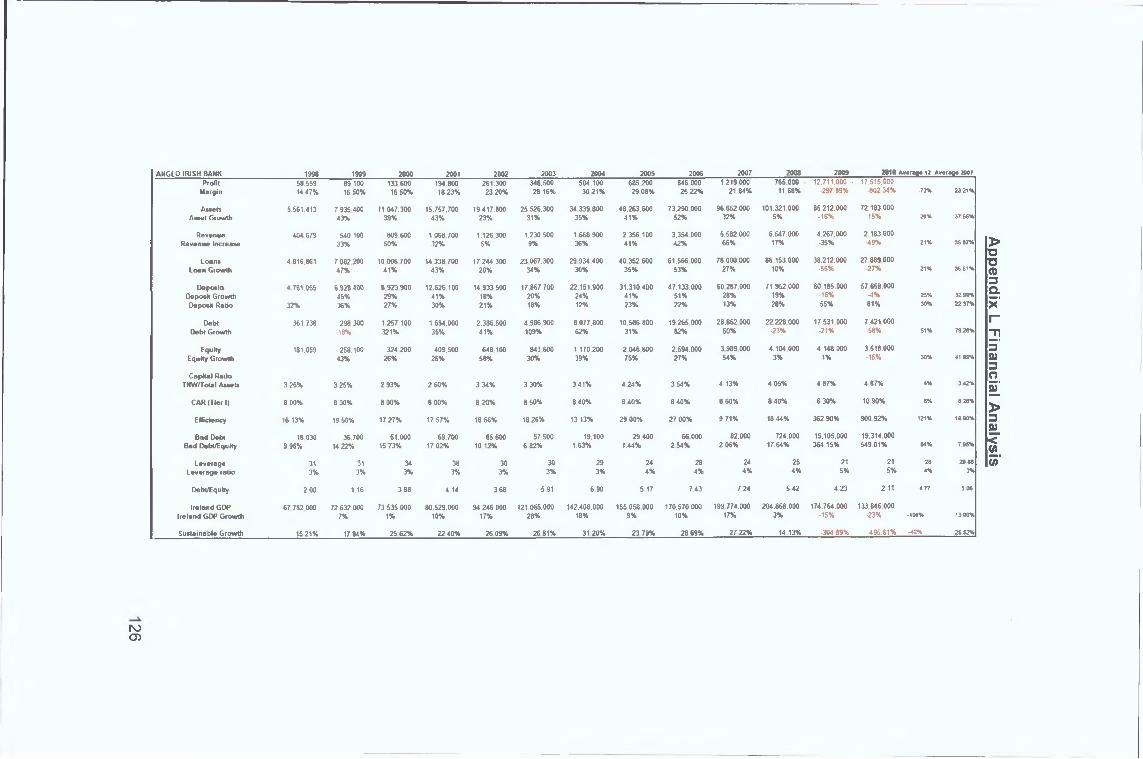
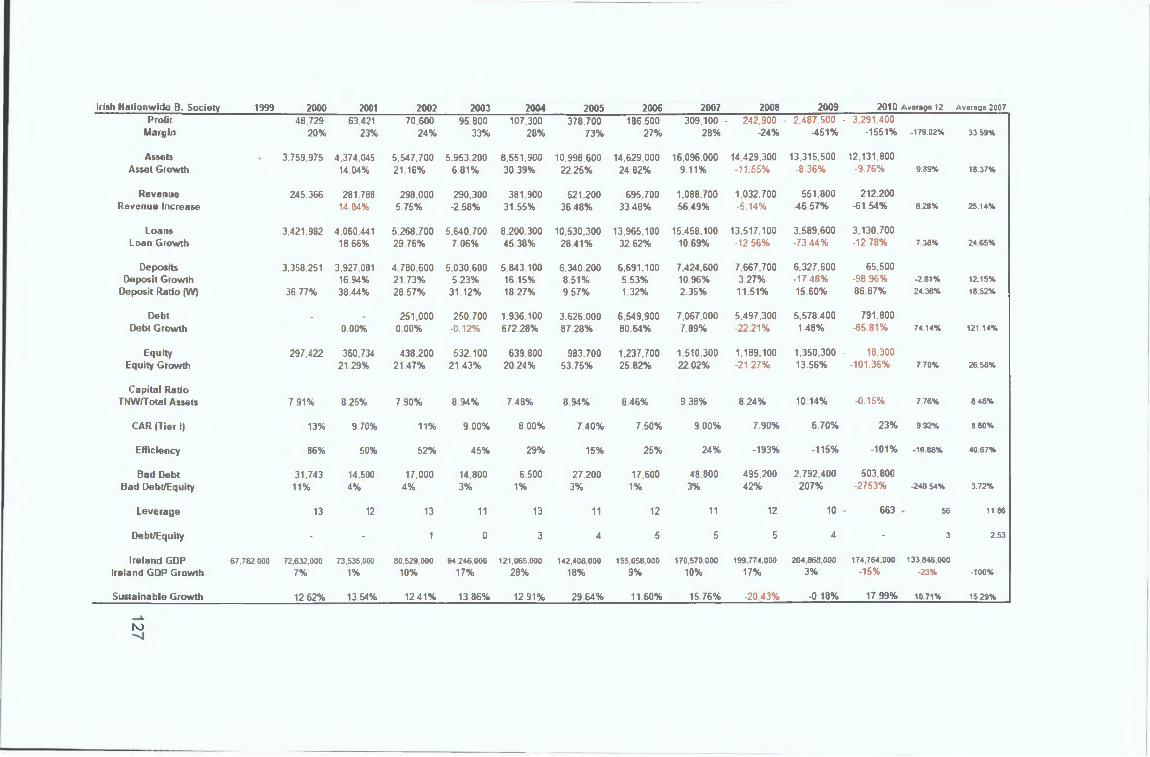
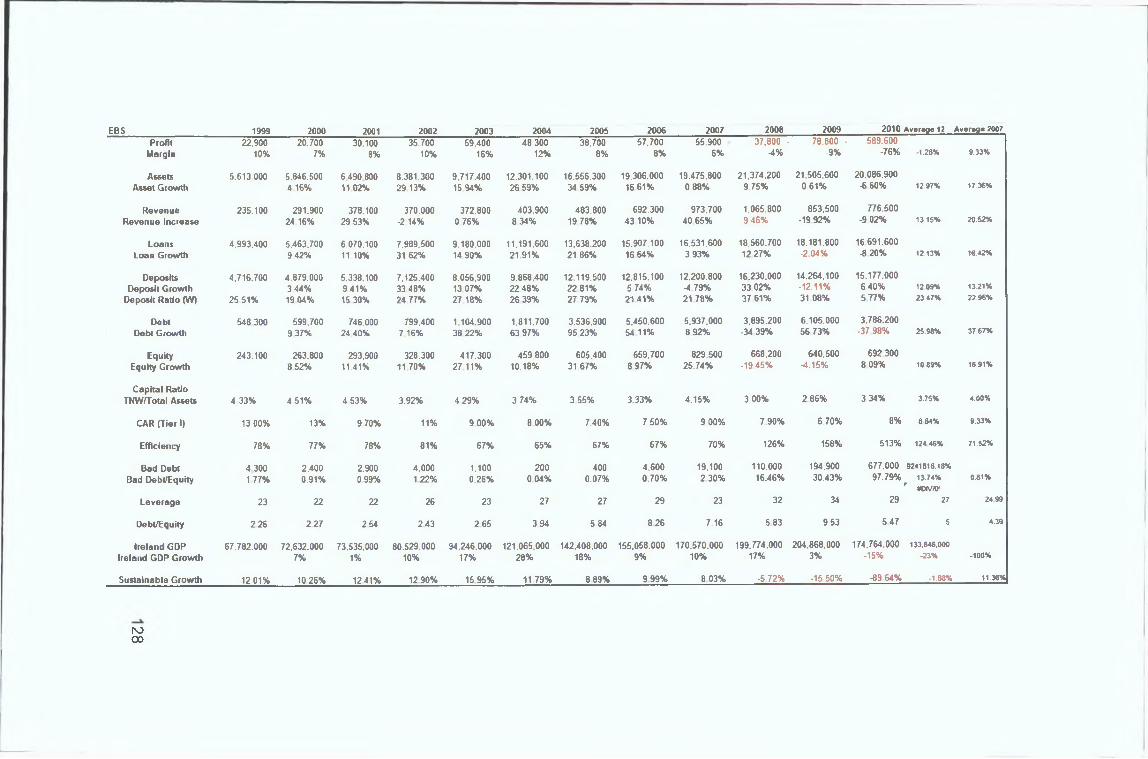
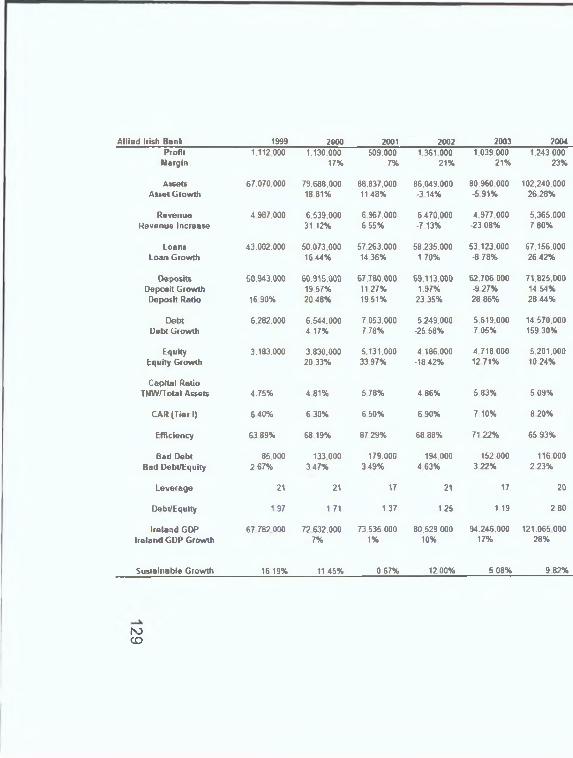
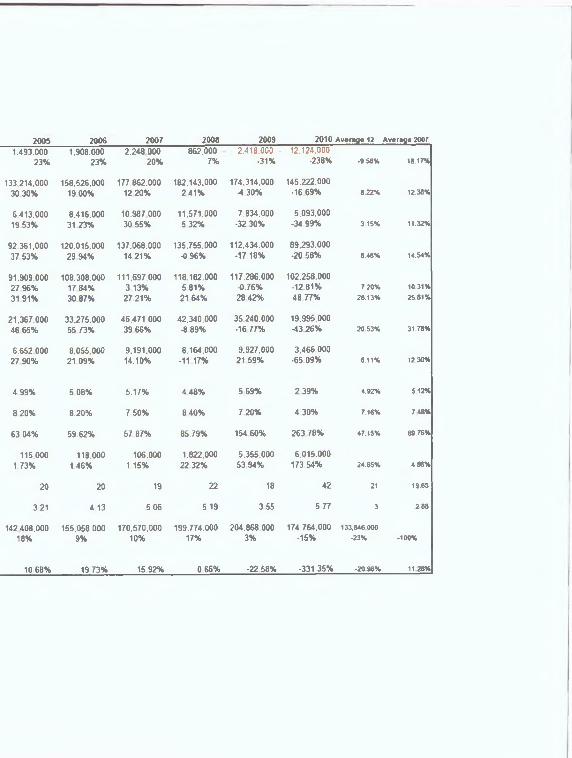
L Financial Analysis 126
7
Page 9
1 11ntroduction
Charles Kindleberger wrote that, “Capitalism without failure is like religion without
sin”, (2009 61) As with religion, the banking system in Ireland has been the
subject of much controversy The system experienced a shock wave so severe it
crippled not only banking, but arguably pushed the State into insolvency Unable
to refinance government debt, the State resorted to emergency financing from
the IMF, relinquishing partial control over fiscal policy According to the World
Bank, this is the 85th crisis the world has witnessed, (Persaud 2009)
This research is intended to diagnose the cause of the financial crisis in Ireland
The diagnosis is based on a literature review of previous crises, a financial
review of the Irish covered institutions, and, a semi-structured interview with key
informants We explore how a system of banking can continue to repeat
seemingly systemic collapse Understanding the type of crisis is critical in the
diagnostic process, and, is important in recommending effective crisis resolution
policies, (Marshall 2009) Our analysis of empirical evidence provides
confirmation of a ‘classic’ banking failure occurring in Ireland The failure was
caused by three primary factors
1) The structural deficiencies evident in the existing banking model
Structural deficiency plays a key role in the principle-agent theory that has
led to the ongoing moral hazard debate The history of Irish Banking will
provide key insights to this issue
2) The autocratic management stvle that existed throughout the banking
system This management style failed to recognise the warning signs, and,
was unaware of the dangerous consequences of management decisions
These actions have been repeated in history with similar consequences
CHAPTER 1
8
Page 10
3) The un-sustainabilitv of growth levels experienced in the banking
industry Excessive growth rates have been synonymous with banking
failure The financial analysis highlights the unsustainable excessive
growth within the covered institutions
These represent the primary factors evidenced throughout the analysis
One of the recognised difficulties in completing this work has been the continual
developments both in Ireland and globally in the financial industry As the
continent wrestles with the Euro crisis, we continue to read new stories of
problems within banking This is made ever more evident by recent
developments at Barclays Bank surrounding the LIBOR scandal Every effort is
made include the most relevant and up to date news stories as they impact the
research
1 2 Structure
Chapter 1 contains an introduction to the subject of bank failures
Chapter 2 contains a critical literature review of a selection of banking failures,
beginning with a brief history of money and banking in Ireland The literature
review will look into some selected bank crisis beginning with the first Irish bank
crisis of the 1820s This review will provide evidence of the importance of
diagnosing financial crisis before attempting to assess the cause, and identify
factors associated with bank failure
Chapter 3 provides an analysis of banks and an understanding of capital
adequacy, the key financial indicator of banks, and a study of the Basel accord
9
Page 11
An understanding of banking and credit, including the five elements of credit is
explored
Chapter 4 includes an analysis of our methodology
Chapter 5 contains a financial analysis of the six covered institutions, Anglo Irish
Bank, Bank of Ireland, Allied Irish Bank, EBS Bank, Irish Nationwide Building
Society, and, Irish Life & Permanent Additionally, we will compare our financial
analysis with banks that operated through the crisis that did not require
government support This analysis will include Barclays Bank, Santander UK
PLC, and CIBC, three banks that operated similar business models in
comparable markets
Chapter 6 will conclude with key learnings taken from the research, including the
literature review, the financial analysis, and the semi-structured interviews The
developments of key factors that will help identify bank weakness The
conclusion will outline key factors in bank failures, and the implications for
various stakeholders in banking
Chapter 7 Appendix
1 3 Background to the Irish Banking Crisis
On September 28, 2008, the Irish Government signed into law, the Bank
Guarantee which provided
“With immediate effect a guarantee arrangement to safeguard all deposits
(retail, commercial, institutional and interbank), covered bonds, senior debt
and dated subordinated debt (lower tier II), with the following banks Allied
Irish Bank, Bank of Ireland, Anglo Irish Bank, Irish Life and Permanent,
10
Page 12
Irish Nationwide Building Society and the Educational Building Society and
such specific subsidiaries as may be approved by Government following
consultation with the Central Bank and the Financial Regulator”, (Lenihan
2008).
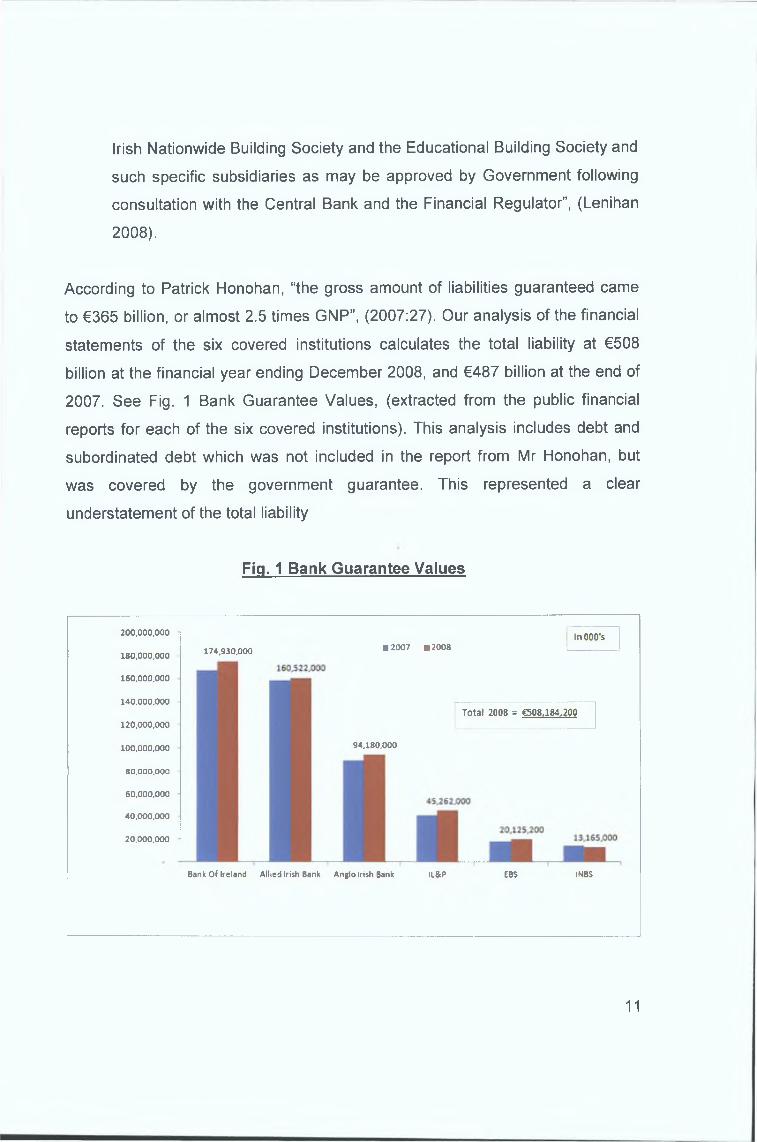
According to Patrick Honohan, “the gross amount of liabilities guaranteed came
to €365 billion, or almost 2.5 times GNP”, (2007:27). Our analysis of the financial
statements of the six covered institutions calculates the total liability at €508
billion at the financial year ending December 2008, and €487 billion at the end of
2007. See Fig. 1 Bank Guarantee Values, (extracted from the public financial
reports for each of the six covered institutions). This analysis includes debt and
subordinated debt which was not included in the report from Mr Honohan, but
was covered by the government guarantee. This represented a clear
understatement of the total liability
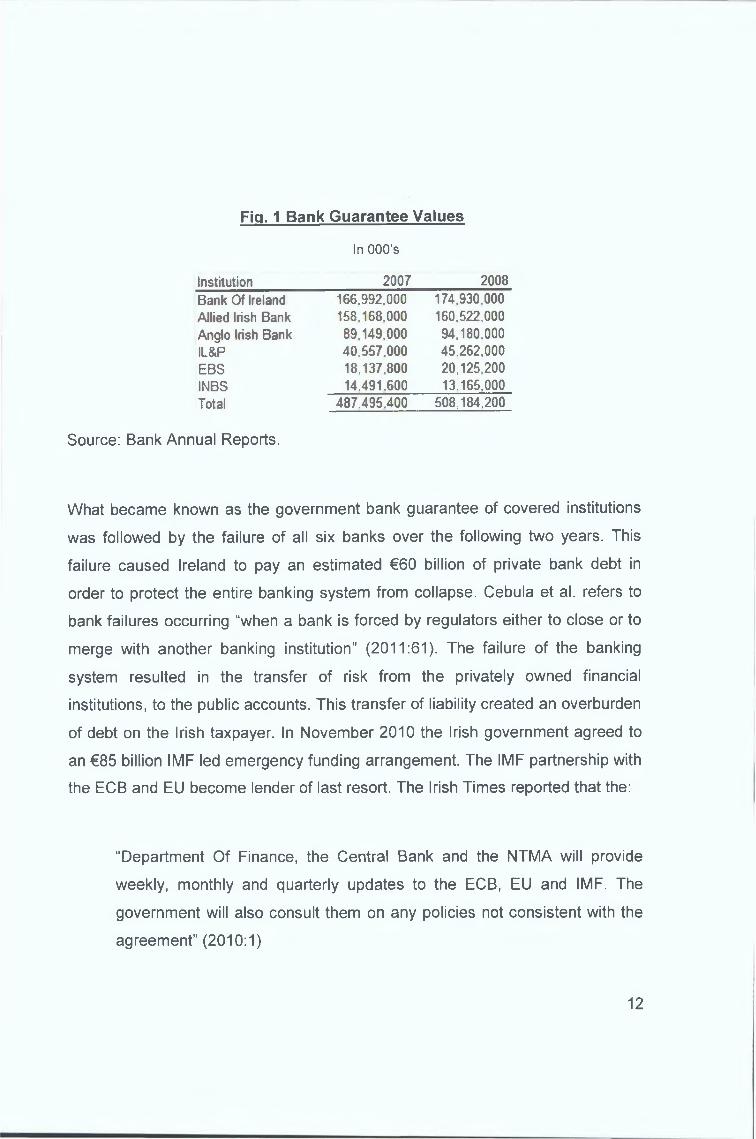
Fig. 1 Bank Guarantee Values
200,000,000 InOOO's174,930,000 ■ 2007 B2008
180,000,000
120,000,000
100,000,000
140,000,000
160,000,000
20.000.000
40,000,000
60,000,000
80,000,000
94,180,000
Total 2008 = €508,184.200
Bank Of Ireland Allied Irish Bank Anglo Irish Bank IL&P EBS INBS
11
Page 13
Fig. 1 Bank Guarantee Values
In OOO’s
Institution 2007 2008
Bank Of Ireland Allied Irish Bank Anglo Irish BankIL&PEBSINBSTotal
166.992.000 174,930,000158.168.000 160,522,000
89.149.000 94,180,00040.557.000 45,262,00018,137,800 20,125,20014,491,600 13,165,000
487,495,400 508,184,200
Source: Bank Annual Reports.
What became known as the government bank guarantee of covered institutions
was followed by the failure of all six banks over the following two years. This
failure caused Ireland to pay an estimated €60 billion of private bank debt in
order to protect the entire banking system from collapse. Cebula et al. refers to
bank failures occurring “when a bank is forced by regulators either to close or to
merge with another banking institution” (2011:61). The failure of the banking
system resulted in the transfer of risk from the privately owned financial
institutions, to the public accounts. This transfer of liability created an overburden
of debt on the Irish taxpayer. In November 2010 the Irish government agreed to
an €85 billion IMF led emergency funding arrangement. The IMF partnership with
the ECB and EU become lender of last resort. The Irish Times reported that the:
“Department Of Finance, the Central Bank and the NTMA will provide
weekly, monthly and quarterly updates to the ECB, EU and IMF. The
government will also consult them on any policies not consistent with the
agreement” (2010:1)
12
Page 14
This represented an abdication of control of government fiscal policy to the IMF
The Minister for Finance in revealing the government budget on December 7th,
2010 claimed
“Since I was appointed as Minister for Finance in May 2008, I have been
dealing with the worst crisis in our history and one that has few
international parallels’ (Lenihan 2010)
Our research demonstrates the crisis has very clear parallels with historical
events This appears to be a misdiagnosis from the onset
The Irish and Euro banking crisis represents the largest crisis to face both the
Euro members and the Irish government, according to Jose Manuel-Barroso, the
head of the European Commission
“Irish banking, whose history stretches back to the 1700s, now faces its
biggest crisis ever Whether there will be a recognisable ‘Irish’ banking
industry at the end of it will depend on the will of the industry, its
customers, and the other major stakeholder, the state” (2011 1)
It is critical for these stakeholders to accurately diagnose the crisis before
attempting to prescribe a solution
The build-up of debt and loss of confidence resulted in pressure for other banks
and sovereigns in the Euro zone Greece, Portugal, and Spain, have sought
Troika emergency funding due to the unavailability of liquidity in the open bond
market The crisis in Spain has been complicated by debt laden insolvent banks
Spanish banks have also experienced large losses driven by property lending In
other markets, banks including Northern Rock, Royal Bank Of Scotland, Lloyds
TSB, HBOS, Fortis, Dexia, and, Hypo Real Estate, have suffered failure in recent
13
Page 15
times, (Pisam & Sapir, 2010), (Graafland & Van De Ven, 2011) These failures
have resulted in the intervention of government funds and the transfer of risk
from the banks to the taxpayer to protect depositors, (Kindleberger 2009) The
threat of depositors leaving has always been a fundamental check on the
responsibility of bankers, (Kindleberger 2010) The crisis in Ireland is not an
isolated incident The banking systems both in Europe and the US have
experienced stress and collapse
This study will explore and identify factors in the banking system that triggered
the collapse In order to embark on this study, we begin with a literature review,
starting with a brief history of banking While it would be ideal to include a study
of all previous banking crises, we have limited the analysis to a selected group as
they all have some relative connection to our study
14
Page 16
CHAPTER 2
2 1 Literature Review
The literature review will begin by first understanding banking and the history of
money The purpose of this review is to identify the deference between bank
products (money), and bank activity According to Valentine & Mason, (1976 98)
a bank performs three primary functions
1) Accept deposits from customers
2) Transfer of deposits from one account to another
3) Lending of money to customers
Money forms the basis for all banking activity As banking evolved, historical
events in the region helped shape the practice of banking into what exists today
Historical events also provided challenges and adversity which demanded
adaptability for survival Many banks succeeded in the quest to survive and grow,
while others failed The history of money is filled with tales of assertive
uncompromising leaders, who challenged authority, and were aggressively
autocratic in finding solutions This understanding is critical in our effort to
correctly diagnose the crisis
The evolution of money begins with the trading of goats and sheep with barter
trade in more primitive societies, (Coggan 1986) Davies ‘History of Money'
confirms that money did not have a single origin, but rather developed in different
parts of the world at different stages Cowrie shells were used as coins in ancient
China and Western Africa, (Rena 2007) Precious metals soon became a more
convenient form of money When receipts for precious metals became easier to
carry and trade than the gold itself, the world was introduced to finance The first
coins were created by the Kings of Lydia in 600 BC, in present day Turkey,
(Coggan 1986) Emperor Hien Tsung of China developed paper money in 806-
15
Page 17
821 as a substitute for copper coins, (Rena 2007) The paper money was first
used as a receipt for copper coins to pay off potential invaders from the north As
more invaders arrived, hyperinflation ensued, with paper money loosing value
due to an increased supply, (Rena 2007) By 1445 following many successive
periods of hyperinflation, China abandoned the use of paper money, (Rena
2007) McGowan (1988) of the Irish Central Bank writes of Irish coinage They
were first issued in Ireland by the Norse Settlement in Dublin during the 990s’
(1988 23) While the origin of banking is not associated with a single event in
history, Rena and Davies both argue that ancient Mesopotamia in modern
Greece saw the creation of banking The Royal Palace and Temple was used to
store grain and various other commodities The receipts for grain were traded on
a secondary basis, resulting in the earliest forms of bills of exchange In 1272
King Edward I granted land in London to Italian goldsmiths who traded in gold
and silver The goldsmiths used benches on open streets to trade, and the word
bank was derived from ‘banco’ Italian for bench, (Coggan 1986) At Mount Hira in
Mecca where Prophet Muhammad received divine revelations of Islam in 610,
the city was bustling with trade Wealthy businessmen would deposit their
valuables, gold and silver for safe keeping However one of the Prophets
companions Az-Zubair refused to hold wealth as a deposit for fear it would be
lost, and rather treated the deposit as a loan, ‘qard’, which would be repaid when
the owner returned with interest, or ‘riba’, (Haron et al 2009 48) The use of
cheques was introduced in Iraq in 1010, with markets accepting notes written by
money lenders in return for goods at market, (Haron et al 2009) Banking
became a major industry in the 1340’s with the Medici family Ferguson portrays
the Medici brothers as more like gangsters than bankers, “between 1343 and
1360 no fewer than five Medici were sentenced to death for capital crimes”
(2008 42) As the bank developed in later years, it formed a solid reputation for
trading in bills of exchange, and as a currency trader The regulator of the day
was the Catholic Church which condemned the charging of interest The Medici
family overcame this by trading bills of exchange at discounts in return for
16
Page 18
outstanding loans, circumventing the regulator By 1458 the family had become
so powerful that the Pope Pius II claimed of the family
“Political questions are settled at his house, the man he chooses holds
office, he it is who decides peace or war and controls the law He is King
in everything but name” (Ferguson 2003 46)
The Medici family was a reflection of the Roman totalitarian style of leadership
According to Girardone & Molyneux (2006 4), a bank is a financial intermediary
whose core activity is to provide loans to borrowers and to collect deposits from
savers In 2006 Amy Kalar references Karl Marx who declared
“Not even the bones of the saints were exempt from being converted into
the colourless quality-less thing, Money” (2006 71)
Kalar also quotes George Simmel’s book The Philosophy of Money (1978)
Simmel discusses the transition from barter to money Moving society from an
emotional society where people trade gifts and actions in the form of goats, wives
and labour, to an intellectual society where people use money, while providing a
benefit of calculability, divisibility and exactitude The transition expanded social
distance according to Simmel, as money provided a more utilitarian approach to
trade Simmel, along with Marx, describe money as a new world of sterility and
soullessness
History illustrates the key fact that money evolved from many different cultures
over time It continues to evolve and reshape in recent history with the creation of
new currencies’ such as the Euro Additionally new financial products continue to
evolve in the form of derivatives, securitisation, credit default swaps,
collateralised debt obligations etc As we diagnose the crisis, it is important to
17
Page 19
distinguish evolving product, from the actions and activities that cause bank
failure
2 2 Banking m Ireland, a Brief History
In Ireland, banking can be traced back to the 1670s when C Hoare & Co
established a bank in Ireland, as an offshoot of their UK bank established by Sir
Richard Hoare (Barrow 1975) Hoare originally started his business life as a
Goldsmith in the 1650s in London He began trading receipts and bills of
exchange with customers gold deposits An original director of the South Sea
Company, Hoare sought out wealthy well connected customers as clientele,
(Laurence 2008) Customers consisted mainly of landed aristocrats and gentry,
MP’s and office holders, and clergy In Ireland the business was bought by Pike’s
Bank (Cork) in 1740 Pike’s bank closed in 1826 when the bank stock was
transferred to The Bank of Ireland, (Laurence 2008)
In 1709 the term bank first appeared in Irish law where notes issued by any
“Banker, goldsmith, merchant or trader which were payable to any person
or persons, his her or their order, shall be assignable or endorsable over in
the same manner as inland bills of exchange”, (Barrow 1975 1)
This provided a new level of trade above merchant trade, which formed the
beginning of the Irish banking system In 1782, the Irish Parliament passed an
act which authorised the issuance of bonds which created the formation of the
Bank of Ireland, (Barrow 1975) Similar acts had passed in England (1708 Bank
of England Act) and Scotland (1695 Bank of Scotland Act) The bank operated
from its head office on College Green The building built in 1739 was previously
the Parliament building until the Home Rule Act of 1801 The building reflected
the prominence and importance of the bank in society The bank commanded
power, and operated under the control of an autocratic British government The
18
Page 20
bank charter specifically required all other banks in Ireland involved in note
issuance were restricted to partnership structures, (Hickson & Turner 2005) The
number of partners was limited to 6 The restriction on shareholders resulted in
small numbers of banks The limited partnership structure created a weak
shareholder base which provided vulnerabilities There were approximately 11
private partnership banks in 1800 in Ireland according to Hickson A Turner,
however this number grew A number of these banks failed due to poor
management Newcomen’s Bank failed in 1722 due to ‘slovenly and wasteful
management’ Alexander’s Bank failed in 1820 due to heavy loan losses
Roche’s Bank Cork failed due to poor property loans Munster Bank failed due to
loans made to the owners which went unpaid, (Hickson & Turner, 2005)
There is a history of poor management and lending throughout the private
partnership era, with a degree of autocratic management style resulting in poor
lending decisions For more detail on the private partnership banks see Appendix
A
In the 1820s the industry experienced its first crisis with seven out of fourteen
banks closing in just two weeks, (Barrow 1975) While some authors have
attributed the banking crisis a result of the depression which followed the end of
the Napoleonic Wars, (Hickson & Turner 2005), it was also argued that both the
legal structure and the behaviour of the banks were a primary cause, (Barrow
1975) The Bank of Ireland provided the only security in this difficult time period,
jostling between the Bagehot Principle as it operated as a quasi-lender of last
resort, and avoiding evolving into a Central Bank under Charles Goodhart’s
Evolution of Central Banks The banking crisis was accelerated by a loss of
confidence in the system brought about by business failure Once confidence
was lost, customers created a run on the banks which were unable to liquidate
their positions
19
Page 21
According to Barrow
“Sound banking required that the volume of liabilities on which payment
would be demanded at any one time be balanced by the volume of assets
then available in liquid form A sudden extraordinary increase in demand
for payment beyond the level of liquid assets on hand would leave the
bank dependent for its survival on its ability to borrow enough to make up
the difference until sufficient assets matured”, (1975 200)
The government responded with The Bank of Ireland Restriction Act (1821)
which increased the partner quota system It was not until the Banking Co
partnership Regulation Act (1825) that enabled the joint stock bank structure, did
the banking sector recover From this period through 1880, there were
approximately eight large banks operating in Ireland, as joint stock companies,
(Barrow 1975) They became limited liability companies in 1880, (Hickson &
Turner, 2005) The joint stock banks included
• Agricultural & Commercial Bank
• Belfast Banking Company
• Hibernian Banking Company
• National Bank of Ireland
• Northern Banking Company
• Provincial Banking Company
• Royal Bank of Ireland
• Ulster Banking Company
From 1880 through 1922 when the Irish Free State was established, the bulk of
banks converted to limited liability banks The joint stock bank structure was an
important period in the history of banking in Ireland The structure provided
20
Page 22
unlimited liability to shareholders to losses incurred at the bank This encouraged
active management of daily operations That liability extended to 3 years after the
sale of shares, which prevented shareholders from dumping shares in times of
distress This eliminated the agency problem that exists today, Jensen &
Meckling (1976) The Joint stock system was an important era in the history of
Irish banking, as the unlimited liability of shareholders was linked directly to the
security of depositors Shareholders were closely involved in the governance of
the banks of joint stock companies (Hickson & Turner 2005) The 1836 Select
Committee on Joint Stock Banks claimed that the structure of limited liability of
shareholders while providing good security by having shareholders with
prominent wealth supporting the bank also had the potential of limiting the
expansion of banks The potential to limit expansion arose, as wealthy
shareholders would be discouraged from owning shared in an unlimited liability
capacity The reality was, however, that the banks expanded (Newton & Cottrell
1998) The joint stock bank structure saw an expansion of banks in the UK in the
same period There are elements of the joint stock structure that eliminate the
agency problem Economists have long argued that separation of control of
shareholders from a firms operations, leads to agency problems (Jensen &
Meckling 1976) The loss to shareholders under bank failure can be less than the
total loss to depositors, or even taxpayers, (Walker 2009) The larger a bank
grows, the more hierarchical the levels between operating agent and principle
agent become (Ramskogler 2011) Additionally, banks increase risk taking with
the knowledge they will be saved, securing depositors, (Mishkin 1997) It is not
clear why we moved away from the joint stock structure The structure provided a
system of control and accountability that does not exist in banking today
There was one significant noteworthy bank failure during the joint stock bank era
The Agricultural & Commercial Bank failed in 1836 The main activities included
discounting bills of low quality, and lending for small merchants and farmers The
bank had a large number of shareholders, between 20,000 and 30,000 It was
21
Page 23
claimed that these shareholders were not wealthy individuals, and had limited
resources, (Hickson & Turner 2005) The bank collapsed when the Bank of
Ireland refused to buy its paper and the shareholders were unable to raise
sufficient capital The structure of the bank was not at issue Confidence in the
bank was lost
“In the nature of banking, demand liabilities were balanced by assets due
at a later date the gap was bridged by public confidence, and this is what
the Agricultural Bank lost”, (Barrow 1975 49)
In 1836 the Bankers Magazine in describing the management of the bank
“Issues were unlimited and unchecked, the discounts were profuse, the
advances without security, extraordinary for their liberality”, (Hickson, &
Turner 2005 185)
The Banking Magazine reported that the failure of the bank was due to poor
management, with poor documentation, poorly attended board meetings, and a
lack of banking experience It should also be noted that all depositors were paid
in full, and the only loss was to shareholders, (Hickson & Turner 2005 183)
Padraig McGowan Of The Central bank of Ireland said of the collapse of
Agricultural & Commercial Bank
“It failed because of lack of planning and foresight by the promoters,
shareholders of limited means, unsuitable management and staff,
misappropriation of funds, reckless lending and record keeping that did not
keep track of the amount of currency notes that were put into circulation
mainly on a commission basis”, (1988 21)
22
Page 24
It is clear that the structure of the bank was not at issue, rather the poor
management of the bank. Further analysis and research into the management of
the Agricultural & Commercial Bank would assist in determining if an autocratic
management style prevailed.
The collapse of the Agricultural Bank saw two banks emerge, Southern Bank of
Ireland, and, Provident Bank of Ireland, both banks were short lived. Munster
Bank was another joint stock bank that failed due to poor management. Unpaid
director loans made for property speculation was given as the primary cause of
failure. The history of the joint stock bank era is documented in Appendix B The
History of Joint Stock Banks.
The Irish banking industry remained largely unchanged through the 1950s
(O’Sullivan & Kennedy 2007). The period through 1978 saw significant change in
the banking environment with the push to enter the European economic block
and monetary regime. The industry saw significant consolidation in an effort to
become more competitive and improve efficiencies from external threats,
(Leonardi 2005:158). This period saw the emergence of two dominant banks in
Ireland, AIB and BOI. Appendix C contains a brief summary of the six covered
institutions.
Empirical evidence from our analysis of history provides two striking factors:
1) The failure of banks is consistent with poor management decision
making at the highest level. An autocratic management style is
pervasive in Irish banking institution as far back as the 1800s.
2) The system of the joint stock banks provided a structure of control and
accountability. This structure was a robust model that had much
Page 25
success, with the exception of a limited number of poorly managed
institutions
2 3 Analysis of Selective International Bank Failures
In this section we examine a number of banking failures in international markets
As banking systems have failed in similar catastrophic fashion through history we
plan to extract some key learnings in the literature review of historical
international banking failures The historical evidence will show how accurately
diagnosing a bank failure is critically important This diagnosis involves identifying
internal versus external factors affecting a bank Identifying internal and external
factors will assist in categorising an event as either a classic crisis or a secondary
crisis A correct diagnosis will enable the application of appropriate corrective
policy (Marshall 2009)
2 4 The Argentinean Crisis
The financial crisis that shook Argentina during the period 2000 to 2002 created a
significant negative impact on the country With unemployment over 30%,
poverty at 37% and interest rates over five times the international average (Katz
2001) It is acknowledged that the region of Latin America suffered numerous
economic crises, such as Mexico 1994, Brazil 1998, Venezuela 1994, Ecuador
1999, Peru 1998, and Uruguay 2002 etc (Kindleberger 2009) It should be noted
that these financial crises contained both commercial banking failure, and
sovereign currency failure (Marshall 2009) Marshall confirms the significant
literature on the correlation between banking and currency crisis, noting that
while there is a degree of interaction between the two, they are different and
separate events The Argentina crisis for example contained both banking and
currency crisis The Brazil crisis of 1998 was limited to a currency crisis This is
an important distinction in our analysis of banking crisis Both Marshall and
Kindleberger also identify two types of banking crisis
24
Page 26
1) Classic banking crisis are caused by internal banking failures
2) Secondary banking crisis are caused by external forces
The Argentinean bank crisis was an example of a secondary crisis, Marshall
(2009) Marshall contends that external factors generally include macroeconomic
events, such as currency movements, international funding costs etc The author
supports the theory that external factors can also include microeconomic events
such as asset price inflation, unemployment etc This is supported by the global
interconnectedness of the financial system In Argentina, the external force of a
currency crisis provided the catalyst to the banking industry resulting with the
population moving deposits outside the country for fear of currency devaluation
The capital flight that occurred depleted the available capital within the main
Argentinean banks resulting in their insolvency An action the bank management
could not avoid or control Many economists agree that identifying the difference
between a classical and a secondary banking crisis is critical, particularly when
attempting to navigate through the crisis and select the appropriate corrective
action Marshall notes that resolving a classic banking failure is significantly more
complex than a secondary failure The Inter American Development Bank has
developed two principles for dealing with classic bank failures (Marshall 2009)
1) Ensure the parties that have benefited the most from the risk taking
activities of the banking business bear a large portion of the cost of
restructuring the banking system
2) Prompt action should be taken to prevent problem institutions from
extending credit to highly risky borrowers, (2009 669 690)
25
Page 27
These principles are of critical importance when compared to the history of Irish
Banking The joint stock structure clearly addresses the first principle The joint
stock structure provided shareholders with unlimited liability They reaped the
rewards during profit, and incurred unlimited liability during loss
Comparing this analysis to the Irish bank crisis provides instructive data in
understanding how the Irish crisis was diagnosed In the 2010 budget speech,
Brian Lemhan stated
“It is clear to us all what went wrong in our economy In the period leading
up to the crisis, the construction sector and property prices grew to
unsustainable levels The appetite of a rampant building industry for labour
and other resources put upward pressure on our cost structure As a
result, our competitiveness was damaged and we lost market share for our
goods and services Excessive public spending on the back of the
enviable but transient taxes of the boom added to the overheating of the
economy A huge expansion in bank borrowing for property and
construction-related investment was the final and most lethal domestic
ingredient in the causes of our crisis The international financial crisis
added pace and severity’, (Lemhan 2010 1)
Mr Lemhan looks at external forces as root cause in his explanation above In
what appears to be a misdiagnosis of a secondary banking crisis He clearly
ignored the internal factors of poor decision making, resulting in a classic crisis
as the real diagnosis This determination was critical when applying corrective
action See Appendix F for the author’s personal perspective on the Argentinean
crisis In summary, it is critically important to correctly diagnose the type of
banking crisis
26
Page 28
>
2 5 US Bank Failures 1920-1930
A number of Banks failed before the great depression of 1930 The collapse of
the City Bank of Buffalo in 1840 which failed due to losses incurred on loans to
the president and other officers and directors in the bank, (Thies & Gerlowski
1989) The establishment of the Federal Deposit Insurance Corporation (FDIC) in
the US in 1933 after the Great Depression followed a series of bank failures
These banks failed mainly due to poor lending decisions, and, inappropriate or
speculative activity undertaken by senior management (Thies & Gerlowski 1989)
Prior to the establishment of the FDIC, there were various state run deposit
insurance programs established to protect depositors In 1829 the State of New
York enacted the Safety Fund to protect depositors (Thies & Gerlowski, 1989)
By 1842 the fund was depleted as a result of 11 failed banks identified by the
state examiner as providing ‘reckless lending’ which included loans to
management for the purpose of speculating on the stock exchange
Other states including Vermont and Michigan operated state insurance funds
during the period of 1836 to1860, all of which failed due to losses incurred as a
result of failed banks engaging in reckless lending, (Thies & Gerlowski 1989) In
the period leading up to 1920, many other states provided insurance funds but
ultimately became depleted due to recklessness Columbia Bank and Trust
Company of Oklahoma failed in 1909 due to losses on loans made to senior
management in property and oil speculation This failure also caused the deposit
insurance fund in the State of Oklahoma to collapse The history of deposit
insurance funds leading up to the great depression was poor, with many states
attempting to provide deposit insurance funds which were ultimately depleted by
banks failing due to reckless lending
The 1920’s saw a period of economic prosperity which culminated in the collapse
of the stock market in October 1929, (Romer 1989) What followed in the 1930
27
Page 29
was the onslaught of a major banking failure forcing the federal government to
move to enact law to protect depositors
The Banking crisis of the 1930’s can be traced to the city of Chicago, (Calomiris
& Mason 1997), which experienced “panic resulted from location-specific asset
shocks that were relevant for bank portfolios” (1997 864) A chain of banks
owned by John Bam had failed due to significant unpaid loans incurred by Mr
Bain in his real estate development It was noted that due to the volume of banks
failing in short succession, many solvent banks were also subject to failure due to
the panic and fear (Calomiris & Mason 1997) Calomiris & Mason concludes that
“failures during the depression were a consequence of contagion, rather than the
insolvency of individual banks” (1997 867) On the other hand, Temm (1976)
claims the failure of banks in the period of the 1930’s was a result of falling
incomes from farmers with his "spending hypothesis’, where Stauffer, (1981),
contends the bank failures were a result of the failures of the 1920s
Accounting for these various hypotheses, the common factor for these failures
was reckless lending at a senior level The actions of senior bank officials at
Bain, City of Buffalo, and Columbia Bank and Trust, and many other institutions,
all allude to poor management decisions Failure was driven by an attempt to
take company funds and speculate for gain In 1799 the US passed law making it
illegal for bank managers to borrow bank funds for personal gain (Kindleberger
2009 162) These bank failures are not a new phenomenon Poor management
decisions and a lack of control and accountability is evident throughout the
history of US bank failure
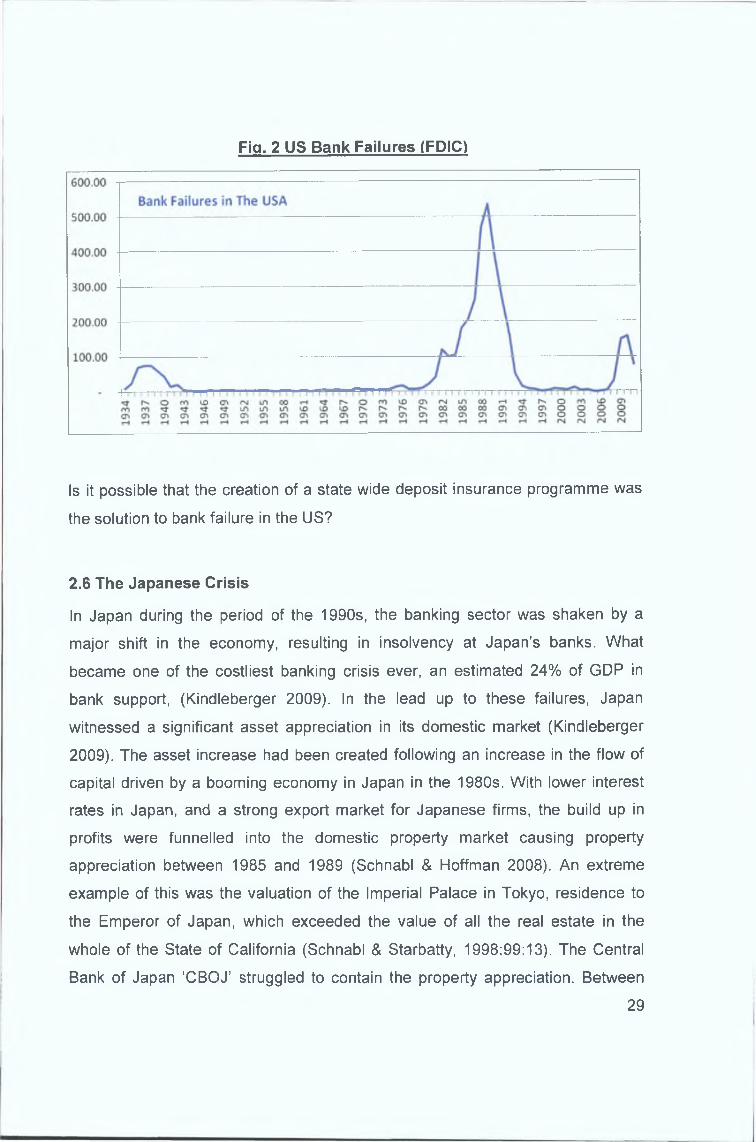
With the establishment of the FDIC in 1933, the bank failure rate declined
considerably Fig 2 shows the number of bank failures in the US since the
establishment of the FDIC
28
Page 30
Fia. 2 US Bank Failures (FDIC)
Is it possible that the creation of a state wide deposit insurance programme was
the solution to bank failure in the US?
2.6 The Japanese Crisis
In Japan during the period of the 1990s, the banking sector was shaken by a
major shift in the economy, resulting in insolvency at Japan’s banks. What
became one of the costliest banking crisis ever, an estimated 24% of GDP in
bank support, (Kindleberger 2009). In the lead up to these failures, Japan
witnessed a significant asset appreciation in its domestic market (Kindleberger
2009). The asset increase had been created following an increase in the flow of
capital driven by a booming economy in Japan in the 1980s. With lower interest
rates in Japan, and a strong export market for Japanese firms, the build up in
profits were funnelled into the domestic property market causing property
appreciation between 1985 and 1989 (Schnabl & Hoffman 2008). An extreme
example of this was the valuation of the Imperial Palace in Tokyo, residence to
the Emperor of Japan, which exceeded the value of all the real estate in the
whole of the State of California (Schnabl & Starbatty, 1998:99:13). The Central
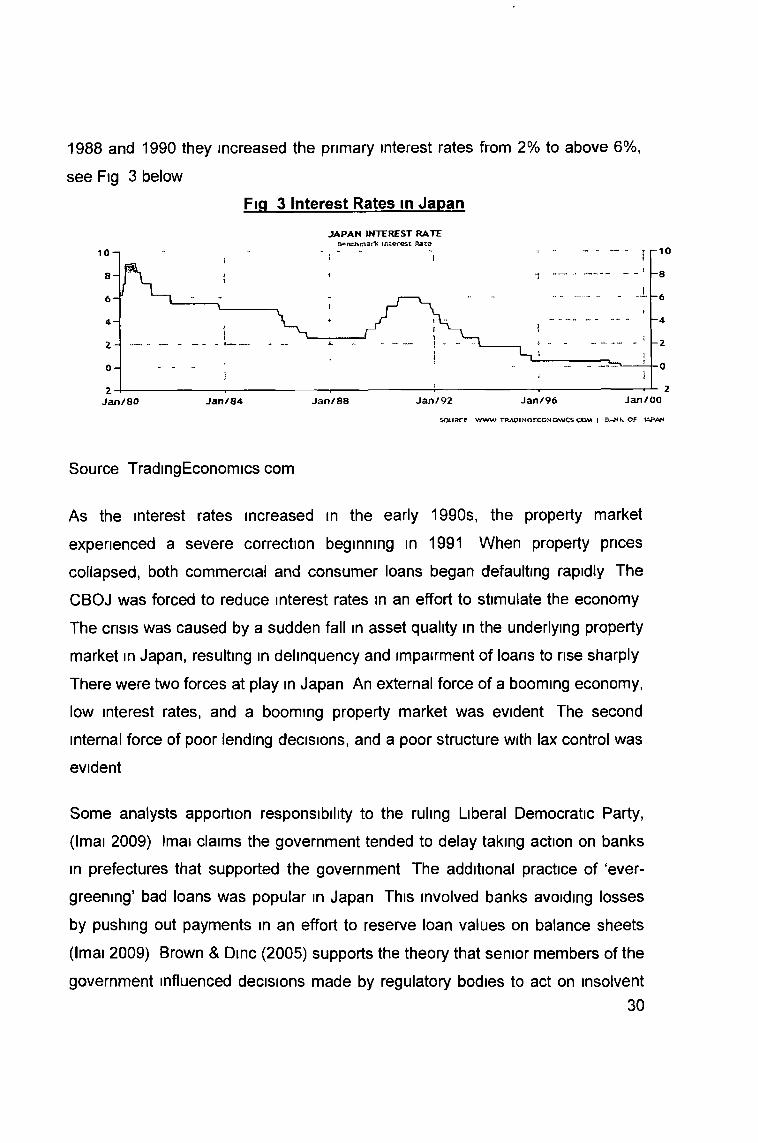
Bank of Japan 'CBOJ’ struggled to contain the property appreciation. Between
29
Page 31
1988 and 1990 they increased the primary interest rates from 2% to above 6%,
see Fig 3 below
Fig 3 Interest Rates in Japan
JA PA N INTEREST RATES ^racftfT vark i n t e r e s t R a t e
SOURCE W W V / r=-ADl N O ECONOM ICS c a w I 5 - H K O f «¿»AN
Source TradingEconomics com
As the interest rates increased in the early 1990s, the property market
experienced a severe correction beginning in 1991 When property prices
collapsed, both commercial and consumer loans began defaulting rapidly The
CBOJ was forced to reduce interest rates in an effort to stimulate the economy
The crisis was caused by a sudden fall in asset quality in the underlying property
market in Japan, resulting in delinquency and impairment of loans to rise sharply
There were two forces at play in Japan An external force of a booming economy,
low interest rates, and a booming property market was evident The second
internal force of poor lending decisions, and a poor structure with lax control was
evident
Some analysts apportion responsibility to the ruling Liberal Democratic Party,
(Imai 2009) Imai claims the government tended to delay taking action on banks
in prefectures that supported the government The additional practice of ‘ever-
greening’ bad loans was popular in Japan This involved banks avoiding losses
by pushing out payments in an effort to reserve loan values on balance sheets
(Imai 2009) Brown & Dine (2005) supports the theory that senior members of the
government influenced decisions made by regulatory bodies to act on insolvent30
Page 32
banks, (see Appendix D for details) Another remarkable aspect of banking and
business in Japan is the practice known as ‘Amakudan’ (Asano & Eto 2005),
which was supported by the LDP The Amakudari is a system where regulators
and government officials retire by taking senior posts in private business,
including banks Research has proven that banks who participated in the
Amakudari system behaved in a non-prudential manner (Asano & Eto 2005) This
system does not enable a structure of control and accountability to exist, as
politics plays a role in management decision making The US prohibits regulators
from joining banks for 12 months (Caprio & Honohan 1999) The LDP was a right
of centre conservative party formed in 1955, and held power in Japan, losing its
majority in 1993 (Krauss & Pekkanen 2010)
The LDP in Japan can be compared closely to the Fianna Fail Party in Ireland
who also held power for long periods before and during the financial crisis, and
had ties to business The CBOJ was forced to protect over 20 banks including
the Long Term Credit Bank of Japan (LTCB), with over $20 billion of loan losses
In 1997 the government created the Resolution Collection Corporation, under the
Takenaka Plan Heizo Takenaka who was the Chief of the CBOJ, moved assets
under other financial institutions Similar to NAMA, this was not the first time in
history such a mechanism was created The Reconstruction Finance Corporation
in the US in 1932, the Istituto per la Ricostruzione Industriale in Italy in 1933 are
earlier examples (Kindleberger 2005 19)
The Japanese crisis contains strong parallels with the failures in Irish banking
The Japanese system of banking was lacking in control and accountability, with
strong government influencing factors
31
Page 33
The Asian bank crisis of 1995 to 1997 saw a number of countries in South Asia
seek assistance from the IMF, in a similar pattern to what is presently being
experienced in Europe today Thailand, Indonesia, South Korea all received
emergency funding of $17 billion, $33 billion, and $57 billion respectively Zheng
& Tang, (2009) argue that a weak financial regulatory environment and poor
banking supervision lead to the crisis Additionally, Caprio (1998) apportions
responsibility in Asia to the low quality of banking supervision and regulation
Rahman, et al (2004), contend the bank failures in Asia were a result of poor
credit decisions with over $200 billion of bad loans in those countries that sought
IMF assistance Rahman et al (2004) refer to the CAMEL framework of
analysing a banks solvency which examines capital adequacy, asset quality,
management quality, profitability and liquidity, and highlights both management
quality and asset quality as major contributory factors in the Asian crisis
Nunnenkamp (1998), m analysing the Asian crisis for the IMF contends that the
Asian crisis can be attributed to the sudden shift from enthusiasm to panic, and
notes that the critical issue was to restore confidence The Asian crisis was
similar to the crisis in Japan There were external and internal factors involved in
both crises Both events can be categorised as classic bank failures with internal
management decision making as the primary cause
2 8 The Norwegian Crisis
The Norwegian crisis was similar to a number of other global banking failures in
the sequence of events They include liberalisation of banking regulation,
reduction in the government controlled interest rates, followed by excessive
increases in lending by banks, followed by a significant increase in asset
valuations, followed by a bust, (Vale 2005) In 1986 the banking regulator was
merged with the Insurance Regulator in Norway, and a move towards offsite
documentary bank inspections replaced more rigorous onsite inspections (Valei
2005) Between 1984 and 1986 the annual growth of bank loans in Norway was
32
2 7 The Asian Crisis
Page 34
above 20% for all but one quarter, (Vale 2005) This dramatic increase in loan
value was also reflected in the residential and commercial property market This
is similar to the growth rates experienced at Irish institutions, and the Irish
property market Knutsen & Lie (2002) contend, the banks managerial driven
strategies of growth maximisation, created a herd like mentality that ultimately
resulted in poor credit decision making, causing insolvency in a contracting
economy While the strategies seemed successful in an expanding marketplace,
once GDP growth stalled, loan losses grew The managerial strategies were
driven by an organisational shift in control to marketing and sales, in order to
achieve growth Prudent underwriting took a back seat to sales expansion These
factors are indicators of a classic banking crisis The government restrictions on
banking included limits to lending growth, and restrictions to lending profiles
Once the restrictions were lifted, the banks became competitive Unfamiliar with
this new environment, the banks focused on building market share (Vale 2005)
With a fragmented banking industry of 193 domestic banks in 1987, and a
population similar to that of Ireland, competition was fierce The herd mentality
was clearly evident, and it was suggested that inexperienced bank managers
were unfamiliar with the new regulatory environment led by autocratic bank
leaders, proved problematic (Vale 2005) Similar trends were experienced in
Ireland The Norwegian bank crisis was caused by internal factors A classic
crisis as a result of poor control and no accountability is evident The external
factors created a regulatory environment that fuelled unsustainable growth
Norwegian banks grew by more than 20%, similar to that experienced in Ireland
2 9 US Savings & Loan Crisis
The FDIC data indicates that 747 banks failed in the Savings & Loan crisis The
crisis may cost the US taxpayer over $200 billion (Glasberg & Skidmore 1998)
Banks became organisationally structured and motivated to engage in activities
that were theoretically fraudulent Lending on real estate speculation became an
industry practice, and regulators through passed audits essentially endorsed
33
Page 35
speculative, and reckless lending (Glasberg & Skidmore 1998) Analysis
indicated that the continued delay of regulators to act swiftly on closing insolvent
banks once the problem became known, further damaged the banking system,
(Kane 1989) The Depositary Institutions Deregulation and Monetary Control Act
of 1980 (DIDMCA) increased the insurance on deposits from $40,000 to
$100,000 This created a competitive environment in the industry that caused
banks to increase rates for deposit funds, (Shoven et al 1992) Decisions based
on the knowledge that both depositors were insured, and would ultimately be
protected from loss, created an increased cost to interest rates, returning to the
moral hazard question (Kane 2003)
210 The Icelandic Crisis
The banking crisis in Iceland in October 2008 resulted in three of the five
commercial banks in Iceland collapsing The banks had grown in size fuelled
mainly by short term interbank funding This wholesale funding model, similar to
Northern Rock, accounted for 75% of total capital requirements for the three
large banks (Landsbanki, Glitm, and Kaupthing Bank) The banks had invested
this short term capital in speculative offshore investments While a lot of these
investments continue to hold value, the immediate contraction in the wholesale
funding market created a strain on these banks forcing the government to take
action Some observers blame the collapse of Lehman’s in September 2008 as
the catalyst that created a contraction in the wholesale market It is also apparent
that the size of the three failed banks which reached over $168 billion, or 14
times the size of total GDP for Iceland, was partially responsible (Jackson 2010)
The unsustainable growth of the Icelandic banks, driven by management desire
to grow, was the primary cause of their downfall (Pisam-Ferry & Sapir 2010)
34
Page 36
2 11 The UK Crisis
In September 2007, the Northern Rock Bank experienced a ‘run’ where
depositors withdraw their money in fear of insolvency Not since 1866 had the UK
experienced such activity, when Overend Gurney Bank, (Shin 2009),
(Kindleberger 2009) The problem with Northern Rock was the fragile nature of its
funding, coupled by an aggressive growth strategy, (Shin 2009) Between 1998
and 2007 the bank had an annual growth rate of 23% The bank became reliant
on short term wholesale institutional funding, which accounted for 25% of its total
capital before the crisis During the crisis, this wholesale funding almost
vanished The UK government ultimately stepped in to protect depositors who
were growing increasingly concerned and had ultimately lost confidence The
Independent Commission on Banking set up by the UK government issued a
report in September 2011 found that there were two primary causes of the UK
banking crisis
1) A concentration on capital ratios, ignored a ballooning leverage ratio
problem within the banking system, where leverage ratios were forty
times, or more than twice the historical average, and risk weighted
assets ratios became meaningless when asset risks were
miscalculated
2) Bank debt, once considered a form of equity was unable to absorb loss
due to the contagion issue This was a flaw in the structure
The commission proposes structural change, separating retail banking from
investment banking This would ring-fence retail activity from investment activity,
and, higher levels of loss-absorbing capital The Basel III Accord was deemed
insufficient in protecting banks from future loss, quoting ratios nearer 20% as
more adequately sufficient The recommendation to separate out the bank
structures, along the lines of the Glass-Steagall Act of 1933, would not have
35
Page 37
prevented Anglo Irish Bank from failure. There are strong parallels to the Irish
banking crisis. Unsustainable growth levels and excessive debt are evident in
Ireland and Northern Rock. An over reliance on conforming to capital adequacy
was also evident in both Ireland and Northern Rock. While it is important to
acknowledge the failure of Basel and capital adequacy ratios, the IBC did not go
far enough. A sound structure of control and accountability is needed within the
banking sector, both retail and investment. Additionally, a mechanism controlling
the growth of balance sheets would prevent excessive growth in the future. See
Appendix F for more detail on the IBC findings.
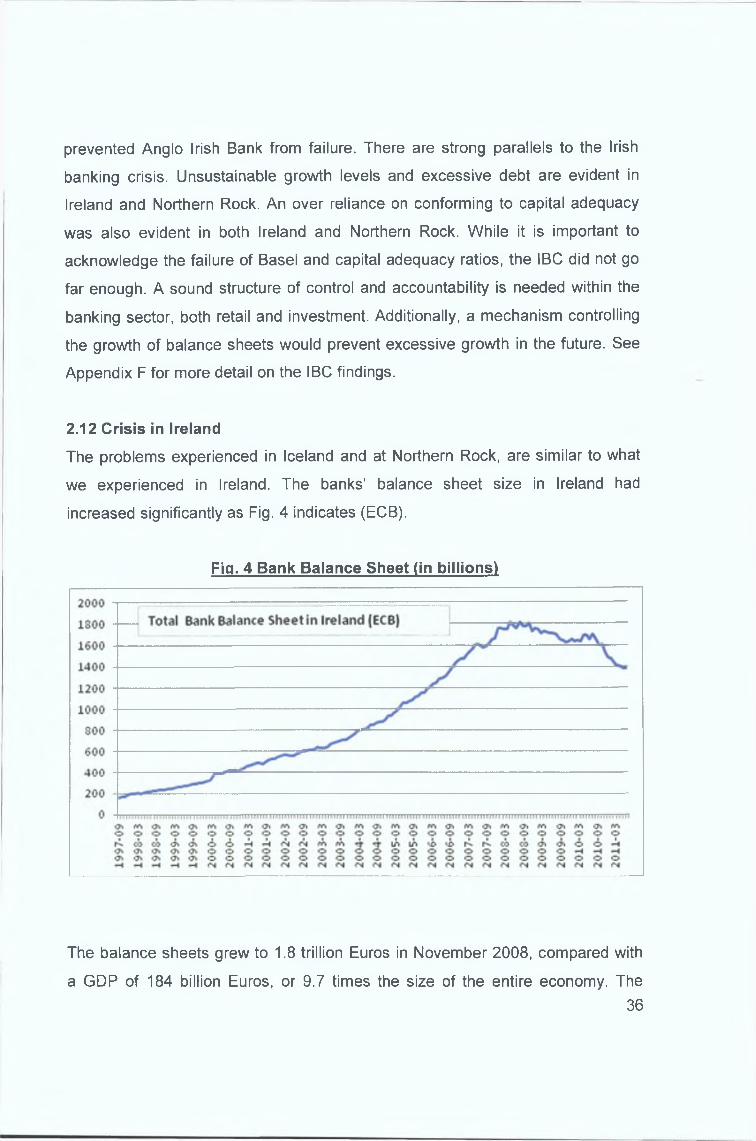
2.12 Crisis in Ireland
The problems experienced in Iceland and at Northern Rock, are similar to what
we experienced in Ireland. The banks’ balance sheet size in Ireland had
increased significantly as Fig. 4 indicates (ECB).
Fia. 4 Bank Balance Sheet (in billions)
The balance sheets grew to 1.8 trillion Euros in November 2008, compared with
a GDP of 184 billion Euros, or 9.7 times the size of the entire economy. The36
Page 38
government was unable to support the banking system, as was the case in
Iceland. This is clear evidence of unsustainable growth.
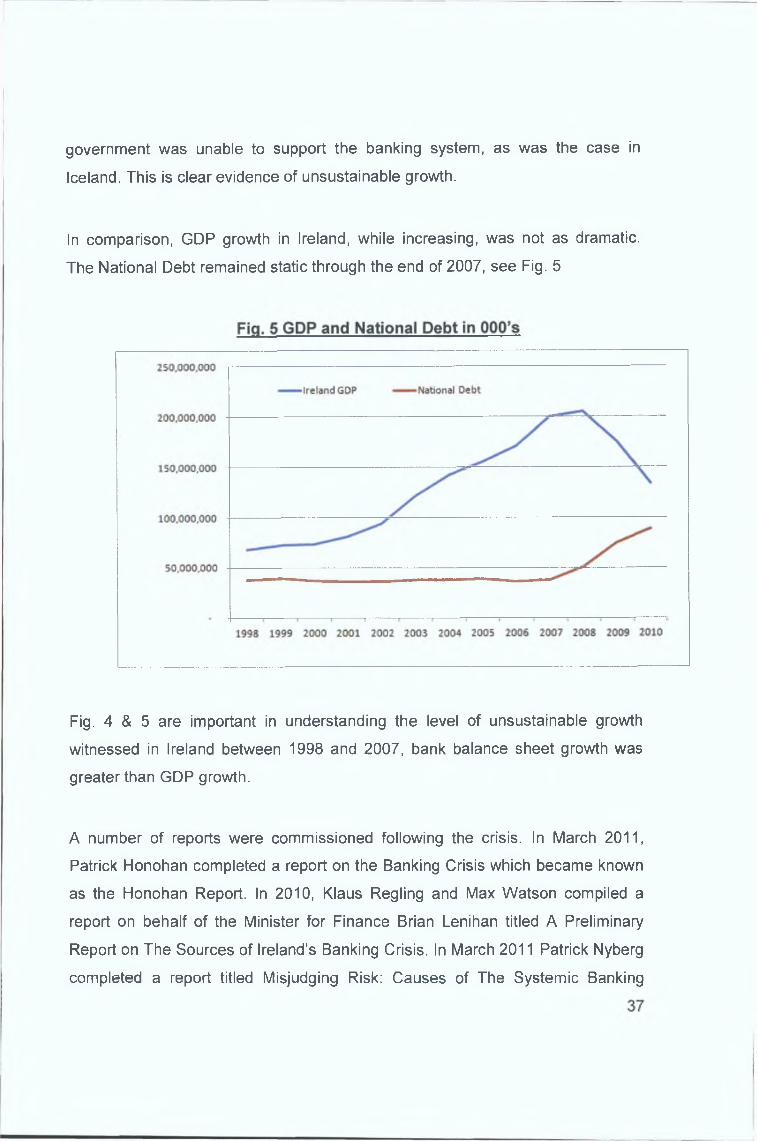
In comparison, GDP growth in Ireland, while increasing, was not as dramatic.
The National Debt remained static through the end of 2007, see Fig. 5
Fig. 4 & 5 are important in understanding the level of unsustainable growth
witnessed in Ireland between 1998 and 2007, bank balance sheet growth was
greater than GDP growth.
A number of reports were commissioned following the crisis. In March 2011,
Patrick Honohan completed a report on the Banking Crisis which became known
as the Honohan Report. In 2010, Klaus Regling and Max Watson compiled a
report on behalf of the Minister for Finance Brian Lenihan titled A Preliminary
Report on The Sources of Ireland’s Banking Crisis. In March 2011 Patrick Nyberg
completed a report titled Misjudging Risk: Causes of The Systemic Banking
Page 39
Crisis in Ireland These reports contain numerous observations and explanations
regarding the financial crisis
The Nyberg Report identifies a number of key elements leading to the cause of
the Irish Banking crisis They include systemic failure of customers in judging true
property values, failure of banks to understand true credit quality of customers,
failure of investors providing funding to banks in understanding the true nature of
risk involved in those banks, failure of a regulator in understanding the changing
market risk within the banks, failure of a government in managing the regulator,
failure of parliament in recognising the mounting problems, and a failure of media
in fully understanding the developing problem, (Nyberg 2011 11) Nyberg also
apportions responsibility to what he describes “the presence of a strong
personality acting as Chairman, CEO or Executive Director” (2011 48)
The Reglmg & Watson report found that serious governance issues were
breached in at least one major Irish financial institution, and reckless lending, and
fraudulent accounting was in operation at some banks Additionally they point out
that the regulator should have known about these activities were prudent auditing
measures in place, therefore apportioning responsibility to the regulator
The Honohan Report claims the bank management as the first line of defence to
protect depositors and investors He also apportions responsibility to
intermediaries such as mortgage brokers and auditors He comes down on the
central bank in providing key protection in any national system against the
emergence of a banking crisis The report claimed that the central bank
“supervisory practice focussed on verifying governance and risk management
models rather than attempting an independent assessment of risk” (2009 8) Poor
regulation driven by a lack of skilled personnel, due to poor wages, was also a
factor (Welfens, 2008)
38
Page 40
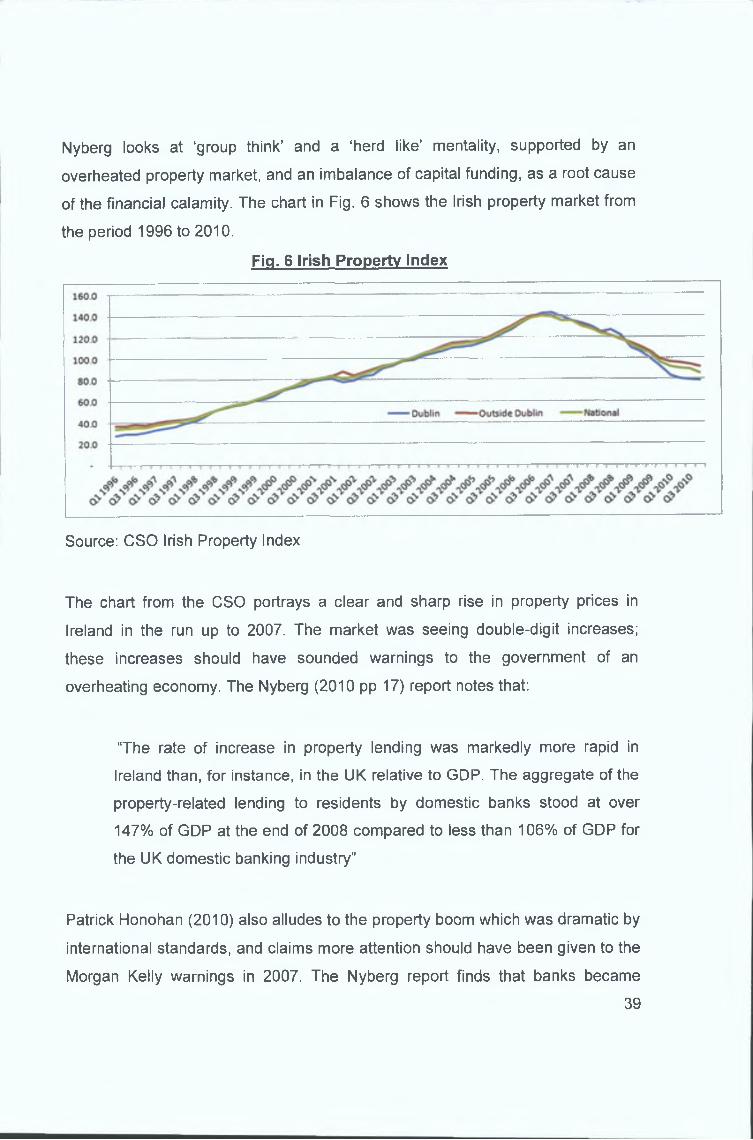
Nyberg looks at ‘group think’ and a ‘herd like’ mentality, supported by an
overheated property market, and an imbalance of capital funding, as a root cause
of the financial calamity. The chart in Fig. 6 shows the Irish property market from
the period 1996 to 2010.
Fig. 6 Irish Property Index
Source: CSO Irish Property Index
The chart from the CSO portrays a clear and sharp rise in property prices in
Ireland in the run up to 2007. The market was seeing double-digit increases;
these increases should have sounded warnings to the government of an
overheating economy. The Nyberg (2010 pp 17) report notes that:
“The rate of increase in property lending was markedly more rapid in
Ireland than, for instance, in the UK relative to GDP. The aggregate of the
property-related lending to residents by domestic banks stood at over
147% of GDP at the end of 2008 compared to less than 106% of GDP for
the UK domestic banking industry"
Patrick Honohan (2010) also alludes to the property boom which was dramatic by
international standards, and claims more attention should have been given to the
Morgan Kelly warnings in 2007. The Nyberg report finds that banks became
39
Page 41
focused on growth and revenue, and this change in strategy was not addressed
in the core governance of risk for the banks resulting in a relaxation of controls
It is clear that Ireland experienced a classic banking crisis Poor internal
management decisions were made without control or accountability The
structure of banks in Ireland has facilitated a system that has poor planning,
control and accountability
2 13 Crisis in the US
The issuance of the Irish bank guarantee in September 2008 occurred in a month
of heightened activity in the US This is a clear sign of the interconnectivity in the
banking system
• Merrill Lynch was taken over by Bank of America on September 14th
• Fannie Mae and Freddie Mac were taken over by the US Government
on September 7th
• Lehman Brothers declared bankruptcy on September 15th
• AIG received $85 billion from the Federal Reserve in emergency
funding on September 16th
• Washington Mutual was declared bankrupt on September 25th
These companies were all affected by the subprime mortgage crisis The
subprime mortgage crisis first surfaced as an issue in early 2007 when mortgage
loan originators began experiencing problems New Century Financial and
Countrywide Financial Corporation both failed in 2007 New Century Financial
business was to originate mortgages, and sell these mortgages to third parties,
through securitised products CDO's Collateralised debt obligations were found to
have serious control failures Their legal structures were often more complicated
than the intermingled payment streams called waterfall payment flows to bond
holders (Ferguson & Johnson 2009 15) According to the bankruptcy report
issued by Missal M (2007), New Century Financial was deficient in a number or
40
Page 42
areas including, failure to support rapid growth The company grew at rates of
over 40% Additionally, the report found that senior members of the management
lacked sophistication or experience necessary to perform their job Credit
standards were lowered in an effort to keep revenue growth, with the knowledge
that these loans were sold on without recourse to stand alone bankruptcy remote
special purpose vehicles This practice created moral hazard issues for the
originators, who did not keep ‘skin in the game’ (James 2010) This practice was
not limited to private entities, but indirectly supported by the US government
Freddie Mac and Fannie Mae were in the business of buying mortgages on the
secondary market in the US Fannie Mae was established in 1938 as a
government agency It supported the housing market and to have a
congressional charter that directs it to channel funds increasing the availability
and affordability of home ownership for low income Americans (Yilmaz 2011)
Yilmaz contends that Fannie Mae played a critical role in the development of the
mortgage securitisation industry The Federal Reserve Board acknowledged that
this activity decreased almost all aspects of nsk associated with mortgage
lending in 2004 (Yilmaz 2011) Successive governments including Clinton and
Bush have supported the aggressive activities of Fannie and Freddie (Yilmaz
2010) As mortgages were sold to special purpose vehicles, the products became
attractive to investors who purchased bonds in these vehicles This market grew
aggressively with the mortgage related bond market growing from $496 billion in
1998 to $2,231 billion in 2007 according to data from the Securities Industry and
Financial Markets Association SIFMA As long as the house market was
increasing, this model worked As soon as the market slowed or decreased, the
model failed
The US subprime crisis was driven by unsustainable growth, driven by senior
management at financial institutions While there is much discussion around
CDOs, loan originators, weakening lending practices, rating agencies, regulators
etc these are all external issues The primary underlying trend relates to an
41
Page 43
unsustainable growth model driven by aggressive management Without control
and accountability, poor management left loan origination run the domestic
mortgage market at unsustainable growth levels The financial community that
supported the subprime market suffered catastrophic losses
214 Summary of History
Our literature review has informed us of a number of key factors These factors
are both external and internally driven Understanding these factors will enable
us to more accurately diagnose banking failure External factors may suggest a
secondary bank crisis This is more typical when the external factors are
macroeconomic, such as currency movements or international interest rate
movements Internal forces may suggest a classic banking crisis Accurately
diagnosing a bank crisis is a critical step which must be taken before an analysis
can be conducted Our literature review of past crises found the following factors
1) Continual Evolution of Banking The industry of banking and finance has
evolved through history and cannot be attributed to one single event It is
the culmination of a series of needs and mechanisms created by different
cultures at different periods, to facilitate trade As financial transactions
became regulated, the market makers continue to develop processes to
overcome restrictions Bank officials today create new and improved
products and processes, which is not dissimilar to the bankers of the 18th
century While the products have new names, and are more complex, the
nature of what bank officials do remains unchanged Banking failures
worldwide are filled with examples of new credit products created with
good intentions, but left with bad outcomes (Graafland & Van de Ven
2011) Bank failure is not caused by the product or instrument, but the
system that lacks organisation, control, and accountability The system
enables managers to poorly manage, void of accountability
42
Page 44
2) Poor lending Decisions Ireland has a history of bank failures The 1820
failures were caused in part by poor management, reckless lending Banks
were found to have made poor management decisions on lending and
internal management The Agricultural & Commercial Bank and Munster
Bank for example engaged in weak management practices The history of
bank failures globally is filled with poor lending decisions
3) Poor structure of banks The structure of Irish banks plays a key role in the
cause of bank failures The joint stock system provided accountability and
control through the unlimited liability structure for shareholders This
system eliminated the agency problem that exists today where managers
are not accountable for losses of failed banks It is clear that if we plan on
absorbing bank losses through nationalisation, the moral hazard issue will
remain in place, resulting in repeating banking failures for future
generations
4) Asset appreciation is a major cause of bank failures, with history providing
many examples of this The most extreme example is the Japanese
banking failure which was a result of an over inflated property sector
Asset appreciation is an external factor Bank management however can
control asset appreciation by managing their balance sheet effectively
History is filled with examples of management who failed to internally
manage external asset appreciation by growing unsustainably
5) Growth driven, herd like mentality The external forces of competition and
asset appreciation, creates a strong desire for managers to act in a herd
like mentality The crisis in Norway provides good example of the herd like
mentality that drove asset appreciation within the banks
43
Page 45
6) Political involvement with business and banking has historically either
influenced decision making at banks and regulators, or delayed decision
making in an effort to contain the problem The Japan crisis provides a
good example of politics interfering with decision making at the banks In
April 2007, Taoiseach Bertie Ahern proclaimed the Irish economy was set
for a soft landing, and dismissed claims that there were problems within
the economy (Beesley 2007)
7) Poor regulatory framework was evident in most banking failures Typically
a liberalisation of banking is politically driven
In summary we see a variety of causes behind bank failures From the reckless
and unregulated behaviour of managers in the US in the 1920-30’s where bank
managers used bank funds to invest in speculative ventures To the weak
regulatory environment in Asia coupled with a severe turn from an expansionary
to a contractionary economy The Japanese crisis was influenced by political
forces in a highly expanding environment The Norwegian crisis was seen as a
shift in focus from loan quality to loan growth The Argentinean crisis was a result
of years of political mismanagement of fiscal and monetary policy The US
Savings and Loan crisis was a result of speculative activity following political
deregulation The crisis in Iceland was a result of both reckless managerial
decisions and overinvestment by both depositors and bond holders The UK
Northern Rock crisis was a result of poor bondholder investment and an over
expansion of the bank portfolio
Mayer, (1975) highlights the two primary reasons why banks should be protected
by governments, firstly to protect the money supply in the economy, and
secondly to protect depositors who would otherwise live in fear of lost savings
and move from bank to bank creating an unstable funding source Tussing (2001)
notes that in the US, the history of the FDIC has been to prevent depositor loss,
44
Page 46
and that through the action of saving depositors, a theory of saving banks from
collapse has evolved This theory supports our view that it is critically important to
accurately diagnose a bank crisis before we can decide who is saved This has
been a difficult task for regulators The majority of bank failures in history are
classic bank failures (Marshall 2009) The common trend in classic bank failures
throughout history begins with the poor structural nature of banks Structural
deficiencies provide room for poor management decisions Structural deficiencies
also lead to autocratic leadership styles These management techniques
eventually lead to mismanaged banks that ultimately fail It is clear through our
research that most banks are supported by regulators and government It has not
been common for regulators to close banks in normal trading periods We cannot
however conclude that all bank failures are caused by lax regulators and
government There are many banks that survived where others failed We can
summarise that where all banks have poor structural compositions, not all banks
are poorly managed A key indicator therefore of a poorly managed bank with
these inherent weak structural compositions, is aggressive growth Equally not all
banks with excessive growths are doomed to fail We can summarise, banks with
excessive growth in a booming economy should be examined carefully
45
Page 47
CHAPTER 3
3 1 Understanding Credit & Banking
In this Chapter we examine the basics of debt and underwriting Making credit or
loan decisions, underwriting, has historically been driven by 5 key elements,
(Business Credit, 2011)
1) Character
2) Capacity
3) Collateral
4) Conditions
5) Capital
See Appendix G for more detail on the 5 Elements of Credit
These elements include both qualitative and quantitative measures Credit
underwriting is not a simple formulaic process Using the measures are
dependent on the type of lending involved, and the industry For example short
term credit card consumer debt, versus long term mortgage debt In these
examples, the elements will apply in different varying levels of importance
Collateral is weighted more heavily for mortgage debt than credit card debt One
important element in Appendix G relates to the collateral and key factors in
securing collateral Irish banks were poor at executing this element effectively
As banks take short term cash (customer deposits) and lend long term (loans)
they frequently have short term liquidity requirements, which are received from
other banks Confidence is required in the banking system to ensure both
depositors are comfortable and not demanding their deposits and short term
lenders are willing to provide liquidity (Barrow 1975) Additional confidence is
required in customers, who receive loans from the bank, and their ability to repay
46
Page 48
using the five elements of credit The conditions determine the level of risk that
banks are willing to take and hold An important distinction here is the analysis
performed by underwriters in banks who make credit decisions based on making
and holding loans As we explored in the US crisis, banks such as Countrywide
began making underwriting decisions based on selling loans A key element of
the underwriting process is evaluating the ability of a borrower to repay the loan
When loan originators like Countrywide sell mortgages, this key component of
underwriting, ability to pay, is no longer a critical factor, as loans are sold
Traditional lenders who serviced loans to maturity, have more inherent financial
incentive to make prudent credit decisions, compared to mortgage originators
who sell off portions of mortgages to other financial institutions that eventually
ended up on Collateralised Debt Obligations, (James 2010) James discusses
the issue of 'Moral Hazard’ when discussing the issue of underwriters not utilising
the full application of underwriting standards as expressed in the five elements of
credit, as they were not holding loans to maturity
The Lehman Brothers collapse on September 15th 2008 causing losses on a
balance sheet valued at $650 billion uprooted all confidence in the banking
system The collateral, conditions, and capacity elements for Lehman’s had all
moved so far against the bank, capital was negatively impacted causing the bank
to become insolvent As the five elements of credit conditions became eroded,
the confidence in the bank was lost causing a liquidity crisis Other banks
suddenly stopped lending to Lehman’s The Lehman’s event was significant,
because for the first time in decades, a large global bank with significant
overnight liquidity positions had collapsed, causing large losses, and shattering
confidence It created fear in the financial world and eroded confidence in the
system of banking It was also significant, due to the realisation in the banking
industry, that the CDO market was broken This fear and erosion of confidence
continues today
47
Page 49
Loan origination, COD products, and Securitisation, are all examples of the
banking industry evolving The failure was not in the creation of new products,
but in the lack of control in fully evaluating new product risk An autocratic
leadership style driven by incentives to achieve unsustainable growth was the
cause, not the products themselves
It has become popular to apportion partial responsibility on the banking crisis to
financial liberalisation, however some disagree, Caprio & Honohan (1999)
contend that
“Financial liberalization has only revealed a longstanding underlying
insolvency of the banking system, which became unavoidably clear as
banks emerged from the sheltered environment that allowed or required
them to cross-subsidize loss making lines of business" (1999 48)
This is a critical point Deregulation and liberalisation was not the cause of the
financial crisis The poor structure of banks with deficient control and
accountability is the underlying cause Deregulation has allowed banks to grow
rapidly and in some cases unsustainably Deregulation did not change the
structure or control mechanisms within banks that permitted poor management
decisions
In the US, the government was selective when it came to saving banks Bear
Sterns and Lehman Brothers were left to fail Many other banks however were
saved The Troubled Assets Relief Program (TARP) of October 2008 provided
funding of over $700 billion to the US banking system, by purchasing
troubled/toxic assets, and providing liquidity Both the TARP and the EFSF are
extensions of government monetary policy, embarked on by governments in an
effort to maintain or save the money supply in the banking sector The US
government has applied a mixed policy in treating bank failure The rationale for
48
Page 50
selecting survivors seems to be driven by the effect to the financial system The
government appears to ignore the diagnostic process of understanding the
reasons for failure The size and speed of the recent crisis facing the US
authorities has resulted in this quick decision making process, purely based on
impact to the financial community While this is not the ideal solution, the US
government has been able to contain the crisis to date, but at what cost?
Governments continue to misdiagnose the problem by supporting the patient,
based in misguided principles
3 2 Protecting Banks at all Cost
The continued fear is that large scale bank failures could cause a great
depression Mayer (1975) Mayer claims that in order to prevent a depression we
have fallen into a trap that in the case of large banks we appear to have drifted
into a policy of insuring not the depositor, but the banks itself While in the US
there have been two noticeable exceptions with Lehman’s and Bear Sterns,
European authorities have stepped into every banking crisis with the intent to
protect the bank from collapse, for fear of contagion With the collapse of Fortis
and Dexia in Europe, the contagion continued This policy of protect all banks at
all costs created a transfer of risk and indeed debt from the privately owned and
managed banks, to the public taxpayer While the first phase of the financial
crisis in 2007 in Europe was a liquidity issue beginning with the freezing of
redemptions by BNP Paribas in August 2007, Pisam-Ferry & Sapir (2010), the
second phase was one of solvency, with the collapse of Lehman’s in September
2008, a shock wave was sent through the banking system breaking confidence in
the strength and value of bank assets, good loans were now questionable at best
and most likely bad, repeating the cycle that fuelled the 1930s crisis, (Calomiris &
Mason 1997)
49
Page 51
Protecting and preserving the banking system is imperative to a healthy and
functioning economy, (Caprio & Honohan 1999) According to Kennedy, &
O’Sullivan
“A banking system that is able to operate efficiently is of crucial
importance to any economy Poorly operating banking systems can
impede economic growth, intensify poverty and destabilise the economy”,
(2007113)
The policy of protecting banks at all cost equates to applying treatment of a
secondary bank failure, to a classic bank failure patient The incentive in applying
this treatment is the fear of contagion The additional fear of a currency crisis as
a result of insolvent banks is driving policy While this may appear to be a noble
cause, our research suggests this is somewhat misguided A more appropriate
measure is to correctly diagnose the crisis as a classic bank failure The
treatment required for a classic failure includes ensuring the parties who
benefited from profits, bear the cost of loss Additionally, we need to prevent risky
institutions lending to insolvent borrowers This is not accomplished by protecting
all banks
3 3 Capital Adequacy
In 1988 the Basel Committee in international banking set out rules and
requirements relating to minimum capital required for international banks in order
to absorb losses The cornerstone of this accord was the Cooke Ratio, the initial
standard of 8% of risk weighted assets, based on the level of risk for each asset
(Saita 2007) The problem with this approach is that historically, banks with
apparent adequate levels of capital continue to fail (Caprio & Honohan 1999)
The biggest difficulty for supervisors has been how to determine the true value of
a bank’s loans Historically banks have used models to value the potential for
loan loss These models have been built over time and based on past
50
Page 52
experience, using standard deviation stress to forecast either improvement or
deterioration in economic indicators The challenges with these models has been
that when economic conditions move outside the norm, or when bank approval
techniques change the profile of the portfolio, past experience is no longer a
useful tool The models become meaningless, resulting in inadequate capital
buffers Regulators are usually deficient of information regarding a bank’s loan
valuations, and left unable to make recommendations to management regarding
appropriate capital levels Additionally, banks with insufficient capital can survive
for months or years as long as inflows from investments and loans are sufficient
to pay expenses and interest for deposits and funding (Caprio & Honohan 1999)
Once a bank’s management becomes aware they have entered the insolvency
stage, it is possible they begin to overstate underperforming loans to conceal
problems from the regulator Political pressure may also be placed on regulators
to help prevent the bank from collapse ‘don the green jersey’ Banks can also
employ the practice of ever-greening loans to conceal non-performance (Imai
2009), (Caprio & Honohan 1999) The final stage of insolvency is where
managers begin looting the bank by extending loans with the knowledge they will
not be repaid (Caprio & Honohan 1999) A potential solution is the issuance of
subordinated debt by banks with the lowest level of priority equal to equity
(Calomiris 1998) This would ensure debt issuers of this priority would represent
additional buffers to potential loss, as their positions would be eliminated first
These levels of subordinated debt command higher levels of return This was
adopted in Argentina in 1997 (Caprio & Honohan 1999) In the recent Irish
banking crisis however, subordinated debt was treated pan passu with secured
debt and deposits The move to Basel II was an acknowledgement of the
limitations in the risk weighted capital requirement (Marrison 2002) The Basel II
accord introduced three Pillars of assessment Pillar I involved minimum capital
requirements for credit, market, and operational risk, based on a risk weighted
basis Pilar II involves a level of assessment on the banks quality of risk
management systems and procedures This allows regulators the ability to
51
Page 53
assess the quality of risk management within a bank, and determine if additional
capital buffers are necessary where banks controls are weak Pillar III provides
additional analysis on the pressures of market discipline, and attempts to provide
transparency to a bank’s risk profile (Saita 2007) The Basel II Accord while
agreed on in 1999 has not been adapted by all nations at the same pace The
US for example has been slow to fully implement the requirement for Basel II
Accord, subscribing to a more neo-liberal approach to government intervention
under the belief that free markets are self-correcting and should be left to
themselves (Kindleberger 2005) In Europe the Capital Requirement Directive
(CRD) which was operational in 2007, incorporates the accord in full, however a
provision allowed a delay of one year for implementation (CBOI 2012) The
problem with the capital adequacy ratios have been that even when banks
conform to the requirements, it may not be sufficient For example in the
December 2007 annual report for Anglo Irish Bank, disclosed on page 16 of its
report
“The capital base was further added to in June when the Bank raised €510
million of Tier 1 and €750 million of Tier 2 capital Tier 1 and Total Capital
ratios are strong at 8 6% and 12 0% respectively, well in excess of
minimum regulatory requirements The Bank, given its current excellent
position and on-going strong retentions, has sufficient equity for future
growth In addition, the Bank will not need to raise Tier 1 or Tier 2 debt
capital before the first half of 2009”, (2007 16)
The disclosure went on to acknowledge the upcoming enhanced CRD capital
requirement
“The Capital Requirements Directive (‘CRD’), which implements the
provisions of the Basel II Capital Accord in the EU, will come into effect on
1 January 2008 We have invested significantly to ensure the
52
Page 54
implementation during 2008 of enhancements to our Group-wide credit
grading models to meet the required standards of the Internal Ratings
Based approach In the interim period, we will calculate our capital
requirements under the Standardised approach We expect some
regulatory capital benefit over time following implementation of the CRD”,
(2007 16)
All covered institutions made similar disclosures It is clear from these disclosures
that by adhering to the CRD, proved insufficient for the survival of the banks in
Ireland The Irish Regulator noted in its Financial Stability Report on November
14, 2007 on page 18
“The Irish banking sector remains well capitalised with the majority of
banks reporting an increase in both their overall solvency and Tier 1
capital ratios Asset quality remains high by historical standards The
ratings of Irish credit institutions continue to support the view that the Irish
banking system remains healthy”, (2007 18)
The central bank was clearly unaware, or, not concerned with the capital
adequacy of the Irish banking system in November 2007, less than 12 months
before the government guarantee Even adhering to the new capital adequacy
requirements proved insufficient to cover losses incurred in 2008/9
The financial sector is so dynamic, that even a well-designed risk-weighting
system may soon become obsolete (Estrelle et al 2000) Gross revenue growth
rates, of banks as an additional indicator, found that both leverage ratios and
capital to revenue ratios were better at predicting bank failures (Estrelle et al
2000) It is clear from our research that capital ratios fall short of providing
indicators for bank health A new approach of measuring bank health is urgently
needed
53
Page 55
4 1 Research Introduction
The purpose of this chapter is to explain the research methodology employed in
the study The first question we explore before determining our methodology is to
ask why we are conducting this research (Quinlan 2011) The severity of the
recent crisis in Ireland was highlighted in chapter one This crisis will have a
lasting impact on the economic landscape in Ireland for many years An
informant in the interview process described the crisis as
"Ireland’s World War, which will leave an economic scar on the next
generation”, (Anonymous 2012)
We cannot underestimate the damage caused by the financial industry in Ireland
There have been numerous reports completed on this crisis, however few reports
have accurately diagnosed the crisis These reports have been commissioned by
both government agencies, and international bodies While these reports
contribute to the national debate which seems to focus on ‘who we can blame?’,
few reports have completed an objective analysis on the subject incorporating
both historical analysis, and current analysis These reports focus on the current
events at a point in time, and give little consideration for how the industry has
evolved The author believes there is an opportunity to learn from the recent
events We have the potential to find a solution to a problem that has eluded
economists for over a century The problem as highlighted in chapter one, ‘How a
system of banking can continue to repeat seemingly systemic collapse’ This
problem is not unique to Ireland This is a global problem, and we are witnessing
the 85th financial crisis as outlined earlier (Persaud 2009) We have the
opportunity to become subject matter experts on the topic of banking failure
Ireland has invested significant capital into developing a financial services sector
over the last two decades, and there exists a unique opportunity to capitalise on
the recent shortcomings We should be under no illusion that a nation the size of
54
CHAPTER 4
Page 56
Ireland can change a global industry There is the real possibility however that
through research and analysis, an accurate diagnosis of this financial crisis can
lead to real and lasting change in the way the industry operates
4 2 Research Objectives
Now that we have determined why the study is being conducting, the next
question is to determine the objectives of the study There are a number of
reasons why it is important to clearly set out the research objectives A clearly
defined research objectives statement will express the purpose of the research
and define the variables within the study Additionally it will establish the
parameters within which a focused study can be achieved (Wood et al 2000 46)
Both objective and hypotheses are included in the research objective
The objective of this study is to determine causes contributing to the recent Irish
bank crisis, and, identify common factors evidenced in previous banking crises
These factors include the following
• Accurately diagnosing bank failure
• Efficient bank structure
• Autocratic management
• Unsustainable growth
Additionally, we look at identifying other potential factors prevalent in bank failure
55
Page 57
Understanding our research philosophy will help us develop knowledge and
understand the nature of that knowledge (Saunders et al 2007) Once our
research philosophy is established, this will lead us to the strategy and methods
of research We need to ensure our research philosophy is defendable against
alternative approaches The choice of using either an interpretivist philosophy or
a positivist philosophy often leads researchers into incorrectly believing one is
better than the other Our view here is that both may prove valuable regarding
our subject matter Pragmatism, as noted by Tashakkori and Teddlie (1998) put
forward the idea that the ‘research is a continuum rather than opposite positions’
of interpretivist or positivist (Saunders et al 2007 109) Tashakkori and Teddlie
also argue that ‘pragmatism is intuitively appealing, largely because it avoids the
researcher engaging in what they see as rather pointless debates' about
concepts and philosophies (Saunders et al 2007 109) Our desire to choose a
pragmatic approach is not driven by the reluctance to commit to a 'system of
philosophy’ We are not ignoring the ‘philosophical debate about reality and the
nature of knowledge, the weakness of one paradigm over the strengths of
another’ (Collis & Hussey 2009 66) The pragmatic approach is appealing
because it provides us the ability to engage in the academic freedom of exploring
both positivist and interpretivist positions, employing a mixture of methods
4 4 Research Methods
The method used to conduct this study is important This method needs to be
capable of supporting the research, and capable of enabling and facilitating its
completion (Quinlan 2011 177) There exists a wealth of data which can be
analysed This data includes reviews of prior financial events and commissioned
reports analysing the many crises Additionally, financial data relating to the
performance of the covered institutions (their annual accounts), and, there is an
abundance of individuals with knowledge and opinion There is also a large
amount of literature, both academic and non-academic on this subject Before
56
4 3 Research Methodology
Page 58
we determine the appropriate data collection methods, we must again consider
our objectives The objective of the research is to analyse both the recent
financial crisis in Ireland, and, previous crises that occurred globally The analysis
of the recent crisis should focus on relevant data available
The study includes both qualitative and quantitative research The quantitative
research involves an analysis of the financial statements of the six covered banks
from the period 1999 through 2010 This analysis provides a longitudinal,
through-cycle view This analysis is vital as it provides actual data points relating
to the performance of the covered institutions through the cycle of expansion to
failure The analysis is compared to non covered institutions that did not fail The
quantitative analysis includes semi-structured interviews with key informants
Semi structured interviews were used as the preferred data collection choice for
the following reasons It was first determined that a qualitative analysis would
complement the quantitative data extracted from the financial statements The
pragmatic viewpoint enables both qualitative and quantitative data application It
was determined that a broad range of candidates would be selected for the
purpose of data collection This included both bank and non bank personnel at
varying levels of seniority The range of informants provides a more embedded
view, as opposed to a narrowly focused view A focus group was problematic and
eventually not possible, as bank personnel were reluctant to meet with regulatory
staff Structured interviews and surveys were quantitatively limiting It was
determined that semi structured interviews would achieve the optimal results
The data from the quantitative financial analysis was triangulated with the data
from the qualitative research and literature analysis For example during the semi
structured interviews, an informant described how the CEO of Anglo Irish Bank
made a commitment to staff to increase profit by 100% between 2005 and 2007
It is possible to validate this statement by looking at the financial statements in
the quantitative analysis Additionally, an extensive literature review was
conducted on the history of banking, and the history of financial crises Further
analysis was conducted on the more recent reports commissioned on the current
57
Page 59
financial crisis This literature review has proved valuable in analysing the cause
of previous crises, and understanding the importance of accurately diagnosing
the cause of financial banking failure
4 5 Research Conclusion
The research philosophy of the study follows a pragmatic approach in using both
qualitative and quantitative analysis in order to understand and identify key
factors The quantitative analysis will include the financial statements and annual
reports for the nine banks in our case study over a period of twelve years from
1999 through 2010 This sample period will provide a longitudinal analysis, or a
through-cycle analytical view of the financial performance of all nine banks in the
study This analysis is intended to identify trends and ratios that will assist us in
understanding key stress indicators In addition to the quantitative analysis, we
have used a qualitative analysis approach This is in the form of a semi
structured interview with a number of key informants in the Irish banking industry,
both within the banks and also in the regulators office, and a customer in the
property development sector The qualitative data is triangulated with the
quantitative data from the financial analysis and literature, which provides us the
ability to validate our research findings
58
Page 60
CHAPTER 5
This chapter involves an analysis of the financial statements of the six covered
institutions The financial review provides a quantitative analysis in our pragmatic
approach of using both qualitative and quantitative research (Saunders et al
2007) The financial accounts provide key data points in our effort to fully
diagnose the crisis They represent the ‘black box’ of data points providing vital
information regarding the condition of banks during the crisis, as they navigated
through the economic environment Our analysis will show that covered
institutions grew at unsustainable levels
The analysis of the six covered institutions is compared to three non covered
foreign banks operating in a similar business environment that successfully
navigated through the financial crisis without failing (Barclays Bank, Santander
UK PLC, and CIBC) The intent is to identify key indicators of success versus
failure The financial analysis of annual accounts is conducted on a, through the
cycle, longitudinal basis as opposed to a point in time basis The through the
cycle analysis will incorporate the balance sheet and income statement analysis
for the periods 1998 through 2010 providing a 13 year data base Through the
cycle analysis will provide higher quality analysis compared to point in time
analysis by avoiding temporary changes in banks position, and is considered a
superior measurement technique, (Altman & Rijken 2005), (Cantor & Mann
2003) The time period selected allows analysis of the banks prior to the
reduction of global interest rates following September 2011, and follows the credit
expansion and contraction through 2007 Due to the severe impairment of loans
in the periods 2007 through 2010, and the significant transfer of assets to NAMA,
and the injection of capital in this period (Honohan 2009), the bulk of analysis will
concentrate on the time period 1999 through 2007 This will assist in capturing
what is considered normal trading activity The banks under examination in our
59
5 1 Financial Analysis of Banks
Page 61
analysis were primarily involved in traditional bank lending activities, using a
combination of customer deposits and debt to fund traditional lending Lending
was concentrated in both the residential mortgage business, and the domestic
property business Additionally a number of banks were engaged on international
lending both within commercial loan activity, and property development activity
Our analysis of the banks will focus on the following key ratios
Profitability TNW/Total AssetsTotal assets CapitalRevenue Debt/Equity
These indicators will provide a key insight into the functioning of the banks The
financial statement is spread for all nine banks in our test period and a detailed
analysis is attached in Appendix H Summary of Financial Analysis
5 2 Summary of Financial Analysis
The 13 year financial analysis provides some key findings All covered institutions
enjoyed profits through 2007 Additionally, the banks enjoyed increasing revenue
and asset growth through 2007 The periods from 2007 through 2010 show
severe financial distress as expected All institutions experienced heavy losses
and dramatic reductions in both revenue and asset value Capital ratios for all
institutions as noted earlier were sufficient Due to the severe distress
experienced in the industry in the periods 2007 through 2010, we create two
views, View A including only through 2007 eliminating the distorted crisis years,
and view B including all years This enables us to analyse the data from both
perspectives Fig 7 Average Ratio Analysis through 2007
Loan book Deposit book Deposit ratio Debt Equity
Leverage Bad debt EfficiencySustainable growth rate
60
Page 62
Fig. 7 Average Ratio Analysis Through 2007
Profit MarginAnglo2321%
AIB18 17%
BOI9 33%
IILP33 03%
EBS9 33%
INBS33 59%
Barcl12.97%
San423%
CIBC 10 69%
Asset Growth 37 56% 12 38% 17 26% 1542% 17 36% 18 73% 23 00% 200% 200%
Revenue Growth 35 07% 11 32% 1605% 18 69% 20 52% 25 14% 14.00% 8 00% 200%
Loan Growth 36 61% 14 54% 16 63% 23 04% 16.42% 24 65% 1200% 800% 4 00%
Deposit Growth 32 99% 10 31% 10 98% 19 36% 13.21% 12 15% 11.00% 4 00% 4 00%
AWDC 2237% 25 81% 23 00% 1800% 22 96% 1852% 28 00% 26 75% 63 00%
Debt Growth 79 26% 31 76% 5901% 26 62% 37 67% 121 14% 26 00% 9 00% 200%
Equity Growth 41 89% 1230% 9 73% 5 68% 1691% 26 58% 15 00% -5 00% 3 00%
TNW/Total Assets 3 42% 5 12% 4 00% 4 69% 400% 848% 2 00% 300% 4 00%
CAR 8 28% 7 48% 4 00% 4 72% 11 55% 8 80% 9% 933% 9 00%
Debt/Equity 506 0 05 4 93 506 439 253 6 10 11 36 375
Leverage 29 88 1965 25 95 23 56 24 99 11 68 51 00 41 00 24 00
Bad Debt/Equity 7 95% 287 94% 1 82% 067% 081% 372% 1200% 500% 7 00%
Efficiency 18 90% 69 76% 58 00% 57 83% 71 52% 40 67% 72 00% 73 80%
Sustainable Growth 25 52% 11 28% 18 20% 305% 11 36% 15 29% 1900% 600% 4 00%
Growth Delta 12 04% 1 10% -0 94% 1237% 6 00% 3.44% 4 00% 400% -200%
GDP Growth Rate 1300% 13 00% 1300% 1300% 13.00% 13 00% 5% 5% 9%
Fig. 8 Average Ratio Analysis Through 2010
Profit MarginAnglo-73%
AIB-958%
BOI8 84%
IILP28%
EBS-1 28%
INBS-179 02%
Barcl12%
San9%
CIBC9%
Asset Growth 25 97% 822% 11 57% 11 16% 1297% 9 89% 20 74% 485% 209%
Revenue Growth 20 77% 3 15% 841% 924% 13 15% 628% 1042% 5 79% -051%
Loan Growth 21 44% 8 46% 1149% 1703% 12 13% 7 38% 11 22% 895% 3 73%
Deposit Growth 24 64% 720% 9 35% 17 19% 12 09% -2.81% 9 19% 683% 3 85%
AWDC 30 44% 28 13% 24 06% 27 52% 2347% 2436% 2621% 24 78% 60 80%
Debt Growth 50 96% 20 53% 37 33% 17 56% 2598% 74 14% 2245% 614% 047%
Equity Growth 30 48% 6 11% 8 79% 0 87% 10 89% 770% 21 21% 1022% 3 33%
TNW/Total Assets 3 71% 4 92% 3 84% 0 87% 3 75% 7 76% 21 21% 2 60% 387%
CAR 8 34% 7 16% a 08% 413% 8 84% 992% 9% 0077531 991%
Debt/Equity 4 77 3 20 5 88 5 57 5 08 265 559 1020 377
Leverage 28 21 48 27 07 28 13 26 77 - 55 79 48 37 38 87 23 57
Bad Debt/Equity 83 53% 24 65% 4 18% 1.21% 13 74% -248 54% 1300% 597% 735%
Efficiency 121 03% 47 15% 60 10% 83 65% 124 46% -16 88% 33 23% 000% 7124%
Sustainable Growth 41 65% -20 98% 14 10% 2 37% -1 88% -16 88% 15 77% 999% 8 05%
Growth Delta 67 63% 29 20% -253% 8 79% 14 85% 26 77% 4 98% -5 14% -5 97%
GDP Growth Rate 1300% 1300% 13 00% 13 00% 13 00% 1300% 4% 4% 8%
Page 63
The primary finding from our financial analysis indicates all covered institutions
experienced unsustainable asset growth rates when compared to non covered
institutions operating in similar environments Bank Growth Rates were high for
all periods for the covered institutions
Sustainable growth rates measure the asset growth rates under which financial
institutions can expect to grow This represents the maximum growth rate at
which the institution can grow (Higgins R , C , 1972) The formula for sustainable
growth is shown in Fig 9
Fig 9 Sustainable Growth Formula
G = Growth N I = Net Income R = Re\enue A = Assets E = Equity
(Higgins R , C , 1972)
The ratio calculates the maximum rate of growth using a multiplier of margin,
return on assets, return on equity, and retention Our analysis clearly shows
asset growth rates greatly exceeding the sustainable growth indicators for all
covered institutions The data provides evidence of a banking industry growing
faster than the growth within the economy This is clearly illustrated in the
accounts for Anglo Irish Bank for the year ending 2006 The accounts show 81%
or €39 million of the loan book was concentrated in the Irish and UK market
(Anglo Irish Bank Annual Report 2006 86) Balance sheet and revenue growth
exceeded sustainable growth and GDP growth in Ireland, representing a growth
focused sales driven industry for all covered institutions Anglo Irish Bank
experienced the highest average annual growth rates for asset growth, revenue
growth, loan book growth, deposit growth, and debt growth It also experienced
62
Page 64
the sharpest decline In the crisis. Fig 10 and 11 shows the annual growth rates
for the covered institutions for the period 1999 through 2008.
Fia. 10 Annual Growth of Covered Institutions
Allied Irish Banks AIB Growth 1999-2008 Bank of Ireland Growth 1999-2008
.10 1------------------------------------------------------------------------------------o1999 2000 2001 2002 2003 2004 2005 2006 2007 2008
Irish Nationwide BS Growth 1999-2008 Educational BS Growth 1999-2008
I Total assets real growth rate %
-Total assets (RHS, €bn)
l " I » t » t " i
1999 2000 2001 2002 2003 2004 2006 2006 2007 2008
T 18 90 j16 80 -
-- 14 70 --
-- 12 60 --
-- 10 .2 50 -
-8 S 3? 40 -<*>
- 6 30 -20 -- 410 ---- 2
- 0 0 --10 ■■
I Total assets real growth rate %
■ Total assets (RHS, €bn)
■lÎi.I1, ! . .
25
20
- 15
- 10
5
01999 20002001 20022003 200420052006 20072008
Figure 9: Growth rates of six Irish banks, 1999-2008 Line: Total assets at end o f each accounting year € billion (RHS)
Bar: % real growth rate (LHS)Source: Bank Annual Reports
Source: Honohan Report (2009:26).63
€ bi
llion
Page 65
Fig. 11 Asset Growth of Covered Institutions
Fig. 11 displays the growth trend of covered institutions. Fig. 12 displays the
asset growth rates for the non covered institutions:
64
Page 66
Fig. 12 Asset Growth of Non Covered Institutions
The covered banks are compared to the non covered banks. CIBC displayed the
most conservative growth rates, with asset growth below the sustainable growth
levels in all periods. Barclays Bank however has experienced high asset and
revenue growth rates. Santander UK PLC also experienced modest levels of
asset growth. Asset growth for Barclays has exceeded sustainable growth rates.
An explanation to this may lie in the acquisitions made by Barclays in this period.
As noted in Appendix H, Barclays made a number of large acquisitions. It is
therefore put forward these acquired assets were efficient, well managed
institutions that did not increase the risk of Barclays by their rapid inclusion.
Further analysis may be required relating to Barclays growth rates. It is not clear
if this aggressive growth rate will impact the strength of the bank in future
periods.
A significant observation from the financial analysis is as follows:
65
Page 67
• Bank management supported high levels of asset growth Asset growth
levels far exceeded economic growth indicators, and were maintained at
unsustainable levels prior to 2007
• Capital adequacy measures are ineffective at measuring the health of
banks
The three non covered banks present an inconsistent picture Their ratios show a
mixed picture considering the banks survived the crisis Barclays Bank provided
the most inconsistent data The bank demonstrated considerable asset and debt
growth, consistent with the covered institutions The capital ratio for Barclays is
higher than the covered banks Overall Barclays growth was higher than
sustainable growth levels, and GDP The observations of Barclays lead to two
conclusions
1) Barclays bank has similar problems within its balance sheet and may
experience significant asset impairment beyond its capital base at some
point in the near future
2) Sustainable asset growth is managed at Barclays bank The bank has
superior management skills enabling it to avoid issues experienced in
Ireland This is driven by an acquisition of banks that are managed
effectively
Santander’s numbers are distorted by the acquisition of Abbey National Bank
Their loan book grew significantly beginning in 2005 Growth overall however
was within both sustainable growth levels and GDP CIBC is the one bank in the
sample period that maintained consistent growth levels within sustainable growth
and GDP levels CIBC presented the most stable growth rates of all non cover
institutions The bank has experienced consistent moderate growth rates of
66
Page 68
between 2-3% for all periods While these rates may seem low, the bank is
ranked as one of the top 10 banks globally in terms of credit quality (Bloomberg
2012) Both Santander and CIBC maintained growth levels below their
sustainable growth levels, and have survived the financial crisis
The financial data provides evidence that banks that experienced growth rates
higher than their sustainable growth rate, are at greater risk of failure (Of the
nine banks in the sample, seven banks experienced growth rates above the
sustainable growth model Six of the seven banks failed)
67
Page 69
CHAPTER 6
6 1 1ntroduction to Interview Analysis
The previous Chapter focused on quantitative analysis The purpose of this
chapter is to focus on qualitative research A detailed description of the
informants is attached in Appendix I ‘Interview Results’
The objective of the interviews is to gain an insight into behaviour and practice
within the sector Our intent is to understand how the actors directly involved in
the actions and activities, made decisions An exploratory approach is employed
in the interview process This helps in determining an understanding of the
actions and decisions made during the period
For a successful qualitative analysis, it is important to understand the various
actors in the research (bank managers, regulators, investors, customers, etc)
and understanding their role in the process Understand their motivations This
qualitative research requires a pragmatic approach in understanding how these
actors interact through symbolic interactionism, and how their actions, behaviours
and decisions are influences by their environment, (Saunders et al 2009)
6 2 Research Question
Our analysis will highlight the primary factors that cause the financial crisis This
research will show that a poorly controlled structure of banks is a primary cause
of failure The structure lacks adequate controls required for sound lending
Additionally, an autocratic style flourished in this structure External factors
contributed to the excessive unsustainable growth levels experienced in the
sample period The primary questions proposed for the initial interviews are
covered by the following topics
68
Page 70
• Understanding the level of commitment the participants had to their
organisation
• Identifying key causes to systemic failure within the industry
• Identifying potential solutions to weakness in the industry
• What knowledge did they have of consequences to actions
Appendix J details the interview questions
6 3 Interview Results Observations
The results were into sections The first section is a quantitative section which
also covers commitment The second section looks at the predictability of the
crisis The third section looks at the causes of the crisis The fourth section looks
at the potential solutions Each section will provide some participants quotes,
provided anonymously, and followed by a summary
6 4 Results Quantitative Analysis
This includes the total number of years employed in the industry Questions are
intended to determine the commitment to the company and the industry of the
participants Additionally, questions are used to determine the level of satisfaction
achieved in working in their respective industries The participants shared over
158 years of banking industry experience, and a combined 195 years of industry
related experience The participants all demonstrated a wealth of experience and
knowledge of their respected fields The number of years both collectively and
individually, demonstrates a level of job commitment which validates the
continuance theory in organisational commitment (Allen & Meyer 1997) The
participants also demonstrated levels of normative commitment in their desire to
continue to remain employed in their organisations, and affective commitment in
their collective emotional attachment both to an industry and their respective
organisations Without exception all participants expressed a high degree of
69
Page 71
satisfaction to question # 5. Question 4, why did you join the industry received
some interesting responses:
“I joined the bank because I completed my leaving certificate and was
always told that the banking industry was a solid career choice. My mother
was proud of me when I got my first job at the bank"
“I joined the bank because my father was employed in the bank, and it
was a natural progression for me once I completed University”
“I joined the bank because it offered a good career path, and was
considered a secure working environment”
There is some implication that a sizable group of staff within the bank of a certain
age, have been there for their entire career, and have limited exposure to the
external non-banking environment. This group may have become somewhat
insulated to the workings of the banking industry. Overall there was a high
degree of pride and satisfaction from the entire group of the industry.
6.5 Results Predicting the Crisis
Question 8 & 9 ask if the crisis was foreseen and preventable. There was a
mixed response to these questions with the majority saying yes. Fig. 13 is a
summary of the observations:
Fig. 13 Predicting the Crisis Summary
Predicting The CrisisY N9 2
Factros Predicting The CrisisManagement 10Excessive Growth 9Regulator 7Property 5Customers 3
70
Page 72
The majority of informants confirm the crisis was predictable On the yes side the
following comments were observed
“Yes, demand for lending was property driven, we all knew this, credit
standards were lowered and losses were low, we should have known this
was a concern”
“The regulator should have had access to the data, the growth was too
high however the regulator was more concerned with banks overcharging
consumers, than worrying about the solvency of the banks”
“Regulation was blinkered at the time of the establishment and promotion
of the IFSC, which was created as a jobs initiative”
One participant who claimed to have voiced concern over the easing of credit
and the rapid growth of the domestic mortgage book said
“I voiced my concern over the rapid increase in the mortgage book, and
the shift from branch control, to head-office credit committee, and I was
told I was ‘Yesterday’s-Man’ ”
Another common sentiment was the lowering of credit standards
“Product innovation became a major issue for theee domestic banks,
however when new products came on the market, there was little regard
for credit quality There was a major change in the credit quality of 100%
mortgages, however the bank was sales driven”
71
Page 73
“In early 2005 I saw things were out of control, if I saw this, others clearly
did also, however I believe our CEO was too far removed from reality to
really understand what was going on in the real world”
“The regulator should have been monitoring the changing mortgage
business in Ireland with weakening credit standards, 100% mortgages,
Interest only mortgages, this is something the regulator should have
managed”
“The regulator knew of the governance problems at INBS, the problem
was the senior executive and board were warned to fix the problem but
there was no follow through from the regulator, they did not know how to
act strongly Management at the bank were not reacting to threats
because they never believe there would be any consequences IBNS
thought they were above the law”
On the dissenting side the following comments were observed
“While there were concerns at the time, there was a genuine fear that if
you make negative commentary about the domestic banks, you would
create a run This was always a very big problem and one which the
regulator and the department of finance was keenly aware of’
“We needed to maintain a level of confidence to ensure we did have a soft
landing”
“No we could not have prevented the crisis, there was too much going on
at the time, we had no idea how the bank was being funded, the model
became too complex for any one person to see all the parts and
understand the risk, this was the job of the CEO, but he was so far
72
Page 74
removed from reality, he did not actually live in the real world, not like the
average person”
Another comment on a general discussion also echoed the above statement,
“It is really the job of the CEO to ensure all the risks of the bank are being
managed, including the loan book, and funding composition. This was
clearly not happening at my bank, but also at the other banks as well”
The commentary on predicting the crisis is heavily focused on regulation and the
central bank. Additionally, there are a number of references to government
influence. There was a sense the banks were almost out of control, with senior
management somewhat out of touch with what was going on. The majority of
participants agreed that the crisis was predictable and preventable.
6.6 Results, What Caused the Crisis
This section received the majority of attention from participants, who had clearly
considered this question in advance, and were able to communicate significant
amounts of information.
Fig. 14 summarises the participant’s response to question 10:
Fig. 14 Cause of the Crisis Summary
Cause of Crisis ParticipantsRegulator Bank Structure PoliticsAggressive LendingFundingGreed
764433
Informant comments for question 10 included the following:
73
Page 75
“The regulator was clearly not equipped to manage the domestic banks
They only had one person dedicated to Bank of Ireland for example How
in the world are they supposed to manage such a large bank with only one
person?"
“The supervisory department was not talking to the economics
department There was no holistic picture of the banking landscape”
“The regulator was focused on getting the returns from the domestic
banks The focus was on liquidity ratios There was no big picture view”
“There were clearly not enough people at the regulator to do what was
needed, a complete analysis of the solvency of the banks This was not
done”
“There was strong reliance on the boards of the banks to ask questions of
management and ensure things were running properly This was clearly
not happening”
“INBS were operating outside of their charter, the regulator knew this but
did not act”
“The regulation from the regulator continues to be poor, for example, the
code of conduct restricts banks from contacting customers more than 3
times This restricts banks from going after non-paying customers”
Commentary from 7 of 11 participants discussed the regulator in answering
question 10 There was discussion around the lack of resources at the regulator
and a lack of focus and power to manage the industry There is also a degree of
74
Page 76
arrogance on the bank level to the extent the domestic banks knew the regulator
was powerless in enforcement
“The bank had a credit policy that set out rules for lending If a deal did not
meet policy it was signed by the CEO as an exception Towards the end of
2007 everything went to the CEO for signature Nearly every big deal was
an exception Exceptions were never tracked The policy was
meaningless”
“The banks engaged in product innovation This resulted in weakening
credit standards There was no structure within the banks to calculate for
example what effect tracker mortgages had on the loan loss reserve”
“Demutualisation was a partial cause of the crisis Once the building
societies turned members into shareholders, the management had to
provide returns The focus became growth This is also a problem for
public banks”
“The structure of banks continues to be a problem Boards are not
independent and therefore have no real power There is no follow through
from the board”
“Banks that were poorly managed should have been allowed to fail INBS
and Anglo are good examples of banks that had poor control mechanisms
The CEO of both banks were too much involved in decision making They
signed deals making exceptions to policy This made a joke of credit
committees”
It is clear from the commentary that the bank structure was a major factor Six of
the participants indicated bank structure as a problem The issue relates both to
75
Page 77
the weakening of controls by senior management, and the lack of independence
of boards.
6.7 Results, Solutions
In the final section of the interview we focused on potential solutions, and
identified change needed. Key answers are identified from question 11 and 12
and these answers are highlighted below.
In summary, all participants responded to question 11 and 12 with similar
answers recorded under question 10. The interview sessions recorded the
regulator, bank structure, and politics as the primary reply to these questions.
Some surprising replies were recorded that did not fall within the above category
mentioned. These included 'technology', and, ‘further deterioration in the
residential mortgage book'. The technology comments related to the fact that the
banks were currently restricted from making any investment in technology, which
is much needed given the increased potential for fraud, and data compromise.
Answers were collected from question 13 through 22 recording the Yes, No, and,
Undecided answers. The results are displayed in Fig. 15. It should be noted that
not all participants answered questions 14 to 22.
Fig. 15 Semi Structured Interview Results
13 14 15 16 17 18 19 20 21 22Y 4 9 9 8 5 5 5 9 9 9N 7 1 1 2 3 4 4U 2 1 1
Total 11 10 10 10 10 10 10 9 9 9
6.8 Interview Analysis Conclusion
A summarised review of our findings from the semi structured interviews is
displayed in Fig 16. All informants provided commentary on our primary factors
76
Page 78
listed in Fig 16 The primary factors are listed as Excessive Growth, Autocratic
Management, and Structure The informants also provided additional external
factors such as regulation and government as strong influencing factors The
regulator was listed as the primary factor causing the crisis, and is categorised as
an external factor This research provides evidence that a structural deficiency
within the banking industry provided an environment for autocratic leadership
Our research concludes that a classic banking failure occurred External factors
such as increased asset prices, lower cost funding, weak regulation, and strong
political influence, provided the fuel to grow the bank at excessive rates With a
lack of control and accountability in place, the banks continued to grow at
unsustainable levels for an extended period It might be argued that the external
factors caused the crisis which was in truth a secondary crisis Fig 16 provides
empirical evidence that internal management decisions were the root cause,
resulting in a diagnosis of a classic banking crisis
77
Page 79
Fig. 16 Interview Analysis
Excessive Growth Autocratic Management Structure and Control
The bank was sales driven I was told I was yesterdays man There was little regard for credit quality
1 had a target of loans to sell each month. Each year the target grew
I believe our CEO was too far removed from reality to really understand what was going on at the bank
In early 2005 I saw things were out of control
We had to compete with RBS and Anglo It all became so competitive, to keep growing the book
Management at the bank were not reacting to threats because they never believed there would be any consequence
Nearly every big deal was an exception. Exceptions were never tracked
The focus was all about growing revenue They thought they were above the lawThere was no structure to calculate the effect tracket mortgages had on loan loss
Sales were driven by bonuses Our CEO did not live in the real world
When they moved the credit decisions to the head office, the branch managers became salesmen
Ireland's World War, which will leave an economic scar on the next generation
Once the building societies truned members into shareholders, the management had to provide returns
00
Page 80
7 1 Conclusion
Our study has revealed some interesting findings about the banking industry The
financial crisis that hit Ireland in the period 2008/2009 was a severe crisis The
results of which may scar those it touched for a generation The Irish crisis was
not a unique event There have been many banking failures in history that closely
resemble the Irish bank crisis
The study has found it is critically important to accurately diagnose a crisis before
a solution or corrective policy can be designed and implemented A critical flaw of
many economists is to categorise banking failure as a singular phenomenon
(Marshall 2009) Banking crisis however can be categorised into two types, a
classic crisis and a secondary crisis The principle difference relates to the level
of participation, responsibility and endogeneity of the banking system in the
development of the crisis (Marshall 2009) Ireland experienced a classic banking
crisis, caused by internal bank management decisions, as opposed to a
secondary crisis caused by external macroeconomic factors By misdiagnosing
the Irish crisis as a secondary crisis, or a singular phenomenon, we fail to ensure
the corrective treatment is applied to the participants responsible, and continue to
allow institutions to lend to problematic lenders This failure is a fundamental
reason for the continuation of the current financial crisis The crisis has been
misdiagnosed resulting in the wrong treatment Corrective policy has not been
applied
The structure of banking has shown to be lacking in adequate planning, control
and accountability mechanisms Our research in the history of joint stock banking
in Ireland have been constructive as it provided data on a system of banking that
contained accountability to shareholders The unlimited structure of joint stock
banks eliminated the agency problem that exists today (Jensen & Meckling
1976) The Joint stock system was an important era in the history of Irish
79
CHAPTER 7
Page 81
banking, as the unlimited liability of shareholders was linked directly to the
security of depositors Shareholders were closely involved in the governance of
the banks of joint stock companies (Hickson & Turner 2005) Furthermore, the
loss to shareholders under bank failure can be less than the total loss to
depositors, or even taxpayers, (Walker 2009) It may not be possible however to
unilaterally return to the joint stock system in Ireland There are elements of this
structure that we can adopt today
The structure of banking has allowed for a style of leadership to emanate This
leadership style has been one of an autocratic leader This style was observed
through our analysis of historical financial crisis, and was apparent in the semi
structured interviews The leadership style involves leaders who eliminate control
and independence, in favour for a narrow dictatorial arbitrary management
approach These leaders often engage in independent decision making,
particularly when it comes to lending decisions Often the line between legal and
illegal decision making can get blurred (Kindleberger 2009) Historical records
have provided rich evidence of bank leaders who adopted autocratic leadership
styles, much to their detriment The structure of banking facilitates this leadership
style
Our final observation in our analysis has been the theory of unsustainable
growth The quantitative analysis of financial reports for the covered institutions
was critically important in completing this observation We can clearly see the
asset and revenue growth rates for all institutions during the sample period Both
structure and management leadership provide the environment for banks to
permit and maintain excessive growth levels Our evidence demonstrates that
growth rates above sustainable levels provide increased risk of failure
Additionally, external factors such as a lax regulatory environment, liberalised
banking laws, asset appreciation, low funding availability, can also accelerate the
excessive growth levels within an institution (Kindleberger 2009)
80
Page 82
The research has supported the theory of bank structure, autocratic
management, and unsustainable growth
The semi structured interviews also produced a surprise finding which may
require additional research This finding relates to the comments that bank
employees join the banks from school and remain at the bank for life This may
contribute to the groupthink and herd mentality issues raised by Nyberg
(2011 48) During the interview stage, a number of informants referred to the
culture within the bank The “yesterday’s man” remark when challenging
authority, which created a closed environment, supports our autocratic leader
view It is possible that the hiring practice did not promote contrarian expression,
and limits challenging authority Further research is required on this theory
7 2 Recommendation
The banking crisis continues to have an impact on the industry and the country of
Ireland One participant referred to the banking crisis as
“Ireland’s World War, which will leave an economic scar on the next
generation”, (Anonymous 2012)
It was evident from all participants interviewed, that the problems within the
industry will be difficult to resolve There are three recommendations resulting
from this research
The first recommendation is correctly diagnosing banking crises into classic and
secondary categories This is achieved by identifying the primary factors causing
banking insolvency, and categorising them into internal versus external events
Once a bank failure can be accurately diagnosed, a corrective policy can be
applied
81
Page 83
The second recommendation is to address the structural deficiencies within the
banking industry It may not be possible to return to the joint stock system,
however it is possible to return accountability to bank leaders Senior executives
should be held accountable for management decisions There are a number of
areas where this can be achieved
• Grant boards more control into the daily management of banks Non
executive board members should attend management meetings on a
regular basis
• Decentralisation of some control functions to remove decision making from
the head office For example appointing branch managers higher approval
authority over lending decisions
• Publish, policy exception tracking, loan approval, loan decline reports This
will provide more transparency
• Provide mandatory education for all control functions, in the history of
bank failure Begin with the required reading of ‘Mamas, Panics and
Crashes, A History Of the Financial Crisis’ by Charles Kindleberger
The third recommendation relates to providing a set of financial ratios that more
appropriately reflect the health of banks They should include sustainable growth
measures The ratios in Fig 17 provide some indicators that will assist in
identifying problems
82
Page 84
Fig. 17 Financial Ratios
Ratio 10 year AverageProfit Margin PositiveAsset Growth < Sustainable GrowthRevenue Growth < Sustainable GrowthLoan Growth < Sustainable GrowthDeposit Growth < Sustainable GrowthAWDC Debt Growth
<20%< Sustainable Growth
Equity Growth < Sustainable GrowthTNW/Total Assets < Sustainable GrowthCAR 0.15Debt/Equity 0.04Leverage < 20xBad Debt/Equity >20%
A robust control mechanism providing accountability is required in the banking
community. We continue to uncover examples of senior management engaging
in management decision making in an uncontrolled and loosely reported
environment.
Our recommendation is that an additional set of ratios are included for all
banks to include both internal indicators and external indicators. Banks should be
as much aware of the external environment as they are about their internal
environment. While it will always be difficult to identify a bubble in the future, it
should be prudent to expect banks to grow at or below their sustainable growth
margin, or GDP rate. It is also recommended that banks employ a through cycle
view of their financial performance (10 or 15 years), as opposed to a 2 year view
which is currently employed.
83
Page 85
CHAPTER 8
La Touche Bank was established by David Digues La Touche as a private bank
in Dublin in 1716 as a result of his business becoming a gathering place for
Huguenots who travelled outside Dublin, and left their money with him for
security Customers were mainly aristocratic and professional The bank was
taken over in 1879 by Munster Bank
Newcomen’s Bank, was founded in 1722 in Dublin Customers were mainly
aristocratic and professional The bank closed in 1825 following the death of its
owner who reportedly committed suicide by shooting himself A creditors
committee found the bank was managed ‘sovenly and wastefully’ with significant
defalcations surrounding expenses related to family members (Barrow G L
1975)
Finlay’s Bank Founded in 1754, the bank had a mercantile and trade customer
base It reportedly closed in 1829 without any outstanding creditors
Ball’s Bank, established in 1793 originally as Beresford Bank, was taken over in
1888 by Northern Bank as the Dublin branch
Shaw’s Bank founded in 1797 originally as Lighton’s Bank, name changed to
Shaw in 1804 The bank was taken over by The Royal Bank of Ireland in 1836 In
1966 The Royal Bank, Provincial Bank, and Munster & Leinster bank merged to
form Allied Irish Bank
Alexander’s Bank, founded in 1810 The bank failed in 1820 with heavy losses
Gordon’s Bank (Belfast) was founded in 1808, changed its name to Batt Bank in
1826
Tennent’s Bank (Belfast), founded in 1809, and also joined forces with Batt Bank
in 1827
Montgomery Bank (Belfast) founded in 1809, was taken over by the Northern
Bank in 1824
Malcolmson’s Bank (Belfast) founded in 1804, closed in 1820
Appendix A Irish Banks in 1800
84
Page 86
Leslies Bank (Cork) founded in 1789, closed in 1826 with outstanding debts
owed
Roches Bank (Cork) founded in 1800 Closed in 1820 following poor property
loans when land prices fell
Neweham’s Bank (Cork) founded in 1799 closed in 1824 satisfying all
outstanding liabilities
Maunsell’s Bank (Limerick) founded in 1789, AKA Bank of Limerick The bank
closed in 1820 following a run on several other private banks
Roches Bank (Limerick) founded in 1801, it survived the 1820 banking crisis and
was finally closed in 1825 when its business was acquired by Provincial Bank of
Ireland
Bruce’s Bank (Limerick) founded in 1808 the bank closed in 1820 with no
outstanding liabilities
Delacour’s Bank (Cork) founded in 1801 and closed in 1835, surviving the 1820
crisis
Scully’s Bank (Tipperary) founded in 1803, closed in 1838 and taken over by
Tipperary Bank
Riall’s Bank (Clonmel) founded in 1754, closed in 1820 following the closure of
Newport’s whom there were close ties
Watson’s Bank (Clonmel) founded in 1800, closed in 1809
Sausse’s Bank (Carnck-on-Suir) founded in 1894, closed in 1823
Newport’s (Waterford) founded in 1760, closed in 1820
Hayden & Rivers (Waterford) founded in 1816, closed in 1824
Scott’s Bank (Waterford) founded in 1816, closed in 1824
Redmond’s (Wexford) founded in 1770, in 1829 it closed and was taken over by
Bank of Ireland
Loughnan’s Bank (Kilkenny) founded in 1800, closed in 1820
Williams & Finn (Kilkenny) founded in 1800 closed in 1805 (Barrow 1975)
85
Page 87
Appendix B The History of Joint Stock Banks
Agricultural & Commercial Bank was established as a joint stock company in
1834, and collapsed in 1836, as mentioned above
The Belfast Banking Company was established in 1827 as a joint stock company,
merged with Northern Banking Company in 1970 to form Northern Bank, and is
presently owned by Danske Bank of Denmark (since 2005)
The Hibernian Bank Company was established in 1835 as a joint stock company,
and was taken over by the Bank Of Ireland in 1958 (Bankofireland com)
National Bank of Ireland was established in 1825 as a joint stock company, and
was taken over by the Bank Of Ireland in 1965 (Bankofireland com)
Northern Bank Company was established in 1825 as a joint stock company,
merged with the Belfast Bank Company in 1970 to form Northern Bank, and is
presently owned by Danske Bank of Denmark (since 2005)
Provincial Banking Company was established in 1825 as a joint stock company
and merged with the Royal Bank of Ireland, and Munster & Leinster Bank in 1966
to form Allied Irish Bank
Royal Bank of Ireland was established in 1836 and was merged with the
Provincial Banking Company and Munster & Leinster Bank in 1966 to form Allied
Irish Bank
Ulster Banking Company was established in 1836 as a joint stock company, and
continues to operate today It was taken over by the Royal Bank of Scotland in
2000
86
Page 88
Munster Bank was established in 1864 as a joint stock company The bank had
3,800 shareholders, and is reported to have a 9% share of Irish bank deposits
O’Grada, C (2010) The bank operated as a non-note issuing bank The bank
collapsed on July 15th 1885, Garda C , (2010) The failure of the bank was due to
corruption Loans to directors used in property speculation O’Grada notes that
‘sums to a very large amount had been lent to directors on inadequate security’
One of the banks senior managers George Farquharson, absconded the country
with large outstanding debts The Bank Of Ireland had supported Munster Bank
for some time, however in a letter dated July 11th 1885 the Bank of Ireland
declared it was withdrawing credit for the bank, Following the bank’s collapse, the
assets were purchased and a new bank was opened under the name Munster &
Leinster Bank, which survived until it merged into Allied Irish Bank in 1966
(Barrow 1975)
87
Page 89
Appendix C Summary of the Six Covered Institutions
The Central Bank of Ireland was established in 1943 (CBOI le) under the Central
Bank Act 1942 And in 1971 became the banker for the Irish government
The Bank of Ireland, as discussed in detail earlier, the bank was established as
an Act of Parliament in 1782 It is the oldest remaining bank in Ireland
Allied Irish Bank, established in 1966 with the merger of Provincial Bank of
Ireland, the Royal Bank of Ireland, and the Munster & Leinster Bank The origins
of Allied Irish Bank date back to 1825 with the opening of the Provincial Bank of
Ireland Allied Irish as previously noted, evolved from adversity with the
troublesome history of Munster Bank in 1885 This adversity resurfaced in recent
years with the £200 million loss of Insurance Corporation Of Ireland in 1985, the
trading losses of John Rusnak, who lost the bank $700 million in 2002, the €90
million tax settlement in 2000 relating to Deposit Interest Retention Tax, the
Moriarty Tribunal into the affairs of Charles Haughey found that AIB had offered
debt relief to Mr Haughey shortly after becoming Taoiseach in 1979, the bank
has never been far from adversity
Anglo Irish Bank, was established in Dublin in 1964 The bank grew in the early
years through acquisition, with the purchase of Irish Bank Of Commerce in 1988,
The Royal Trust Bank Austria in 1995, Ansbacher Bank in 1996, and Smurfit
Paribas Bank in 1999, in 1998 it bought Credit Lyonnais Austria The bank also
bought a number of loan portfolios mainly in the property sector (Lyons, & Carey,
2011) In January 2010 the bank was nationalised, and the bank was merged
with Irish Nationwide Building Society
Irish Nationwide Building Society was established in 1873 under the name Irish
Industrial Building Society, and changed its name in 1975 In August 2010 the
bank was nationalised following a capital deficiency of €5 billion
88
Page 90
Irish Life and Permanent can trace its origins back to 1884 with the creation of
The Irish Temperance Permanent Benefit Building Society, in 1940 the name
was changed to the Irish Permanent Building Society, the Society demutualised
in 1994 The bank purchased the Trustee Savings Bank in 2001, which had
established as a savings bank in Ireland in 1816 The bank’s history was also in
life assurance with the state creating Irish Life Assurance Company in 1939
following the collapse of a number of life assurance companies during the great
depression In 1999 the assurance company merged with the bank to form Irish
Life and Permanent
Educational Building Society was established in 1935 The bank was merged into
Allied Irish Bank in July 2011 following the collapse of the bank
89
Page 91
Appendix D Japanese Banks
An article in the Economist in 1998, sourced by Business Source Complete,
suggests that political pressure, a tradition of social responsibility and a fear that
bankruptcies would worsen the economy, all contributed to a delay in cleaning
the bank's balance sheets from bad loans Hokuyo Bank, which was managing
assets acquired from one of the largest banks in Japan, struggled to manage
debts from a large construction company ‘Chizaki Kogo’ located in Hokkaido, a
sparsely populated island north of Tokyo The construction company was run by
Mr Usaburo Chizaki who was a former minister for Transport in the influential
LDP (Sugawara S, 1998) A clear example that politicians influenced decisions
at major banks for apparent personal reasons
90
Page 92
Appendix E Author’s Personal Perspective on Argentina
The author has firsthand knowledge and experience of the Argentina crisis
having spent some weeks in Buenos Aires in 2002 negotiating a debt repayment
schedule on behalf of PanAmSat Inc a telecommunications satellite provider,
who was attempting to recover outstanding fees from Impsat, an Argentinean
Satellite provider The fees related to unpaid transponder services provided on
PAS 1-R satellite, amounting to several million USD The experience gained
while resolving this debt payment is important While, both companies had a need
to maintain a business relationship beyond the payment difficulties, PanAmSat
had to ensure precedence was not established regarding non-payment of
transponder fees around the world as it had many global customers in similar
economically challenging environments Finding a solution to this problem that
avoided any form of forgiveness was of critical importance The government in
Argentina had implemented restrictions on exporting capital from the country Our
dilemma was how to move a payment from Impsat made in Buenos Aires, back
to PanAmSat in New York The Bank Of New York provided the solution They
set up a mechanism which involved using the payment made in Buenos Aires to
buy shares in Telefonica SA on the Buenos Aires stock exchange ‘Bolsa de
Comercio de Buenos Aires’ and selling these securities as ADR’s on the New
York Stock Exchange The Bank Of New York had a trading desk on both
exchanges and were able to facilitate the transaction, and the process from buy
to sell took 7 minutes The transactions were all legal, although clearly taking
advantage of a loophole which the government had not identified The
mechanism worked for several weeks until the government noticed a sizable
increase in the volume of trading in Telefonica shares, and other Spanish
equities, and quickly closed this avenue of extracting a currency from the country
through the trading of equities My time in Argentina was enriched with stories of
business professionals buying and selling various commodities and products
including yachts and high-end automobiles, in an effort to extract wealth from the
country It was clear that in an open society like Argentina, the government was ill
91
Page 93
equipped with containing the flight of capital, even though the extreme measures
that were implemented at the time in the Corralito A lesson that needs to be
remembered today as we navigate through the current economic turmoil
92
Page 94
The IBC Report identified reasons for the UK banking failures as follows HBOS
had 56% of its funding requirements from the wholesale market, which froze
once the subprime market collapsed Additionally, its capital levels of 6% were
insufficient Lehman Brothers UK was overexposed to subprime mortgage bonds,
and over 30 times leveraged, it was unable to access wholesale funding,
Northern Rock had aggressive balance sheet growth of over 20% per year, and
only 23% funding from retail deposits, and it was also unable to prevent a sudden
loss of wholesale funding RBS which bought ABN AMORO in 2007, was left with
heavy debt and low capital of 4% It experienced heavy write downs resulting
from the acquisition, and also was unable to access sufficient wholesale funding
These were a combination of liquidity problems created by erosion of capital,
resulting in insolvency At the time the banks were claiming only to have short
term liquidity problems, unaware, or perhaps over daunted by the escalating
scale of their loss of equity It is noted that Barclays Bank, Standard Chartered
Bank, and HSBC were not affected by the crisis as they did not require
government support, Bradford & Bingley on the other hand was nationalised in
September 2008, and split in two, the retail business sold to Santander UK PLC
Appendix F Summary of IBF Findings
93
Page 95
Appendix G The Five Elements of Credit
Character refers to the reputation of the borrower, and their willingness to pay an
obligation This analysis varies depending on size of a borrower and their
management reputation Additionally, ethics, integrity, and trust are an integral
component of character This may be established by evaluating the history of the
borrower and understanding how they have honoured obligations in the past
Both people and industry can convey varying styles of character
Capacity refers to cash flow or the ability to repay The ability of a borrower to
maintain sufficient profits or cash flow streams enabling it to repay the debt
Capacity may derive from either existing commitments, or from future
commitments The construction and property development industry is heavily
dependent on future events The ability of a developer to sell property at some
future date will dictate the ability to satisfy a debt In these circumstances,
capacity will be influenced by present and future conditions, and past
experiences The success of a developer in prior projects will help underwriters
evaluate a borrowers capacity potential
Collateral refers to the assets used as security in the event of default This is
important analysis for underwriters in evaluation options for converting collateral
into cash in the event of a default or workout This is typical in asset backed
lending The size and value of collateral will vary on the type of loan For example
a typical consumer mortgage involves securing a home as collateral In the event
the borrower is unable to repay the debt, the lender can take possession of the
home and resell the asset in order to satisfy the loan Typically credit card debt
does not include collateral due to the short term nature of the debt, and the
revolving balances involved Underwriters may request the borrower to provide
personal guarantees as collateral to ensure the borrower is held personally liable
for the loan, in the event the existing collateral is in a pre-development stage In
94
Page 96
workout stages, lenders may seek collateral from a borrower through a lien or
judgment. The key factors for banks in securing collateral are:
1) Determining the true cash value of collateral
2) Ensuring the asset is free and clear from other lenders
3) Ensuring clean documentation in registering the security interest
Conditions: refers to the environment the borrower operates within. Events that
may have an impact on the performance of the borrower and their ability to
honour the obligation are considered conditions. These include the interest rate,
the economic environment, political environment, business environment, weather
etc. For example the Eyjafjallajokull volcano in Iceland caused business
interruption for several airlines including Ryanair, which estimated an additional
cost of £88 million due to the volcano (www.rvanair.com/en/investor/investor-
relations-news). This may impact their ability to repay debt. It is therefore
important for underwriters to continuously monitor industry indicators to ensure
conditions support a borrower’s ability to pay. For example an increase in the
unemployment rate will have a negative impact on the ability of mortgage holders
to pay. Demographic and economic conditions such as unemployment, divorce,
increase in dependencies, all increase the probability of default, (McCarthy
2011).
Capital refers to the down-payment, or investment the borrower makes. This is
also referred to net worth for companies, or equity for property investments. Not
all capital is cash specific. Many companies may have significant equity in their
business represented by low levels of debt over assets. These assets may not
always be represented in the form of cash or liquid assets. The underwriter must
evaluate the value of equity as it relates to the borrower’s ability to fulfil the
obligation.
95
Page 97
Appendix H. Summary of Financial Analysis
It should be noted that two of the entities in our study operated outside the
normal banking charter, both EBS and INBS operated as building societies Irish
Life and Permanent operated both banking and life assurance operations,
resulting in a somewhat uneven comparison when analysing financial
performance Every effort is made to focus on the banking side of the financial
analysis Data was extracted from Annual Reports
Anglo Irish Bank
Anglo Irish bank presented profits for all periods leading up to 2009, when the
bank encountered difficulty The bank displayed a healthy increase in profit from
58 million in 1998 to 1,219 million in 2007 Profits peaked in 2007 at 1,219
million Profit margin for the bank hit a max of 30% in 2004, and averaged 23%
through 2007 In 1998, Anglo Irish Bank had a total asset balance of €5,561
million This increased to €73,128 million in 2010, and peaked at €101,321 million
in 2008 at the height of the boom, an increase of 1,722% The average annual
growth rate for the period 1999 through 2010 was 26%, the average annual
growth rate for the period 1999 through 2007 was 38% The annual revenue for
the bank was €123 8 million in 1998 Revenue increased to €2,152 0 million in
2010, and peaked at €2,700 0 million in 2009 The 13 month revenue increase
was 29%, compared to the 10 month increase of 35% through 2007 Total loan
balance in 1998 was €4,816 million, compared to €27,889 million in 2010, an
average annual increase of 21% Loans peaked in 2008 at €86,153 million The
13 month annual loan growth rate was 21%, the 10 month loan growth rate
through 2007 was 37% Loans were funded by customer deposits (including
bank) totalled €4,781 million in 1998, increasing to €57,658 million in 2010
Deposits peaked at €71,952 million in 2008 The 13 month annual average
growth was 25%, the 10 month growth rate was 33% Wholesale deposit ratio
was on average 22% through 2007 Loan growth was also funded by external
96
Page 98
debt, which was at €361 million in 1998, and ended 2010 at €7,421 million Debt
peaked at €28,862 million in 2007 Average annual debt growth was 51%, with
the 10 year average debt growth rate at 71% through 2007 This increase in
external debt represents the single largest balance sheet growth for all classes,
with funding for the banks operations clearly shifting from deposits to debt
between 1998 and 2007 Between 1999 and 2000 debt grew by 321%, while the
total balance sheet grew by 39% Further analysis of this will be required Equity
was at €181 million in 1998, and ended 2010 at €3,518 million Equity peaked at
€4,148 million in 2009 The annual average growth rate for equity was 30% for 13
years, and 42% for the 10 year period through 2007 Tangible net worth was on
average at 4% for the 13 year period and 3% for the 10 years through 2007
Capital Adequacy was on average at 8% for the entire sample period with
reported Tier 1 capital adequacy falling within the Basel requirements Efficiency
ratios were low at 53% in 1998 and averaging at 40% through 2007 The 13 year
efficiency ratios are skewed by severely underperformance in 2009 and 2010
Bad debt was at 10% of equity in 1998, and averaged 8% of equity through 2007
The bank incurred massive ban debt in the period 2009 and 2010 of €15,105
million and €19,314 million respectively Anglo incurred the largest impairment of
all covered institutions, and had a total asset write down of €35,143 million
through 2010 Within a three year period the bank impaired over three times the
total asset value of the bank based on valuations at the beginning of 2000
Average leverage ratio through 2007 was 30x Average sustainable growth rates
for the period 2000 through 2007 was 24% The financial data represents a bank
growing at high rates, significantly higher than the sustainable rate for all periods
leading up to 2007 Anglo displayed the highest growth rates for all 6 covered
institutions The bank was also growing at rates significantly higher than the GDP
growth rate for Ireland which averaged at 13% through 2007, compared to asset
growth of 38% and debt growth of 78% In summary the bank was expanding at
rapid rates for an extended period, from 1998 through 2007 The bank was
shifting its funding source away from traditional customer deposits, and obtaining
97
Page 99
higher levels of debt funding, additionally as the balance sheet grew, the levels of
bank deposits grew, although wholesale deposits did not grow at a higher rate
compared to customer deposits This is surprising considering the observations
made reviewing other similar events such as Northern Rock which had
experienced higher levels of growth in the bank deposit category compared to the
customer deposit sector In summary the bank was growing at levels that
exceeded its sustainable growth rate The quality of assets was reported as
healthy both by the bank reports and by the regulator CBOI reports at the end of
each year when assessing the financial health of bank assets It is also noted
that Anglo displayed the highest average leverage through 2007 of 30
Irish Nationwide Building Society
Annual financial reports for INBS are available for the periods 2000 through
2010 At the time of publishing this report, I was unable to obtain the 1999 and
1998 annual report for this bank The bank reported profits for all periods through
2008, with profits of €48 million in 2000 increasing to €309 million in 2007 Profits
peaked at €378 million in 2005 Total assets were at €3,759 million in 2000, and
increased to €16,096 million in 2007, with an average annual increase of 18%
2004 experienced the highest growth rate in the period at 30% Total revenue
grew from €127 million to €483 million in 2007, with an average increase of 22%
through 2007 The highest growth rate was experienced in 2005 at 37% Total
loan balance was €3,421 million in 2000, increasing to €15,458 million in 2007,
an annual average increase of 24% The highest loan growth period was in 2004
at and 45% Total deposit balance was €3,358 million, increasing to €7,667
million in 2008, with an average annual increase of 12% through 2007 The
wholesale deposit ratio was on average 18% through 2009, with a high of 38% in
2001 Debt increased from zero in 2001 to €7,067 million in 2007, an average
increase of 121% Equity grew from €297 million in 2000, and increased to
€1,510, million in 2007 The average annual equity increase was at 26% through
2007 Tangible Net Worth ratio was 7 9% in 2000 and averaged 8 4% through
98
Page 100
2007 Tier 1 Capital ratio was reported at 10 03% through 2009, however it
should be noted that Tier 1 Capital ratios were decreasing for INBS for the
periods, decreasing from 11 6% in 2003 to 7 2% in 2008 Capital was decreasing
at the same time assets and debt was increasing Efficiency rates were high in
2000 at 83% driven by high bad debt expense Average efficiency rates were
40 7% through 2007 Bad debt was reported at 11 % of equity in 2000 or at €31
million, and averaged 3 7% through 2007 Average leverage ratio was 12 through
2007 INBS surprisingly displayed the lowest leverage ratio for all banks in our
study Average sustainable growth rates for the period 2000 through 2007 was
15%
INBS displayed the second highest growth rates for all 6 banks in our study The
bank had an average asset growth rate of 18 37% compared to a sustainable
growth rate of 15% This growth rate is also dramatic considering the society was
limited in its ability to grow the balance sheet to domestic residential mortgage
business INBS clearly grew the balance sheet beyond residential mortgages,
and moved into property development lending both domestically and on the
international market This issue will be expanded on as we move into the IILP
displayed a more dramatic increase in debt, with debt increasing from €251
million in 2002 to €7,067 million in 2007 This represents a dramatic increase in
funding composition for a bank that was operating under the charter of a building
society Debt was also growing substantially in this period, with debt increasing
by 87% and 80% in 2005 and 2006 respectively IILP also incurred some of the
heaviest bad debt impairment among the banks in our study, with total
impairment of €3,791 billion in the three years leading up to 2010, which
represented more than the total asset value of the building society in 2000
EBS
The EBS as previously noted operated as a building Society until it was merged
with AIB in July 2011 The society displayed profits for all periods in our analysis
from 1999 through 2008, at which point it began incurring losses At the end of
99
Page 101
1999 EBS had a total asset balance of €5 613 million, by 2009 this had grown to
€21,505, an increase of 283%, or an average annual increase of 13% The
society reported the third largest asset growth through 2007 for all banks in our
study, with an average increase of 17 36% In 2005 the society experienced its
largest asset growth of 35% Revenue for the company grew from €93 million to
€193 million between 1999 and 2007, an average of 10% annually Total loan
balance in 1999 was €4,993 million, which increased to €18,181 million in 2009,
an average annual increase of 16% during the period Total deposits were
€4,716 million in 1999 and grew to €16,230 million in 2008, and average annual
increase of 13% Wholesale deposit ratio was on average 23% through 2007
The wholesale deposit ratio remained constant through all periods Total debt
grew from €548 million in 1999 to €6,105 million in 2008, an average annual
increase of 37% through 2007 Total equity grew from €243 million in 1999 to
€829 million in 2007, and annual average increase of 16% through 2007
Tangible Net Worth ratio was at 4% in 1999, and averaged at 4% through 2007
Reported Tier 1 Capital ratios were 13% in 1999 and averaged at 11 5% through
2007 Efficiency ratio was Efficiency ratios were at 78% in 1999 and averaged at
71% through 2007 EBS had displayed the highest Efficiency ratios which
represented the poorest efficiency levels of all banks in our study Bad debt was
at €4,300 million in 1999 or 1 77% of equity The bank had an average bad debt
of 81% of equity through 2007, however the bank incurred €981 million in bad
debt in the period 2008 through 2010 The average leverage ratio through 2007
was 25x Average sustainable growth rates for the period 2000 through 2007 was
11% The EBS experienced the third largest asset growth rates from the period
1999 through 2007 at 17 36% This is a considerable growth rate over this period
considering the bank is a building society which was restricted to domestic
residential mortgage lending
100
Page 102
Bank of Ireland
BOI is the oldest bank in our study, established in 1782 The bank enjoyed profits
through 2012 Profits peaked in 2007 at €1,914 million In 1998 BOI had total
assets of €54,314 million This increased to €167,473 million in 2010, and
peaked at €197,432 million in 2008 Annual average growth was 12% for 13
years and 17% for 10 years through 2007 Revenue was €1,918 million in 1998
and grew to €5,864 million in 2010 with a peak of €6,389 million in 2007 Annual
average revenue growth was 14% for 13 years and 17% for 10 years through
2007 Total loan balance was €39,640 million in 1998 and grew to €121,915
million in 2010, with a peak of €145,147 million in 2008, average annual loan
growth was 11 % for 13 years and 17% for 10 years through 2007 Deposits were
at €41,336 million in 1998, and grew to €106,518 million in 2010, with a peak of
€111,518 million in 2009 The 13 year average annual growth rate was 9%
compared to 11% for the 9 year average through 2007 Wholesale deposit ratio
was on average 23% through 2007 BOI displayed a steady growth in wholesale
deposits through 2007 Debt was at €1,930 million in 1998, and grew to €31,468
million in 2010, with a peak of €68,650 million in 2008 Average annual debt
growth was 37% for the 13 year period or 57% for the 9 year period through
2007 This increase in debt represents the single largest balance sheet growth
for all periods Equity in 1998 was at €2,854 and grew to €6,899 in 2010 The
total annual average growth rate was 9%, or 10% through 2007 Tangible net
worth was 5 25% in 1999 and on average was 4% for all periods Tier 1 Capital
was also reported at an average of 4% for all periods Efficiency ratio was 55% in
1999 and averaged at 49% through 2007 Bad debt over equity was at 1 96% in
1999, and averaged at 1 81% over the period Average leverage ratio through
2007 was 26 x Average sustainable growth rates for the period 2000 through
2007 was 18% As a well-established bank, BOI experienced considerable
growth in the sample period, with total assets increasing by 364% between 1999
and 2009 This represents a significant increase in assets for a mature bank The
101
Page 103
bank also experienced the third largest increase in debt in the period at 59% The
total average sustainable growth rate was at 18%
Irish Life & Permanent
IL&P experienced profits through all periods through 2008 It should be noted that
the Total asset balance for IL&P also include the Assurance portfolio for Irish
Life, a non-banking entity were €22,559 million in 1998, and grew to €75,705
million in 2010, with annual average growth rates of 11% for 13 years and 15%
for 9 years through 2007 Revenue for the period ending 1998 was €208 million,
this grew to €259 million in 2010, with a peak of €649 million in 2006 Annual
average revenue growth was 5% for 13 years and 11% for 9 years ending 2007
Loan balance was €6,905 million in 1998 grew to €40,146 million in 2010, with a
peak of €44,850 million in 2008 The average annual growth rate was 17% for 13
years and 23% for the 9 year period ending 2007 Deposits were at €5,246
million in 1998 and grew to €30,527 million in 2010, with a peak of €33,275
million in 2009 The annual average growth of deposits was 17% for 13 years
and 19% for the 9 year period ending 2007 Wholesale deposit ratio was on
average 18% through 2007 Total debt was €2,377 million in 1998 and grew to
€11,720 million in 2010 Debt peaked at 19,823 million in 2006, with the average
annual growth rate at 18% for 13 years and 27% for the 9 year period ending
2007 Debt growth represented the largest growth rate on the balance sheet for
IL&P for all periods Total equity was at €1,550 million in 1998 and grew to
€1,522 million in 2010, with a peak of €2,370 million in 2007 The annual average
equity growth was 1% for 13 years and 6% for 9 years through 2007 Leverage
ratio was 15%, increasing year over year to 36 in 2006 Capital adequacy ratios
for all periods averaged between 4-5% Average leverage ratio through 2007 was
24x Average sustainable growth rates for the period 2000 through 2007 was 3%
102
Page 104
Allied Irish Bank experienced profit for all periods in the sample period Total
asset values for AIB in 1998 were €67,070 million, which grew to €145,222
million in 2010 The assets peaked in value in 2008 at €182,143 million The
annual average growth rate was 8% for 13 years, and 12% through 2007 Total
revenue was €2,822 in 1998 and grew to €4,859 in 2009 with annual average
growth of 7% (NAMA transfers were taken to income in 2010 skewing the
revenue line for 2010) Loan balance was at €43 002 million in 1998 and grew to
€89,293 million in 2010, with a peak of €137,068 million in 2007 Annual average
loan growth was 8% for 13 years, and 14% for the 9 year period ending 2007
Deposits balances were €50,943 in 1998 and grew to €102,258 in 2010, with a
peak of €118,182 in 2008 The annual average growth was 7%, with the 9 year
average at 10% through 2007 Wholesale deposit ratio was on average 25 8%
through 2007 Total debt was at €6,282 in 1998 and grew to €19,995 million in
2010 Debt peaked at €46,471 million in 2007, with an annual average growth
rate of 20% for 13 years, and 31% for 9 years through 2007 Debt growth
represents the single largest growth on the balance sheet for AIB for all periods
with growth exceeding 159% in the period 2003 2004, when total assets were
growing at 26% Equity was €3,183 million in 1998 and grew to €3,466 million in
2010, with a peak of €9 191 million in 2007 Annual average growth was 6% for
13 years and 12% for 9 years through 2007 Capital adequacy averaged between
4-5% for all periods Average leverage ratio through 2007 was 20x Average
sustainable growth rates for the period 2000 through 2007 was 11 %
Allied Irish Bank
Barclays Bank
All balances for Barclays and Santander in this report are expressed in Great
Brittan Pound " Barclays displayed profits for all periods Profits grew from
£2,460 million in 1999 to £7,107 million in 2007 Balance sheet grew from
£254,793 million in 1999 to £2,053,239 million in 2008 The large growth was
103
Page 105
partially due to some acquisitions made in the period including Absa Group South
Africa, Juniper Bank in the US, and the acquisition of HomeEq Servicing USA
from Wachovia Total average balance sheet growth through 2007 was 23%
Revenue increased from £8,363 million to £23,523 million in 2007, with an
average annual increase of 14% Loan book grew from £156,194 to £385,518, or
an annual average growth rate of 12% Deposits grew from £168,452 to
£386,396 with an annual increase of 9% The average wholesale deposit
composition AWDC was 28% Total debt grew from £23,329 million in 1999 to
£138,378 million, with an average annual growth rate of 26% It is clear that debt
provided the bulk of capital for Barclays through the asset acquisition during the
sample period Total equity grew from £8,300 million in 1999 to £21,575 million,
with an average equity increase of 15% Total average capital ratio was 2% for
the period through 2007 Barclays had a bad debt average ratio to equity of 12%
through 2007, with significant bad debt for all periods Average efficiency ratio
was 72% through 2007 Sustainable growth rate for all periods through 2007 was
19%
Over all, Barclays experienced high growth rates in the sample period These
growth rates were driven by an aggressive acquisitions program The bulk of
growth was debt funded The deposit composition was 28% wholesale driven,
which was higher than any Irish bank in the sample period The bank displayed
the higher efficiency ratio compared to the Irish banks which portrays the Irish
banks had a more efficient return Barclays grew at 4% above the sustainable
growth rate, compared to 12% at Anglo and ll&P
Santander UK PLC
Santander UK PLC is the only bank in our sample that did not enjoy profits for all
periods through 2007 The bank experienced net losses in both 2002 and 2003
These losses were a result of the company absorbing the Abbey National Bank in
2004, and the losses incurred by Abbey prior to the purchase Total assets for
104
Page 106
Santander in 1999 were £180 million, with an asset balance of £200 million in
2007 The asset value of Santander decreased in the sample period, during the
years 2002, 2003, 2004, and 2006, again due to a write-down of assets following
the acquisition Revenue decreased from £10,616 million to £8,156 million in
2007 Santander is the only bank in the sample group that experienced a
reduction in revenue in this period As Abbey national bank, before the Santander
acquisition, the bank went through a major reorganisation in 2002 and 2003
before the bank merged with Santander in 2004 This reorganisation resulted in
reduced revenue as unprofitable business were sold This skews the numbers
during the period 2002-4 Loans grew from £86,693 million to £147,391 million in
2007 representing an annual increase of 8% Total loans grew from £89,735
million in 1999 to £117,703 million in 2007 representing an annual average
increase of 4%, however the wholesale deposit rate grew by 26%, demonstrating
the bank was relying more on bank deposits for expansion, than traditional
customer deposits Total debt was at £56,048 million in 1999 and grew to
£64,187 million in 2007, an average annual increase of 9% Equity in 1999 was
at £6,078 and ended 2007 at £3116 million Santander is the only bank in the
sample period consistent equity reduction, and the parent company in Spain has
been forced recently to inject additional capital The bank has an average annual
leverage of 41, and an annual sustainable growth rate of 6% The bank has a
strong credit rating today compared to the six Irish banks, an apparent reflection
of the increasing profit and the injection of £7,500 million of fresh capital
CIBC
CIBC (Canadian Imperial Bank of Canada) is the highest rated bank in the
sample group, and one of the highest rated banks in the world, Bloomberg,
(Doug A and Pasternak S B 2012) According to Bloomberg, the conservative
nature of the Canadian system, and Canada’s Regulator, the ‘Office of the
Superintendent of Financial Institutions Canada’, required all Canadian banks to
hold a minimum of up to 10% of total capital as a cushion to absorb losses, as far
105
Page 107
back as 1999 All balances for CIBC in this report are expressed in Canadian
Dollars '$' CIBC enjoyed profits in all periods leading up to 2007, however the
bank incurred losses in 2008 Total assets in 1999 were $250,331 million,
increasing to $342,177 in 2007 Annual average asset increase was a modest
2% through 2007 Revenue was at $20,133, increasing to $23,287 in 2007 with
an average annual increase of 2% Total loan balance in 1999 was at $118,192
and increased to $164,097, with an annual average increase of 4% Deposits for
CIBC were $160,041 in 1999, increasing to $231,672 in 2007 with an annual
average increase of 4% through 2007 The average wholesale deposit
composition was at 63%, which is the highest in the sample group The high
wholesale deposit composition includes a large portion of Sovereign deposits,
and is a reflection of the flight to quality on the international markets for
corporations and governments seeking safe havens for deposits Total debt in
1999 was $43,043 million, and increased to $55,855 in 2007, with an annual
average increase of 2% Equity for CIBC was $11,058 million, increasing to
$13,489 million in 2007, an annual average increase of 3% Equity for CIBC
decreased by $2 492 million, or 19%, due to a provision related to claims related
to the Enron bankruptcy Total average Tier 1 Capital through 2010 was 10%
This represented the highest Tier 1 Capital ratio for all banks in our report
sample The ratios actually hit a maximum of 13 9% in 2010 Total average
efficiency ratios for CIBC are at 73 8%, the highest ratio of all banks in the
sample period Bad debt in 1999 was at 7% of equity which equalled the total
annual average rate through 2007 Leverage for CIBC through 2007 was 24, on
an annual average basis Sustainable growth ratios for CIBC for the period 1999
through 2007 averaged 4% per year, higher than the actual balance sheet growth
experienced in the same of 2% While some critics, including some of the
interviewees (see interviews in research analysis in section 5) claim that the
Canadian banks were overly conservative and lost out on potential business The
total average annual GDP growth rates for the sample period for Canada was
8%, compared to 13% for Ireland and 5% for the UK
106
Page 108
Summary
The following observations were recorded from our analysis
1) Loan books for all banks grew at unsustainably large rates, with significant
concentration issues in the loan books for all banks
2) Losses incurred in the 3 year period 2007 to 2010, greatly exceeded the
Basel capital ratio requirements Losses for all banks were significantly
higher than available capital
3) Debt grew on average three times the rate of equity growth for all six
covered institutions, and debt represented the largest average growth of
all indicators in our analysis Funding models moved from traditional
deposit funding to debt funding, with secured and subordinated debt
increasing significantly in the period 1999 through 2007 Additionally,
wholesale deposits grew faster than customer deposits This represented
a significant shift in how the banks managed their business model
4) The Building Society’s operated outside their mandated charter, and
operated outside their regulated market limitations As the competitive
landscape changed and other Societies demutualised, both IBNS and
EBS expanded beyond their charter This is evident in the balance sheet
expansion and debt growth
5) Debt to equity ratios increased leading up to 2007
6) Balance Sheet and Income presentations were inconsistent for all banks in
the sample period 1999 through 2010, allowing for changes to Irish GAAP
and IFRS accounting rule changes Banks regularly changes the format of
their presentations, resulting in difficulty when comparing historical
analysis
107
Page 109
Appendix I Key Informants Detail
The interviews were held over a period between April 25th and July 27th
This interview process is recognised as being somewhat problematic due to the
nature of the research, and the popular blame game that has progressed through
the media in recent years We encountered difficulty successfully engaging with
key personnel for a successful outcome, specifically at the regulators office The
participants who we interviewed however provided valuable information, and
were extremely forthcoming and generous with their time While it would be ideal
to engage the field of socio-cultural anthropology in an ethnographic study of the
banking industry by spending long periods of time immersed in the subject
matter This process would consume excess time and resources beyond what is
currently available
A total of eleven interviews were held Three informants did not wish for their
name to be disclosed in this document All participants requested that quotes
would not be directly identified, and a number of participants made comments
which they did not want disclosed The participants included the following
• John McNally was CEO of Ulster Bank, retired in 2004, also held title of
President of the Dublin Chamber of Commerce
• Alan Dukes currently holds the position of Chairman of Anglo Irish bank
(IBRC), and former leader of the Fine Gael Party
• Pat Farrell, President of the Irish Banking Institute
• Clark McGinn, Author of ‘Out Of Pocket' and senior executive of RBS
Ireland
• Patrick Peake, current senior manager for Anglo Irish Bank, 17 years
• Russell Waide, former senior manager at Anglo Irish Bank
• Anonymous, current senior lender at Bank of Ireland, 23 years
108
Page 110
• Mike Shea, current European Chief Counsel, Elavon Financial Services, 5
years
• Anonymous, former director of a large Irish property developer
• Marie Mangan, former senior manager in the Central bank Of Ireland, 17
years
• Anonymous, Chief Financial Officer a large Irish bank
Politics
“The IFSC was created as a jobs initiative by Charles Haughey The
design of the financial services sector has always been supported and
influenced by politicians as a way to create jobs Once it was successful, it
was protected by government ’’
“The Finance Act of 1986 established a 10% corporate tax rate for
financial institutions operating within the IFSC This was the government’s
way of attracting foreign banks to Dublin This officially ended in 2005 ”
“The government was pushing and supporting the growth of banking in
Ireland to become a second smaller version of London An example was
the CEO of Depfa bank pushing for the 2001 Assets Covered Securities
Act in 2001 which copied the German Law on securing loans and
converting into SPV’s and selling bonds ”
“The government in Ireland should be ashamed of the fact that there is not
one single person in prison, or being charged in connection with the
financial crisis Either the laws are inadequate, or the enforcement is
inadequate Either way, this should have been addressed in 2008 The
government does not view this as a priority, because they are part of the
problem ”
109
Page 111
“The rural renewal scheme created by the government was the catalyst for
the current partially developed housing projects around the country The
government fuelled the property boom ”
“Personal insolvency law and bankruptcy law in this country is inadequate
The government should have addressed this issue a long time ago ”
“Ireland is one of the few countries in the world that still has a debtor’s
prison This is archaic ”
”A lively economy is good for the construction industry however in Ireland
the governments view was that a lively construction industry was good for
the economy ”
Politics and government were discussed by all participants in various sections of
the interview In total, 4 cited politics in answering question 10 The answers
range from the political influence over the creation of a banking environment, to
the political influence over protecting particular groups
Regulator Comments
“The Regulator was clearly not equipped to manage the domestic banks
They only had one person dedicated to Bank of Ireland for example How
in the world are they supposed to manage such a large bank with only one
person?”
“The supervisory department was not talking to the economics
department There was no holistic picture of the banking landscape ”
110
Page 112
“The Regulator was focused on getting the returns from the domestic
banks The focus was on liquidity ratios There was no big picture view ”
“There were clearly not enough people at the Regulator to do what was
needed, a complete analysis of the solvency of the banks This was not
done ”
“There was strong reliance on the boards of the banks to ask questions of
management and ensure things were running properly This was clearly
not happening ”
“INBS were operating outside of their charter, the Regulator knew this but
did not act ”
“The regulation from the Regulator continues to be poor, for example, the
code of conduct restricts banks from contacting customers more than 3
times This restricts banks from going after non-paying customers ”
Commentary from 7 of 11 participants discussed the regulator in answering
question 10 There was discussion around the lack of resources at the Regulator
and a lack of focus and power to manage the industry There is also a degree of
arrogance on the bank level to the extent the domestic banks knew the regulator
was powerless in enforcement
111
Page 113
Appendix J Interview Questions
Section A
1 What is your position in your Organisation?2 How long have you been employed in your Organisation?3 How long have you been employed in your industry?4 Why did you join the industry?5 Have you enjoyed your career in the industry?6 Have you thought of leaving the industry?7 Have you thought of leaving your present employer?
Section B
8 Do you think the recent crisis was foreseen?9 Do you think the recent crisis was preventable?10 List three areas that you believe were the primary cause of the crisis?11 List three areas that you believe need to change12 What do you believe are the biggest risks?
Section C
13 Do you believe the financial industry in broken in Ireland?14 Do you believe the Irish banks can survive?15 Do you believe the Irish banks require additional operational change?16 Do you believe the banks need to change control mechanisms?17 Do you believe the banks need to change reporting?18 Do you believe the banks need to change Senior management?19 Do you believe the banks need to change Middle management?20 Do you believe the regulator needs to change?21 Do you believe the Government Bodies need to change?22 Do you believe the customer behavior needs to change?
112
Page 114
Appendix K Chronology of Events
2007
January
• World Economic Forum, Oliver Wyman claims Anglo Irish Bank as the
best managed bank in the world
• Anglo Irish Bank disclose Sean Quinn purchased 5% equity stake of the
Bank
March
• The Index of House Prices shows a decline for the first time
April
• New Country Financial USA files Bankruptcy
June
• Bear Stearns announces problems with hedge funds in subprime market
at a value of $3 2 billion
• SEC begins investigating 12 CDO issuers
August
• BNP announces freezing of three funds due to subprime valuations of $2 2
billion following a decrease in value of 20% in 2 weeks
• IKB Bank Germany fails
• Sachsen LB received, German 17 billion bailout, following the collapse of
its investment vehicle Ormond Quay Funding Pic, a property company
based in Dublin, guaranteed by Sachsen LB, which bought subprime
assets from Lehman Brothers
• ECB announces Euro 40 billion LTRO
• Warren Spector resigns at Bear Stearns amid growing concern over
hedge fund exposure to sub prime
• Bear Stearns cuts 420 jobs in mortgage origination unit
September
• Victoria Mortgage UK fails
113
Page 115
• Lines form outside Northern Rock on the 14th, as customers demand
deposits, first run on a Bank in the UK in over 100 years
• Bank Of England provides emergency funding to Northern Rock
October
• Citigroup begins write down of subprime investments
November
• US Term Auction Facility announced with $20 billion of 28 day credit
December
• Bear Stearns announces first loss in its history with a $2 billion write down
on subprime assets
2008
January
• Bear Stearns CEO steps down
• Two US bond insurers, Ambac and MBIA at risk of downgrade
February
• TAF program increased to $30 billion
• Bear Stearns and Citi agree a swap deal on subprime assets
• Northern Rock Nationalised by UK government
March
• Bear Stearns reports $15 billion drop in liquid assets
• Carlyle Capital Corporation a $22bn hedge fund exposed to mortgage-
backed securities, suspended in Amsterdam, Bear Stearns is heavily
exposed
• Carlyle Capital Collapse, Bear stock falls dramatically
• JPMorgan buys Bear Stearns for $2 per share
• US introduces Primary Dealer Credit Facility
• Fannie Mae & Freddie Mac capital requirements eased to allow increased
lending
114
Page 116
• Anglo Share Price falls 18% over one week due to concerns over property
exposure
• ECB announces 6 month LTRO of 25 billion
April
• Bank Of England announces 50 billion liquidity fund
May
• Bank Of America purchases’ Countrywide Financial mortgage company
June
• S&P downgrades the two largest monoline bond insurers with €1trn of
debt from AAA to AA
• US Lehman reports second quarter loss of $2 8bn
July
• FDIC takes over IndyMac which then experiences a run on deposits
• Treasury requests Government funds to potentially support Fannie Mae &
Freddie Mac
• 84-day TAF auctions introduced and ECB swap line increased
September
• Fannie Mae & Freddie Mac placed in Federal conservatorship
• Lehman reports third qtr loss of $3 9bn
• Eligible collateral for TSLF & PDCF expanded 10 banks create $70bn
liquidity fund
• Lehman’s files bankruptcy
• AIG Debt downgraded by S&P, Moody’s & Fitch
• Bank of America purchases Merrill Lynch
• AIG given $85bn loan from Government US
• ECB announces 6 month LTRO's of €25bn each for 2 Apr & 9 Jul
• Lloyds TSB agrees to rescue HBOS
• Treasury calls for government plan to purchase troubled assets (TARP)
• France & US restrict short selling
• Goldman Sachs & Morgan Stanley approved as bank holding companies115
Page 117
• Washington Mututal is acquired by OTS & FDIC, closed and its banking
assets sold to JP Morgan for €1 19bn
• Ireland officially in recession
• Hypo Real Estate receives €35bn guaranteed financing
• Bradford & Bmgley nationalised and partial sale of assets to Banco
Santander
• Wachovia assisted
• US Treasury $700bn bailout plan (TARP) rejected - Dow Jones falls 7%
• Listed covered institutions shares decline 27% ISEQ declines by 13%
• Irish State Guarantees €375bn of the liabilities of 7 domestic banks for a
two year period
• Govt recapitalises Dexia with €3bn
• Italy adopts temporary short selling ban
• UK Deposit Insurance upped to £50k
• US TARP$700bn bailout plan passed raising deposit protection to $250k
• Netherlands Government nationalises banking and insurance activities of
Fortis
• Germany Government guarantees all private bank accounts
• Germany Hypo Real Estate Guarantee set at €50bn
• UK £500bn bank rescue package announced - lending £200bn , short
term guarantees £250bn, capital £50bn
• France Govt guarantees 36 5% of €150bn Dexia re-financing
• Italy Govt states no banks will fail, no depositors to suffer losses
• UK £37bn capital injected into Lloyds/HBOS, RBS
• France €320bn loan fund & €40bn recapitalisation fund announced
• Germany €400bn loan fund & €70bn recapitalisation fund announced
• Italy Unspecified bank financing guarantee passed
• France Govt subscibes to €10 5bn sub debt of 6 banks
• Germany Rescue fund SoFFin begins operation - powers to guarantee
financing, buy assets and recapitalise firms116
Page 118
• Germany SoFFin provides Hypo Real Estate with €35bn in guarantees
• US TARP$700bn bailout plan passed raising deposit protection to $250k
• US TAF increased to provide $900bn of funding over year end
• France BNP Paribas takes 75% stake in Fortis
• US Commercial Paper Funding Facility (CPFF) established
• Iceland Landesbanki nationalised
October
• UK £500bn bank rescue package announced - lending £200bn , short
term guarantees £250bn, capital £50bn
• Govt states no banks will fail, no depositors to suffer losses
• Govt guarantees 36 5% of €150bn Dexia re-financing
• Wells Fargo purchase of Wachovia approved
• France €320bn loan fund & €40bn recapitalisation fund announced
• Germany €400bn loan fund & €70bn recapitalisation fund announced
• Unspecified bank financing guarantee passed
• £37bn capital injected into Lloyds/HBOS, RBS
• Emergency Budget Introduced
• Caps removed on swap lines with ECB, BoE & SNB
• Treasury $250bn capital injection plan, 9 banks sign-up, FDIC insures
senior debt of regulated institutions
• ECB widens collateral rules and slashes required ratings
• France Gov subscribes to €10 5bn sub debt of 6 banks
• Money Market Investor Funding Facility (MMIFF) is established
• UK £23bn stimulus package announced
• Germany Rescue fund SoFFin begins operation - powers to guarantee
financing, buy assets and recapitalise firms
• UK Government acquires 58% stake in RBS for £15bn
November
• Germany SoFFin provides Hypo Real Estate with €35bn in guarantees
• Germany SoFFin provides Commerzbank with €8 2bn of loan117
Page 119
• China Government announces $586bn fiscal stimulus package
• Iceland The IMF approves a loan to Iceland for $2 1bn following the
collapse of its banking system
• US Citigroup receives $20bn in government assistance from Fed, FDIC &
Treasury
• Troubled Asset Lending Facility (TALF) established for $600bn to provide
loans collateralised by ABS $200bn
• US Treasury allocates $200bn to target unfreezing of consumer credit
• Germany BayernLB receives €7bn in capital from Bavaria
December
• Germany SoFFin provides BayernLB with €15bn in guarantees
• Irish Government announces €10bn allocated to recapitalisation of
domestic banks
• UK Credit Guarantee Scheme lengthened to 5 years
• Anglo's Chairman and CEO resign following disclosures over directors
loans
• International Eleven of the world's largest banks are downgraded by S&P
• Government announces €5 5bn to be invested in preference shares in
AIB, Anglo & Bol
• Germany SoFFin provides I KB with €5bn in guarantees
• UK Bank of England estimates world credit loss at £1 8trn
• Treasury injects $5bn into GMAC
2009
January
• Germany SoFFin provides a further €8 2bn of loans to Commerzbank and
buys €1 8bn of equity
• Minister for Finance announces the re-appointment of the Governor of the
Central Bank
118
Page 120
• The Chief Executive of the Financial Regulator announces intention to
retire on 31-Jan-10
• Germany €50bn economic stimulus package unveiled
• Gov t announces intention to nationalise Anglo due to weak funding
position & "unacceptable practices"
• US Fed, FDIC & Treasury aid Bank of America
• UK Asset Protection Scheme (APS) announced where Treasury will cover
90% of losses over initial provision
• UK Credit guarantee Scheme extended to debt issued up to year end
2008
• UK BoE to purchase £50bn of private sector assets
• UK Full or partial guarantee available to CGS eligible firms on AAA-rated
ABS
• Bol announces retirement of CEO with effect from summer of 2010
• Germany SoFFin provides Hypo Real Estate additional €12bn in
guarantees
• France Second round of recapitalisation for another €10 5bn
• US Citigroup sells $12bn in bonds guaranteed by US Government
• US Fannie Mae & Freddie Mac state $51 bn required from government to
continue operations
• Sean Quinn reveals losses of €1bn arising from speculative trading on
Anglo Irish stocks
February
• IL&P CEO & 2 directors resign over €7bn placed with Anglo in Sep-08 to
boost Anglo's Balance Sheet
• Fed expresses willingness to expand TALF to $1tn and accept wider set of
collateral
• Recapitalisation plans amended to invest €7bn in AIB & Bol from the
National Pensions Reserve Fund
• Chairman of INBS resigns119
Page 121
• Germany €50bn economic stimulus package unveiled
• US President signs $787bn economic stimulus plan into law
• Germany Two German states recapitalise HSH Nordbank
• Italy €12bn recapitalisation plan approved
• France Government provides €5bn in preference shares to two merging
banks
• UK RBS agrees to participate in APS and receives captial injection of
£13bn giving govt 84% ownership
March
• UK LBG agrees to participate in APS and government preference shares
are converted to common equity
• Germany SoFFin provides HSH Nordbank with €30bn in guarantees
• US AIG receives $30bn in capital in exchange for government control of
two divisions
• US AIG announces fourth quarter loss of $61 7bn - Fed & Treasury
announce AIG restructure
• US TALF launched
• Germany SoFFin purchases 8 7% of Hypo Real Estate for €60m
• Standard & Poor's cut Ireland’s long term rating by one notch to AA+ on
back of deteriorating public finances
April
• International Mark-to-market accounting rules relaxed by Financial
Accounting Standards Board (FASB)
• INBS announces the resignation of the its CEO at the end of the month
• National Asset Management Agency (NAMA) announced €90bn of toxic
assets to be swapped for bonds
• Germany SoFFin makes bid for Hypo Real Estate - will nationalise bank
in May if bid is not accepted
• Germany Finance Minister proposes "bad bank" plan to take illiquid
assets
120
Page 122
• Germany SoFFin extends €52bn in guarantees to Hypo Real Estate until
mid-August
• AIB announces the resignations of the its Chairman, CEO & Finance
Director
May
• ECB announces €60bn in purchases of covered bonds UK Asset
Purchase Plan increased to £125bn
• Bol announces resignation of Chairman with effect from Jul-10
June
• Germany Hypo Real Estate taken under full government control with €3bn
capital injection
• Standard & Poor's cut Ireland's long term rating by one notch to AA due to
costly bank rescue package
• Governor of Central Bank announces retirement with effect from Sep-10
• US President proposes a comprehensive regulatory reform plan
• 10 banks including US Bank repay $68 billion TARP
July
• Germany IKB receives a further €3bn in guarantees
• Irish Government injects €4bn of funds in Anglo
• Germany Bad Bank bill passed - trades toxic assets for guaranteed debt
but firms must repay losses over 20 years
• TAF offer amount reduced to $1 OObn
• NAMA draft proposal released
• Italy Banco Popolare becomes first bank to use the Italian bank liability
guarantee programme
August
• UK Asset Purchase Plan increased to £175bn
• TAF offer amount reduced to $75bn for September auctions
• International Mark-to-market accounting rules relaxed by Financial
Accounting Standards Board (FASB)121
Page 123
September
• Germany Commerzbank announces it will return all of its unused debt
guarantees
• NAMA Bill Published forecasting €77bn in loans to be acquired from 5
domestic banks
• US SEC approves new rules to govern rating agencies
• US TSLF & TAF offer amount reductions announced
• Italy Unicredit to raise capital rather than avail of Gov t funds France BNP
announces rights offer to repay state aid
October
• France Societe Generate announces rights offer to repay government aid
November
• UK LBG exits Asset Protection Scheme for a fee
• UK Asset Purchase Plan increased to £200bn
December
• Cost cutting budget announced targeting savings of over €4bn per annum
• US Treasury extends TARP to 0ct-10 - Bank of America repays TARP
funds
• Germany Hypo Real Estate €43bn liquidity facility extended until Dec-10,
€52bn in guarantees to expire Jun-10
• US Citibank & Wells Fargo repay TARP funds
2010
February
• US The AMLF, CPFF, PDCF & TSLF are closed
• US PNC Bank repays TARP funds
March
• US Senator Dodd introduces the financial regulation bill to senate
• US Senate Banking Committee passes the financial regulation bill
122
Page 124
• Central Bank Reform Bill 2010 presented to unify CB & FR and confer
additional powers to the CB
• NAMA Tranche 1 announced - €16bn at average discount of 47% to be
transferred in Apr-10
• After CB review (PCAR), revised recapitalisation plan announced and
intention to take control of INBS & EBS
• Capital requirements for AIB (€7 4bn) & Bol (€2 7bn) to be raised through
share issue & asset sales
• Promissory notes to be issued to Anglo (€8 3bn) & INBS (€2 6bn) &
investment shares in EBS & INBS
• Anglo announces largest corporate loss in Irish history of €12 7bn
April
• EU European finance ministers finalise European Stability Facility to
assist countries in financial distress
• Bol announces plans to raise €3 4bn in capital through rights issue and
placing’s with government backing
May
• Greece receives a bailout package of €110bn from the EU & IMF
• Government issues further promissory notes to Anglo for €2bn
• US Senate passes Restoring American Financial Stability Act
• Government takes control of EBS with purchase of €100m in special
investment shares
• Further promissory notes issued to Anglo for €6 4bn and buys special
investment shares in EBS for €250m
June
• Bol completes capital raising programme, raising over €3 5bn
• US Dodd-Frank Wall Street Reform and Consumer Protection Act passed
July
• Central Bank Reform Act 2010 signed into law - to take effect 0ct-10
August
123
Page 125
• NAMA Tranche 2 €12bn of loans acquired at average discount of 56%
• Standard & Poor's cut Ireland's long term rating by one notch to AA- with a
negative outlook
• Anglo's interim accounts show losses for the six months of 2010 of €8 2bn
September
• AIB agrees sale of Polish units to Santander improving it's capital position
by €2 5bn
• Government announces costs of Anglo at least €29bn possibly rising to
€34bn
• CB confirms further capital requirement for AIB of €3bn following update of
PCAR in light
• AIB announces termination of CEO's contract and resignation of Chairman
October
• German Chancellor suggests holders of sovereign debt should take losses
as part of any debt restructuring
November
• Spreads on 10 year Government bonds over German equivalents reach a
new high of 6 65%
• Minister for Finance to recommend to Government that the country
formally request a bailout package
• Standard & Poor's cut Ireland's long term rating by two notches to A on
back of escalating bank bailout costs
• IMF/EU bailout deal announced giving Ireland access to €85bn in funding
December
• Budget presented targeting initial €6bn in annual savings rising to €15bn
over 4 year plan
• NAMA Tranche 3 €43bn of loans acquired at discount of 61%, Cumulative
bank losses amount to €41 bn
• Gov t to inject €3 7bn into AIB bringing its ownership to 93%
124
Page 126
Further promissory notes issued to Anglo €6 4bn and INBS €2 7bn - Total
gov t capital in banks now €46bn
(Nyberg 2011,150)
125
Page 127
ANGLO IRISH BANK______________________ 1998_________1999_________2000_________2001_________ 2002_________2003_________ 2004_________ 2005_________ 2006_________ 2007_________ 2008_________2009_________2010 Averse 12 Averse 2007Profit
Margin58.5591447%
89 100 1650%
133 600 16.50%
194 800 18.23%
261.300 23 20%
346.500 28 16%
504.1003021%
685 200 29 08%
846 000 25 22%
1.219 000 2184%
765.000 11 68%
12.711.000 - -297 89%
17.515.000 -802 34% -73% 23.21%
Assets Asset Growth
5,561.413 7.935.40043%
11.047,30039%
15.757,70043%
19.417.80023%
25.526.30031%
34 339.800 35%
48.263.60041%
73.290 000 52%
96.652.00032%
101.321,0005%
85.212.000-16%
72.183.000-15% 26% 37.56%
Revenue Revenue Increase
404 679 540.10033%
809 600 50%
1 068.700 32%
1.126 300 5%
1.230.5009%
1 668.900 36%
2.356.10041%
3.354 000 42%
5.582 000 66%
6.547.00017%
4.267.000-35%
2 183.00049% 21% 35 07%
Loans Loan Growth
4816.861 7.082.20047%
10 006 700 41%
14.338 700 43%
17.244,30020%
23 067.300 34%
29 934.400 30%
40 352 600 35%
61.566 000 53%
78.000 000 27%
86 153.000 10%
38.212.000-56%
27 889 00027% 21% 3661%
Deposits Deposit Growth
4,781.055 6.928.40045%
8 923 900 29%
12.626,10041%
14 933.500 18%
17.867.70020%
22.151.90024%
31.310.40041%
47.133.00051%
60.287.00028%
71.952.00019%
60 185.000-16%
57 658.000-4% 25% 32 99%
Deposit Ratio 32% 36% 27% 30% 21% 18% 12% 23% 22% 13% 28% 55% 81% 30% 22 37%
Debt Debt Growth
361 738 298 300-18%
1 257 100 321%
1 694,000 35%
2.386.50041%
4.986 900 109%
8077,80062%
10.586.80031%
19.265.00082%
28.862 000 50%
22.228 000-23%
17.531 000 -21%
7.421000-58% 51% 79 26%
Equity Equity Growth
181.059 258.10043%
324 200 26%
409.50026%
648 100 58%
843 600 30%
1.170.20039%
2 046 600 75%
2.594.00027%
3989 000 54%
4.104.0003%
4.148.0001%
3.518.000-15% 30% 41.89%
Capital Ratio TNW/Total Assets 3 26% 3 25% 2 93% 260% 3 34% 3 30% 341% 4 24% 3 54% 4 13% 4 05% 4 87% 4 87% 4% 342%
CAR (Tier I) 8 00% 8 00% 8 00% 8 00% 8 20% 8 50% 8 40% 8 40% 8 40% 8 60% 8 40% 6 30% 10 90% 8% 828 %
Efficiency 16 13% 19 50% 1727% 17 57% 18 66% 18 26% 13 13% 29 00% 27 00% 971% 18 44% 362 90% 900 92% 121% 18 90%
Bad Debt Bad Debt/Equity
18.030 9 96%
36.700 14 22%
51.000 15 73%
69.70017.02%
65.600 10 12%
57.500 6 82%
19.1001.63%
29.4001.44%
66 000 2 54%
82.000 2 06%
724.00017.64%
15.105.000 364 15%
19.314.000549.01% 84% 7.85%
Leverage 31 31 34 38 30 30 29 24 28 24 25 21 21 28 29 88
Leverage ratio 3% 3% 3% 3% 3% 3% 3% 4% 4% 4% 4% 5% 6% «% 3%
Debt/Equity 200 1.16 388 4 14 368 591 690 517 7.43 724 542 423 211 4.77 5.06
Ireland GDP Ireland GDP Growth
67 782.000 72.632.0007%
73.535.0001%
80.529.00010%
94.246.00017%
121.065.00028%
142.408.00018%
155.058 000 9%
170.570.00010%
199 774.000 17%
204.868.0003%
174.764.000-15%
133 846.000-23% -100% 13 00%
Sustainable Growth 1521% 17 84% 25 62% 22.40% 26 09% 26 81% 3120% 23 79% 28 69% 27 22% 14 13% -304 89% 495.61% - 42% 25.52%
MCD
Appendix L
Financial Analysis
Page 128
Irish Nationwide B. Society______ 1999 2000 2001_______ 2002 2003______ 2004_______ 2005_______ 2006_______ 2007_______ 2008_______ 2009_______ 2010 Average 12 Average 2007Profit
Margin48,729
20%63,421
23%70.600
24%95,800
33%107.300
28%378.700
73%186,500
27%309,100
28%- 242,900 ■
-24%2,487,500 -
451%3,291.400
-1551% -179.02% 33.59%
Assets Asset Growth
3.759,975 4.374.045 14 04%
5,547.700 21 16%
5.953.200681%
8,551.900 30 39%
10.998.600 22 25%
14,629,000 24 82%
16,096.0009.11%
14,429.300-11.55%
13,315.500-8.36%
12,131,800-9.76% 9.89% 18.37%
Revenue Revenue Increase
245.366 281.78814.84%
298.000575%
290.300 -2 58%
381.90031.55%
521.2003648%
695.7003348%
1.088.7005649%
1,032.700-5.14%
551,8004657%
212,200 -61 54% 6.28% 25.14%
Loans Loan Growth
3,421.982 4.060.441 18 66%
5.268.700 29 76%
5.640.700 7 06%
8.200,300 45 38%
10,530,3002841%
13,965.100 32 62%
15,458.100 10 69%
13.517.100-12.56%
3.589,600-73 44%
3,130,700-1278% 7 38% 2465%
Deposits Deposit Growth
Deposit Ratio (W)
3,358,251
36 77%
3,927.081 16 94% 38 44%
4.780.600 21 73% 28 57%
5.030.600 5.23%
31 12%
5.843.100 16 15% 18.27%
6.340.200851%9.57%
6,691.100 5 53%1 32%
7.424.600 10 96%2.35%
7,667,700327%11.51%
6.327.600 -17.48% 15 60%
65,500-98 96% 86 87%
-2.81%24.36%
12.15%18.52%
Debt Debt Growth
-0.00%
251.000 0 00%
250.700-0.12%
1.936.100 672 28%
3.626.00087.28%
6.549,90080.64%
7,067,0007.89%
5.497.300-22.21%
5,578.4001.48%
791.800-85.81% 74.14% 121.14%
Equity Equity Growth
297.422 360,734 21 29%
438.200 21 47%
532.100 21 43%
639.80020.24%
983.70053.75%
1,237,700 25 82%
1,510.300 22 02%
1.189.100-21.27%
1,350,300 - 13.56%
18.300-101.36% 7.70% 26.58%
Capital Ratio TNW/Total Assets 791% 8 25% 7 90% 8 94% 7 48% 8 94% 8 46% 938% 8 24% 10 14% -0.15% 7 76% 8 48%
CAR (Tier I) 13% 9.70% 11% 9.00% 8 00% 740% 7.50% 9.00% 7.90% 6 70% 23% 9.92% 8.80%
Efficiency 86% 50% 52% 45% 29% 15% 25% 24% -193% -115% -101% -16.88% 40.67%
Bad Debt Bad DebtfEquity
31,74311%
14.5004%
17.0004%
14,8003%
6.5001%
27.2003%
17,6001%
48.8003%
495,20042%
2,792,400207%
503,800-2753% -248.54% 3.72%
Leverage 13 12 13 11 13 11 12 11 12 10 - 663 56 11.86
Debt/Equity - - 1 0 3 4 5 5 5 4 - 3 2.53
Ireland GDP 67,782,000 Ireland GDP Growth
72,632,0007%
73,535,0001%
80,529,00010%
94.246,00017%
121,065,00028%
142.408.00018%
155,058,0009%
170,570,00010%
199,774,00017%
204,868,0003%
174,764,000-15%
133,846,000-23% -100%
Sustainable Growth 12 62% 13 54% 12.41% 13 86% 12.91% 29 64% 11 60% 1576% -2043% -0.18% 17 99% 1071% 15.29%
K >
Page 129
EBS_____________________________1999________ 2000________ 2001________ 2002________ 2003_________2004_________2005________ 2006_________2007_________ 2008_________2009_________ 2010 Average 12 Average 2007
ProfitMargin
22,90010%
20.7007%
30.1008%
35,70010%
59.40016%
48.30012%
38,7008%
57.7008%
55.9006%
37.800 - 4 %
78,800 - -9%
589.600-76% -1.28% 9.33%
Assets Asset Growth
5,613 000 5.846.500 4 16%
6 490 800 1102%
8.381.3002913%
9.717.400 15 94%
12,301.1002659%
16.556.300 34 59%
19.306.0001661%
19.475.800 0 88%
21,374.200 9 75%
21.505.600061%
20.086.900 -6 60% 12.97% 17.36%
Revenue Revenue Increase
235.100 291.900 24 16%
378.100 29 53%
370.000-214%
372.800 0 76%
403,900 8 34%
483,800 19 78%
692.300 43 10%
973.700 40 65%
1,065.8009 46%
853,500 -19 92%
776,500 -9 02% 13.15% 20.52%
Loans Loan Growth
4.993.400 5.463,700942%
6.070.100 11 10%
7,989.500 31 62%
9.180.000 14 90%
11.191.60021.91%
13,638.200 21 86%
15.907,100 16 64%
16.531.6003.93%
18.560.7001227%
18,181.800-2.04%
16.691.600 -8 20% 12.13% 16.42%
Deposits Deposit Growth
4,716.700 4.879.000344%
5.338.100941%
7.125.400 33 48%
8.056,900 13 07%
9.868.400 22 48%
12.119,5002281%
12.815,1005.74%
12.200.800 ■4 79%
16.230.000 33 02%
14.264.100-12.11%
15.177,000640% 1209% 13.21%
Deposit Ratio (W) 2551% 19 04% 1530% 24 77% 27 18% 26 39% 27 79% 2141% 21 78% 37 61% 31 08% 577% 23.47% 22.96%
Debt Debt Growth
548 300 599.700937%
746.000 24 40%
799.400 7 16%
1.104.900 38 22%
1,811.700 63 97%
3.536.900 95 23%
5.450.600 54 11%
5.937,000 8 92%
3.895.200 -34 39%
6.105.000 56 73%
3.786.200-37 98% 25.98% 37.67%
Equity Equity Growth
243.100 263.800852%
293,90011.41%
328,300 11 70%
417.300 27 11%
459.80010.18%
605.4003167%
659,700897%
829.50025.74%
668.200-1945%
640,5004.15%
692.300 8 09% 10.89% 16.91%
Capital RatioTNW/Total Assets 433% 451% 4 53% 3.92% 4 29% 3.74% 3 55% 3.33% 4.15% 3.00% 286% 3 34% 3.75% 4.00%
CAR (Tier I) 13.00% 13% 9 70% 11% 9 00% 8 00% 7.40% 750% 9 00% 790% 6.70% 8% 8 84% 9.33%
Efficiency 78% 77% 78% 81% 67% 65% 67% 67% 70% 126% 158% 513% 124 46% 71.52%
Bad Debt 4 300 2.400 2.900 4,000 1.100 200 400 4,600 19,100 110.000 194,900 677.000 9241818.18%
Bad Debt/Equity 1 77% 0.91% 099% 1 22% 0.26% 0 04% 0.07% 0.70% 2 30% 16.46% 30.43% 97.79% 13.74% 0.81%
Leverage 23 22 22 26 23 27 27 29 23 32 34 29r #0(V/0’
27 24.99
Debt/Equity 226 227 254 2 43 2 65 394 5 84 8 26 7 1 6 583 9.53 5 47 5 4.39
Ireland GDP 67.782.000 72,632.000 73,535,000 80.529.000 94.246.000 121,065.000 142,408.000 155,058.000 170.570.000 199.774,000 204.868.000 174.764.000 133.846,000
Ireland GDP Growth 7% 1% 10% 17% 28% 18% 9% 10% 17% 3% -15% -23% -100%
Sustainable Growth 1201% 1026% 1241% 12 90% 15 95% 11 79% 8 89% 999% 8 03% -5 72% -15 50% -89 64% -1.88% 11.36%
hJ00
Page 130
Allied Irish Bank 1999________ 2000________ 2001_________2002_________2003_________2004Profit
Margin1.112 000 1.130.000
17%509.000
7%1.361.000
21%1.039.000
21%1.243.000
23%
Assets Asset Growth
67,070.000 79.688.000 18 81%
88.837,0001148%
86.049.000 -3 14%
80.960.000-591%
102,240.000 26 28%
Revenue Revenue Increase
4987.000 6.539.000 31 12%
6.967.000 6 55%
6.470.000 -7 13%
4,977.000 -23 08%
5.365.000780%
Loans Loan Growth
43.002.000 50.073.0001644%
57.263.000 14 36%
58,235.0001.70%
53.123,000 -8 78%
67.156.000 26 42%
Deposits Deposit Growth Deposit Ratio
50.943.000
1690%
60,915.0001957%20 48%
67,780,0001127%1951%
69.113,0001.97%
23.35%
62.706.000-927%28 86%
71.825.00014.54%28.44%
Debt Debt Growth
6.282.000 6.544.000 4 17%
7,053.000 7 78%
5.249.000 -25 58%
5.619.000 7 05%
14.570.000 159 30%
Equity Equity Growth
3.183.000 3.830.000 20 33%
5.131.0003397%
4.186.000-1842%
4,718.0001271%
5.201.0001024%
Capital Ratio TNW/Total Assets 4.75% 4 81% 578% 4 86% 583% 509%
CAR (Tier 1) 640% 630% 650% 6 90% 7 10% 8 20%
Efficiency 63 89% 68 19% 87 29% 68 88% 7122% 65 93%
Bad Debt Bad Debt/Equity
85.000267%
133,000347%
179.000349%
194.000463%
152.000322%
116 000 223%
Leverage 21 21 17 21 17 20
Debt/Equity 1 97 1.71 1 37 125 1 19 2 80
Ireland GDP Ireland GDP Growth
67 782 000 72 632.000 7%
73,535.0001%
80,529,00010%
94.246,00017%
121.065 000 28%
Sustainable Growth 16 19% 11 45% 0 67% 12 00% 5 08% 9 82%
N>CD
Page 131
2005 2006 2007 2008 2009 2010 Average 12 Average 2007
1.493.00023%
1.908.00023%
2.248 000 20%
862.0007%
2.418.000 - -31%
12.124.000-238% -9.58% 18.17%
133.214,000 30 30%
158.526.0001900%
177.862.000 12 20%
182,143,000241%
174.314,000 -4 30%
145,222,000-1669% 8.22% 12.38%
6.413.000 19 53%
8.416,000 31 23%
10.987 000 30 55%
11.571,000532%
7,834.000 -32 30%
5.093.000 -34 99% 3.15% 11.32%
92.361.000 37 53%
120.015.000 29 94%
137.068.000 14 21%
135.755,000 -0 96%
112,434.000-17.18%
89,293.000-20.58% 8.46% 14.54%
91,909.000 27 96%31 91%
108.308.000 17 84%30 87%
111.697.000 3 13% 27.21%
118.182.000581%21 64%
117,286,000-0.76%28 42%
102.258.000 -12.81% 48 77%
7.20%28.13%
10.31%25.81%
21.367.000 46 65%
33275.000 55 73%
46.471.000 39 66%
42.340.000 -8 89%
35,240,000 -16 77%
19.995.000-43.26% 20.53% 31.76%
6.652.000 27 90%
8.055.000 21 09%
9.191.00014.10%
8.164,000 -11 17%
9.927.000 21 59%
3.466.000-65.09% 6.11% 12.30%
4 99% 508% 5.17% 4 48% 569% 239% 4.92% 5.12%
8 20% 8.20% 750% 840% 7 20% 4 30% 7.16% 7 48%
63.04% 59.62% 57 87% 85.79% 154 60% -263 78% 47.15% 69.76%
115.000 1 73%
118.000146%
106.000 1 15%
1.822,000 22 32%
5.355,000 53 94%
6.015.000 173 54% 24.65% 4.86%
20 20 19 22 18 42 21 19.65
321 4 13 506 5 19 355 577 3 288
142 408.000 18%
155.058.0009%
170,570.00010%
199.774.00017%
204.868.0003%
174,764.000-15%
133,846,000-23% -100%
10 68% 19 73% 15 92% 0 66% -22 58% -331 35% -20 98% 11 28%
Page 132
Bank of Ireland____________________1999________2000________ 2001________ 2002________ 2003________ 2004________ 2005________ 2006________ 2007________ 2008________ 2009________ 2010 Average 12 Averse 2007Profit 802 000 919 000 1 081 000 1 121 000 1 155 000 1 238 000 1 270 000 1 554 000 1 914 000 1 848 000 35 000 - 999,000
M arg in 20% 13% 970% 11% 9 00% 8 00% 740% 7 50% 9 00% 7 90% 6 70% 8% 8.84% 933%
Assets Asset Growth
54.314.000 68.017.00025%
78.875.00016%
87.325.00011%
89.505.0002%
106.431.00019%
Revenue Revenue Increase
3.977 000 4,014.0001%
5.317.00032%
5 363.000 1%
5.019.000-6%
5.065.0001%
Loans Loan Growth
39.640.000 51.816.00031%
59.262.00014%
64 962 000 10%
64.367.000-1%
75.293,00017%
Deposits Deposit Growth Deposit Ratio
41.336.000
17%
51.296.00024%20%
57.294.00012%20%
63.694.00011%20%
61,113,0004%21%
71.455.00017%24%
Debt Debt Growth
1.930.000 4.691.000143%
6.933.00048%
8 898 000 28%
12.355,00039%
16.599.00034%
Equity Equity Growth
2.854.000 3.270.00015%
3.571.0009%
3.929.00010%
3.929.0000%
4.317.00010%
Capital Ratio TNWiTotal Assets 525% 4 81% 4 53% 450% 4 39% 4 06%
CAR (Tier 1) 900% 740% 780% 7 60% 8 00% 720%
Efficiency 60 8% 62 3% 60 0% 62 9% 65 2% 65 1%
Bad Debt Bad Debt/Equity
56.000 1 96%
56.000 1 71%
72.000 2 02%
102.000 2 60%
100 000255%
86 000 1 99%
Leverage 19 21 22 22 23 25
Debt/Equity 068 1.43 1.94 226 3.14 385
Ireland GDP Ireland GDP Growth
67 782.000 72.632.0007%
73.535.0001%
80.529.00010%
94.246.00017%
121.065.00028%
Sustainable Growth 19 79% 15 76% 13 95% 15 59% 14 63% 1451%
117,935,00011%
162.354,00038%
188813.00016%
197.432.0005%
194,116.000-2%
167.473.000-14% 11.57% 17.26%
5,653.00012%
8.984 000 59%
11,599.00029%
12.319.0006%
9 699.000-21%
7.679.000-21% 841% 1605%
87.700.00016%
111.822.00028%
132.258.00018%
145.147.00010%
141,626,000-2%
121.915.000-14% 11.49% 16 63%
80.519,00013%25%
94.022.00017%34%
92 682.000-1%22%
100.364,0008%14%
111,933,00012%26%
106.518,000-5%39%
9 35% 24 06%
10.98%23%
24,625.00048%
43.307,00076%
67.331.00055%
68.650.0002%
53.075.000-23%
31.468.00041% 37 33% 59.01%
4.679.0008%
4,363.000-7%
5.781.00033%
5.621.000-3%
6.320.00012%
6.899.0009% 8.79% 9.73%
397% 269% 306% 2.85% 326% 4 12% 3.84% 4.00%
7 90% 750% 790% 8 10% 980% 9.70% 8.08% 8%
66 2% 42 9% 37 9% 504% 121 5% 265% 60.10% 57.83%
21.000-0.45%
103.000 2 36%
103.000 1 78%
232.0004.13%
1.513,00023.94%
229.000332% 4% 1.82%
25 37 33 35 31 24 27 25.95
526 993 11 65 12.21 840 456 6 4.93
142.408.00018%
155.058.0009%
170,570.00010%
199.774,00017%
204.868.0003%
174.764.000-15% 10% 12%
14 75% 24 90% 29 94% 1926% 055% -1448% 1410% 18 20%
COo
Page 133
I L & P _________________________________ 1998_________1999________ 2000_________2001_________ 2002_________2003_________2004_________2005_________2006_________2007_________ 2008_________2009_________2010 Average 12 Average 2007Profit
Margin290 400
50%259.300
47%316 800
44%214 100
26%250 400
28%327.300
41%411,100
45%367.000
28%386 000
20%448 000
19%245.000
11%75.000
6%284 000
24% 28% 33 03%
Assets Asset Growth
22.659.300 27.095.20020%
30.660 200 13%
34,406.90012%
34 448 600 0%
40.510.20018%
47.752.80018%
61.242,00028%
76.136.00024%
80.062.0005%
74.349.000-7%
80.021.0008%
75.705.000-5% 11% 15.42%
Revenue Revenue Increase
580 700 553.800-5%
717 800 30%
838.40017%
891,4006%
797.700-11%
907,90014%
1,313,00045%
1.939.00048%
2.414 000 24%
2.257,000-7%
1.354.000•40%
1,207,000-11% 9% 18.69%
Loans Loan Growth
6.905.400 8 449.900 22%
10.529.90025%
14.390.10037%
14 895 800 4%
18.808.70026%
21.633,70015%
32.761,00051%
42.161.00029%
41 648.000 -1%
44.850.0008%
43.517.000-3%
40.146.000-8% 17% 23.04%
Deposits Deposit Growth Deposit Ratio
5,246.700
21%
5.226,400 -0 39%
11%
6,575000 25 80%
9%
10.610.600 61 38%
11%
11.929 700 1243%
14%
12.819.400746%22%
13.009.300 1 48%
8%
15.089 000 15 99%
15%
19.169.000 27 04%
29%
23.587 000 23 05%
42%
32,664.000 38 48%
57%
33.275.000 1 87% 56%
30.527.000 -8 26%
56%17%28%
19.36%18%
Debt Debt Growth
2.377.800 3.964 500 66 73%
4 200 0005 94%
5.417,600 28 99%
5.910,900 9 11%
8.875.300 50 15%
11.878.000 33 83%
16 611.000 39 85%
19.823.000 19 34%
16,970,000 -14 39%
12.598.000 -25 76%
14.906.000 18 32%
11 720,000 -21 37% 18% 26 62%
Equity (TNW) Equity Growth
1.550.700 1.805.8001645%
1.898 300 5 12%
1.721.100 -9 33%
1 900 200 1041%
2.103.900 10 72%
2.365.3001242%
1,817.000 -23 18%
2.124.000 16 90%
2.370.000 11 58%
2.222.000 -6 24%
1.889.000 -14 99%
1.522.000-1943% 1% 568%
Capital Ratio TMW/Total Assets
6 87% 6 66% 6 19% 500% 552% 5 19% 4 95% 2 97% 2 79% 2 96% 2 99% 2 36% 201% 4% 469%
CAR (Tier 1) 1230% 12.30% 1220% 12 10% 1000% 11.10% 11.20% 12.60% 10.40% 1040% 920% 9 20% 10 60% 11% 11.37%
Efficiency 57% 70% 71% 74% 79% 76% 78% 93% 93% 72% 102% 102% 95% 84% 78.30%
Bad Debt Bad Debt/Equity
7.8000 50%
9.600 0 53%
10.700 0 56%
11.700068%
13.300 0 70%
13.400 0 64%
9.300039%
12 000 0 66%
14,000 0 66%
28.000 1 18%
170,000765%
11.000 0 58%
5.0000.33% 1% 0.67%
Leverage 15 15 16 20 18 19 20 34 36 34 33 42 50 28 23.!
Debt/Equity 153 220 2-21 3 15 3.11 422 502 914 933 7 16 567 7 89 7.70 6 S.I
Ireland GDP Ireland GDP Growth
67.782.000 72,632.0007%
73.535.0001%
80.529.00010%
94.246 000 17%
121.065.00028%
142.408.00018%
155 058 000 9%
170.570.00010%
199 774.000 17%
204 868.000 3%
174.764.000-15%
133.846,000-23% 0 13%
Sustainable Growth 381% 2 42% 261% 3 85% 3 70% 4 21% 3 56% 147% 1 74% 4 19% -0 46% 0 19% 0 95% 2.37% 3.0)
CO
Page 134
Barclays_______________________ 1999________ 2000________ 2001_________2002________ 2003_________2004________ 2005________ 2006__________ 2007__________ 2008__________ 2009__________ 2010 Average 12 Average 2007
ProfitMargin
2 460.000 12%
3 290 000 13%
3 608.000 12%
3,21800012%
3,779.00013%
4,502,00014%
5.280,00013%
7,136 000 14%
7,107,00013%
3 136 000 6%
5 585,000 9%
6,065.00010% 12% 13%
Assets Asset Growth
264.793,000 316 190 000 24%
356.649.00013%
403,066.00013%
443.361.00010%
522 089.000 18%
924.357,00077%
996,787.0008%
1.227.583.00023%
2,053.029.00067%
1.378.565,000-33%
1.489.645.0008% 21% 23%
Revenue Revenue Increase
20 894 000 25.075.00020%
29 006.000 16%
27.825 000 4%
29.734.0007%
33.282.00012%
39.910.00020%
49.958.00025%
55.286.00011%
55,225.0000%
59.659.0008%
59.993,0001% 10% 13%
Loans Loan Growth
156.194 000 198,536.00027%
228,382.00015%
260.572.00014%
288,743.00011%
330,077.00014%
300.001,000-9%
313,226.0004%
385.518.00023%
509,522,00032%
461.359,000-9%
465.741.0001% 11% 12%
Deposits Deposit Growth
Deposit Ratio (W)
168,452 000
26%
208 724 000 24% 24%
231.195,00011%29%
258,932.00012%34%
278 960.000 8%34%
328.742.00018%34%
313,811.000-5%24%
336,316,0007%
24%
386.395 000 15%23%
450.443,00017%26%
398875.000-11%19%
423,763.0006%18%
9%26%
11%28%
Debt Debt Growth
23 329.000 31 883.000 37%
41,846.00031%
45.885.00010%
49.569.0008%
67.806.00037%
115.791.00071%
124,923.0008%
138.378.00011%
183.268.00032%
161.718.000-12%
185.122.00014% 22% 26%
Equity (TNW) Equity Growth
8 300 000 8.918.0007%
10,417.00017%
11,271,0008%
12 067.000 7%
13.122,0009%
10.135.000-23%
12.492.00023%
21.576.00073%
30.800.00043%
49.683.00061%
53.565.0008% 21% 15%
Capital Ratio TNW/Total Assets 3 26% 2 82% 2 92% 280% 2 72% 251% 1 10% 1 25% 1 76% 1 50% 3 60% 3 60% 2% 2%
CAR (Tier 1) 11 0 0% 13% 970% 11% 9 00% 8 00% 740% 750% 900% 7 90% 6 70% 8% r 9% F 9%
Efficiency 29% 26% 28% 31% 31% 30% 32% 31% 30% 39% 42% 44% 33% 30%
Bad Debt 622,0007%
816.0009%
1.150.00011%
1,485.00013%
1.346.00011%
1.093.0008%
1.571.00016%
2.154 000 17%
2.795.00013%
5.419.00018%
8.071.00016%
5.672.00011% 13% 12%
Leverage 31 35 34 36 37 40 91 80 57 67 28 28 48 51
Debt/Equity 281 358 402 4 07 4 11 5 17 11.42 1000 641 595 325 346 6 6
UK GDP GDP Growth Rate
929,4705%
975.2945%
1,019.8395%
1 068.601 5%
1.136,5976%
1.199.8836%
1,262.7105%
1,333.1586%
1.412.1186%
1.440,9292%
1.401.864-3%
1.466.5695% 4% 5%
Sustainable Growth 1527% 1841% 17 46% 14 05% 15 68% 17 14% 26.53% 29 11% 16 63% 6 10% 636% 5 94% 16% 19%
N)
Page 135
Santander UK_______________1999________2000________2001________2002________ 2003________2004________2005________2006________2007________2008________2009________2010________2011 Average 2011 Average 2007Profit 1 7fn 1 Q7* 1 Q74 . QR4 - 754 252 596 428 864 1,094 1.690 2.125 1.261Profit
Margin1 783
17%1.975
15%1.974
16%984 -
-28%754
-11%2524%
5%8%
4287%
86411%
1 094 13%
1 690 20%
2.12527%
1.26114% 9% 4%
Assets Asset Growth
180.744 204.39113%
214 906 5%
205 7214%
176.775-14%
169.7414%
207.03422%
191.805-7%
199.6234%
231.74216%
285.29123%
302.8606%
297,574-2%
220,6315%
194,5272%
Revenue Revenue Increase
10.616 13.09323%
12.359-6%
3565-71%
6.75489%
6.153-9%
7.65624%
6 568-14%
8.15624%
8 683 6%
8 304-4%
7.9494%
8 756 10%
8,3556%
8,3248%
Loans Loan Growth
86 693 93 920 8%
88 524-6%
88.5130%
91 643 4%
89479-2%
127.09442%
140.52811%
147.3915%
165 490 12%
218.21432%
221 403 1%
222 763 1%
137.0509%
105,9768%
Deposits Deposit Growth
Deposit Ratio
89,735
33%
101.79113%34%
99.204-3%25%
100.9402%
24%
96 5264%23%
97 262 1%
19%
102.9586%
27%
114.41311%32%
117,7033%
23%
141,54620%27%
194 643 38% 24%
202.1364%
17%
184.958-8%14%
126,4477%
25%
102,2814%
26 75%
Debt Debt Growth
56.048 62.94912%
61.003-3%
55.382-9%
31,171-44%
27.329-12%
58.885115%
60.1902%
64.1877%
55.802-13%
60,3438%
62.9604%
66.7426%
55,6156%
53,0169%
Equity Equity Growth
6.078 6.83012%
8.05118%
7.019-13%
5,331-24%
4,924-8%
3.110-37%
3.1160%
3,44210%
4,81140%
7.22250%
12.27470%
12.6663%
6,52910%
5,322-5%
Capital Ratio TNW/Total Assets 3% 3% 3% 3% 3% 3% 1% 2% 2% 2% 2% 3% 4% 3% 3%
CAR (Tier I) 130% 9 70% 11 0% 900% 800% 7 40% 750% 9 00% 7 90% 6 70% 80% 4% 8% 0
Efficiency 20 9% 194% 21 1% 79% 45 9% 384% 29 4% 28 2% 22 1% 206% 34 3% 34.1% 31 7% 27% 26%
Bad Debt Bad Debt/Equity
3035%
2734%
2633% 0%
474 -9%
35-1%
2187%
34411%
34410%
3487%
84212%
7126%
5654%
3586%
2435%
Leverage 29 74 29 93 26 69 2931 33 16 34 47 66 57 61 55 58 00 48 17 39 50 24 67 23 49 39 41
Debt/Equity 922 922 758 7 89 5 85 555 18 93 1932 1865 11 60 836 5.13 527 10 11
UK GDP UK GDP Growth
929.4705%
975.2945%
1.019,8395%
1.068.6015%
1.136.5976%
1,199,8836%
1.262,7105%
1.333.1586%
1.412.1186%
1,440.9292%
1,401.864-3%
1.466.5695%
1.516.0004% 4% 5%
7 47% 4 07% -14 02% -14 14% 512% 19 16% 13 74% 25 10% 22 74% 23 40% 17 31% 9 96% 999% 5.81%
COCJ
Page 136
CIBC____________________________1998 1999 2000 2001 2002 2003 2004 2005 2006 2007 2008 2009 2010 Average 2010 Average 2007
Profit Margin Assets
Asset Growth
1.5368%
281,430
13887%
250.331-11%
2,763 12%
267 702 7%
1.8369%
287.4747%
4122 %
273,293-5%
2,30513%
275,8711%
3.00418%
278.7641%
9275%
280,3701%
3,31516%
303,9848%
3,85117%
342,17713%
4,229-33%
353,9303%
1,65012%
335.944-5%
4,04727%
352.0405%
9%298,716
2%
11%284,140
2%
Revenue Revenue Increase
19 804 20.1332%
23.12415%
21,387-8%
17,055-20%
17,1220%
16,705-2%
18,79212%
20.1857%
23,28915%
12,6704 6 %
13,8319%
14.9768%
18,390-1%
19,7602%
Loans Loan Growth
115 964 118.1922%
126 441 7%
132,8115%
139,3575%
135.931-2%
139.3292%
143.4193%
147,0673%
164.09712%
1729215%
169.172-2%
178,6126%
144,8704%
136,2614.00%
Deposits Deposit Growth Deposit Ratio
159,875
62%
160 041 0%
62%
179.63212%65%
194,3528%
66%
196 630 1%
65%
188.1304 %63%
190,5771%
62%
192.7341%
62%
202.8915 %
60%
231.67214%60%
232,9521%
57%
223,1174 %51%
246,67111%54%
199,9444%
61%
189,653 4 36%
63%
Debt Debt Growth
64 368 43 043 -33%
41,697-3%
44,7157%
28.556-36%
39.29638%
37,677-4%
39.4295%
56,11342%
55,8550%
60,4538%
56,923-6%
50,350-12%
47.5750%
45,0752%
Equity Equity Growth
11.136 11.058-1%
11.3693%
11,9005%
12.3334 %
13.77812%
13,223-4%
10,731-19%
12.32215%
13,4899%
13,8313%
14,2793%
15,79011%
12.7113%
12,1343%
Capital Ratio TNW/Total Assets 4% 4% 4 % 4% 4 % 5% 4 % 3% 4 % 3% 3% 3% 4 % 4% 399%
CAR (Tier I) 7 7% 8 3 % 8 7 % 9 0 % 8 7% 10 8% 10.5% 8.5% 10 4% 9 7% 10.5% 12 1% 13 90% 10% r 9%
Efficiency 77 1% 78 9% 67 0% 74 4 % 83 5% 70 9% 70 1% 86 9% 66 0% 63 1% 63 0% 67 1% 58 1% 71 2% F 73.8%
Bad Debt Bad Debt/Equity
4804%
7507%
1,22011%
1.1009%
1.50012%
1.1438%
6285%
7067%
5484 %
6034 %
7736%
1,64912%
1.0467%
9347%
8687%
Leverage 25 23 24 24 22 20 21 26 25 25 26 24 22 24 24
Debt/Equity 578 389 367 3 76 232 285 285 367 4.55 4.14 4.37 3.99 3.19 4 4
Canada GDP Canada GDP Growth
616-3%
6617%
72410%
715-1%
7343%
86518%
99215%
1,13314%
1.27813%
1,42411%
1,5025%
1,337-11%
1,57718%
1,043 r 8%
9149%
Sustainable Growth 5 92% 10 28% 13 88% 1232% -0.85% 6 2 3 % 5 2 5 % 13 13% 8 92% 8 79% 1242% 0.33% 0.16% 7% 8.39%
Page 137
CHAPTER 9
Alexander D. and Pasternak S.B., (2012), Bloomberg Markets Magazine,
Bloomberg Portal, WWW.Bloomberq.com accessed on July 4, 2012.
Allen N., and Meyer J., (1997), Commitment in the Workplace, Sage Publications
Altman E.I., Rijken H.A., (2005), The Impact of the Rating Agencies’ Through the-
cycle methodology on rating Dynamics, Economic Notes by banca Monte dei
paschi di Siena SpA, vol. 34, no. 2-2005, pp 127-154
Asano A., Eto T.(2005), Amakudari as a signal: Possible malfunctioning of the
Amakudari practice under the limited deposit insurance system, Japan Forum 17
(3) 2005: 335-345
Simpson J.,L., (2008) Applied Financial Economics, Vol 20 Issue 1-2, 18, pp
199-211
Barham G., (2004), The Effects of Taxation Policy on the cost of Capital in
Housing A Historical Profile (1976 to 2003), CBFSAI Financial Stability Review.
Barrow G.L. (1975) The Emergence of the Irish banking System 1820-1845, Gill
And MacMillan
Bebczuk R., and Galindo A., (2008) Financial Crisis and sectoral diversification of
Argentine banks, 1999-2004.
9.1 Bibliography
135
Page 138
Beesley A., (2007) April 8, 2007, Irish Times online media, at
http://www.irishtimes.eom/newspaper/finance/2007/0428/1177280512908.html
Accessed on July 23, 2012.
Bones, C., 2012, (2012) http://www.auardian.co.uk. Monday 20 February 2012,
accessed on March 1, 2012,
Brown C.O. and Dine I.S. (2005), The Politics Of Bank Failures: Evidence from
Emerging Markets, Quarterly Journal Of Economic Activity, pp 349-377
Calomiris C.W., Mason J.R. (1997), Contagion and Bank Failures During the
Great Depression: The June 1932 Chicago banking Panic, The American
Economic Review, pp 863-881
Business Credit, (2011) April 2011, Vol. 113 Issue 4, pp50-53,
Cantor R., Mann C., (2003), Are Corporate Bond Ratings Procyclical?, Special
Comment, Moody's Investor Service, October 2003
Caprio G., Honohan P., (1999), Restoring banking Stability: Beyond Supervised
Capital Requirements, Journal of Economic Perspective, Vol. 13, No. 4 1999,
pp43-64
Caprio, G., (1998), Banking on Crisis; Expensive lessons. World Bank Policy
Research Working Paper
Casu B., Girardone C., Molyneux P., (2006) Introduction To Banking, FT Prentice
Hall, pp 4, 50
136
Page 139
Cebula J. R., Koch J.V., Fenili R.N., (2011), The Bank Failure Rate, Economic
Conditions and banking Statutes in the US, 1970-2009, International Atlantic
Economic Society 2011, pp 39-46
Coggan P. The Money Machine, (1986), Penguin Business, pp 10
Collis, J. & Hussey, R. (2009) Business Research: a practical guide for
undergraduate and postgraduate students. (3rd ed.) Basingstoke: Palgrave
Macmillan & Davies, G. (2011), The History Of Money
Department of Finance, (2011), Reforming Ireland’s Budgetary Framework: A
Discussion Document Department of Finance March 2011, (pp2)
European Central Bank, (2011), Web Address:
http://www.ecb.int/stats/html/index.en.htmI accessed on September 29, 2011,
Author not listed.
Eisenbeis R.A., and Kaufman G.G. (2007), Cross-border banking: Challenges for
deposit insurance and financial sstabilit in the European Union, Working paper
2006-15a, federal reserve bank Of Atlanta.
Estrella A., Park S., Peristiani S., (2000), Capital Ratios As Predictors of Bank
Failure, Federal Reserve Bank Of New York, Economic Policy Review July 2000.
European Financial Stability Facility, (2011), Web Address:
http://www.efsf.europa.eu/about/index.htm accessed on September 25, 2011,
Author not listed.
Eurostat, (2011), GDP & Debt Statistics, Web
Address:http://epp.eurostat.ec.europa.eu/tqm/table.do?tab=table&init=1&pluqin=
137
Page 140
1 &lanquaqe=en&pcode=tsieb020 accessed on September, 24, 2011, Author not
listed.
M.C. Jensen and W. Meckling, (1976), Theory of the Firm: Managerial Behaviour, Agency Costs and Capital Structure’, Journal of Financial Economics, Vol.3 (1976), pp305.
Ferguson T., and Johnson R., (2009), Too Big to Bail: The Paulson Put,
Presidential Politics, and the Global Financial Meltdown, International Journal of
Political Economics, vol. 38, no 1 Spring 2009 pp 3-34
Ferguson N., (2008) The Ascent Of Money, A Financial History Of The World,
Penguin Press, 2008.
Glasberg D.A. and Skidmore D., (1998), The Dialects of White-Collar Crime: The
Anatomy of the Savings and Loan Crisis and the case of Silverado Banking,
Savings and Loan Association, American Journal of Economics and Sociology,
Vol. 57, No. 4 October 1998
Goodhart C.A.E., (1995), The Central Bank and the Financial System, Macmillan
Press Ltd
Graafland J.L., and Van De Ven B.W., (2011) The Credit Crisis and the Moral
Responsibility of Professionals in Finance, Journal of Business Ethics, pg 606.
Hickson C.R., Turner J.D., (2005), The Genesis of Corporate Governance:
Ninteenth Century Irish Joint-Stock Bank, Business History, Vol 47, No 2 April
2005, pp 174-189
138
Page 141
Honohan P., (2010), Irish Banking Crisis, regulatory and Financial Stability Policy
2003-2008. A Report to the Minister for Finance by the Governor of The Central
Bank.
Higgins, R.C., (2005), Analysis for Financial Management, Irwin/McGraw-Hill
Higgins, R.C. (1972), ‘Sustainable Growth Under Inflation’ Financial Management
Association, Vol 10, Issue 4 p36-60
Haron. Sudin, Wan Nursofiza Wan Azmi, (2009), Islamic Finance And Banking
System, Philosophies, Principles, Practices, McGraw Hill Education, 2009
Thomas L.B. (2006), Money Banking And Financial Markets 2006, Thompson
South-Western pp 7
Hynes R. and Walt S.D. (2010), Why Banks are not allowed in Bankruptcy,
Washington & Lee Law Review, Vol. 67, Issue 3, pp 985-1051
Independent Commission On banking Final Report, (2011) September 2011.,
available at http://bankinacommission.independent.aov.uk/. Author not listed,
commissioned for the UL Parliament in 2011. Accessed October 2011
Imai M., (2009), Political Influence and Declarations of Bank Insolvency in Japan,
Journal Of Money, Credit, Banking, Vol. 41, No. 1, February 2009, pp131-158
Irish Department Of Finance http://www.finance.aov.ie accessed on October 28,
2011 .
lrishTimeshttp://www.irishtimes.com/newspaper/breakinq/2010/1201/breakina57.
html accessed October 28, 2011. Author unknown.
Page 142
Jackson J.K. (2010), Iceland’s Financial Crisis, Current Politics and Economics of
Europe Vol. 21, Issue 1, 2010, pp 99-108
James C., (2010), Federal Reserve Bank Of San Francisco, Economic Letter,
Mortgage Backed Securities: How Important Is “Skin in the Game’?
Jensen M.C and Meckling W.H.(1976), Theory of the Firm: managerial
behaviour, agency costs and ownership structure.
Johnston, E., ( 2011), Sydney Morning Herald.com, French banks Downgraded
on Greek Exposure,, Web Address: http://www.smh.com.au/business/french-
banks-downqraded-on-qreece-exposure-20110914-1k9om.html accessed on
September 29, 2011
Jolly D. (2011), New York Times November 3, 2011, web address:
www//nvtimes.com/2011/11/03/bnp-paribas-writes-down-qreek-debt-as-earninqs-
slump/. accessed November 3, 2011
Kane E., (1989), The S&L Insurance Mess: How did it happen? Washington DC
Urban Institute Press, Library of Congress,
Kane E., (2003), What Economic Principles Should Policymakers in Other
Countries Have Learned from the S&L Mess?, Business Economics, January
2003, pp 21-30
Katz, C., (2001), The Economic Crisis, Interpretations and Proposals,
International Journal Of Political Economy, vol. 31, no. 1, Spring 2001, pp 45-46
140
Page 143
Kennedy T , O’Sullivan K P V , (2007), A model for Regulatory intervention in
Irish banking, Department Of Economics, NUI Galway, Journal Of Banking
Regulation Vol 8, 2, pp 113-130
Kindleberger, C (2005) Manias, Panics and Crashes, Fifth Edition, pg 191 New
York Wiley
Kindleberger C ,& Minsky H , (1998), Financial Instability Model (FIM) (1998)
Knutsen S and Lie E (2002), Financial Fragility, Growth Strategies and Banking
Failures The major Norwegian Banks and the banking Crisis 1987-92, Business
History, Vol 44, No 2, April 2002, pp 88-111
Krauss, E S , and Pekkanen R J (2010), The Rise and Fall of Japan's Liberal
Democratic Party, Journal of Asian Studies, Feb2010, Vol 69 Issue 1, pp5-15
Kregel J , (2008), Changes in the US Financial System and the Subprime Crisis
Working Paper 530 Levy Economics Institute of bard College, Annandale-on-
Husdon, NY
Kwok C H Lim A B , and Wang Y , (1992), The Application of Discriminant
Analysis (MDA) and Logistical Regression (Logit Analysis) in predictions of
financial distress in banks/financial institutions- issues and comparisons Centre
for research in financial services, Nayang Technology University Singapore
Laurence A , (2008), The Emergence of a private clientele for banks in the early
eighteen century Hoare's bank and some women customers, Economic History
Review, 61, 3 (2008) pp 565-586
141
Page 144
Lenihan B., 2010, Department Of Finance,
http://www.departmentoffinance.qov.ie Accessed on October 20, 2011.
Lewis M., (1990), Liar’s Poker. New York: Penguin
Leonardi R., (2005), The Impact and Added Value of Cohesion Policy, Cohesion
in the European Union, Regional Studies, Vol 40-2, pp155-166
Martin D., (1977), Early Warnings Of Bank Failure a Logit regression approach,
Journal of Banking and Finance, 1, pp 249-276
Marshall, W., (2009), Origins of Banking crisis in Latin America: A critical view,
Journal Of Post Keynesian Economics, Vol. 31, No. 4, pp669:690
Marrison C. (2002), The Fundamentals of Risk Measurement, McGraw Hill
Mayer T., (1975), Should Large Banks Be allowed to Fail, Journal Of Financial
And Quantitative Analysis, 1975 pp 603-610
McCarthy Y., (2011) Central Bank of Ireland Technical Paper, Behavioural
Characteristics and Financial Distress.
Mishkin F., (1997), The Causes and propagation of financial instability: Lessons
for policy makers, in maintaining Financial Stability in a Global Economy, Kansas
City MO, Federal Reserve Bank of Kansas.
Newton L., and Cottrell P.L., (1998), Joint-Stock Banking in the English Provinces
1826-1857: To Branch or Not to Branch? Business And Economic History, Vol
27,1998.
142
Page 145
Nunnenkamp P., (1998), Dealing with the Asian Crisis, Interconomics,
March/April 1998, pp 64-71
Nyberg P., (2011), Misjudging Risk: Causes of the Systemic Banking Crisis in
Ireland, Report Of the Commission of Investigation into the Banking Sector in
Ireland
OECD, September 2011, General Government gross Financial Liabilities per cent
of nominal GDP, Web Address:
http://www.oecd.ora/document/0,3746,en 2649 201185 46462759 1 1 1 1.00
.html accessed September 29, 2011, Author not listed
O’Grada C., (2010), The Last Major Irish Bank Failure: Lessons for Today? UCD
Centre for Economic Research Working Paper series, November 2010.
Orol R. D., (2011), MarketWatch.com, January 27, 2011, accessed on March 1,
2012
O’Sullivan K.P.V., and Kennedy T., (2007), A model for regulatory intervention in
Irish banking, Department of Economics, National University of Ireland Galway,
Journal Of Banking Regulation, Vol. 8 2 pp 113-130
Pisani-Ferry J., Sapir A., (2010), Banking Crisis Management in the EU: an early
assessment, Economic Policy April 2010 pp 341-373
Persaud A., (2009), Crisis Response, Macro-Prudential Regulation, The World
Bank Group, Note Number 6, July 2009 pp1-8
Quinlan C., (2011), Business Research Methods, South-Western Cengage
Learning, pp 95
Page 146
Rahman S , Tan L H , Hew O L , and Tan Y S , (2004), Identifying Financial
Distress Indicators of Selected Banks in Asia, Asian Economic Journal 2004, Vol
18, No 1, pp 45-57
Ramskogler P , (2011), Credit Money, Collateral and the Solvency of Banks A
post Keynesian Analysis of Credit Market Failures Review Of Political Economy
vol 23, No 1 pg 67-79
Regling K and Watson M , (2010), A Preliminary Report on The Sources of
Irelands Banking Crisis, Government Publications Office, Dublin 2010
Romer C D , (1988), The Great Crash and the Onset of the Great Depression,
NBER Working Paper No 2639
Saita F , (2007), Value At Risk And Bank Capital Management, Risk Adjusted
Performances, Capital Management and Capital Allocation Decision making,
Academic Press Advanced Finance Series 2007
R Rena, (2007), Historical Development of Money and banking in Eritrea from
the Axumite Kingdom to the Present
Saunders M , Lewis P , Thornhill A , (2009), Research Methods For Business
Students Fifth Edition, Prentice Hall (pp 111)
Schnabl G , and Hoffman A (2008), Monetary Policy, Vagabonding Liquidity and
Bursting Bubbles in New and Emerging Markets An Overinvestment View, The
World Economy pp 1226 1252
144
Page 147
Shin H. S., (2009), Reflections on Northern Rock: The Bank Run that Heralded
the Global Financial Crisis, Journal Of Economic Perspectives Vol. 23, No. 1
2009, pp 101-119
Shoven J.B., Smart S.B., Waldfogel J., (1992), Real Interest Rates and the
Savings and Loan Crisis: The Moral Hazard Premium, Journal Of Economic
Perspectives, Vol. 6, No. 1, 1992. Pp 155-167
Stauffer R. F., (1981), The Bank Failures of 1930-31 Journal of Money, Credit,
And Banking, Vol. 13, No. 1 February 1981, Ohio State University Press
Suddaby, R., (2006), What grounded Theory is Not, Academy of Management
Journal, Vol 49, No 4, pp 633-642
Sugawara S, (1998) The Washington Post, Web Page
http://www.washinatonpost.com/wp-
srv/business/lonaterm/asiaecon/stories/ibanks062598.htm
Accessed November 1, 2011.
Temin P., (1976), Did Monetary Forces Cause The Great Depression? New York
Norton
Thies C.F., & Gerlowski D.A., (1989), Deposit Insurance: A History Of Failure,
Cato Journal, Vol 8, No 3, pp 677-693
Vale B., (2005) The Norwegian Banking Crisis, Central bank Of Norway
Valentine S., Mason S., (1976), Basics Of Banking 1976, Hodder and Stoughton
145
Page 148
Volker, P., (2011), TheNewYorker.com, A Little Inflation Can Be A Dangerous
Thing, , Web Address:
http://www.newvorker.com/reportinq/2010/07/26/10Q726fa fact cassidv
accessed September 29, 2011
Welfens P.J.J. (2008) Banking Crisis and prudential supervision: A European
perspective, EIIW, Ulniversity of Wuppertal, Germany 2008.
Wallace E., Chernatony L., Buil I., (2011), How Leadership and Commitment
Influence Bank Employees’ Adoption of their Bank’s Values, Journal of Business
Ethics (2011) Vol 101:397-414 pp 398
Walker, D.M. (2009) “A Review of corporate governance in UK Banks and other
financial industry entities”, Walker Review 2009
Walters B., (2008), The Fall Of Northern Rock, An Insiders Story of Britain’s
biggest banking disaster, Harriman House Ltd.
Wood R., Riley M., Clark M. A., Wilkie E., Szivas E„ (2000), Researching and
Writing Dissertations in Business and Management, First Edition, Thomson
Learning, pp47-50
http://www.finance-maaazine.com/displav article.php?i=8669&pi=315. October
2008. Accessed May 1, 2012. Author not listed.
http://www.newstalk.ie/2011/news/barroso-eu-is-facino-biggest-crisis-but-will-
overcome-problems/ September 28, 2011, Accessed January 30, 2012. Author
not listed.
http://www.tradinqeconomics.com Accessed February 10, 2012. Author not
listed. Pay website.
146
Page 149
http://www.tradinaeconomics.com accessed October 20, 2011
www. rvanair.com/en/investor/investor-relations-news Accessed February 15,
2012. Author not listed.
http://www.fdic.aov.com accessed on October 1, 2011
Zheng Y., and Tang K.K., (2009), Rethinking the measurement of capital flight:
an application to Asian economics, Journal of the Asia Pacific Economy, Vol. 14,
No. 4, November 2009, pp 313-330
Annual Financial reports were obtained for the following Financial Institutions:
• Allied Irish Bank, 1999 through 2010
• Anglo Irish Bank, 1998 through 2010
• Irish Nationwide Building Society, 2001 through 2010
• EBS, 1999 through 2010
• Bank of Ireland, 1999 through 2010
• Irish Life & Permanent, 1998 through 2010
• Barclays Bank PLC, 199 through 2010
• Santander UK PLC, 1999 through 2010 (Including Abbey
National Group)
• Canadian Imperial Bank Of Commerce, 1998 through 2010
147