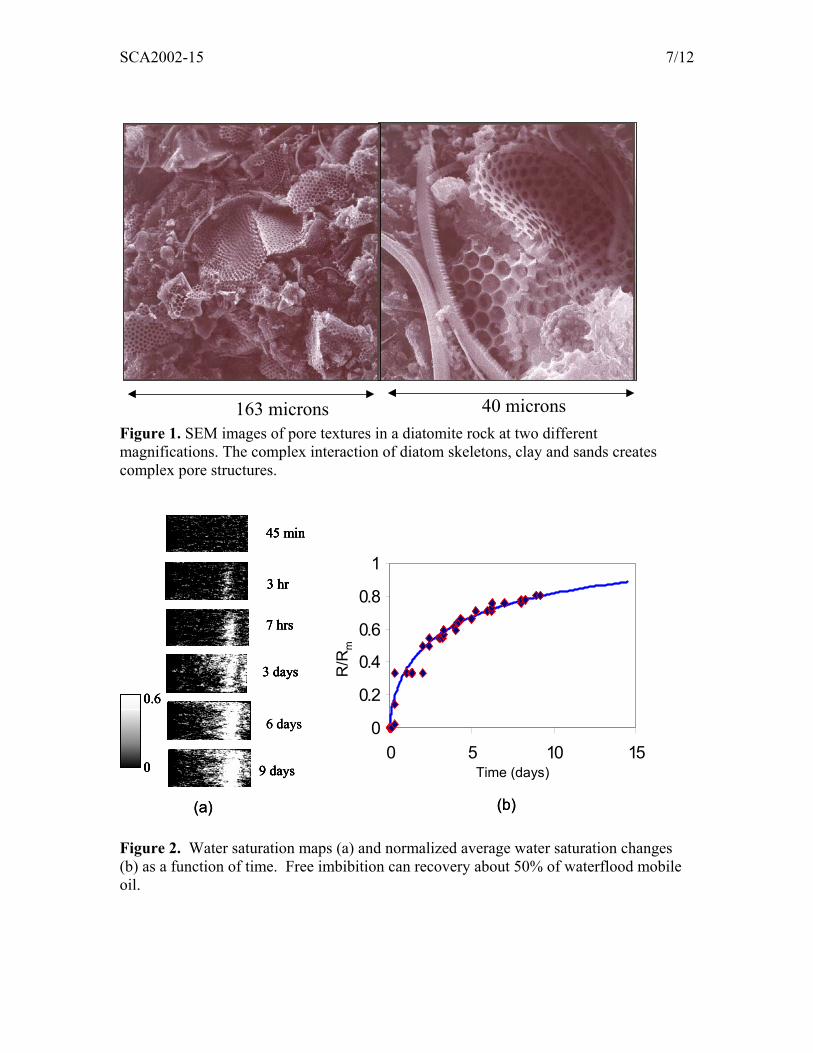
SCA2002-15 1/12 UNDERSTANDING THE LOST HILLS WATERFLOOD Dengen Zhou, Jairam Kamath, Francois Friedmann, and Mike Morea, ChevronTexaco ABSTRACT We report on an integrated laboratory and simulation effort to understand the unconventional response of the waterflood in the Lost Hills field. We conducted spontaneous imbibition and coreflood experiments with Computed Tomography (CT) flow imaging to determine imbibition rates and relative permeability data. Next we matched the major features of the field response using a prototype sector model. We used this model of the field to evaluate the role of spontaneous imbibition and water drive in recovering oil. INTRODUCTION The Lost Hills field in California was discovered in 1910 and contains over 2.6 billion barrels of oil. 1 The average depth of the productive interval is 2000 feet, with a major portion of the oil in diatomaceous rocks. These rocks consist mostly of diatom skeletons, clay and sand. A diatom skeleton has many small pores with diameters less than 2 microns, and this results in very high porosity. The mixing of the diatom skeletons, clay, and sands creates very complex pore structures and low permeability. 2 Figure 1 shows Scanning Electron Microscopy images of the pore texture at two different magnifications. Oil recovery is low because of the low permeability and complex pore structures. Even with the help of massive hydraulic fracturing, primary recovery is only 3-5% of original oil in place (OOIP). Several schemes for improving oil recovery, such as water, steam and CO 2 flooding, are being tested. 3,4 Waterflooding is currently considered the most promising. However, the response to waterflooding has been unconventional, and this has created challenges for optimizing its response. ChevronTexaco initiated a diatomite waterflood pilot at the end of 1990 and began full- project development in 1992. 1 Because of low matrix permeability, both injectors and producers need to be hydraulically fractured to achieve commercial rates. Since 1992, more than two hundred 2.5-acre patterns have been put on water injection. The oil production has increased from approximately 10,000 BOPD in 1992 to about 15,000 BOPD in 1995. Since 1995, the water injection rate has been doubled, but the oil production rate has remained flat. Significant effort 5,6 has been made to characterize the fluid transport in the reservoir, including tracer tests, produced water salinity monitoring, and cross-well electromagnetic (EM) imaging. Principal observations are: 1. Water production rate responds very quickly to changes in water injection rate; 2. Oil production rates are relatively constant (on an average of 50 bbls/day/well) even after 0.3 HCPV water injected;
Transcript
SCA2002-15 1/12
UNDERSTANDING THE LOST HILLS WATERFLOOD
Dengen Zhou, Jairam Kamath, Francois Friedmann, and Mike Morea, ChevronTexaco ABSTRACT We report on an integrated laboratory and simulation effort to understand the unconventional response of the waterflood in the Lost Hills field. We conducted spontaneous imbibition and coreflood experiments with Computed Tomography (CT) flow imaging to determine imbibition rates and relative permeability data. Next we matched the major features of the field response using a prototype sector model. We used this model of the field to evaluate the role of spontaneous imbibition and water drive in recovering oil. INTRODUCTION The Lost Hills field in California was discovered in 1910 and contains over 2.6 billion barrels of oil.1 The average depth of the productive interval is 2000 feet, with a major portion of the oil in diatomaceous rocks. These rocks consist mostly of diatom skeletons, clay and sand. A diatom skeleton has many small pores with diameters less than 2 microns, and this results in very high porosity. The mixing of the diatom skeletons, clay, and sands creates very complex pore structures and low permeability.2 Figure 1 shows Scanning Electron Microscopy images of the pore texture at two different magnifications. Oil recovery is low because of the low permeability and complex pore structures. Even with the help of massive hydraulic fracturing, primary recovery is only 3-5% of original oil in place (OOIP). Several schemes for improving oil recovery, such as water, steam and CO2 flooding, are being tested.3,4 Waterflooding is currently considered the most promising. However, the response to waterflooding has been unconventional, and this has created challenges for optimizing its response. ChevronTexaco initiated a diatomite waterflood pilot at the end of 1990 and began full-project development in 1992.1 Because of low matrix permeability, both injectors and producers need to be hydraulically fractured to achieve commercial rates. Since 1992, more than two hundred 2.5-acre patterns have been put on water injection. The oil production has increased from approximately 10,000 BOPD in 1992 to about 15,000 BOPD in 1995. Since 1995, the water injection rate has been doubled, but the oil production rate has remained flat. Significant effort5,6 has been made to characterize the fluid transport in the reservoir, including tracer tests, produced water salinity monitoring, and cross-well electromagnetic (EM) imaging. Principal observations are: 1. Water production rate responds very quickly to changes in water injection rate; 2. Oil production rates are relatively constant (on an average of 50 bbls/day/well) even
after 0.3 HCPV water injected;
SCA2002-15 2/12
3. Oil production rates are independent of the water production rates; 4. Tracer tests show that an injector can have "short-circuits" with several producers,
and that the most direct connections can be with wells farther away from the injector; 5. Salinity monitoring indicates that these "short-circuits" are a common feature in the
waterflood area; 6. Cross-well EM images show water invades the formation slowly with diffusive
fronts. The independence of oil rates to water rates and the short tracer breakthrough time (less than one month) are indicators of a naturally fractured reservoir. Spontaneous-imbibition can be an important recovery mechanism in such a case. On the other hand, there is approximately 10 psi/ft pressure gradient between the injectors and the producers in the waterflood area. This pressure gradient might be sufficient to drive water into the matrix and displace oil. We first present laboratory measurements for determining spontaneous imbibition and waterflood data at the core scale. We then match the major features of the response using a prototype sector model. Next we upscale our laboratory data to the field scale to evaluate the importance of spontaneous imbibition to oil recovery. LABORATORY MEASUREMENTS It is challenging to perform laboratory measurements on diatomite rocks because of their low permeability and tendency to compact. Standard laboratory protocols for waterflooding are suspect due to the difficulty in respecting the extremely low capillary number present in the field and the heterogeneous nature of the core samples.7 We have collected laboratory data on diatomite rocks over the last decade and were reluctant to conduct many additional tests. We reviewed the existing data set and decided to conduct one additional spontaneous imbibition test and one waterflood test. These were justified on the basis of the need to confirm prior data and the use of Computed Tomography (CT) scanning to understand flow patterns. Spontaneous Imbibition In highly fractured reservoirs, spontaneous imbibition can be a major recovery mechanism. One needs two parameters to characterize such a process. They are the amount of oil that can be recovered by spontaneous imbibition and the time scale to recover the oil. This time scale depends strongly on the fracture spacing, fluid and rock properties, and the capillary pressures. We conducted a counter-current spontaneous imbibition test using a native state diatomite core. CT scanning was used to monitor the saturation changes during the imbibition test. Details of the experimental setup are given in a previous study.8 The selected native core is about 2 inches long and one inch in diameter. It was flushed with crude oil to re-saturate the core at initial water saturation (Swi). The oil permeability at Swi was estimated to be about 0.1 mD. The porosity and initial water saturation were
SCA2002-15 3/12
estimated from the CT numbers to be 0.57 and 0.51, respectively. Water contacted the core from one side and oil was produced from the same side. All the other sides were sealed to create a well-controlled boundary condition. Figure 2a shows the saturation evolution with time. The saturation maps show clearly that there is some core-level heterogeneity and that the saturation profiles are very diffusive. Substantial amounts of oil can be recovered by imbibition at the core scale. Figure 2b displays the average water saturation in the core as a function of time. The saturation increases are normalized by the total waterflood mobile oil saturation. Spontaneous imbibition can recover as much as 50% of the total mobile oil in about 10 days. This is consistent with previous in-house measurements. Waterflood Three preserved plugs were selected to make one composite core. The core was first flushed with synthetic brine. It was then miscibly cleaned using a series of solvent mixtures (decane, toluene and methanol). The core was aged at initial water saturation for three weeks to restore wettability. The core was positioned vertically and water was injected from the bottom at a constant rate of 10 cc/day. The downstream pressure of the core was held constant at 1400 psi. Table 1 lists the basic core properties and the waterflood data. Figure 3 shows the pressure drop and oil production as a function of pore volumes of water injected. It took three weeks to complete one displacement run, even though the maximum pressure drop was fairly high (400 psi). We obtained very similar relative permeabilities using both JBN 9 and history matching methods that included capillary pressure. Figure 4 shows the estimated relative permeability curves and the corresponding water fractional flow curve at reservoir conditions. Figure 5 displays water saturation changes at the end of the waterflood. The core exhibits sub-core-level lamination. Water preferentially flows through some layers, and this is consistent with earlier work.7 The large pressure drops and core level heterogeneity raise some issues on the validity of the relative permeability data,7 and they are left unresolved in this work. MATCHING FIELD OBSERVATIONS We cut a sector model from the full field geological model for Lost Hills (Figure 6). This sector is slightly larger than a ¼ well pattern in the center of the waterflood area. The model dimensions are 204 x 204 x 500 ft and it contains 32 x 34 x 41 grid blocks. The measured permeability and relative permeability curves are used. We choose the following sensitivity parameters to match field observations: the half-length of the vertical producer and injector hydraulic fractures (Hp and Hi), length (lL), permeability (kL), and porosity of vertical high flow channels.
SCA2002-15 4/12
The high flow channels were simulated by using a column of cells one foot wide that extended potentially from the injector to the producer. We used the high flow channels to represent "short-circuits" between the producers and injectors. Because of the complex stress field in the diatomite formation, the hydraulic fracture planes are not parallel to each other.10 The distance between the injection and production planes is only about 140 feet and is comparable to the fracture half-length. Thus it is likely that there will be points in the formation where the fracture planes are relatively close. Another possibility is a zone caused by the opening of natural fractures. Our model of these "short-circuits" are fractured zones that connect the idealized vertical, planar, and parallel hydraulic fractures in our simulation model. We conducted a series of simulation runs to determine the ranges of the parameters that are required to reproduce the major features of the waterflood performance. The highlighted values in Table 2 are the best parameter estimates to reproduce the major features of the Lost Hills waterflood response. The producer hydraulic fracture half-length is estimated to be less than 100 ft, while the injector fracture half-length is greater than 100 ft, and that are in good agreement with earlier estimates. The best estimate of the high flow channels is that they completely connect the idealized hydraulic fractures, and the porosity of this channel is 0.03. Figure 7 shows the match to oil rate, water oil ratio and tracer data. Cross-well images show that the water displacement fronts are diffusive.6 The maximum saturation changes obtained in some layers are less than 10 saturation units, and this is consistent with what we observed in our simulation model. Water breaks through early through local high permeability channels, but water also invades the matrix rock in a slow, diffusive fashion. SIGNIFICANCE OF SPONTANEOUS IMBIBITION TO RECOVERY We have shown that essential features of the field data can be simulated using a plausible scenario of the Lost Hills waterflood. We have ignored the role of spontaneous imbibition in our simulation studies. Spontaneous imbibition is only important where there is significant surface contact between water flowing in high permeability features, e.g., fractures, and the surrounding rock. In our current scenario, this type of contact is possible only in the high permeability channels. The oil in place in this channel is less than 2000 barrels and will have negligible effect on well-production rates. Any Other Scenarios? Two horizontal wells and many vertical wells have been cored to characterize natural fractures. Careful observation of the cores suggests that there are some natural fractures in the diatomite. However, the fractures are mostly clay filled. There are four sets of natural fractures identified. The main fracture set is roughly aligned with the hydraulic fracturing azimuth. The average fracture spacing is about 20 feet. Spontaneous water imbibition will have the largest effect if we assume that all these fractures are filled with water and that the oil that is produced instantaneously finds its way to the producers.
SCA2002-15 5/12
These are unrealistic expectations but it gives us a method to gage the maximum impact of spontaneous imbibition. We first conducted fine grid simulation to history match the laboratory data. We used the measured relative permeability curves and estimated the imbibition capillary pressure. Figure 8 shows the oil production match of the experimental data, and the history matched estimate of imbibition capillary pressure. We then conducted fine scale simulation on the conceptual model using the above fracture model to estimate the oil production rate in the field. Figure 9 is the estimated oil rate for a 2.5-acre pattern. Considering the current actual average well rate (50 bbls/d/well), the most optimistic impact of spontaneous imbibition is about a 20% contribution to the oil rate (about 10 bbls/day) after the first few years. SUMMARY The waterflood response in the Lost Hills field has been unconventional. Certain features, such as early water breakthrough and independence of oil rate to water injection rate, are indicative of waterfloods in highly fractured reservoirs. It is difficult to measure laboratory data because of the low permeability and uncertain procedures for such rocks. Our new laboratory data uses CT scanning to image the saturation fronts, reveals the heterogeneous nature of the rocks, and gives us data on the time scale of spontaneous imbibition. We show that the field data can be explained by a low porosity, high permeability channel that connects the injector and the producer. Spontaneous imbibition likely plays a small role in recovery; water breaks through early through local high permeability channels and water also invades the matrix rock in a slow, diffusive fashion. ACKNOWLEDGEMENTS We thank the management of ChevronTexaco North America for their support of the project and permission to publish this paper. We also thank P. Perri, J. Brink, W. Fong, K. Castellucci, M. Emanuele, G. Mazmanian, M. Kumar, H. Wu, Ed deZabala and R. Ewy for data and support; and Tony Kovscek of Stanford University and Westport Technology International for help in conducting the experiments. REFERENCES 1. Wallace, N.J. and Pugh, E. D.: “An Improved Recovery and Subsidence Mitigation
Plan for the Lost Hills Field’ California,” SPE 26626 presented at 1993 SPE Annual Technical Conference and Exihibition, Houston, TX, Oct. 3-6.
2. Ross, C. M., and Kovseck, A. R.: “Microstructure and Fluid Distribution in a Diatomaceous Reservoir,” SPE 75190 presented at SPE/DOE Thirteenth Symposium on Improved Oil Recovery held in Tulsa, Oklahoma, 13–17 April 2002.
3. Perri, P. R., Emanuele, M.A., Fong , W. S., and Morea, M. F.: “Lost Hills CO2 pilot: Evaluation, Design. Injectivity Test Results, and Implementation.” SPE 62526 presented at the SPE/AAPG West Regional Meeting held in Long Beach, California, 19-23 June 2000.
SCA2002-15 6/12
4. Fast, R. E., Murer, A. S., and Zambrano, L. G.: “Lost Hills Diatomite Simulation Study: Predicting Waterflood Performance in a Low-Permeability, Compacting Reservoir.” SPE 26627 presented at 1993 SPE Annual Technical Conference and Exihibition, Houston, TX. Oct. 3-6.
5. Zhou, D., Friedmann F., Kamath, J. and Morea M.: “Understanding Waterflood in Lost Hills Diatomite,” SPE 75142 presented at the 13th SPE/DOR Improved Oil Recovery Symposium, Tulsa, OK, April 15-17, 2002.
6. Wilt, M., Zhang P., Morea M., Julander, D. and Mock P.: “ Using Crosswell Electomagnetics to Map Water Saturation and Formation Structure at Lost Hills,” SPE 68802 presented at the SPE Western Regional Meeting held in Bakersfield, CA. March 26-30, 2001.
7. Kamath J., de Zabala, E.F., and Boyer, R.E.: “Water/oil Relative Permeability Endpoints of Mixed-Wet, Low-Permeability Rocks,” SPEFE (Mar. 1995) 4-10.
8. Zhou, D., Jia, L., Kamath, J. and Kovscek, A. R.: “Scaling of Counter-current Imbibition Processes in Low Permeability Porous Media,” Journal of Petroleum Science and Engineering (2002) 33, 61-74.
9. Johnson, E.F., Bossler, D.P. and Naumann, V.O.: “Calculation of Relative Permeability From Displacement Experiments,” Trans. AIME (1959) 216, 370.
10. Ilderton, D.C., Patzek, T.W., Rector, J.W., Vineger, H.J.: “Passive Imaging of Hydrofracturees in South Belridge Diatomite.” SPEFE (Nov. 1996) 46-54.
Table 1. Basic core properties and waterflood data.
BASIC CORE PROPERTIES @ 120°F & 1400 PSI Length cm 22.44 Average Diameter cm 3.710 Porosity % BV 62.2% Pore Volume cc 151 Brine Permeability as Received mD 0.021 Toluene Permeability after Cleaning mD 0.092 WATERFLOOD DATA Initial CT Scanned Oil Saturation %PV 44.0 Initial Effective Oil Permeability mD 0.035 Total Water Injection Time Days 19.6 PV Injected @ Breakthrough PV 0.23 Total PV Injected PV 1.3
Table 2. Sensitivity parameters for the water-drive model.
40 microns163 microns Figure 1. SEM images of pore textures in a diatomite rock at two different magnifications. The complex interaction of diatom skeletons, clay and sands creates complex pore structures.
45 min
3 hr
7 hrs
3 days
9 days
6 days
0
0.6
0
0.2
0.4
0.6
0.8
1
0 5 10 15Time (days)
R/R
m
(a) (b)
45 min
3 hr
7 hrs
3 days
9 days
6 days
0
0.6
45 min
3 hr
7 hrs
3 days
9 days
45 min
3 hr
7 hrs
3 days
9 days
6 days
0
0.6
00
0.6
0
0.2
0.4
0.6
0.8
1
0 5 10 15Time (days)
R/R
m
(a) (b)
Figure 2. Water saturation maps (a) and normalized average water saturation changes (b) as a function of time. Free imbibition can recovery about 50% of waterflood mobile oil.
Figure 3. Measured pressure drops (a) and oil production (b) as a function of pore volume injected during the waterflood experiment.
SCA2002-15 9/12
00.10.20.30.40.50.60.70.80.9
1
0.5 0.6 0.7 0.8 0.9 1
Water Saturation
Rela
tive
Perm
%k
at S
oi o
r fw
KrwKro
fw
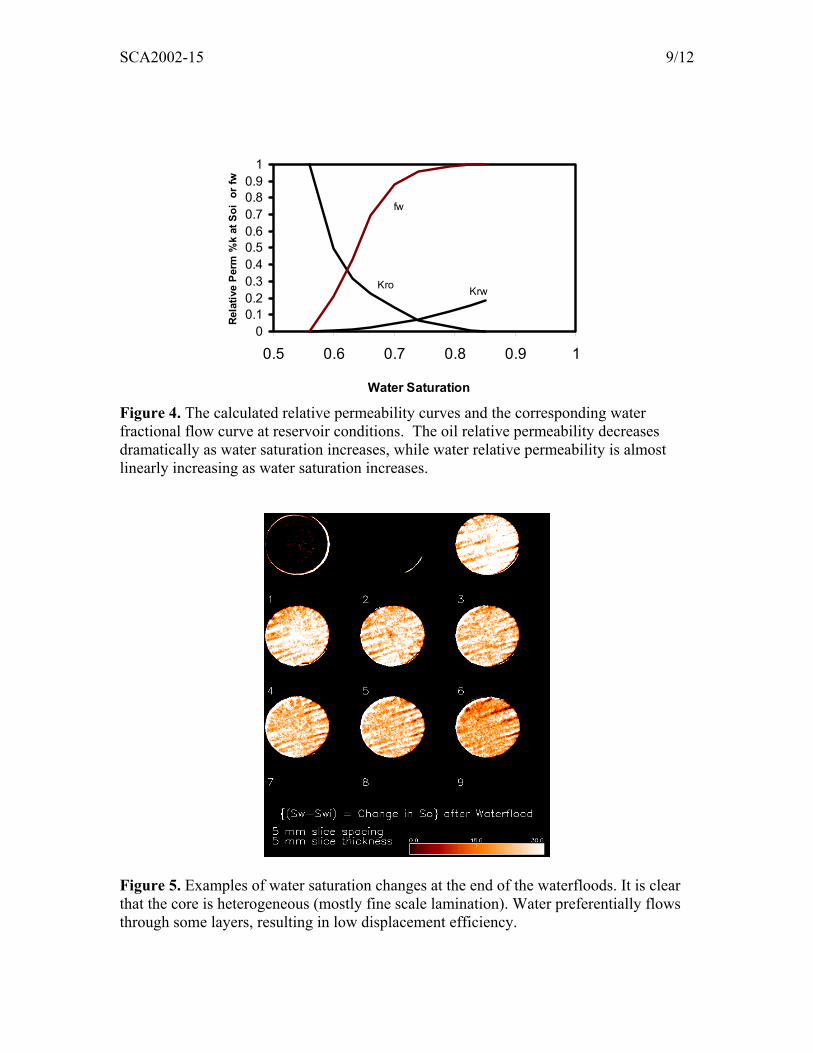
Figure 4. The calculated relative permeability curves and the corresponding water fractional flow curve at reservoir conditions. The oil relative permeability decreases dramatically as water saturation increases, while water relative permeability is almost linearly increasing as water saturation increases.
Figure 5. Examples of water saturation changes at the end of the waterfloods. It is clear that the core is heterogeneous (mostly fine scale lamination). Water preferentially flows through some layers, resulting in low displacement efficiency.
SCA2002-15 10/12
204’
204’
Hi
Hp llkl
143’
134’408’
Figure 6. A schematic of the water-drive simulation model. A ¼ well partten is used to reproduce the major features of the waterflood response.
(A) Oil Rate
0
50
100
150
0.00 0.05 0.10 0.15 0.20 0.25 0.30
HCPVWI
Oil
Rat
e (b
bl/D
)
150 ft
200 ft
100 ft
Field Data
Figure 7A. Comparison of simulated oil production rates with field data. Three half-lengths (100, 150, and 200 ft) are used for the injector fracture in these simulations. Oil production rates are not very sensitive to the injector fracture length as long as it is over 100 ft.
SCA2002-15 11/12
(B) WOR
0
2
4
6
8
10
0.00 0.05 0.10 0.15 0.20 0.25 0.30
HCPVWI
WO
R100 ft150 ft200 ftfield data
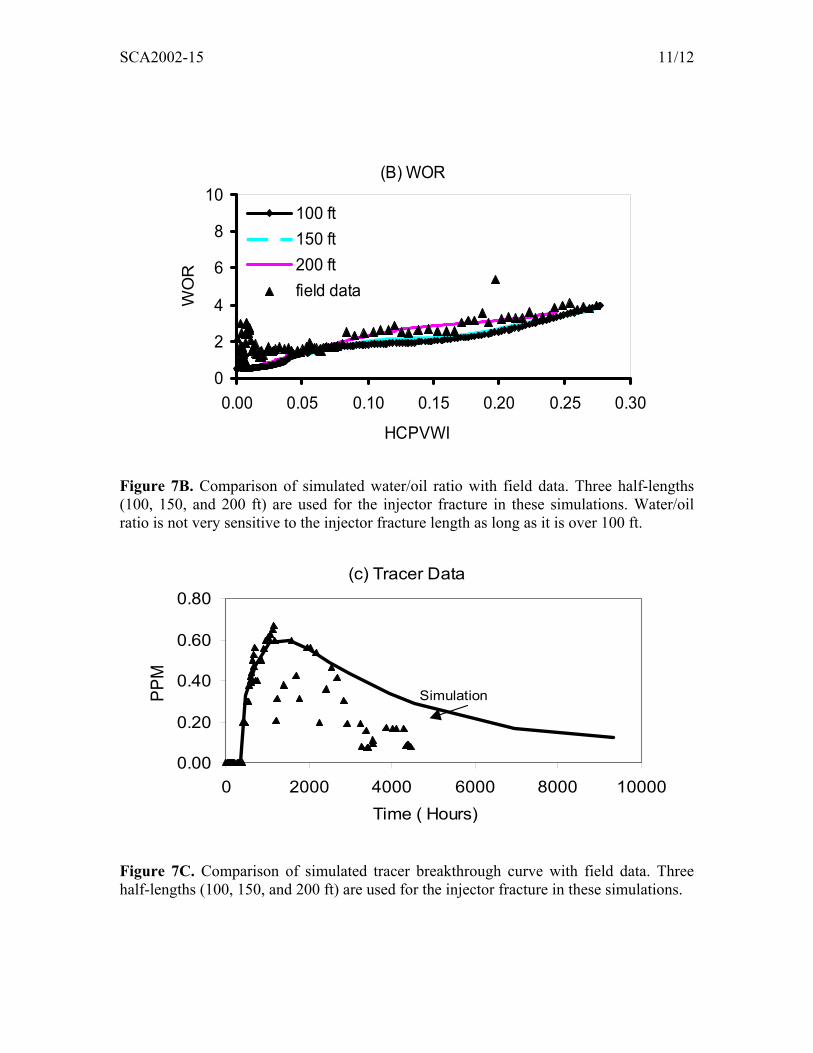
Figure 7B. Comparison of simulated water/oil ratio with field data. Three half-lengths (100, 150, and 200 ft) are used for the injector fracture in these simulations. Water/oil ratio is not very sensitive to the injector fracture length as long as it is over 100 ft.
(c) Tracer Data
0.00
0.20
0.40
0.60
0.80
0 2000 4000 6000 8000 10000Time ( Hours)
PPM
Simulation
Figure 7C. Comparison of simulated tracer breakthrough curve with field data. Three half-lengths (100, 150, and 200 ft) are used for the injector fracture in these simulations.
SCA2002-15 12/12
-50-40-30-20-100
1020304050
40 50 60 70 80 90 100
Water Saturation % PV
Cap
illar
y Pr
essu
re (p
si)
0
0.2
0.40.6
0.8
1
0 5 10 15
Time (days)
R/R
m %
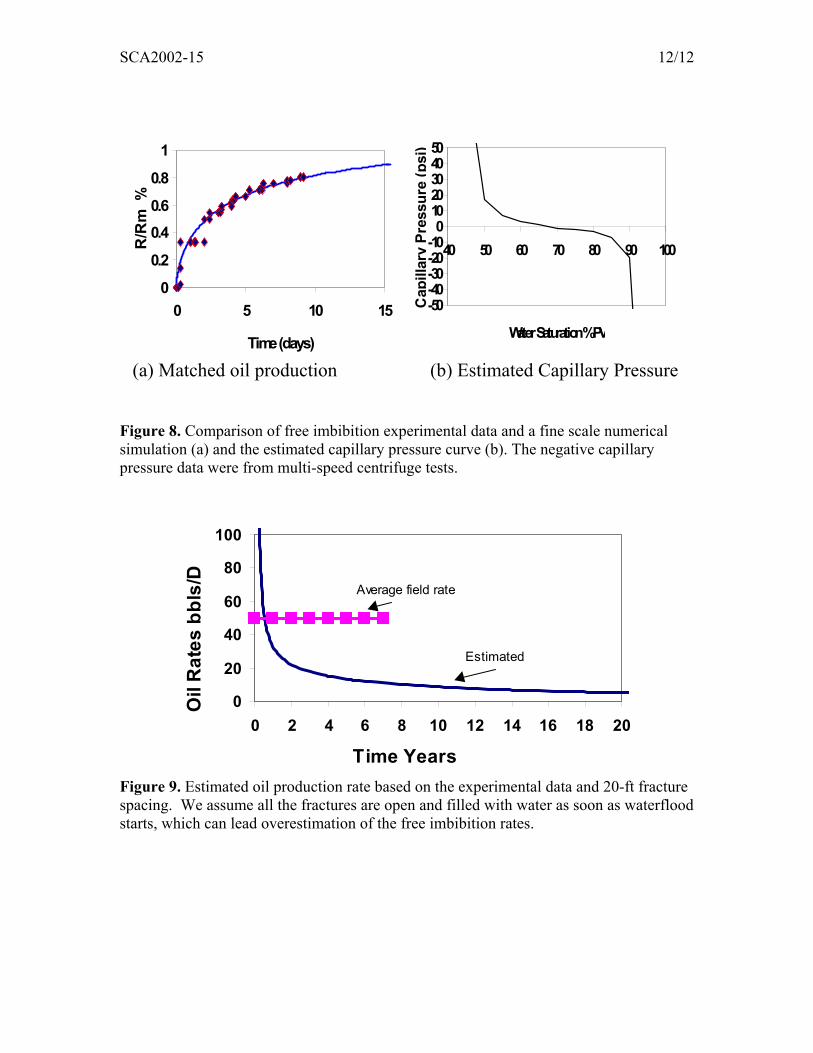
(a) Matched oil production (b) Estimated Capillary Pressure Figure 8. Comparison of free imbibition experimental data and a fine scale numerical simulation (a) and the estimated capillary pressure curve (b). The negative capillary pressure data were from multi-speed centrifuge tests.
0
20
40
60
80
100
0 2 4 6 8 10 12 14 16 18 20
Time Years
Oil
Rat
es b
bls/
D
Average field rate
Estimated
Figure 9. Estimated oil production rate based on the experimental data and 20-ft fracture spacing. We assume all the fractures are open and filled with water as soon as waterflood starts, which can lead overestimation of the free imbibition rates.


![Linear Displacement Effficiency_In waterflooding [Compatibility Mode]](https://static.documents.pub/doc/80x56/551c750b49795911568b4724/linear-displacement-effficiencyin-waterflooding-compatibility-mode.jpg)


