26
NH Department of Educatio n - 8/25/06 (version 9) 1 Understanding the New AYP Tim Kurtz, NH DoE 271-3846 [email protected] Deb Wiswell, NHDoE 271-3828, [email protected]
| Date post: | 31-Dec-2015 |
| Category: |
Documents |
| Upload: | wanda-barry |
| View: | 34 times |
| Download: | 0 times |

NH Department of Education - 8/25/06 (version 9)
1
Understanding the New AYPTim Kurtz, NH DoE
271-3846 [email protected] Wiswell, NHDoE
271-3828, [email protected]

NH Department of Education - 8/25/06 (version 9)
2
2006 AYP Results(impacts school year 2006-2007)
AYP Definition
Grades Testing Data with dates Report Issued
School
District
State
New definition
Elementary and Middle Grades
Gr. 3-8 NECAP (Oct 2005)
Gr. 2-7 NH-Alt (2004-2005)
Aug. 28
2006
10:00 AM
District Old definition
High School Gr. 10 NHEIAP (May 2005)
Gr. 10 NH-Alt (2004-2005)
Aug. 28
2006 10:00 AM
School
State
Old definition
High School Gr. 10 NHEIAP (May 2006)
Gr. 10 NH-Alt (2005-2006)
Aug. 28
2006 10:00 AM

NH Department of Education - 8/25/06 (version 9)
3
Basic AYP Decisions
• Calculate “Other Indicator” for the school
• Calculate Participation rate for the school and each subgroup
• Calculate Performance for the school and each subgroup– Calculate performance– If not OK, then check confidence interval– If still not OK, then check safe harbor

NH Department of Education - 8/25/06 (version 9)
4
Old/New AYP ComparisonOld Definition New Definition
Participation 95% (assigned to school that gave the test)
No change (note that NECAP and NH-Alt were administered in different years)
Performance
Basic calc.
Percent “Basic or above” Index – full credit for levels 3 and 4, partial credit for levels 1 and 2
Performance Assigned to school where student took the test
Assigned to school where student was taught the tested material
AMO (Annual Measurable Objectives)
Starting points based on May 2002 NHEIAP, three year intervals to 100%
Starting points based on October 2005 NECAP, two year intervals to 100%
Confidence Interval
99% CI based on Binomial distribution (AMO, size)
99% CI based on average within school variance (AMO, size)
Safe Harbor 10% reduction in percent of students at Novice
Equi-percentile proxy this year for 10% – in addition, “other indicator” will be evaluated when safe harbor is calculated
Cell Size
Performance
11 per group 11 per group

NH Department of Education - 8/25/06 (version 9)
5
Old/New AYP ComparisonOld Definition New Definition
Other Indicator 90% Attendance (E&M Schools)
75% Graduation rate (HS)
Same, but now attendance rate based on EOY (End Of Year) district submissions
Withdrew after Oct 2 n/a Excused from testing for affected content areas (must be coded on SRB)
ELL and in the US less than 10 months
Counted as participating in reading even if they didn’t.
Not included in performance for reading or math.
No change (must be coded on Student Response Booklet - SRB)
Medical Emergencies
n/a Excused from testing for affected content areas (must be state approved)
Enrolled after Oct 2 Not included in any way same
Placement w| Private Providers
Affects only state report Same (for now…)
Out-of-Level Testing n/a Not allowed

NH Department of Education - 8/25/06 (version 9)
6
Grades 3-8 NECAPAchievement Levels
NECAP Cut points• Commissioners from VT, RI, and NH adopted cut points on January 20• Proficiency at the student level includes performance at achievement levels 3 and 4.
Achievement Levels: • Level 1: Substantially Below Proficient• Level 2: Partially Proficient• Level 3: Proficient• Level 4: Proficient with Distinction
Scaled Scores will be reported as a 3-digit number where the first digit is the grade level and the other part will be a score 00 to 80 (reported as whole numbers at the student level). X40 is the reported cut point for Proficient.
Grade 3: 300-380Grade 4: 400-480Grade 5: 500-580Grade 6: 600-680Grade 7: 700-780Grade 8: 800-880

NH Department of Education - 8/25/06 (version 9)
7
New AYP Definition – some details
An External AYP Task Force met to make recommendations to the Department. After review by the Internal AYP Task Force, we have arrived at the following decisions:– Racial categories (no change)
• Defined by BOY (Beginning of Year) submissions
– Other Indicator (no change)• Attendance Rate (90% or improvement over previous year)• Calculated from EOY submissions
– Participation assigned to testing school– Performance assigned to teaching school– Full Academic Year (FAY) for performance calculations
• In the future, October 1 of teaching year• 310 half days of enrollment is the proxy this year

NH Department of Education - 8/25/06 (version 9)
8
New AYP Definition: Minimum n(minimum number of students in group required in order to
perform calculation)
• 95% Participation rate: 40 for each group within testing grades in school or district
• 75% Graduation rate: 40 within school or district• 90% Attendance rate: 40 within school or district
– Includes all grades 1-8 in the school or district
• Performance targets:11 for each group within testing grades in school or district
NH Department of Education - 8/25/06 (version 9)
9
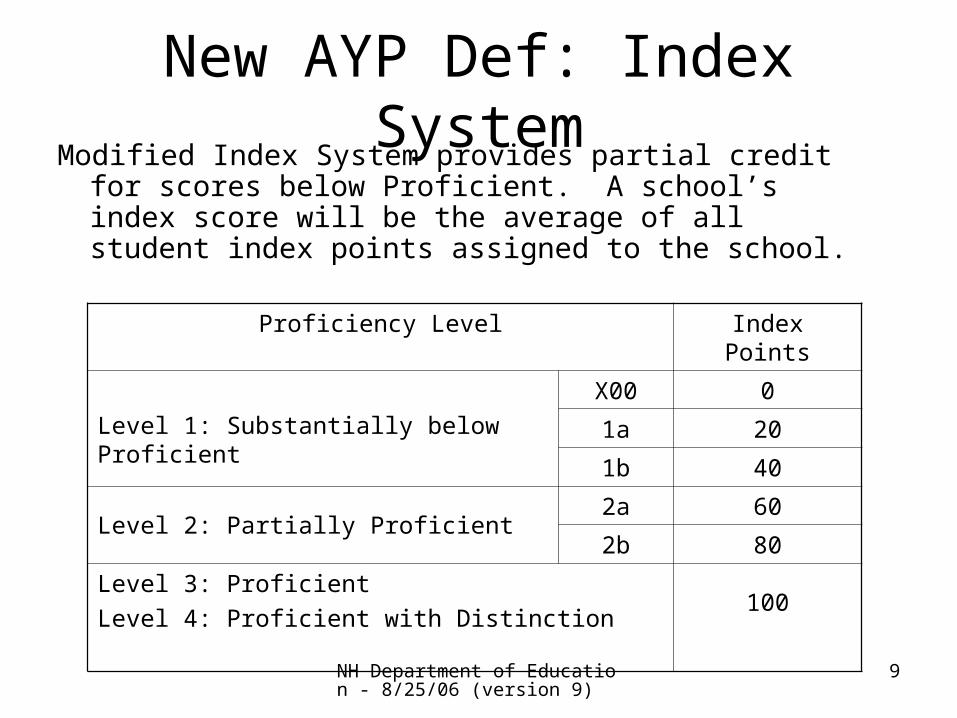
New AYP Def: Index SystemModified Index System provides partial credit for scores
below Proficient. A school’s index score will be the average of all student index points assigned to the school.
Proficiency Level Index Points
Level 1: Substantially below Proficient
X00 0
1a 20
1b 40
Level 2: Partially Proficient2a 60
2b 80
Level 3: Proficient
Level 4: Proficient with Distinction100

NH Department of Education - 8/25/06 (version 9)
10
Scaled Scores for each IndexNECAP
Reading
0 1a 1b 2a 2b 3 and 4
300 301 to 321 322 to 330 331 to 335 336 to 339 340 to 380
400 401 to 421 422 to 430 431 to 435 436 to 439 440 to 480
500 501 to 519 520 to 529 530 to 534 535 to 539 540 to 580
600 601 to 617 618 to 628 629 to 634 635 to 639 640 to 680
700 701 to 717 718 to 728 729 to 734 735 to 739 740 to 780
800 801 to 815 816 to 827 828 to 833 834 to 839 840 to 880
Mathematics
0 1a 1b 2a 2b 3 and 4
300 301 to 323 324 to 331 332 to 335 336 to 339 340 to 380
400 401 to 421 422 to 430 431 to 435 436 to 439 440 to 480
500 501 to 525 526 to 532 533 to 536 537 to 539 540 to 580
600 601 to 625 626 to 632 633 to 636 637 to 639 640 to 680
700 701 to 727 728 to 733 734 to 736 737 to 739 740 to 780
800 801 to 827 828 to 833 834 to 836 837 to 839 840 to 880

NH Department of Education - 8/25/06 (version 9)
11
Raw Score to Performance IndexConversion table for NH-Alt
* The lowest score any scoreable portfolio can earn is 13 raw score points.
** A raw score of 0 is only possible if the portfolio submitted was judged to be unscoreable by two trained and independent scorers.
Portfolio Raw Score Points Earned
Proficiency Level Performance Index Level
Performance Index Points Assigned
47-52 Proficient with Distinction 4 100
38-46 Proficient 3 100
34-37 Partially Proficient 2b 80
29-33 Partially Proficient 2a 60
21-28 Substantially Below Proficient 1b 40
13*-20 Substantially Below Proficient 1a 20
0** Un-scoreable (SBP) 0 0

NH Department of Education - 8/25/06 (version 9)
12
New AYP Def: Starting Points
Starting Points: For each content area separately, create a new baseline via the 20% method outlined in NCLB– Determine index for each school – Rank schools by each index– Identify at “20th percentile” school
“20th percentile” school: the school where 20% of the students in the whole list attend that school or a school with a lower index.
– That school’s index is the starting point
Starting points: Reading 82, Mathematics 76

NH Department of Education - 8/25/06 (version 9)
13
New AYP Def: AMOs
Annual Measurable Objectives
2 year intervals, equally spaced to 100Grades 3-8 Index
ELA Mathematics
Starting Point (2005-2006) 82 76
2006 – 2007 82 76
2007 – 2008 86 82
2008 – 2009 86 82
2009 – 2010 91 88
2010 – 2011 91 88
2011 – 2012 95 94
2012 – 2013 95 94
2013 – 2014 100 100

NH Department of Education - 8/25/06 (version 9)
14
An Index Example: Two schoolsTwo schools, both with 180 students tested and 61.1% of
their students scoring proficient or better in reading.READING Maple Street CS Pine Street MS
Level points # of students
total # of students
total
X00 0 30 0 5 0
Level 1a 20 20 400 5 100
Level 1b 40 10 400 10 400
Level 2a 60 5 300 20 1200
Level 2b 80 5 400 30 2400
Level 3 100 60 6000 60 6000
Level 4 100 50 5000 50 5000
Sum 180 12500 180 15100
Index 69.4 83.9

NH Department of Education - 8/25/06 (version 9)
15
New AYP Def: Confidence Intervals
1. Calculate the within-school variance for each school.
2. Calculate the average within-school variance for the state.
3. Calculate the standard error for each group
4. Calculate the 99% confidence interval for each group
1)_(
var2
studentindex
schoolstudentschool n
indexmeanindex
schools
school
naverage var
var
groupnaverage
groupSE var
groupgroup SECI *333.2
Where:indexstudent = index score for the student
mean_indexschool = average index score for the school to which the student belongs
nindexstudent= the number of student index scores for the school of interest
nschools = the number of schools, and ngroup = number of students in the group
For each subject separately:
For NHReading: 603.38615Math: 800.72625
The smallest index allowed with the CI is: AMO – CIgroup

NH Department of Education - 8/25/06 (version 9)
16
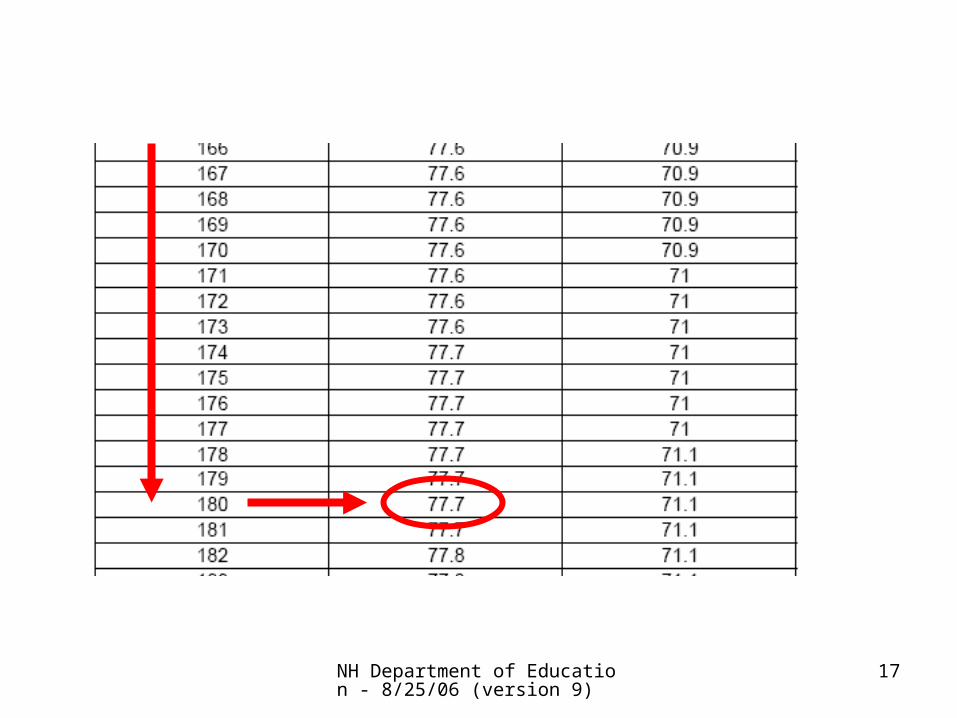
NH Department of Education - 8/25/06 (version 9)
17

NH Department of Education - 8/25/06 (version 9)
18
New AYP Def: Safe Harbor“Equi-percentile” comparison
200 240 300
The general question is: What score on NECAP corresponds to 240 on NHEIAP? Percent of students in Grade 3 & 6 combined score Basic or above in Reading on May 2004 NHEIAP = 73.3% (Math: 77.9%)
X00 X80X??
Answer: 73.3% of students in Grades 3-8 combined score at or above X37 in Reading and X34 in Mathematics on Oct. 2005 NECAP

NH Department of Education - 8/25/06 (version 9)
19
Safe Harbor – an example
For reading, the percent of students scoring below 240 on the May 2004 NHEIAP will be compared to the percent of students scoring below X37 on the October 2005 NECAP.
May 2004 NHEIAP October 2005 NECAP SH Goal
(’04 % below) x
(.90)
Safe Harbor?
Is (‘05 % below)
< or =
(SH Goal)?
#
Tested
#
< 240
‘04
% below
#
Tested
#
< X37
‘05
% below
Park Ave. ES
200 160 80 500 380 76 80 x .9
= 72
Is 76 < 72
No
Gould School
100 70 70 400 250 62.5 70 x .9
= 63
Is 62.5 < 63
Yes

NH Department of Education - 8/25/06 (version 9)
20

NH Department of Education - 8/25/06 (version 9)
21
NH Department of Education - 8/25/06 (version 9)
22

NH Department of Education - 8/25/06 (version 9)
23
Special Note on Data
• Reports based on student demographic and program participation data reported by districts– EOY (End of Year) files– BOY (Beginning of Year) files– SPEDIS, ESL, F&R systems
• Known Issues– SPEDIS /SASID Match– FAY (Full Academic Year) – see next page
• Review AYP Reports carefully– Check FAY– Check Educational Disability

NH Department of Education - 8/25/06 (version 9)
24
Schools with Known FAY issuesReports for these schools and for their districts are based on assuming all student
included these schools’ EOY files were enrolled for a full academic year. In fact, not all students in these schools were enrolled for a full academic year.
A. Crosby Kennett Middle SchoolEpping Middle SchoolHenry Wilson Memorial SchoolEdward Fenn SchoolCarpenter Elementary SchoolCrescent Lake SchoolEffingham Elementary SchoolKingswood Regional Middle SchoolNew Durham Elementary SchoolOssipee Central SchoolHaverhill Cooperative Middle School
Woodsville Elementary SchoolMemorial Middle SchoolHanover Street SchoolLebanon Junior High SchoolMt. Lebanon SchoolSacred Heart Public SchoolSchool Street SchoolSeminary Hill SchoolMcDonough SchoolNew Boston Central SchoolIber Holmes Gove Middle SchoolLamprey River Elementary School

NH Department of Education - 8/25/06 (version 9)
25
AYP Results and Resources
• www.ed.state.nh.us– AYP Reports at grades 3-8– AYP Data Explained– AYP Look-up Table Explained– AYP Lookup Table (pdf and Excel formats)– Csv file of all results– Understanding the New AYP (ppt)– Separate HS District Reports (old AYP def)

NH Department of Education - 8/25/06 (version 9)
26
AYP – Work for Next year• Growth:
– Measures of Growth at the student level to provide support for the Commissioner’s Follow the Child initiative
– NH DoE submitted a letter of interest to USED February 17– Taskforce met on February 22, March 28, April 18, May 9, Aug. 22– NH DoE intends to submit a proposal to USED by November 1, 2006
• Out of District Students in Private Placements– How to include students placed in out-of-district private placements?
• Writing and Science– Neither Writing nor Science is scheduled to be a part of AYP at this time


