Understanding the Retail Business Potential of Inner Cities
Stephan Weiler,
Jesse Silverstein,
Kace Chalmers,
Erin Lacey,
William Rogers,
and
Benjamin Widner
Inner city areas are often significantly “under-stored” (Loukaitou-Sideris 2000), with
inadequate opportunities for residents to shop near their homes. More residents are tran-
sit dependent in inner cities than in the general metro area, making them even more con-
strained to local choices. But which types of establishments are needed in which
locations? Given their isolation from the economic mainstream, marginalized communi-
ties may be the least able to provide information regarding development possibilities. Yet
they would also be likely to benefit substantially from such knowledge, given that inner
city markets are the focus of less attention than those of economically successful
communities.
This paper develops methods to bridge this informational gap. Such gaps produce
particularly regressive forms of market failure, where economic isolation and stagnation
reinforce each other. Business opportunities are likely to exist in the inner city, but pri-
vate capital’s focus needs to be reoriented to such possibilities. Public entities may help
more by analyzing and providing information than by organizing and implementing
top-down programs. Universities may be particularly well suited to bridging informa-
tional gaps (Weiler 2000a). In that spirit, this study represents a further effort in con-
1075
JOURNAL OF ECONOMIC ISSUES
Vol. XXXVII No. 4 December 2003
Stephan Weiler, William Rogers, and Benjamin Widner are in the Department of Economics at Colorado State University,
USA. Kace Chalmers is at Bowling Green State University, and Erin Lacey is an affordable housing analyst in Santa Rosa,
California. Jesse Silverstein is with Development Research Partners. The team gratefully acknowledges the collaboration of
the Denver Mayor’s Office as well as the financial support of the Economic Development Administration through Grant
#05-87-03365.
Jei
© 2003, Journal of Economic Issues
structing a new form of public-private partnership, where each party concentrates on its
relative advantage. Under this scenario, publicly supported actors analyze and dissemi-
nate promising economic information, while private actors construct and manage the
resultant entrepreneurial efforts.
Retail sales gaps have been found to be significant for a number of cities. Boston,
New York City, Miami, Chicago, Atlanta, Oakland, Baltimore, and Memphis have been
examined closely (BCC and ICIC 1998; Porter 1997; and REDC 1998). The U.S.
Department of Housing and Urban Development (HUD) published a report estimating
retail sales gaps for dozens of cities across the nation (HUD 1999), which highlights
many substantial retail gaps in inner city areas. However, total dollar sales gaps do not
provide important details about specific shopping needs that go unmet, such as the lack
of grocery stores. Inner city areas can be large and often need to be understood as sepa-
rate market areas. Finally, most studies have been done with proprietary data and analyt-
ical methods, which makes standardized comparisons virtually impossible. Given these
concerns, municipalities need standardized methods to address specific retail needs by
geographic area.
This paper asserts that missing information is a key element hindering economic
development in inner city areas and sets forth a replicable method to provide such infor-
mation on potential retail business opportunities in such areas. The key element of this
method is a set of econometric techniques that can be applied to publicly available data
to estimate retail sales gaps using Denver, Colorado, as a case study. The technique is
equally applicable to more rural areas facing similar gaps, which suggest similar opportu-
nities. While the issue of missing information and resulting methodologies are the
major scholarly contributions of this paper, the case study of inner-city areas in Denver
itself suggests numerous retail gaps that present the practical potential for private capital
to leverage socially beneficial entrepreneurship. Objective clarification of business
opportunities is likely to be especially useful for resource-constrained potential local
entrepreneurs and their small-scale shops, who can use such information to sharpen
business plans and support financing applications.
The next section evaluates previous research in the area of inner city gaps. The third
section considers informational barriers to entry in inner city markets. A detailed
description of our methodology is presented in the fourth section.
The Overlooked Promise of Inner Cities
When many retailers consider locating in the inner city, they think of the draw-
backs and decide to move elsewhere. Companies’ perceptions of the inner city are that
crime is too high, local governments are obstacles rather than facilitators, and good
employees are difficult to find, to name a few of the most common problems (BCC and
ICIC 1998). The negative aspects of the inner city, conventional wisdom suggests, are
greater than the positives. This thinking is shortsighted at best. Inner city areas offer
1076 Stephan Weiler et al.
numerous benefits that may outweigh the negatives on which retailers initially focus
(Porter 1997). The inner city may in fact be an unusually promising place for business
development.
To satisfy an inner city’s retail shopping needs, a variety of stores may be needed. In
some cases, local entrepreneurs with detailed, personal knowledge of the target market
can successfully fill niche markets. Their stores may be small to mid-sized, depending on
the needs of the community and their accessibility to start-up capital. Other times, exist-
ing stores will be able to fulfill local demand by expanding their operations on a scale
determined by community needs. In extremely under-stored areas, local demand may
warrant the introduction of a large retail establishment. Under each scenario, specific
information about the size and type of retail establishments (food, clothing, household
goods, or department store) that are lacking can aid entrepreneurs and established busi-
ness owners in securing funding for retail development.
Inner city households have under-appreciated buying power. Residents’ low aver-
age household incomes tend to deter potential retail firms. However, this number is
misleading, since households with low averages often spend more than they apparently
earn. This ratio of household expenditures to reported income is very large (around 4)
for the poorest households, then declines as income increases to a ratio of approxi-
mately .6 for the most affluent households (REDC 1997, 1998). Even though their
incomes are just 54 percent that of other urban residents, inner city households spend
62 percent as much in total, 89 percent as much on food at home, and 67 percent as
much on clothing as other urban residents (HUD 1999). Inner city spending on retail is
greatly underestimated if only comparative household average incomes are considered
rather than expenditures.
Common methods of reporting income—medians or averages—thus distort the mar-
ket potential of a community and create misleading information about inner city neigh-
borhoods, particularly given their relative density. The informal economy tends to be
particularly important in struggling rural and urban populations, which can lead to sig-
nificant undercounting of actual household income (Weiler 1997; Eisner 1988). Part of
this is due to the estimated $1 trillion—more than 10 percent of current GDP—that goes
unrecorded in today’s economy. Legal activities such as gardening, childcare, house-
keeping, tips, and street vending represent most of this income, although illegal sources
contribute as well (BCC and ICIC 1998). In addition, temporary unemployment, sav-
ings depletion, student loans, and self-employment income losses can give residents
with low incomes higher purchasing power than their earnings indicate (REDC 1998).
Population density per square mile makes inner city markets especially appealing.
Even though median household incomes may be low, the density of suburban purchas-
ing power pales when compared with inner city purchasing power per unit area. For
example, a 3.5-square-mile area of inner city Memphis, Tennessee, has the same retail
spending as the 700 square miles of a nearby urbanized Kentucky county (REDC 1998).
As suburban markets become saturated with retail stores and profits per square foot
decrease, the higher untapped profits in the “under-stored” inner city should become
Understanding the Retail Business Potential of Inner Cities 1077
more attractive to retailers, given proper information on prospects. Store after store
bears out this hypothesis, with many chain stores reporting their highest earnings from
inner city locations (Taneja 1998). The opportunities presented by inner city markets
are becoming simply too large to ignore.
Even practiced estimates of consumer demand within the inner city tend to under-
estimate actual sales. For instance, after seventeen years of refining their methodology
for projecting store sales, one successful fast food company reported that for fully half of
their stores, the average underestimate of sales ranged from 20 percent to 25 percent
(Okoruwa et al. 1994). This finding is mirrored in a grocery store chain’s claim that they
must generally add 20 percent to presumably reputable estimates of food expenditures
by inner city residents. Currently, firms gain experiential knowledge like this only
through time, trial, and error (HUD 1999). Better initial information on retail pros-
pects is clearly needed, which still is likely to result in conservative assessments of market
potential.
Another factor that determines the demand for retail establishments close to inner
city neighborhoods is the percentage of residents who are transit dependent. For the
United States as a whole, some 90 percent of people commute to work by car. The
remaining 10 percent are divided almost equally between those who use transit and
those who work at home or walk to work (Mills and Lubuge 1997). However, inner city
residents are more likely to use transit, since as many as 30 percent or even 50 percent of
them may not own cars (Loukaitou-Sideris 2000; REDC (S. Memphis) 1998). Shopping
far from home is therefore more difficult for many inner city residents, particularly for
items needed regularly such as food. They will often use available retailers, such as drug
stores or smaller grocery stores, to fulfill shopping needs (BCC and ICIC 1998). This sit-
uation is less than ideal in terms of price and merchandise options for the inner city cus-
tomer and represents yet another indicator of retail gaps in the inner city.
Given these promising features, what feeds businesses’ fears about setting up shop
in the inner city? Of course, there is the problem of unfamiliarity with the areas by many
retail firms (Forester 2000). Niche markets presented by inner city neighborhoods are
hard for outsiders to analyze, although this situation underlines the advantages of local
participation. Proper information on markets is critically important. At the same time,
many communities rely on federal subsidies, grants, and loans, where they must empha-
size their negative attributes instead of their assets if they are to be funded. According to
researchers for the Brookings Institution, “[t]his one-sided picture, in addition to con-
tributing to the isolation and demoralization of inner-city neighborhoods and their resi-
dents, heavily contributes to the business sector’s failure to look at inner-city
neighborhoods as market opportunities” (HUD 1999). While federal aid is necessary
for many communities’ survival, businesses need to have an unbiased sense of inner city
prospects as well.
1078 Stephan Weiler et al.
Missing Links
Two information-related market failures (Weiler 2000a) have hampered inner city
retail development. The first concerns information regarding private returns to invest-
ments in economically marginalized areas. The second form of market failure stems
from the likelihood that social returns significantly outweigh private returns in such
struggling areas. In either of these cases, inner city retail development prospects face
significant hurdles.
Information implies an irreversible sunk cost (Barham, Chavas, and Coomes 1998;
Arrow 1974). Both time and resources are required to assemble and analyze informa-
tion. Business plans, market research, and engineering require large amounts of infor-
mation and are specific to particular areas. Neglected regions may have especially sparse
business-related information precisely due to the lack of business activity in such “thin”
markets. This situation adversely affects retailers’ willingness to bear the costs of gather-
ing information on inner city markets.
While the sunk cost nature of information is true across industries and regions,
inner city markets are riskier. Once the information investment is undertaken,
first-movers still need to test the viability of the enterprise in a marginalized market.
Uncertainty is likely to be especially high in these thin markets, which further reduces
the initial incentive to make information investments. Even success has a downside in
new markets, since free riders may profit from the revelations of the first-mover. How-
ever, if a pioneer fails, he or she fails alone. Game theory analyses show that pioneering
in such areas is thus particularly unattractive (Weiler 2000b). Investor uncertainty, due
to the lack of understanding of such markets, can lead to a self-reinforcing pattern of
market neglect and continued ignorance (Weiler 2000a). Such path dependence in
regional entrepreneurship may partially account for the divergences in regional
economic performances.
However, inner cities are characterized by not only what firms don’t know but also
by what firms think they know. As Michael Porter (1998) has illustrated, the inner city is
an area rife with unrecognized opportunity in four areas: strategic location, integration
with regional clusters, unmet local demand, and human resources. But three common
myths obstruct the latent business opportunities of the inner city: (1) inner city residents
do not want to work and prefer welfare, (2) long-term inner city residents are less pro-
ductive than recent immigrants to the inner city, and (3) some white inner-city busi-
nesses quickly judge entire groups of people using stereotypes. Porter has argued,
however, that the private sector will overcome these myths because the inner city ulti-
mately provides extensive retail markets and advantageous locations for private business
needs.
Porter’s line of reasoning is optimistic but ultimately incomplete because he
ignores the influence of path dependency on people’s actions. While he acknowledges
that inner cities suffer from several disadvantages such as discrimination against inner
city residents and entrepreneurs, high taxes and utility costs, scarce affordable insur-
Understanding the Retail Business Potential of Inner Cities 1079
ance, crime, poorly maintained infrastructure, and burdensome regulations, his pro-
posed solution to these problems is to address only the directly economic influences
such as unneeded regulation and an ineffectively trained labor force. Moreover, Porter
has argued that the perception of the inner city is a result of poor strategies and public
policies; rather than a patchwork of programs tooled to specific areas, he has argued for
“best practices” that can be applied nationwide in every inner city.
Each inner city faces a unique set of institutional problems that cannot be
addressed with a uniform application of “best practices.” The obstacles of crime, gover-
nance, and worker skills are similarly specific to each community and need to be under-
stood and addressed in context. In fact, while these inner city “problems” are seen to be
endemic, the heterogeneity of individual communities implies that such problems tend
to be exaggerated in many cases and can be combated with sufficient community
involvement and non-market networks (BCC and ICIC 1998). In general, the skills
required for retail positions match the skill levels found in inner city youth, while
improved governance and reduced crime are directly related to improved economic
prospects and activity.
The inner city further struggles against such systematic institutional failures as dis-
crimination and racism, as well as the historical legacy of such failures. Miguel deOliver
and Teresa Dawson-Munoz noted that while poverty has a disproportionately higher
incidence for minorities when compared to Anglos, policies which seek to stimulate eco-
nomic development in minority-dominated inner city areas without specifically address-
ing the issue of racial discrimination will be unsuccessful (1996). They traced this failure
to the dilution of “place-based” economic development intended to help the minority
poor. In the poor inner city, Anglos enjoy a higher economic status as well as a higher
incidence of land ownership and business ownership. Therefore, de Oliver and
Dawson-Munoz concluded that “place-not-race” based policies which attempt to inci-
dentally increase well-being for minorities by improving the areas in which minorities
predominantly live “do not take into account the fact that non-Anglo underprivilege has
many other dimensions that are not economic in origin.” If an economic re-develop-
ment plan attempts to be “blind to race” by ignoring the influences of race and discrimi-
nation in the inner city, its results will be questionable.
Therefore, the information set utilized by firms in making their business decisions
is influenced not only by the explicitly economic legacy of these institutional failures,
like economy decay and flight to the suburbs, but also by the cultural and social legacy of
these phenomena, such as lower work skills and lower firm longevity by minority-owned
businesses. By relying on an information set governed by bounded rationality, firms
examining retail opportunities in the inner city can be seen as “intendedly rational, but
only limitedly so” (Williamson 1986). By operating within such an orientation, firms do
pursue profit maximization as their ultimate goal; however, the information set a firm
uses is necessarily constrained by these institutional failures.
1080 Stephan Weiler et al.
For example, the inner city may be strongly defined by the presence of nonmarket
transactions, as described by Karl Polanyi as reciprocity and redistribution, which,
because of their nonmarket orientation, would remain unrecorded in official numbers.
As a process by which a person receives social prominence and reputation, a person
engaging in reciprocity receives nothing in return that can be valued by the market
whereas redistribution occurs when reciprocity evolves from simple gift giving or
income-in-kind transactions between family members or neighbors into commodities
being redistributed on a large scale without market governance (Polanyi 1944). A com-
munity may appear quite thin if only market transactions are used; however, if recipro-
cal and redistributive transactions are included, the same community may be thickly
laden with economic transactions tangled with social and political relationships. As Oli-
ver Williamson (1986) noted, “Thus intended rationality supports a presupposition
that parties to a transaction will seek out and attempt to implement opportunities to
realize efficiency. Respect for limited rationality elicits [a] deeper study of nonstandard
forms of organization.” In this sense, local entrepreneurs armed with more broadly rec-
ognized market information are likely to be especially well placed to take advantage of
the market and non-market structures in such communities.
Not surprisingly, both schools of institutionalism argue against the current mar-
ket-driven methodology for differing reasons. Williamson deftly illustrated markets’
current imperfect information by arguing that economic agents maximize their utility by
using the information, perceptions, and stereotypes available to them and encourages
modeling the resulting equilibria with respect to agents’ bounded informational sets.
Polanyi’s work extends this analysis further by examining ways in which these bounded
information sets can be extended by including nonmarket transactions. Both schools of
institutionalist thought are helpful in understanding the dearth of information regard-
ing inner city retail markets. As both Polanyi and Williamson noted, the only way to cor-
rect such an asymmetric information distribution is to undertake specific, detailed
research of these nonstandard (nonmarket) institutions. However, as illustrated earlier,
such detailed research is a sunk cost whose benefits cannot be limited to the
undertaking firm.
Furthermore, when private returns to local investment are unclear, information on
private projects take on significant public good characteristics, resulting in the first form
of market failure. In order to generate sufficient entrepreneurial interest, information
on inner city markets needs to be non-excludably accessed and non-rivalrously con-
sumed in order to bring maximum benefits to the community through private entrepre-
neurship. The problem with such informational public goods is that no private agent
has an incentive to invest in its acquisition and analysis (Stigler 1961; Zeckhauser 1996;
Bartik 1990). Individual firms will be even less willing to pay for informational invest-
ment in higher-risk, thin markets, which are precisely those areas where information is
scarce. Public provision and analysis of such information in struggling areas can be sup-
ported on the grounds of efficiency as well as equity, sparking both profitable and
welfare-enhancing economic activity by private entrepreneurs.
Understanding the Retail Business Potential of Inner Cities 1081
The second form of market failure occurs when social returns diverge from private
returns. Obviously, private actors will only make investments when private returns out-
weigh private costs at a level above current alternative market opportunities. Seemingly
unattractive investments may in fact yield high social rates of return when the total
impact on a local economy is calculated. Retail jobs create new sources of income, as
well as providing local spending possibilities to replace leakages to outside areas
(Dymski 2001). These dual effects are likely to produce both new and multiplied eco-
nomic activity in struggling areas. Local shops and shopping can also provide the con-
text for the creation of a new web of neighborhood interactions and social ties. While
the value of such networks is not easily quantifiable, they can be crucial to the lon-
ger-term sustainability of the community (Carroll and Stanfield 2001).
Yet the quantifiable benefits themselves are likely to be sufficient to motivate new
inner city retail activity. Spillover benefits to the local treasury and the community at
large from successful pioneering private entrepreneurs may be widely shared, particu-
larly in the case of previously lagging areas. Revitalized downtown areas offer a particu-
larly compelling example of such spillovers (Weiler 2000b). Such social return
premiums are particularly likely in local economies with slack resources, yet informa-
tional barriers to such economic activity are correspondingly higher in these
marginalized communities. Thus information about private and social returns becomes
crucial to developing socially desirable economic activity.
Here, information analysis is again critical, this time to motivate public support of
otherwise marginal private investments that would substantially enhance social welfare.
Local government’s assistance may be especially important for projects with sizable fixed
costs, which can similarly be revealed by information analysis. Information itself is a sub-
stantial fixed cost that must be borne to determine whether entrepreneurship is even
viable. Business is driven by bottom line profits; higher fixed costs reduce such profits
and thus reduce investor interest, especially when combined with uncertainty. The lack
of information about private and social benefits of specific projects may perpetuate
investor reluctance in already marginalized areas, cementing such regions’ economic
vulnerability. Yet even if public resources are dedicated to such informational efforts,
there are few alternatives to expensive consultants and their proprietary findings are not
easily comparable to alternative opportunities, which can reinforce reluctance by inves-
tors. This paper thus proposes a method using publicly available data to illuminate
neglected business niches in the inner city.
Methodology for Analyzing Retail Gaps in Denver
To assess retail opportunities for inner city Denver, areas and sectors first needed to
be targeted. Social and economic indicators were evaluated to identify distressed areas.
Breakdowns of the Standard Industrial Classification (SIC) retail category were then
developed at different levels of detail to define focal sectors. Once these questions were
1082 Stephan Weiler et al.
resolved, household demand for focal retail products could be estimated, which could
then be compared with retail supply estimates of the current provision of such items.
Subtracting supply from demand gave rise to surpluses or gaps, showing exporting and
importing retail patterns for inner city areas respectively. Cross-shopping between areas
is likely, but such studies rely on the fact that closer shopping options are better for an
area’s residents than more distant ones, ceteris paribus. The methods are detailed
below, and then analyzed as a whole.
1992 was used as a base year, since a full Census of Retail Trade could be matched
with County Business Pattern establishment size class counts for that year. Given these
benchmarks, 1997 was chosen as the focal year possible for analysis, since both establish-
ment count by zip code (supply) and consumer expenditure patterns (demand) were
fully documented.1 Anecdotal knowledge of new establishments (supply) and new
households (demand) can easily be incorporated into the estimates for more current
assessments.
Targeting Distressed Areas and Retail Sectors
Distressed Areas. Two methods of identification were used to recognize distressed areas of
Denver. First, social indicators were analyzed at the census tract level. Each census tract
within the city was evaluated for its housing, crime, high-risk births, public assistance,
and educational characteristics. Weighted percentages for each indicator were then cre-
ated by the city and summed to a composite index that reflected the relative distress of
each census tract. Economic characteristics were then evaluated. A ranking system was
developed to assess poverty, unemployment, and household income measures. Both
social and economic rankings were combined to determine a final list of targeted inner
city census tracts.
However, standard private business analysis is done at the zip code level; the pri-
mary audience for the findings is potential entrepreneurs. The most up-to-date govern-
ment statistics on retail establishment activity are also based on zip code level data.
Census tracts alone are also likely to be too small to sustain retail development by them-
selves. Zip codes therefore became the geographic basis for analysis.
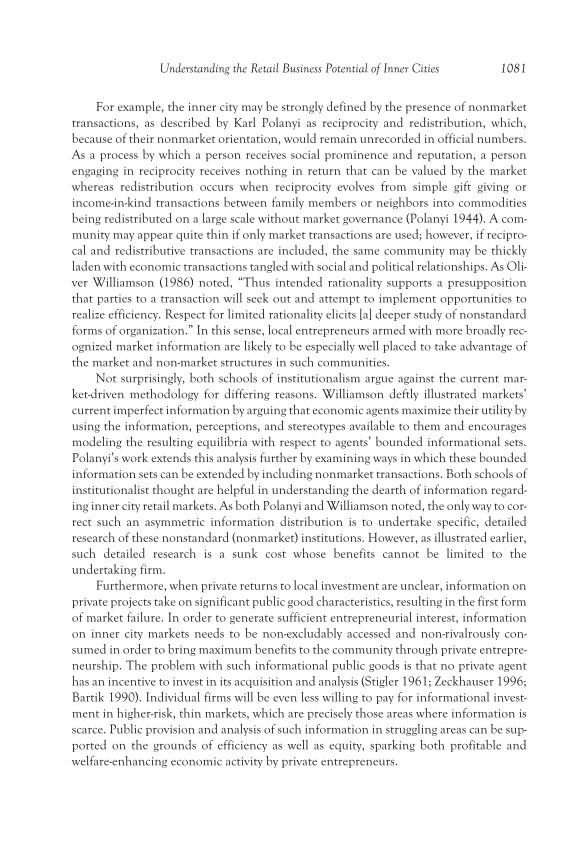
Each target census tract was matched to the zip code with which it fit most closely.
Because each zip code incorporates a number of census tracts representing a wide variety
of social and economic characteristics, there may be considerable heterogeneity within
each zip code’s composition. Table 1 illustrates the economic characteristics for each
target zip code identified through this process, along with characteristics for Denver as a
whole; all data are drawn from the 1990 census. Even given the noted heterogeneity, all
but one of the zips have above average unemployment rate and poverty rate categories
when compared with the rest of Denver. Moreover, unemployment among sixteen- to
nineteen-year-olds is well above 15 percent in all but one of the zip codes. This repre-
sents a large young worker base for many retail type jobs, suggesting a ready supply of
labor for new establishments.
Understanding the Retail Business Potential of Inner Cities 1083
Tab
le1
.So
cio
eco
no
mic
Ind
icat
ors
for
Tar
get
Zip
Co
des
ZIP
Ed
uca
tio
n
(<9
toH
S)
Ed
uca
tio
n
(HS
)
Ed
uca
tio
n
(co
lleg
e+
)
Un
emp
loym
ent
(16
–1
9)
Un
emp
loym
ent
(16
+)
Med
ian
Ho
use
ho
ld
Inco
me
19
89
Po
vert
y%
(all
ages
)
Po
vert
y%
(18
–3
4)
80
20
32
8.4
%1
5.3
%5
2.8
%1
6.4
%8
.4%
16
,06
72
5.5
%2
7.0
%
80
20
44
0.6
%1
5.2
%1
6.5
%2
7.4
%1
1.2
%1
5,2
16
36
.8%
34
.7%
80
20
54
3.6
%1
6.2
%1
9.9
%3
8.2
%1
5.7
%1
3,3
27
40
.6%
38
.6%
80
20
73
1.9
%1
8.6
%3
4.2
%2
2.6
%9
.3%
29
,57
11
5.8
%1
6.1
%
80
21
14
1.1
%1
5.8
%1
9.9
%3
1.8
%9
.6%
19
,22
32
6.9
%2
6.2
%
80
21
64
4.7
%1
3.0
%9
.9%
17
.0%
13
.2%
17
,21
03
2.9
%3
5.1
%
80
21
82
2.6
%1
2.5
%5
5.7
%1
1.9
%4
.5%
19
,50
21
9.3
%1
9.5
%
80
21
94
3.3
%2
1.6
%1
9.3
%3
2.9
%9
.3%
23
,34
51
9.7
%2
1.3
%
80
22
34
3.8
%2
0.9
%1
8.3
%2
2.7
%9
.9%
19
,28
92
4.9
%2
6.1
%
8–
31
Den
ver
30
.5%
16
.2%
38
.2%
23
.6%
6.8
%2
5,1
06
17
.1%
18
.6%
Target Retail Sectors. For the years of study, the industrial census classifies establishments
by using Standard Industrial Classification (SIC) Major Groups. Our area of focus was
retail trade, classified as SIC 52, which includes SIC groups 52–59. Included in this
range are establishments engaged in both retailing merchandise and rendering services
associated to the sale of merchandise. In general, we were interested in the area of retail
involved in selling to the general public and generating a high volume of walk-in custom-
ers. As a general indicator of retail needs, we first assessed needs for retail trade as a
whole.
Yet potential entrepreneurs will want to know the relative promise in particular
branches of the retail sector. Our first area of focus was SIC Major Group 54 (Food
Stores). This group is primarily involved in selling food for home preparation and con-
sumption. These stores are characterized by a regular need for their products and the
lack of alternative sources for such necessities. The next retail branch we explored was
SIC Major Group 56 (Apparel and Accessory stores). These establishments are engaged
in the sale of clothing and related items for personal use. Stores that meet the criteria for
department stores are not included in this sector, as they are classified as SIC 531 or
539. The final retailer is SIC Major Group 57 (Home Furniture, Furnishings, and
Equipment stores). This group is engaged in the sales of home furnishing items such as
refrigerators, couches, floor coverings, appliances, furniture, window coverings, and
stoves.
Apparel and home products are considered separately for potential niche markets
but can also be combined to assess the need for department stores. Note that Denver
generally has few department stores, and the target areas have none. Those general mer-
chandise stores that do exist are clustered in a small affluent area in the southeast side of
the city, with the rest being distributed among the suburban malls. In cities with more
department stores, relative sales of apparel and home products from such broad stores
should be added to the narrower classes of shops analyzed in this study.
Inner cities have distinctive retail spending patterns for these target sectors. Food at
home and clothing were given specific mention in HUD’s “State of the Cities, 1999” as
items that were particularly in demand in inner city areas. These categories were reiter-
ated in a PricewaterhouseCoopers/ICIC report and expanded to show higher relative
spending in home furnishings as well. Evaluating only retail sales in total would not cap-
ture expenditures that were of particular importance to the inner city as well as the spe-
cific niche interests of potential entrepreneurs. For a more complete view of unmet
inner city retail opportunities, detailed analyses of food at home, apparel, and home fur-
nishings are therefore considered alongside total retail.
Supply
In order to assess the retail gap in particular areas, the demand expenditure results
need to be compared to estimates of sales supply. However, accurate sales data are espe-
cially difficult to obtain, particularly given data disclosure issues. This paper proposes a
Understanding the Retail Business Potential of Inner Cities 1085
practical method that can extrapolate retail sales from easily accessible establishment
size class count data (e.g., number of establishments with one to four employees, five to
nine employees . . . ). With a sufficient number of observations, the approach can esti-
mate a consistent relationship between establishment size counts and sales. Larger estab-
lishments have more employees and more sales. While estimating sales based on such
size class measures is a simplification of a complex process, the method’s use of public
data and its success in estimation suggest that the approach has broad utility.
Regression analysis is therefore used to estimate the following function:
Sales = f (Establishment Size Class Count).
Establishment size counts are detailed in this analysis as MX1–MX9, which identify
establishment size class by the number of employees:
MX1 = 1–4 MX4 = 20–49 MX7 = 250–499
MX2 = 5–9 MX5 = 50–99 MX8 = 500–999
MX3 = 10–19 MX6 = 100–249 MX9 = 1000+
To determine benchmarks for the supply side of the analysis, the 1992 Economic
Census and 1992 County Business Patterns data for the western region of the United
States were used. Sales figures were obtained from the Economic Census, while estab-
lishment size counts were taken from County Business Patterns. Nearly 400 western
counties were used as the basis for estimating the sales-to-establishment-size-count rela-
tionship. In the initial compilation of the County Business Pattern and Census data, no
self-proprietor businesses were included. These stores produce less than 5 percent of
retail sales but still can be marginally important in evaluating an area’s retail promise.
The Non-Employer Census report was therefore used to include these establishments in
our final data set by adding the proportion of their sales to traditional employer statis-
tics. This allowed compilation of a complete data set with 1992 sales and establishment
size class figures, which could then be related through econometric methods.
Several functional forms were tested. A quadratic model was found to be the most
suitable functional form, with a structure here of
Sales = �s as (EstSizeClassCountS)2 + bs (EstSizeClassCountS) + c
estimated over all the nine establishment size classes, S. This function produces a para-
bolic function with direction, width, and intercepts depending on the parameters a, b,
and c. Quadratic functional forms exhibit diminishing returns to scale when a < 0. As the
establishment size grows, sales increase at a decreasing rate and could in fact decline at
high-count levels. Increasing returns, where a > 0, are possible as well.
1086 Stephan Weiler et al.
The western region’s data were further segmented into MSA and non-MSA areas,
as there are unique properties of retail establishments for metro and non-metro mar-
kets. For example, a retail store in a non-MSA area may supply a broader range of retail
items with fewer employees but be reported as a single SIC category. Therefore, we used
MSA patterns to evaluate the sales-establishment relationship in all categories.
Regressions were then run using the more than 240 remaining western metro coun-
ties to estimate the establishment/sales relationship. Various combinations of establish-
ment size classes (e.g., summing the one to four and five to nine size classes into a one to
nine variable) were explored. In the end, such combinations were not used as they did
not improve the explanatory powers of the model. Each sector was also scrutinized for
dissimilar characteristics between Denver and the western region sample. For instance,
in Denver the food sector (5400) has no establishments in the size classes of 250–499,
500–999, and 1000+. Therefore, counties such as Maricopa County in Arizona needed
to be removed, since Maricopa County has fifteen establishments in the 250–499 size
class. The same process was followed for each two-digit SIC category. Deletions were
made as needed on a two-digit level to each county’s data. If a county’s food category was
mismatched but home furnishings and apparel did match, observations for the food cat-
egory were omitted, but those for home furnishings and apparel were included. These
refined data set thus more closely match Denver’s characteristics.
Multiple regressions were run to test the different data formats, functional forms,
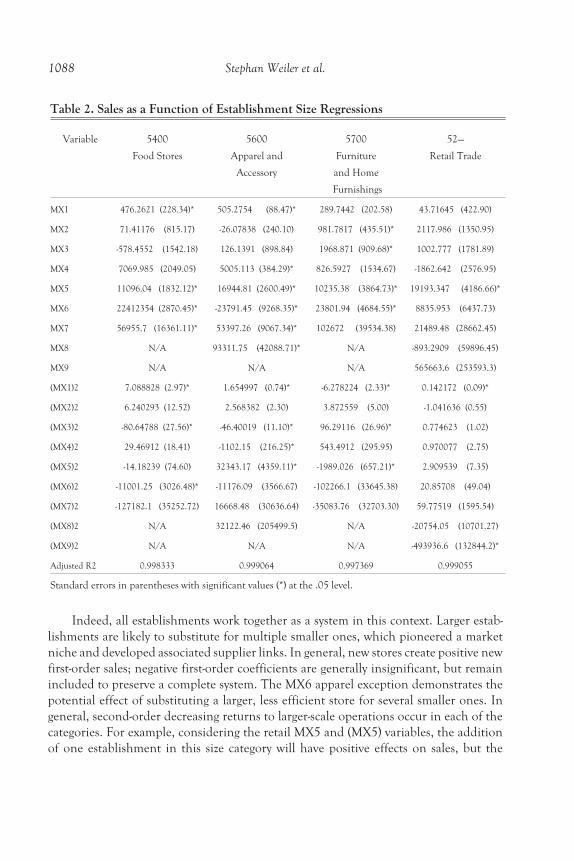
and econometric correction procedures. Table 2 describes the final regression findings;
standard errors are in parentheses. The high adjusted R-squared is a first signal of good-
ness of fit. Furthermore, tests of the method against known 1992 and 1997 results
through census and other local data show estimate errors in the range of 1–2 percent.
Note that variables remained included even if insignificant, since the goal is a full system
with which to estimate sales based on establishment size class counts. In that sense, the
estimation process focuses on systemic prediction rather than maximizing the t-statistics
of any individual coefficient.
Understanding the Retail Business Potential of Inner Cities 1087
Indeed, all establishments work together as a system in this context. Larger estab-
lishments are likely to substitute for multiple smaller ones, which pioneered a market
niche and developed associated supplier links. In general, new stores create positive new
first-order sales; negative first-order coefficients are generally insignificant, but remain
included to preserve a complete system. The MX6 apparel exception demonstrates the
potential effect of substituting a larger, less efficient store for several smaller ones. In
general, second-order decreasing returns to larger-scale operations occur in each of the
categories. For example, considering the retail MX5 and (MX5) variables, the addition
of one establishment in this size category will have positive effects on sales, but the
1088 Stephan Weiler et al.
Table 2. Sales as a Function of Establishment Size Regressions
Variable 5400
Food Stores
5600
Apparel and
Accessory
5700
Furniture
and Home
Furnishings
52—
Retail Trade
MX1 476.2621 (228.34)* 505.2754 (88.47)* 289.7442 (202.58) 43.71645 (422.90)
MX2 71.41176 (815.17) -26.07838 (240.10) 981.7817 (435.51)* 2117.986 (1350.95)
MX3 -578.4552 (1542.18) 126.1391 (898.84) 1968.871 (909.68)* 1002.777 (1781.89)
MX4 7069.985 (2049.05) 5005.113 (384.29)* 826.5927 (1534.67) -1862.642 (2576.95)
MX5 11096.04 (1832.12)* 16944.81 (2600.49)* 10235.38 (3864.73)* 19193.347 (4186.66)*
MX6 22412354 (2870.45)* -23791.45 (9268.35)* 23801.94 (4684.55)* 8835.953 (6437.73)
MX7 56955.7 (16361.11)* 53397.26 (9067.34)* 102672 (39534.38) 21489.48 (28662.45)
MX8 N/A 93311.75 (42088.71)* N/A -893.2909 (59896.45)
MX9 N/A N/A N/A 565663.6 (253593.3)
(MX1)2 7.088828 (2.97)* 1.654997 (0.74)* -6.278224 (2.33)* 0.142172 (0.09)*
(MX2)2 6.240293 (12.52) 2.568382 (2.30) 3.872559 (5.00) -1.041636 (0.55)
(MX3)2 -80.64788 (27.56)* -46.40019 (11.10)* 96.29116 (26.96)* 0.774623 (1.02)
(MX4)2 29.46912 (18.41) -1102.15 (216.25)* 543.4912 (295.95) 0.970077 (2.75)
(MX5)2 -14.18239 (74.60) 32343.17 (4359.11)* -1989.026 (657.21)* 2.909539 (7.35)
(MX6)2 -11001.25 (3026.48)* -11176.09 (3566.67) -102266.1 (33645.38) 20.85708 (49.04)
(MX7)2 -127182.1 (35252.72) 16668.48 (30636.64) -35083.76 (32703.30) 59.77519 (1595.54)
(MX8)2 N/A 32122.46 (205499.5) N/A -20754.05 (10701.27)
(MX9)2 N/A N/A N/A -493936.6 (132844.2)*
Adjusted R2 0.998333 0.999064 0.997369 0.999055
Standard errors in parentheses with significant values (*) at the .05 level.
squared term reduces sales. As establishment size grows, this squared term has a propor-
tionally larger impact on sales, creating the increasingly explicit effects of decreasing
returns. Interestingly, several stores sizes exhibit increasing returns (i.e., a > 0),
suggesting varying scale economies.
Given the establishment size count to sales relationship estimated by the noted
econometric method, one can then simply introduce an area’s establishment size class
characteristics to estimate the level of sales from these establishments. In this case, the
counts available from the 1997 Zip Code Business Pattern data were used to estimate
1997 sales in the target zip codes.
Demand
Retail expenditures can be estimated by using household and income data from the
Bureau of Labor Statistics’ Consumer Expenditure Survey (CES). The annual survey
assesses the specific spending patterns for consumer goods and services across U.S.
regions and among various income levels. By matching an area’s average income figures
with CES reports, retail expenditures for that area can be estimated. As previously dis-
cussed, the fact that the proportion of expenditures to income is so high for
lower-income households is part of the attraction for targeted inner city retail
development.
The demand determination process has three steps: collect income and household
data, adjust the CES to match the characteristics of the city, and finally estimate
demand using CES-based expenditure functions through income classes.
Income and Household Data. The City of Denver shared with the researchers the number
of households and incomes in each zip code for the 1997 focal year, which are generally
available from sources such as CACI. However, some researchers may only have access to
mean or median income data. In such cases, a method to relate the two measures would
be necessary. Mean and median incomes for each zip code can be gathered from the
Decennial Census, with their ratios providing the needed generalizable relationship
between mean and median incomes. This ratio also provides a rough gauge for the shape
of the income distribution in each zip code. Greater differences between the median and
mean imply broader income dispersion within the range. Once average income has been
determined from either specific sources or this generalized method, income can be trans-
lated into specific household expenditures through the CES and then multiplied by the
total number of local households to determine aggregate expenditures.
Retail Spending. The CES is the key source for understanding Denver’s household pur-
chases. Total expenditures, individual item expenditures, and gross income per house-
hold can all be compared. The CES report was first tailored to Denver’s spending
patterns, then edited to find only expenditures in retail categories, and finally brought
together as a set of equations that estimate specific expenditures at any given average
Understanding the Retail Business Potential of Inner Cities 1089
income level. These equations estimate the proportion of income that is allocated across
spending categories. Thus, spending by zip code is found by the general equation
Total Zip Code Expenditure = f (Zip Code Income) * Zip Code Income.
where f (Zip Code Income) is the proportion of income spent on a particular category.
The following sections detail the steps involved in developing these estimates. First,
the demand estimates needed to be specific as to Denver through a combination of Den-
ver and Western Region CES reports. Second, to connect supply and demand, the CES
categories needed to match the SIC categories that we used for our supply estimates.
Third, equations were developed to smoothly estimate consumer retail expenditures.
Denver-Specific Data: The 1997 CES reports were the focus of this study. CES data are
aggregated by income categories and regions of the United States, as well as by other crite-
ria. The Western Region report is detailed by average household income levels, which is
desirable because the average household income varies across the zip codes studied. In
particular, the CES shows spending patterns for lower income households, where spend-
ing may actually exceed reported incomes. Using the Western Region’s data, the team
was able to estimate expenditures of an average household in the Western Region given
income. Simply dividing the specific expenditures by the total income would produce a
usable estimate of the expenditures of an average household within the income category.
However, spending patterns specifically by Denver households could be better identified
with data extracted from Denver directly. This way any differences in spending patterns
from the average Western Region household would be accounted for.
The 1997 CES Denver report compares the average spending by Denver house-
holds in broad CES categories. While the Denver report included many of the same cat-
egories as the Western Region report, the Denver report did not break down the data by
income. Thus, the team was not able to use the data from the Denver report only but
also needed the income breakdown from the Western Region report. By considering
the Western Region and the Denver reports simultaneously, a composite aggregate
expenditure list could be made for each average income range in Denver.
The strengths of both data sets could thus be jointly exploited. The data from the
Western Region reports were adjusted using Denver’s deviations from the overall west-
ern expenditures pattern. Dividing Denver expenditures by the corresponding Western
expenditures resulted in an adjustment factor that gave Denver expenditures in terms of
the Western comparison. All Denver expenditure items that exceeded the Western aver-
age produced an adjustment number greater than one. All Denver expenditure items
that were less than the Western average produced an adjustment factor less than one.
The adjustment factor was then multiplied by each expenditure in the Western Region
report. This process made the data in each income category of the Western Region
report more Denver specific. However, the adjustments could not be differentiated by
1090 Stephan Weiler et al.
income. Thus, the same factor adjusted each income category in the augmented
Western Region report.
Matching the CES and SIC: After this phase was completed, the team needed to match
the expenditure categories in the CES reports to our supply-side categories. Since the sup-
ply-side data are structured by SIC (Standard Industrial Classification) codes, the team
would need to further adjust the CES reports. The CES does not show retail expendi-
tures specifically; frequently, what the SIC would categorize as retail expenditures and
service expenditures would be presented as one CES category. Without a correspon-
dence between CES consumption patterns and SIC production classifications, no com-
parison between expenditures and sales would be possible.
Much of the CES category definitions easily matched the SIC definitions. How-
ever, some categories the CES and SIC definitions did not match. For example, the
“apparel and services” CES category includes “other apparel products and services,”
which was a component that added tailoring and other services which our supply-side
SIC did not include. In the problem categories, such as “apparel and services,” the more
detailed Western Region’s report subcategories were used. This made service expendi-
tures easy to remove, with the remaining retail expenditures then kept as a fraction of
the initial CES reporting. For example, “apparel and services” was broken into five
reported subcategories. The unwanted “other apparel and other services” component
was about 20 percent of all “apparel and services” expenditures, depending on income.
Therefore, depending on income, the category of “apparel and services” was reduced by
about 20 percent. Thus, the “apparel and services” category was changed into an
“apparel only” category, which matched our SIC requirement. To have each category’s
retail expenditures be Denver-specific, this fraction was then multiplied by the ratio
between Denver and the Western Region’s spending patterns as explained above.
Estimating the Equations: CES expenditures are presented in broad income categories,
but it is unlikely that households adjust their spending patterns only after they have
moved to precisely the next income category. Instead of average incomes having a
stepped pattern among expenditure proportions, it is more likely that a smooth, fitted
line better approximates households’ expenditures as incomes change. Hypothetically,
zip codes with mean incomes that differ by two dollars, but are placed in different
income categories, would show radically different spending patterns in proportional and
absolute dollar terms. At the same time, zip codes that are in the same income category,
despite a $9,000 difference in mean incomes, will have the exact same proportional
expenditures. Thus, smoothing expenditure patterns over all mean incomes is desired.
Five simple econometric formulas were created to smooth 1997 expenditure repre-
sentations, which are graphically and numerically presented in the appendix. First, total
expenditures were determined as a proportion of income, which explicitly reflects the
falling share of income spent as total household income increases. Consequently, lower
income target zip codes may have more absolute purchasing power than higher income
Understanding the Retail Business Potential of Inner Cities 1091
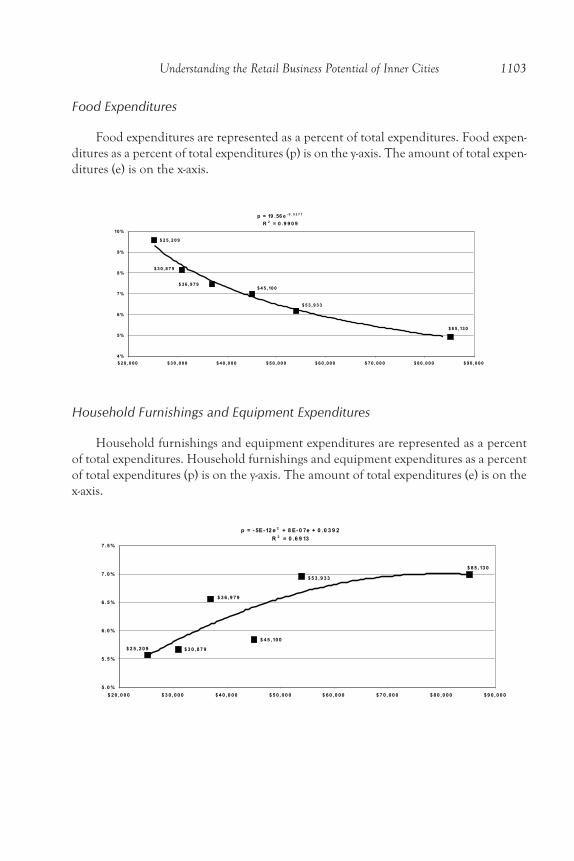
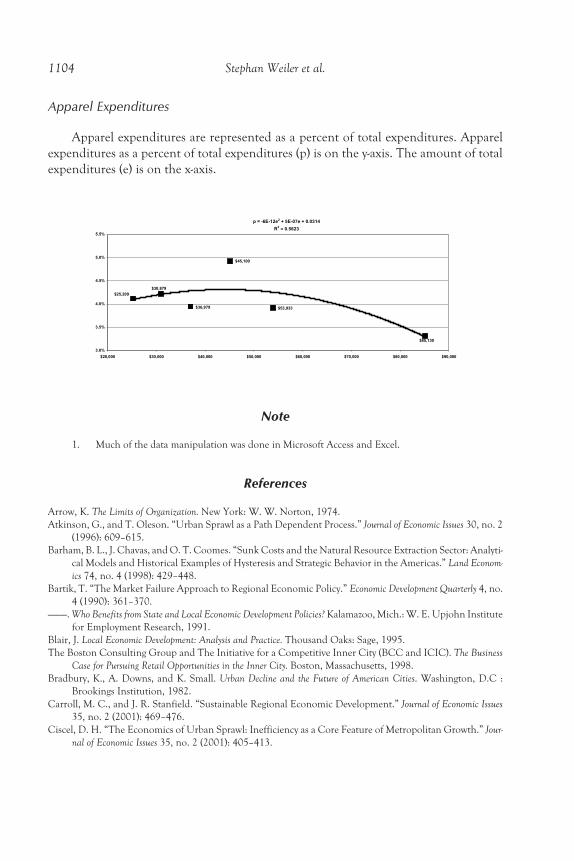
zip codes. Given this expenditure adjustment, the next four graphs represent the pro-
portion of household spending on retail, food, apparel, and home products as a func-
tion of total expenditures (Retail = f [Total Expenditures]). Since at most eight data
points were available based on the behavior of different income categories, visual judg-
ment directed the choice of functional forms (e.g., linear, polynomial, or exponential)
along with consideration of the R2 value.
Synthesis. Once these equations were finalized, household expenditure estimates could be
developed. First, each zip code’s average income was individually inserted into the equa-
tion relating total expenditures to average income. The result gave an estimate of house-
hold expenditures in each zip code. Next, the zip code’s household expenditure figure
was plugged into the remaining retail equations to find relative expenditures in each cate-
gory and then multiplied by the number of households in each zip codes. These aggregate
expenditures were the key results of the demand-side estimation.
Analysis
Tables 3–7 present the results from comparing the resulting demand and supply
estimates on total retail, food at home, apparel, and household products for Denver,
respectively. Information is presented first by target zip codes, with comparative results
for the entire city. For reference, the first columns indicate the number of households,
followed by median and mean incomes. Comparing local expenditures and local sales
yields an estimate of local opportunities. When sales are greater than expenditures, the
zip code has a surplus in that category and is net exporting goods to other areas. If expen-
ditures are greater than sales, a retail deficit or “gap” exists for that zip code. Residents
are therefore on net shopping outside the area for products with insufficient local sales
volume. Zip codes are ranked by decreasing gap size.
Denver as a whole has a surplus for general retail and food but has a gap for apparel
and household items. This finding implies that Denver as a whole exports general retail
and food items to outside visitors but must shop outside the city for much of its apparel
and home needs. These results correspond to understood retail patterns in the state’s
central city, where visitors often buy general retail items in the city but residents need to
shop in suburban malls for clothing and home products. Again, cross-shopping between
areas is likely, but retail prospects are driven by the fact that, all other things being equal,
closer access to shopping is superior to more distant alternatives.
Estimates for new establishments, employees, employee income, sales, sales new to
Denver, and new sales taxes are explored in the final columns at a hypothesized 50 per-
cent capture rate of local gap spending. The 50 percent rate reflects a benchmark for
potential outcomes as local retail gaps are addressed. It also reflects the average spending
done by shoppers outside of neighborhoods stores (e.g., in regional malls), which sug-
gests opportunities for local establishments (Silverstein 2001). Average characteristics of
establishments, employees, and income are based on city means for stores in the three
1092 Stephan Weiler et al.
retail categories based on the 1997 County Business Pattern data. Table 8 outlines this
information, with department stores appended to show potential combinations of
apparel and household items in a single establishment. As noted above, there are cur-
rently no significant department stores in the target areas.
Finally, sales and sales taxes are based on the same 50 percent capture rate of the
existing gaps. New sales taxes would accrue to the city if spending that previously had
Understanding the Retail Business Potential of Inner Cities 1093
Table 3. Overall Retail Gaps for Target Zip Codes
1997 Retail
Zip Expenditures Sales Gap Gap/HH
80207 $157,501,193 $76,444,014 ($81,057,179) ($10,593)
80218 187,189,422 141,843,417 (45,346,006) (4,885)
80219 326,392,267 336,043,872 9,651,605 515
80205 141,663,928 192,873,067 51,209,139 5,728
80211 233,490,164 288,900,274 55,410,111 3,874
80203 182,416,773 288,467,065 106,050,292 9,555
80223 124,443,492 295,129,596 170,686,104 22,892
80204 187,635,107 379,526,457 191,891,350 15,893
80216 44,411,459 377,753,824 333,342,365 116,798
Sum $1,585,143,806 $2,376,981,587 $791,837,781 $8,570
Denver Total $3,995,185,462 $5,783,276,898 $1,788,091,436 $8,223
Table 4. Food Retail Gaps
Zip Expenditures Sales Gap Gap/HH
80207 $24,856,860 $4,270,776 ($20,586,084) ($2,690)
80203 31,991,946 17,721,368 (14,270,578) (1,286)
80211 41,079,982 32,366,443 (8,713,539) (609)
80223 21,666,893 15,804,124 (5,862,769) (786)
80205 25,276,200 28,815,263 3,539,063 396
80216 7,992,122 14,083,640 6,091,518 2,134
80204 33,787,313 45,539,386 11,752,073 973
80218 29,825,120 69,188,947 39,363,827 4,240
Sum $272,172,528 $330,546,704 $58,374,176 $632
Denver Total $664,860,809 $875,565,872 $210,705,064 $969
occurred outside the city’s boundaries were redirected to Denver stores. Retail and food
have net surpluses citywide, so they would likely yield no new sales taxes. Since Denver
food sales are not subject to sales taxes, increased spending on food would not change
tax revenues in any case. Both apparel and home products are imported into Denver,
though, with a coincidentally proximate 42.6 percent of Denver’s clothing needs being
purchased outside the city and 43.0 percent of household items also bought elsewhere.
1094 Stephan Weiler et al.
Table 5. Apparel Retail Gaps
Zip Expenditures Sales Gap Gap/HH
80211 $23,124,182 $1,356,303 ($21,767,880) ($1,522)
80218 18,902,730 1,431,701 (17,471,029) (1,882)
80203 18,084,890 1,951,856 (16,133,034) (1,454)
80207 15,906,088 679,964 (15,226,124) (1,990)
80204 18,430,131 3,530,369 (14,899,762) (1,234)
80205 13,962,075 1,093,079 (12,868,996) (1,439)
80223 12,365,642 413,115 (11,952,527) (1,603)
80216 4,363,275 6,137,365 1,774,090 622
Sum $157,756,569 $29,864,701 ($127,891,868) ($1,384)
Denver Total $401,484,289 $230,353,552 ($171,130,737) ($787)
Table 6. Household Furnishing and Appliance Gaps
Zip HH Median Inc Mean Inc Expenditures Sales Gap
80219 18,738 $37,763 $43,889 $49,794,265 $3,305,445 ($46,488,820)
80211 14,303 31,517 39,294 34,702,730 2,758,297 (31,944,433)
80218 9,283 32,835 56,404 30,263,440 4,867,013 (25,396,427)
80207 7,652 46,746 58,441 25,668,978 3,328,995 (22,339,983)
80205 8,940 24,502 37,351 20,802,593 3,344,528 (17,458,065)
80203 11,099 28,212 39,750 27,186,185 12,093,518 (15,092,667)
80204 12,074 26,621 36,132 27,335,813 23,748,943 (3,586,870)
80223 7,456 33,172 40,806 18,661,839 25,188,658 6,526,819
80216 2,854 29,653 36,214 6,473,637 22,087,797 15,614,160
Sum 92,399 $32,336 $43,142 $240,889,480 $100,723,192 ($140,166,288)
Denver
Total
217,450 $32,900 $48,075 $622,617,703 $355,103,665 ($267,514,038)
Table 7. New Economic Activity Generated by Filling 50 Percent of Gaps
50% Capture of Local Gap 1997 Apparel
Zip New Est New Emp New Inc New Sales
80211 12.6 117 $1,929,501 $10,883,940
80219 11.2 104 1,714,880 9,673,304
80218 10.1 94 1,548,629 8,735,514
80203 9.3 86 1,430,029 8,066,517
80207 8.8 82 1,349,641 7,613,062
80204 8.6 80 1,320,712 7,449,881
80205 7.5 69 1,140,706 6,434,498
80223 6.9 64 1,059,470 5,976,264
Sum 75.1 695 $11,493,569 $64,832,979
50% Capture of Local Gap 1997 Household
Zip New Est New Emp New Inc New Sales
80219 18.5 161 $3,282,658 $23,244,410
80211 12.7 111 2,255,653 15,972,217
80218 10.1 88 1,793,287 12,698,214
80207 8.9 77 1,577,466 11,169,992
80205 7.0 60 1,232,745 8,729,033
80203 6.0 52 1,065,720 7,546,334
80204 1.4 12 253,275 1,793,435
Sum 64.7 562 $11,460,804 $81,153,633
50% Capture of Local Gap 1997 Food at Home
Zip New Est New Emp New Inc New Sales
80207 3.0 63 $1,233,356 $10,293,042
80203 2.1 44 854,980 7,135,289
80211 1.3 27 522,046 4,356,769
80223 0.9 18 351,25 2,931,385
Sum 7.2 152 $2,961,634 $24,716,484
Continued on next page
Shifting the current external spending into new, local shops would create a new sales tax
base. The new amount of sales to be taxed is estimated by using the citywide percentage
of outside purchases (i.e., 42.6 percent and 43.0 percent) to approximate the proportion
of sales in new local stores. Multiplying this new tax base by the city sales tax rate of 3.5
percent yields expected new city taxes, as shown by the final column in tables 4–7. How-
ever, these taxes are not net creations of new revenue but rather shifts of revenue from
the suburbs to the city.
As hypothesized, inner city areas in Denver have often substantial retail gaps
despite lower resident incomes, suggesting neglected opportunities in these struggling
areas. Total retail gaps were large in both 80207 and 80218. However, to properly assess
business opportunities, a more focused look at specific product areas is required. Food
stores do not fulfill residents’ needs in nearly half of the target zip codes, with more than
20 percent of total food expenditures being made outside their residential zip code.
Even accommodating half those needs would yield 159 new jobs, along with reduced
transportation costs for already constrained residents.
Opportunities for apparel and household sales are even more significant. As a
whole, Denver imports these items, but the target zip codes have considerably larger
gaps. Spending leakage in the target areas are 81 percent and 58 percent for apparel and
household goods, respectively. As previously discussed, the discrepancy is still sizeable
for Denver as a whole, but considerably smaller at 42.6 percent in apparel and 43.0 per-
cent in household items. Applying the 50 percent capture rate yields over 1,000 new
jobs in inner city areas. The combination of apparel and home needs suggest the viabil-
ity of local department stores as well, as no such establishments exist there currently.
The appendix features maps of both food and apparel/home gaps by focal zip codes.
The gaps themselves suggest that these inner city areas are underserved. A further
simple statistic based on these results underlines this fact. Dividing area sales by area
expenditures provides an estimate of the proportion of each dollar of local retail need
that can be covered by local retail establishments. For the city of Denver as a whole, the
proportions for food, apparel, and home are 1.317, 0.574, and 0.570 respectively. For
the target zip codes, the corresponding figures are 1.214, 0.189, and 0.418. Distressed
areas of Denver are indeed underserved by retail, both relatively and absolutely. Oppor-
tunities for private investment in retail are clear.
1096 Stephan Weiler et al.
Table 7—Continued
50% Capture of Local Gap 1997 Retail
Zip New Est New Emp New Inc New Sales
80207 26.5 392 $6,536,844 $40,528,590
80218 14.8 219 3,656,922 22,673,003
Sum 41.3 611 $10,193,766 $63,201,592
Tab
le8
.R
etai
lSec
tor
Ch
arac
teri
stic
sfo
rD
enve
r
Per
Est
.P
erE
mp
SIC
Sec
tor
Est
Sal
esE
mp
Pay
Ave
Em
Ave
Wag
eA
veS
ales
Ave
Wag
eS
ales
Tax
Ret
ail
Ret
ail
3,7
77
$5
,78
3,2
76
,89
85
5,8
67
$9
32
,78
3,0
00
15
$2
46
,96
4$1
,53
1,1
83
$1
6,6
96
0.0
35
53
00
Dep
tSto
re4
23
79
,66
3,0
87
2,9
14
42
,16
6,0
00
69
1,0
03
,95
29
,03
9,5
97
14
,47
00
.03
5
54
00
Fo
od
25
58
75
,56
5,8
72
5,3
68
10
4,9
14
,00
02
14
11
,42
73
,43
3,5
92
19
,54
40
.00
0
56
00
Ap
par
el2
67
23
0,3
53
,55
22
,47
04
0,8
37
,00
09
15
2,9
48
86
2,7
47
16
,53
30
.03
5
57
00
Ho
me
28
33
55
,10
3,6
65
2,4
61
50
,14
9,0
00
91
77
,20
51
,25
4,7
83
20
,37
70
.03
5
56
+5
7A
pp
+H
om
e5
50
58
5,4
57
,21
64
,93
19
0,9
86
,00
09
16
5,4
29
1,0
64
,46
81
8,4
52
0.0
35
As noted by table 8, the income per job in the resulting retail positions is low but
still approaches the average wages for employed workers in the target areas. Further-
more, given substantial unemployment in these areas (see table 1), new jobs at appropri-
ate skill levels may provide valuable new resources for these communities. Existing slack
resources lead to net social returns being substantially higher in marginalized areas
(Weiler, Scorsone, and Pullman 2000). Such positions may be particularly important
for younger workers. Early labor force attachment is a strong predictor of eventual labor
market success, so developing stable jobs for youths in struggling neighborhoods could
be of considerable importance.
New income would also remain within the community through these new jobs,
rather than leaking to outlying stores. The retention of local spending can create signifi-
cant multiplier effects on local economies (Blair 1995). These feedback effects are in
turn enhanced by the new availability of consumer products locally, further reducing
leakages and increasing the local multiplied impact of new income. Transport costs for
shopping can also be significantly reduced. Existing community networks and neighbor-
hood social fabric are both reinforced by internal shopping patterns.
Conclusions
Neglected urban areas may harbor considerable opportunities for private entrepre-
neurship. However, these opportunities tend to be overlooked given their marginal
locations, since capital gravitates towards thicker markets and proven niches. The key
bridge to these new sparks of economic activity is information regarding the business
prospects of particular regions. This paper presents a methodology to determine retail
opportunities using broadly available data. The combination of expenditure estimation
on the demand side alongside sales estimation on the supply side using econometric
techniques yields a practical standardized tool for assessing the promise of new retail
establishments in traditionally underserved areas. While the methodology is applied to
urban areas in this study, the technique is potentially applicable to more rural areas that
may face similar retail sector gaps. The development of these methods was clearly
research assistant intensive; however, the methods’ replication based on the constructed
model should be considerably easier.
The results for Denver support the use of this approach. Despite lower incomes in
the inner-city areas, there are clearly potential opportunities for retail development in
these marginalized areas. This gap can be partly explained by the purchasing power of
lower income households, where spending exceeds reported income. Furthermore,
these areas tend to feature denser housing patterns, which further concentrate spending
power, as well as limited transportation options to distant suburban malls. These areas
still face the hurdles of crime, government, and weak worker skills, but as discussed
above, these obstacles may in fact be less pernicious than they appear. Most important,
these areas are simply undersupplied by the retail sector, offering potentially substantial
1098 Stephan Weiler et al.
business opportunities. Local entrepreneurs, armed with improved clarity on business
prospects, may be best placed to take advantage of these niche markets with their knowl-
edge of the local community. In fact, the dominant requests for the study’s results came
from non-profit and private development groups based in these communities, which
have used them in helping motivate retail development in the focal inner city
neighborhoods.
It could be argued correctly that new retail development in struggling inner city
areas is simply a zero-sum game, with retail sales being redistributed within the same
metropolitan area. In fact, while sales themselves may simply be redistributed, the multi-
plied benefits of new economic activity and income combined with lower resource (e.g.,
labor) opportunity costs, are likely to lead to considerably greater social returns for inner
city locations (e.g., Weiler, Scorsone, and Pullman 2000). Furthermore, such infill busi-
ness activity can help mitigate the sprawling tendencies of metropolitan areas (Atkinson
and Oleson 1996; Ciscel 2001). Parallel research is estimating both private profit as well
as the social returns for such location decisions, while also highlighting the more gen-
eral challenges of regional economic development given geographic informational
asymmetries (Weiler and Scorsone forthcoming).
Private capital seeks profit. In thick, established markets, opportunities are subject
to intense scrutiny, while thinner markets tend to fall into a pattern of neglect, uncer-
tainty, and stagnation. Yet these neglected markets can provide significant opportuni-
ties for private profit. If private economic activity in thinner markets increases,
substantial slack resources will be used due to their lower opportunity costs, and social
welfare will be increased in areas that most need enhancement. Information is the miss-
ing link to draw private capital to otherwise ignored possibilities, which could justifiably
be financed by public agencies, such as government or universities, in the case of
marginalized communities (Weiler 2000a). This study presents a template for the provi-
sion of such information, promoting economic efficiency and equity in marginalized
areas both for Denver and other communities that choose to use this mode.
Appendix
The five equations to estimate the demand expenditures were based on 1997 CES
data as described in the text, which were in turn used in the final focal analyses for Den-
ver’s 1997 retail gaps. An Ordinary Least Squares approach was use to smooth the
expenditure estimates. In general, we were principally interested in the lack of bias of
the estimators along with the overall goodness of fit. Since at most eight data points
were available based on the behavior of different income categories, visual judgment
directed the choice of functional forms (e.g., linear, polynomial, or exponential) along
with consideration of the R2 value. Below are the graphs and equations of the smoothed
estimators for each expenditure category.
Figures 1A and 2A are maps of food and apparel/home gaps by focal zip codes.
Understanding the Retail Business Potential of Inner Cities 1099
FO
OD
Po
ten
tial
Sq
uar
e F
eet
20,0
00 +
10,0
00-2
0,00
00-
10,0
00
Nei
ghbo
rhoo
ds &
Zip
Cod
es
Co
mm
un
ity
Pla
nn
ing
an
d D
evel
op
men
t A
gen
cy
Cit
y &
Cou
nty
of D
enve
r
01/
21
2
Mile
sN
4TH
AV
E.
ALCOTT ST.
HURON ST.
14TH S
T.
20T
H A
VE
.
OSCEOLA ST.
48T
H A
VE
.
11
20T
H A
VE
.
ELL
SW
OR
TH
AV
E.
26T
H A
VE
.
BLAKE S
T.
Zip
Cod
es*
*All
Zip
Cod
es a
re 8
02__
unl
ess
othe
rwis
e no
ted
00
21 04
02
19
23
36
1009
31
37
24
22
8012
3
8011
035
32
27
261412
0318
16
05
0620
07
39
30
49
40
8001
0 8001
2
8001
4
8011
1
YA
LE A
VE
.
HA
MP
DE
N A
VE
.
BROADWAY
QU
INC
Y A
VE
.HOLLY ST.
QUEBEC ST.
HAVANA ST.
40T
H A
VE
.S
MIT
H R
D.
YOSEMITE ST.
BUCKLEY RD.
8002
2
8012
1
SYRACUSE
CENTRAL
EV
AN
S A
VE
. MONACO PKWY.
CLARKSON ST.
HIGH ST.
LINCOLN ST.
20TH S
T.
RE
GIS
BE
RK
EL
EY
CH
AF
FE
E P
AR
K
SU
NN
YS
IDE
HIG
HL
AN
DW
ES
T H
IGH
LA
ND
SL
OA
N L
AK
E
GL
OB
EV
ILL
EE
LY
RIA
S
WA
NS
EA
FIV
E
PO
INT
S
CO
LE
CB
DC
ITY
PA
RK
WE
ST
CL
AY
TO
N
SK
YL
AN
DW
HIT
TIE
R
CIT
Y P
AR
K
CA
PIT
OL
HIL
L
WE
ST
CO
LF
AX
JEF
FE
RS
ON
PA
RK
UN
ION
ST
AT
ION
AU
RA
RIA
BA
RN
UM
BA
RN
UM
WE
ST
SUN VALLEY
LIN
CO
LN
P
AR
K
CIV
ICC
EN
TE
R
NO
RT
HC
AP
ITO
LH
ILL
SP
EE
RB
AK
ER
VA
LV
ER
DE
WE
ST
WO
OD
AT
HM
AR
PA
RK
WA
SH
.P
AR
KW
ES
T
CH
EE
SM
AN
PA
RK
CO
UN
TR
YC
LU
B
WA
SH
.P
AR
K
RU
BY
HIL
L
PL
AT
TP
AR
K
RO
SE
DA
LE
OV
ER
LA
ND
CO
LL
EG
EV
IEW
SO
UT
HP
LA
TT
E
HA
RV
EY
PA
RK
SO
UT
H
HA
RV
EY
PA
RK
MA
R L
EE
MA
RS
TO
N
FO
RT
L
OG
AN
BE
AR
VA
LL
EY
NO
RT
HE
AS
TP
AR
K H
ILL
NO
RT
H P
AR
K H
ILL
ST
AP
LE
TO
N
SO
UT
H P
AR
K H
ILL
MO
NT
BE
LL
O
EA
ST
CO
LF
AX
LO
WR
Y F
IEL
D
HA
LE
MO
NT
CL
AIR
CO
NG
RE
SS
PA
RK
CH
ER
RY
CR
EE
KH
ILL
TO
P
GA
TE
WA
YG
RE
EN
VA
LL
EY
RA
NC
H
WIN
DS
OR
WA
SH
ING
TO
NV
IRG
INIA
VA
LE
BE
LC
AR
O
CO
RY
-M
ER
RIL
L
VIR
GIN
IA
VIL
LA
GE
HA
MP
DE
N
GO
LD
SM
ITH
KE
NN
ED
YU
NIV
ER
SIT
YH
ILL
S
SO
UT
HM
OO
R
P
AR
KH
AM
PD
EN
SO
UT
H
UN
IVE
RS
ITY
PA
RK
WE
LL
SH
IRE
UN
IVE
RS
ITY
IND
IAN
CR
EE
K
VIL
LA
PA
RK
DIA
Nei
ghbo
rhoo
ds
BE
LLE
VIE
W A
VE
.
I-225
I-25
MO
NT
VIE
W B
LVD
..
CO
LFA
X A
VE
.
40T
H A
VE
23R
D A
VE
MA
RT
IN L
UT
HE
R K
ING
BLV
D.
11T
H A
VE
ALA
ME
DA
AV
E
MIS
SIS
SIP
PI A
VE
ZUNI ST
W. 3
8TH
AV
E
I-70
W. 2
9TH
AV
E
17T
H A
VE
19T
H A
VE
SPEE
R B
LVD
6TH
AV
E
MIS
SIS
SIP
PI
A
VE
.
ALA
ME
DA
AV
E.
QUEBEC ST
YOSEMITE ST
DAYTON ST
HAVANA ST
CHAMBERS RD.
TOWER RD
PICADILLY RD
BROADWAY
COLORADO BLVD
UNIVERSITY BLVD
JEW
ELL
AV
E.
6TH
AV
E8T
H A
VE
YA
LE A
VE
YA
LE A
VEEV
AN
S A
VE
.
FEDERAL BLVD
PERRY ST
HOLLY ST.
20T
H A
VE
.
LAW
RENCE
38TH S
T.
SOU
TH
PLATTE
RIVER
CH
ERR
Y
CR
EEK
MIS
SIS
SIP
PI A
VE
.
U.S
. 285
DOWNING ST.
DR
YC
RE
EK
SHERIDAN BLVD.
56T
H A
VE
.
52N
D A
VE
.
YORK ST.
KIPLING ST.
INCA ST.
HAVANA ST.
Fig
ure
1A
.F
oo
dG
aps
by
Fo
cal
Zip
Co
des
AP
PA
RE
L &
HO
US
EH
OL
DP
ote
nti
alS
qu
are
Fee
t15
0,00
0+10
0,00
0-15
0,00
050
,000
-100
,000
0-50
,000
Nei
ghbo
rhoo
ds &
Zip
Cod
es
Co
mm
un
ity
Pla
nn
ing
an
d D
evel
op
men
t A
gen
cy
Cit
y &
Cou
nty
of D
enve
r
01/
21
2
Mile
sN
4TH
AV
E.
ALCOTT ST.
HURON ST.
14TH S
T.
20T
H A
VE
.
OSCEOLA ST.
48T
H A
VE
.
11
20T
H A
VE
.
ELL
SW
OR
TH
AV
E.
26T
H A
VE
.
BLAKE S
T.
Zip
Cod
es*
*All
Zip
Cod
es a
re 8
02__
unl
ess
othe
rwis
e no
ted
00
21 04
02
19
23
36
1009
31
37
24
22
8012
3
8011
035
32
27
261412
0318
16
05
0620
07
39
30
49
40
8001
0 8001
2
8001
4
8011
1
YA
LE A
VE
.
HA
MP
DE
N A
VE
.
BROADWAY
QU
INC
Y A
VE
.
HOLLY ST.
QUEBEC ST.
HAVANA ST.
40T
H A
VE
.S
MIT
H R
D.
YOSEMITE ST.
BUCKLEY RD.
8002
2
8012
1
SYRACUSE
CENTRAL
EV
AN
S A
VE
. MONACO PKWY.
CLARKSON ST.
HIGH ST.
LINCOLN ST.
20TH S
T.
RE
GIS
BE
RK
EL
EY
CH
AF
FE
E P
AR
K
SU
NN
YS
IDE
HIG
HL
AN
DW
ES
T H
IGH
LA
ND
SL
OA
N L
AK
E
GL
OB
EV
ILL
EE
LY
RIA
S
WA
NS
EA
FIV
E
PO
INT
S
CO
LE
CB
DC
ITY
PA
RK
WE
ST
CL
AY
TO
N
SK
YL
AN
DW
HIT
TIE
R
CIT
Y P
AR
K
CA
PIT
OL
HIL
L
WE
ST
CO
LF
AX
JEF
FE
RS
ON
PA
RK
UN
ION
ST
AT
ION
AU
RA
RIA
BA
RN
UM
BA
RN
UM
WE
ST
SUN VALLEY
LIN
CO
LN
P
AR
K
CIV
ICC
EN
TE
R
NO
RT
HC
AP
ITO
LH
ILL
SP
EE
RB
AK
ER
VA
LV
ER
DE
WE
ST
WO
OD
AT
HM
AR
PA
RK
WA
SH
.P
AR
KW
ES
T
CH
EE
SM
AN
PA
RK
CO
UN
TR
YC
LU
B
WA
SH
.P
AR
K
RU
BY
HIL
L
PL
AT
TP
AR
K
RO
SE
DA
LE
OV
ER
LA
ND
CO
LL
EG
EV
IEW
SO
UT
HP
LA
TT
E
HA
RV
EY
PA
RK
SO
UT
H
HA
RV
EY
PA
RK
MA
R L
EE
MA
RS
TO
N
FO
RT
L
OG
AN
BE
AR
VA
LL
EY
NO
RT
HE
AS
TP
AR
K H
ILL
NO
RT
H P
AR
K H
ILL
ST
AP
LE
TO
N
SO
UT
H P
AR
K H
ILL
MO
NT
BE
LL
O
EA
ST
CO
LF
AX
LO
WR
Y F
IEL
D
HA
LE
MO
NT
CL
AIR
CO
NG
RE
SS
PA
RK
CH
ER
RY
CR
EE
KH
ILL
TO
P
GA
TE
WA
YG
RE
EN
VA
LL
EY
RA
NC
H
WIN
DS
OR
WA
SH
ING
TO
NV
IRG
INIA
VA
LE
BE
LC
AR
O
CO
RY
-M
ER
RIL
L
VIR
GIN
IA
VIL
LA
GE
HA
MP
DE
N
GO
LD
SM
ITH
KE
NN
ED
YU
NIV
ER
SIT
YH
ILL
S
SO
UT
HM
OO
R
P
AR
KH
AM
PD
EN
SO
UT
H
UN
IVE
RS
ITY
PA
RK
WE
LL
SH
IRE
UN
IVE
RS
ITY
IND
IAN
CR
EE
K
VIL
LA
PA
RK
DIA
Nei
ghbo
rhoo
ds
BE
LLE
VIE
W A
VE
.
I-225
I-25
MO
NT
VIE
W B
LVD
..
CO
LFA
X A
VE
.
40T
H A
VE
23R
D A
VE
MA
RT
IN L
UT
HE
R K
ING
BLV
D.
11T
H A
VE
ALA
ME
DA
AV
E
MIS
SIS
SIP
PI A
VE
ZUNI ST
W. 3
8TH
AV
E
I-70
W. 2
9TH
AV
E
17T
H A
VE
19T
H A
VE
SPEE
R B
LVD
6TH
AV
E
MIS
SIS
SIP
PI
A
VE
.
ALA
ME
DA
AV
E.
QUEBEC ST
YOSEMITE ST
DAYTON ST
HAVANA ST
CHAMBERS RD.
TOWER RD
PICADILLY RD
BROADWAY
COLORADO BLVD
UNIVERSITY BLVDJE
WE
LL A
VE
.
6TH
AV
E8T
H A
VE
YA
LE A
VE
YA
LE A
VEEV
AN
S A
VE
.
FEDERAL BLVD
PERRY ST
HOLLY ST.
20T
H A
VE
.
LAW
RENCE
38TH S
T.
SOU
TH
PLATTE
RIVERC
HER
RY
C
REE
K
MIS
SIS
SIP
PI A
VE
.
U.S
. 285
DOWNING ST.
DR
YC
RE
EK
SHERIDAN BLVD.
56T
H A
VE
.
52N
D A
VE
.
YORK ST.
KIPLING ST.
INCA ST.
HAVANA ST.
Fig
ure
2A
.A
pp
arel
Gap
sb
yF
oca
lZ
ipC
od
es
Total Expenditures
Total expenditures are represented as a percent of total income. The percent of
total income (P) is on the y-axis and total income (Y) is on the x-axis.
Total Retail Expenditures
Total retail expenditures are represented as a percent of total expenditures. Retail
expenditures as a percent of total expenditures (p) is on the y-axis. The amount of total
expenditures (e) is on the x-axis.
1102 Stephan Weiler et al.
$ 2 7 , 8 2 9
$12 6 , 5 8 9
$ 6 5 ,7 0 9
$ 4 9 , 8 8 7
$ 3 8 , 9 2 7
P = 2 9 .2 2 8 Y- 0 . 3 2 1 7
R2
= 0 .9 9 11
6 0 %
7 0 %
8 0 %
9 0 %
10 0 %
110 %
12 0 %
$ 0 $ 2 0 , 0 0 0 $ 4 0 , 0 0 0 $ 6 0 , 0 0 0 $ 8 0 , 0 0 0 $ 10 0 , 0 0 0 $ 12 0 ,0 0 0 $ 14 0 , 0 0 0
$45,100
$85,130
$53,933$36,979
$30,879$25,209
p = -2E-11e2
+ 1E-06e + 0.4156
R2
= 0.9207
37%
38%
39%
40%
41%
42%
43%
44%
$20,000 $30,000 $40,000 $50,000 $60,000 $70,000 $80,000 $90,000
Food Expenditures
Food expenditures are represented as a percent of total expenditures. Food expen-
ditures as a percent of total expenditures (p) is on the y-axis. The amount of total expen-
ditures (e) is on the x-axis.
Household Furnishings and Equipment Expenditures
Household furnishings and equipment expenditures are represented as a percent
of total expenditures. Household furnishings and equipment expenditures as a percent
of total expenditures (p) is on the y-axis. The amount of total expenditures (e) is on the
x-axis.
Understanding the Retail Business Potential of Inner Cities 1103
$ 2 5 ,2 0 9
$ 8 5 ,13 0
$ 5 3 ,9 3 3
$ 4 5 ,10 0$ 36 , 9 7 9
$ 3 0 ,8 7 9
p = 19 .56 e - 0 . 5 2 7 7
R 2 = 0 .9 9 0 9
4%
5%
6%
7%
8%
9%
10%
$ 2 0 ,0 0 0 $ 3 0 , 0 00 $ 4 0 ,0 0 0 $ 5 0 ,0 0 0 $ 6 0 ,0 0 0 $ 7 0 , 00 0 $ 8 0 ,0 0 0 $ 9 0 ,0 0 0
$ 3 0 , 8 7 9
$ 5 3 ,9 3 3
$ 8 5 , 13 0
$ 2 5 , 2 0 9
$ 4 5 ,10 0
$ 3 6 , 9 7 9
p = - 5E- 12 e 2 + 8 E- 0 7e + 0 .0 3 9 2
R 2 = 0 .6 9 13
5 . 0 %
5 . 5 %
6 . 0 %
6 . 5 %
7 . 0 %
7 . 5 %
$ 2 0 ,0 0 0 $ 3 0 , 0 0 0 $ 4 0 ,0 0 0 $ 5 0 , 0 0 0 $ 6 0 , 0 0 0 $ 7 0 , 0 0 0 $ 8 0 ,0 0 0 $ 9 0 , 0 0 0
Apparel Expenditures
Apparel expenditures are represented as a percent of total expenditures. Apparel
expenditures as a percent of total expenditures (p) is on the y-axis. The amount of total
expenditures (e) is on the x-axis.
Note
1. Much of the data manipulation was done in Microsoft Access and Excel.
References
Arrow, K. The Limits of Organization. New York: W. W. Norton, 1974.
Atkinson, G., and T. Oleson. “Urban Sprawl as a Path Dependent Process.” Journal of Economic Issues 30, no. 2
(1996): 609–615.
Barham, B. L., J. Chavas, and O. T. Coomes. “Sunk Costs and the Natural Resource Extraction Sector: Analyti-
cal Models and Historical Examples of Hysteresis and Strategic Behavior in the Americas.” Land Econom-
ics 74, no. 4 (1998): 429–448.
Bartik, T. “The Market Failure Approach to Regional Economic Policy.” Economic Development Quarterly 4, no.
4 (1990): 361–370.
———. Who Benefits from State and Local Economic Development Policies? Kalamazoo, Mich.: W. E. Upjohn Institute
for Employment Research, 1991.
Blair, J. Local Economic Development: Analysis and Practice. Thousand Oaks: Sage, 1995.
The Boston Consulting Group and The Initiative for a Competitive Inner City (BCC and ICIC). The Business
Case for Pursuing Retail Opportunities in the Inner City. Boston, Massachusetts, 1998.
Bradbury, K., A. Downs, and K. Small. Urban Decline and the Future of American Cities. Washington, D.C :
Brookings Institution, 1982.
Carroll, M. C., and J. R. Stanfield. “Sustainable Regional Economic Development.” Journal of Economic Issues
35, no. 2 (2001): 469–476.
Ciscel, D. H. “The Economics of Urban Sprawl: Inefficiency as a Core Feature of Metropolitan Growth.” Jour-
nal of Economic Issues 35, no. 2 (2001): 405–413.
1104 Stephan Weiler et al.
$45,100
$85,130
$53,933$36,979
$30,879
$25,209
p = -6E-12e2 + 5E-07e + 0.0314
R2 = 0.5623
3.0%
3.5%
4.0%
4.5%
5.0%
5.5%
$20,000 $30,000 $40,000 $50,000 $60,000 $70,000 $80,000 $90,000
Consumer Expenditure Survey. Internet: <http://www.bls.gov/csxhome.htm>, reading from subheading
“Two-year tables, cross-tabulated,” Metropolitan Statistical Area, Western MSA.
County Business Patterns. Desired state and county at <http://www.census.gov/epcd/cbp/view/
cbpview.html>.
de Oliver, M., and T. Dawson-Munoz. “‘Place-Not-Race’?: The Inadequacy of Geography to Address Racial Dis-
parities.” The Review of Black Political Economy 25, no. 2 (1996): 37–60.
Dymski, G. “Can Entrepreneurial Incentives Revitalize the Urban Inner Core? A Spatial Input-Output Ap-
proach.” Journal of Economic Issues 35, no. 2 (2001): 415–422.
The Economic Census. “Retail Trade,” which includes SIC explanations and subheadings at <http://www.cen-
sus.gov/epcd/www/econ97.html>.
Eisner, R. “Extended Accounts for National Income and Product.” Journal of Economic Literature 26 (1988):
1611–1684.
Forester, M. “Retail’s Next Frontier Is Not Overseas.” Chain Store Age 76, no. 3 (2000): 14.
Loukaitou-Sideris, A. “Revisiting Inner-City Strips: A Framework for Community and Economic Develop-
ment.” Economic Development Quarterly 14, no. 2 (2000): 165–181.
Mills, E. S., and L. S. Lubuge “Inner Cities.” Journal of Economic Literature 35, no. 2 (1997): 727–756.
Okoruwa, A. A., H. Nourse, and J. V. Terza (1994). “Estimating Sales for Retail Centers: An Application of the
Poisson Gravity Model.” The Journal of Real Estate Research 9, no. 1 (1994): 85–97.
Polyani, K. The Great Transformation. Boston: Beacon Press, 1994.
Porter, M. “New Strategies for Inner-City Economic Development.” Economic Development Quarterly 11, no. 1
(1997).
———. On Competition. Harvard Business Review Book Services. Boston: Harvard Business School Press, 1998.
PricewaterhouseCoopers and The Initiative for a Competitive Inner City (PWC and ICIC). The Inner City Shop-
per: A Strategic Perspective. Boston, Massachusetts, 1999.
Regional Economic Development Center (REDC). “Commercial Development Potential in the Orange
Mound Neighborhood.” Memphis, Tenn.: The University of Memphis, 1997.
———. “Memphis Retail Potential Study—North Memphis.” Memphis, Tenn.: The University of Memphis,
1998.
Silverstein, J. “Redevelopment Opportunities: 73rd Avenue/Lowell Boulevard Corridor-Westminster, Colo-
rado.” Denver: Development Research Partners, 2001.
Stigler, G. “The Economics of Information.” Journal of Political Economy 69 (1961): 213–225.
Taneja, S. “Inner City Opportunity Knocks: Tapping into a $100 Billion Market.” Chain Store Age (October
1998): 177–180.
U.S. Department of Housing and Urban Development (HUD). “New Markets: The Untapped Retail Buying
Power in America’s Inner Cities.” Washington, D.C., 1999.
Weiler, S. “The Economics of the Struggling Structurally Unemployed.” Journal of Appalachian Studies 3, no. 1
(1997): 71–98.
———. “Linking Regional Markets: Information and Market Failure in Local Economic Development.” Economic
Development Quarterly 14, no. 2 (2000): 194–203.
———. “Pioneers and Settlers in LoDo Denver: Private Risk and Public Benefits in Urban Redevelopment.” Ur-
ban Studies 37, no. 1 (2000): 167–179.
Weiler, S., and E. Scorsone. “New Markets as Informational Asymmetries.” Economic Development Quarterly
(forthcoming).
Weiler, S., E. Scorsone, and M. Pullman. “Information Linkages in Local Economic Development.” Growth
and Change 31, no. 3 (2000): 367–384.
Williamson, O. “The Economics of Governance: Framework and Implications.” Economics as Process: Essays in
the New Institutionalist Economics, edited by R. Langlois. Cambridge: Cambridge University Press, 1986.
Zeckhauser, R. “The Challenge of Contracting for Technological Information.” Proceedings of the National Acad-
emy of Sciences 93 (1996): 12743–12748.
Zip Code Business Patterns. Department of Commerce—Census Division. CD-ROM.
Understanding the Retail Business Potential of Inner Cities 1105