Understanding the Risk of China’s Local Government Debts and Its Linkage with Property Markets Yongheng Deng National University of Singapore Paper presented at the International Symposium on Housing and Financial Stability in China. Hosted by the Chinese University of Hong Kong, Shenzhen Shenzhen, China─December 18-19, 2015 The views expressed in this paper are those of the author(s) only, and the presence of them, or of links to them, on the IMF website does not imply that the IMF, its Executive Board, or its management endorses or shares the views expressed in the paper.
Transcript
Understanding the Risk of China’s Local Government Debts and Its Linkage
with Property Markets
Yongheng Deng National University of Singapore
Paper presented at the International Symposium on Housing and Financial Stability in China. Hosted by the Chinese University of Hong Kong, Shenzhen Shenzhen, China─December 18-19, 2015
The views expressed in this paper are those of the author(s) only, and the presence of them, or of links to them, on the IMF website does not imply that the IMF, its Executive Board, or its management endorses or shares the views expressed in the paper.
Understanding the Risk of China’s Understanding the Risk of China’s Local Government Debts and Its Linkage with Local Government Debts and Its Linkage with
Property MarketsProperty Markets
Brent AmbroseBrent Ambrose Yongheng DengYongheng Deng Jing WuJing WuBrent AmbroseBrent Ambrose Yongheng DengYongheng Deng Jing WuJing WuPenn State UniversityPenn State University
[email protected]@psu.eduNational University of SingaporeNational University of Singapore
IMFIMF--PrincetonPrinceton--CUHK International Symposium on Housing and Financial Stability in ChinaCUHK International Symposium on Housing and Financial Stability in ChinaShenzhen, ChinaShenzhen, China
December 18, 2015December 18, 2015
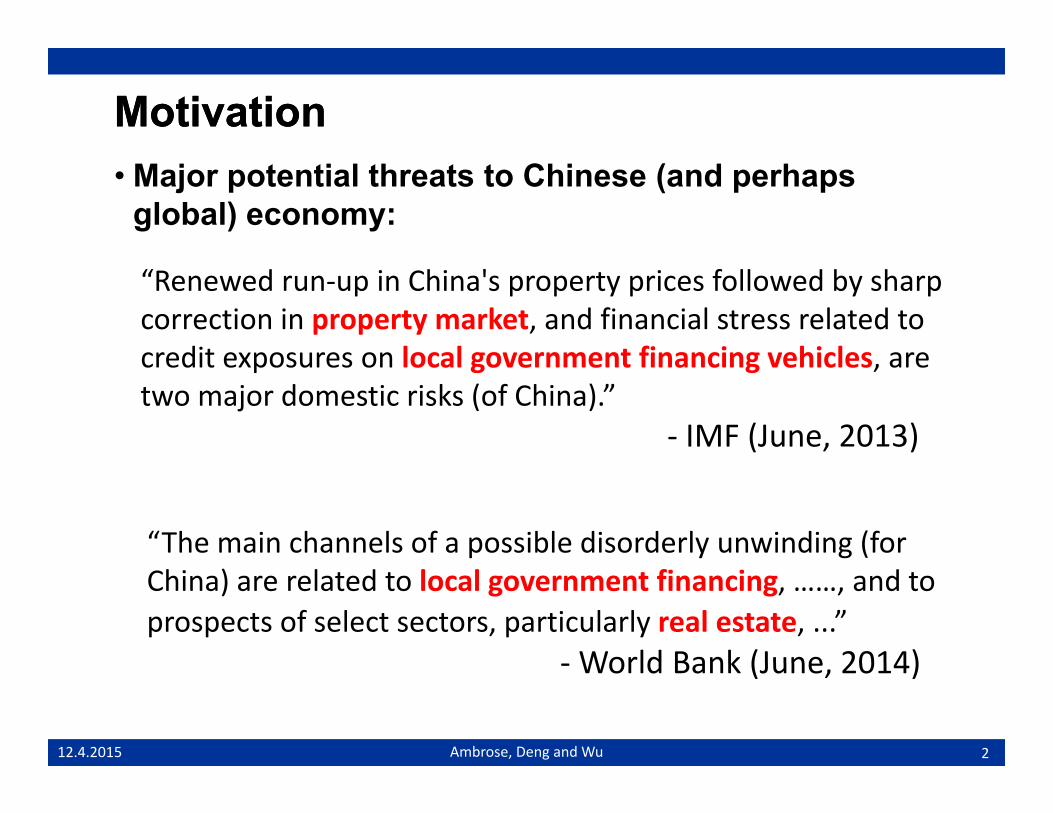
MotivationMotivation• Major potential threats to Chinese (and perhaps
global) economy:
“Renewed run-up in China's property prices followed by sharp correction in property market, and financial stress related to credit exposures on local government financing vehicles arecredit exposures on local government financing vehicles, are two major domestic risks (of China).”
- IMF (June, 2013)
“The main channels of a possible disorderly unwinding (for China) are related to local government financing, ……, and to prospects of select sectors, particularly real estate, ...”
World Bank (June 2014)
2
- World Bank (June, 2014)
12.4.2015 Ambrose, Deng and Wu
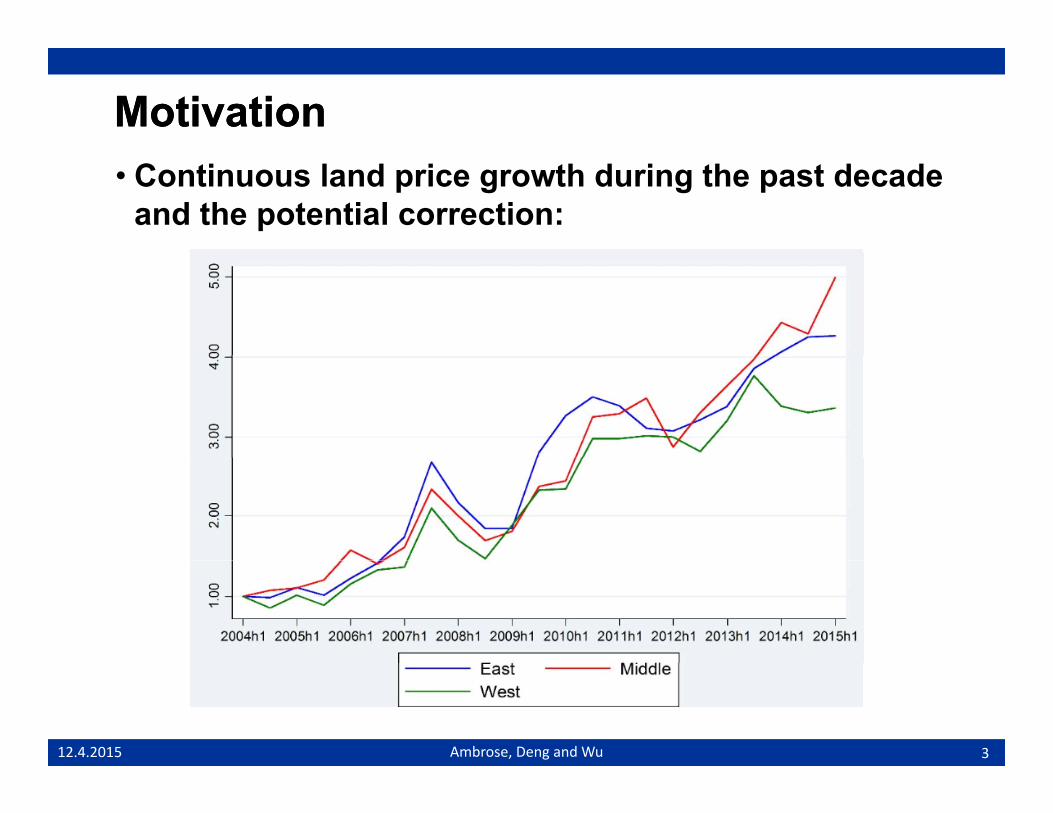
MotivationMotivation• Continuous land price growth during the past decade
and the potential correction:
312.4.2015 Ambrose, Deng and Wu
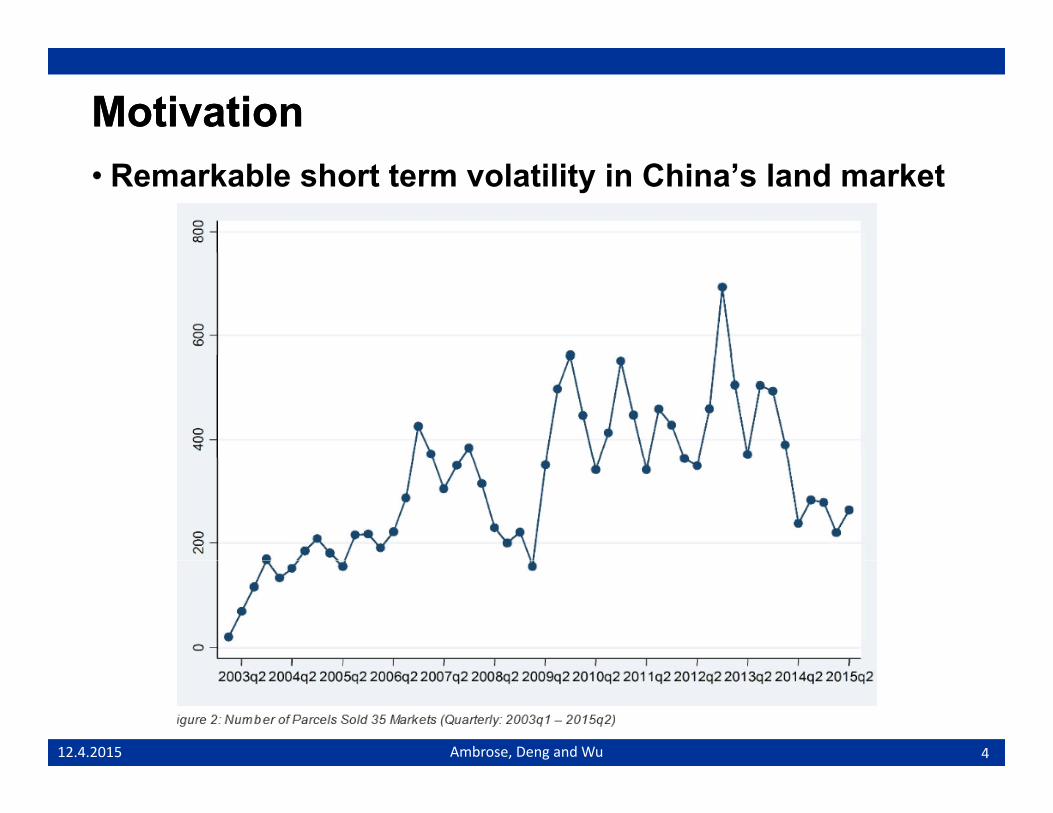
MotivationMotivation• Remarkable short term volatility in China’s land market
412.4.2015 Ambrose, Deng and Wu
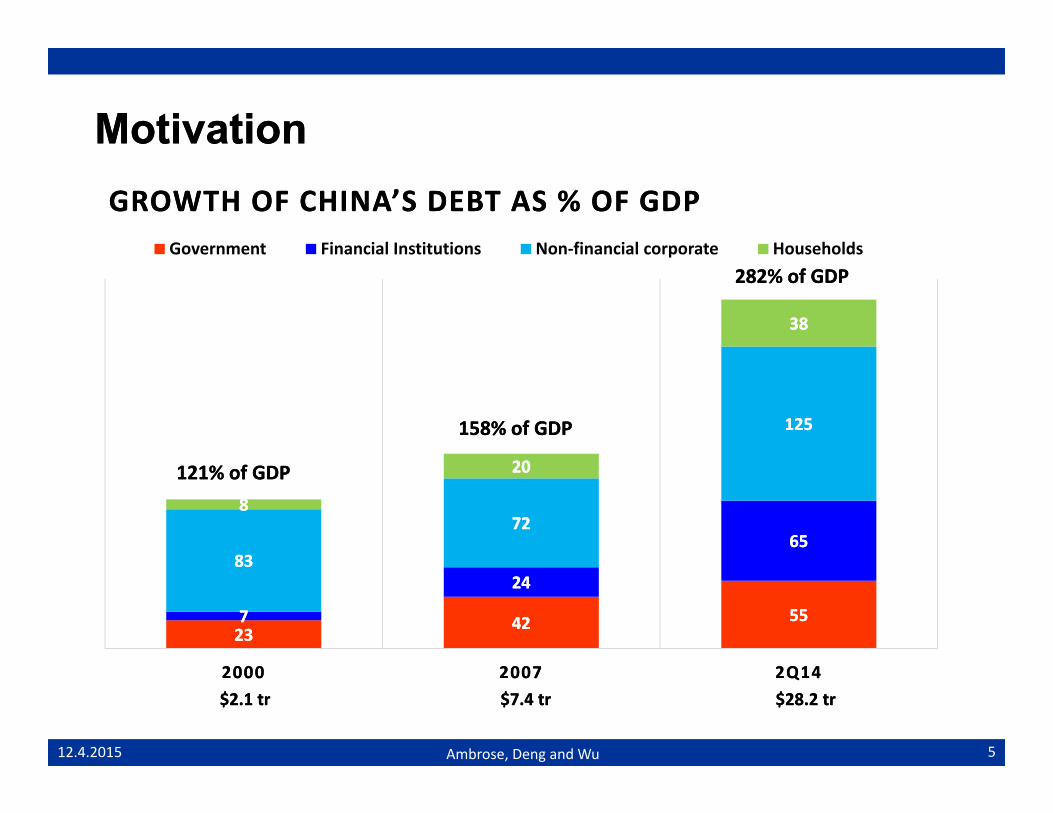
MotivationMotivationGROWTH OF CHINA’S DEBT AS % OF GDPGROWTH OF CHINA’S DEBT AS % OF GDP
Government Financial Institutions Non-financial corporate Households
3838
Government Financial Institutions Non financial corporate Households282% of GDP282% of GDP
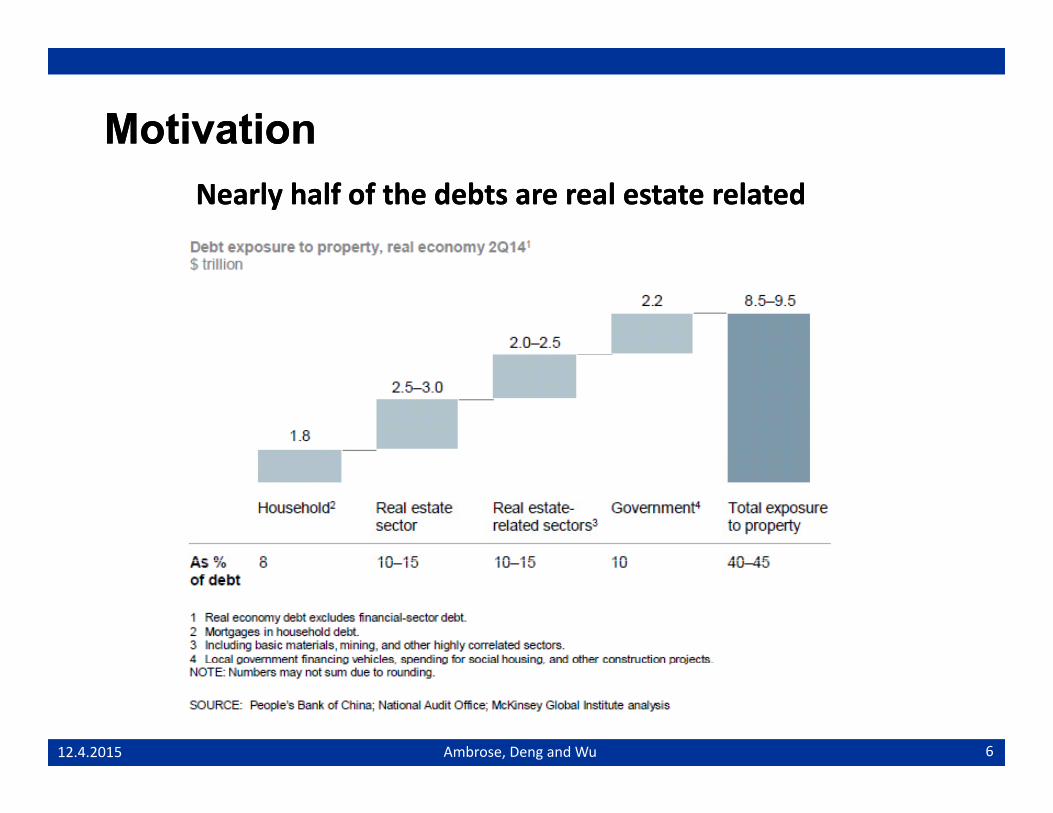
MotivationMotivationNearly half of the debts are real estate relatedNearly half of the debts are real estate related
Ambrose, Deng and Wu12.4.2015 6
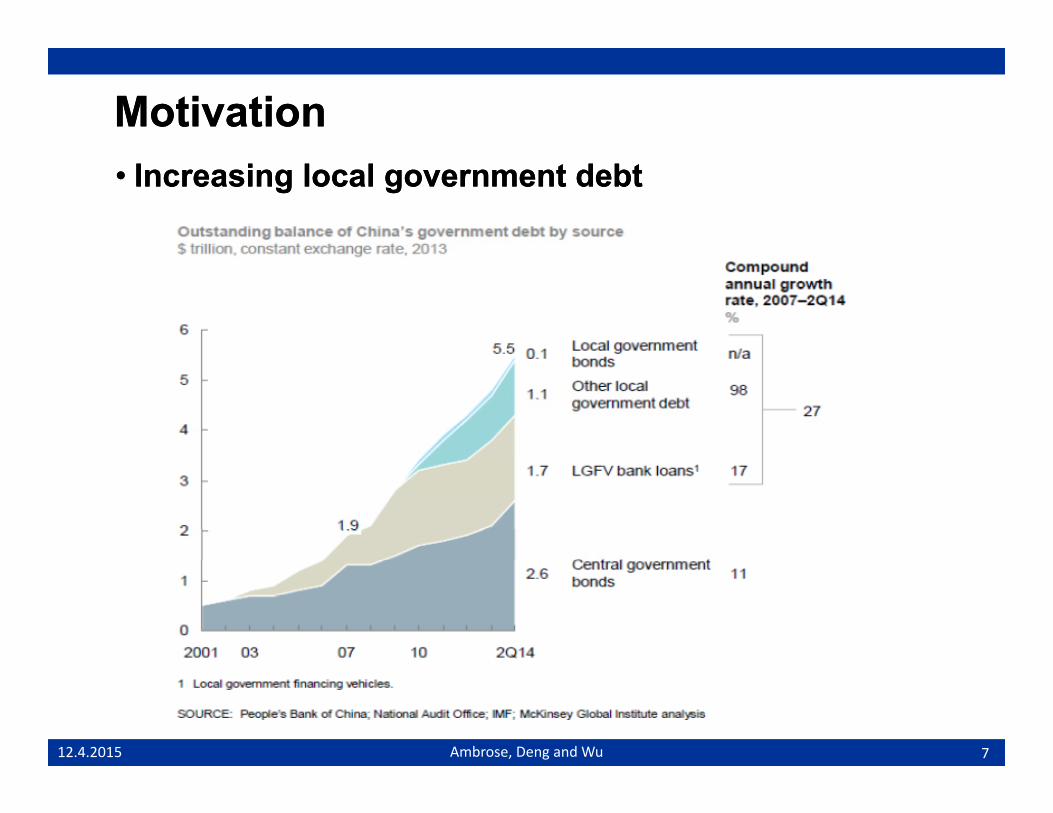
MotivationMotivation•• Increasing local government debtIncreasing local government debt
712.4.2015 Ambrose, Deng and Wu
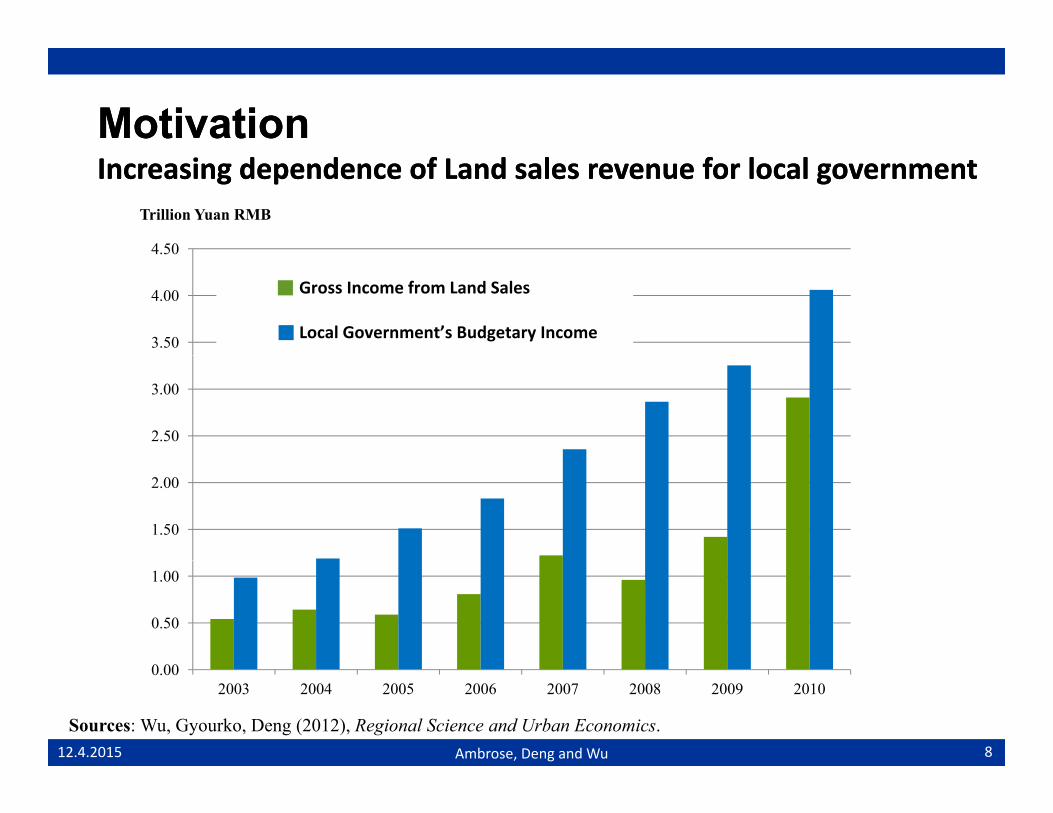
MotivationMotivationIncreasing dependence of Land sales revenue for local governmentIncreasing dependence of Land sales revenue for local government
4.50
Trillion Yuan RMB
3.50
4.00
4.50
土地出让收入
地方政府预算内收入
Gross Income from Land Sales
Local Government’s Budgetary Income
2.50
3.00
1.50
2.00
0.50
1.00
0.002003 2004 2005 2006 2007 2008 2009 2010
Sources: Wu, Gyourko, Deng (2012), Regional Science and Urban Economics.
Ambrose, Deng and Wu12.4.2015 8
Key QuestionKey Question• Are the solvency of local government debt and local housing market
risk (perceived to be) related?
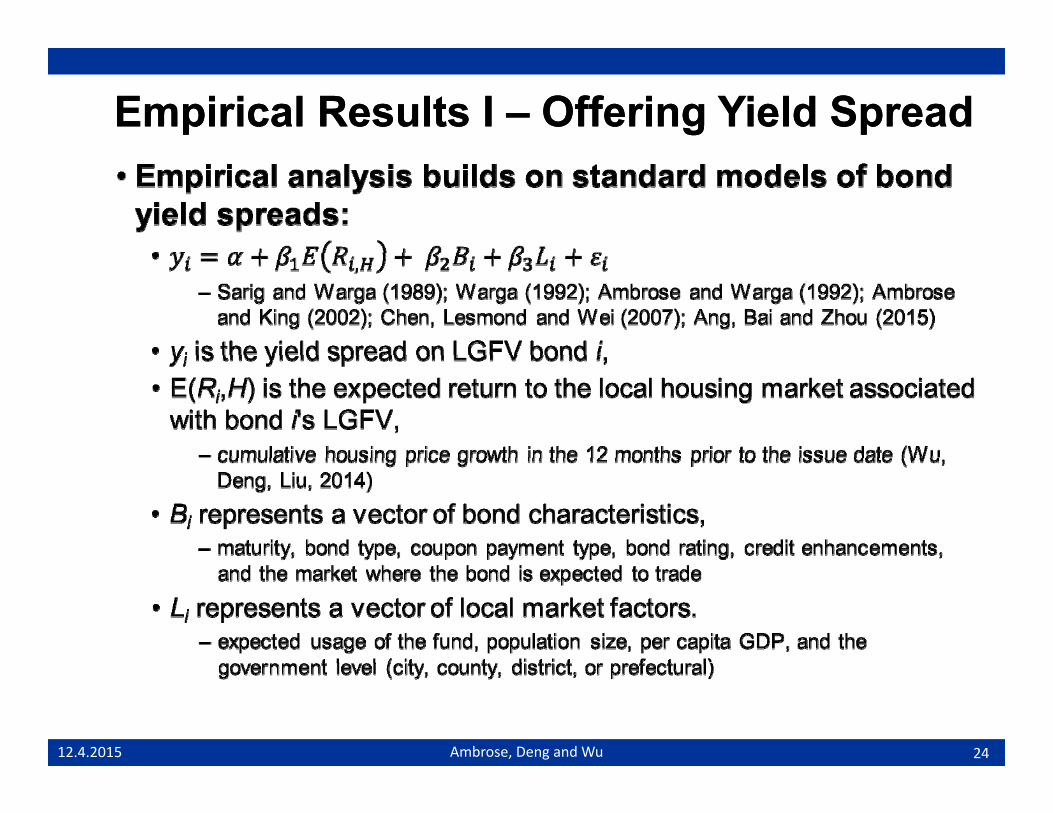
R h St tR h St tResearch StrategyResearch Strategy• Empirical analysis builds on standard models of yield spreads of
bonds issued by LGFVs.y G• Focusing on the effect of anticipated house price growths.
M i Fi diM i Fi diMain FindingsMain Findings• Areas with higher expected house price growth are able to issue debts
with lower risk premiums.p• The bond market also reacts to changes in local housing conditions.• No evidence that local governments or LGFVs have taken advantage
of such pattern
9
of such pattern.
12.4.2015 Ambrose, Deng and Wu
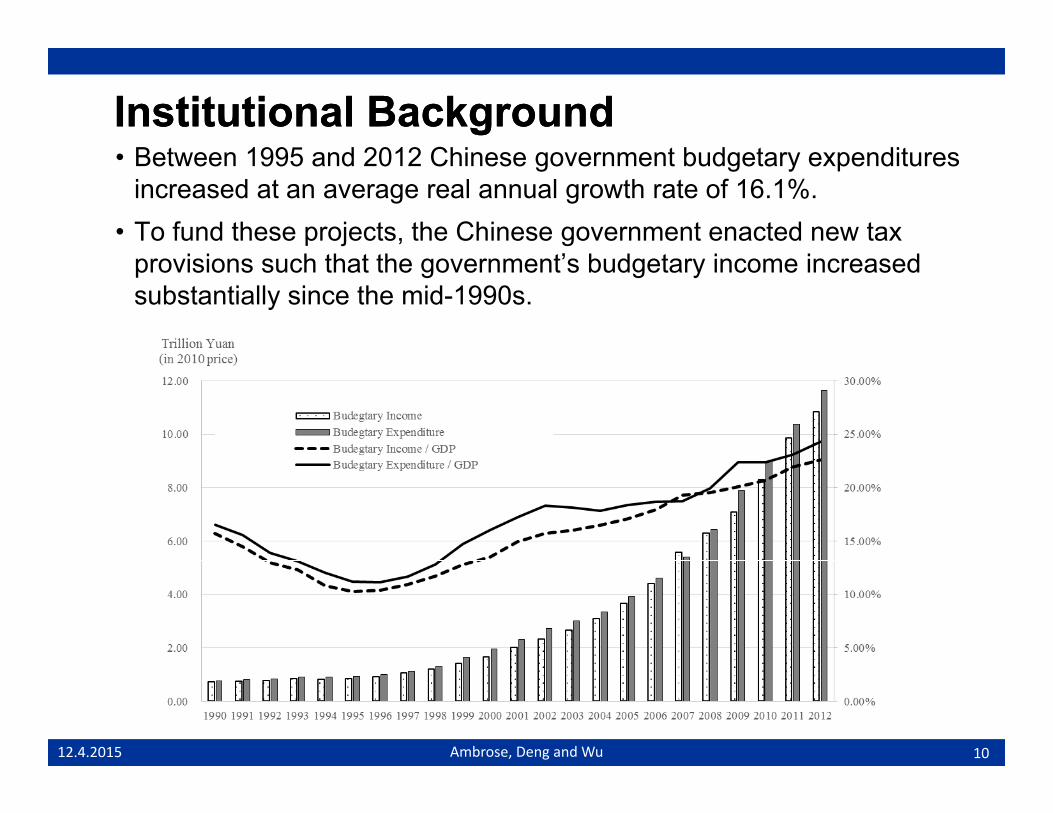
Institutional BackgroundInstitutional BackgroundB t 1995 d 2012 Chi t b d t dit• Between 1995 and 2012 Chinese government budgetary expenditures increased at an average real annual growth rate of 16.1%.
• To fund these projects, the Chinese government enacted new tax provisions such that the government’s budgetary income increased substantially since the mid-1990s.
1012.4.2015 Ambrose, Deng and Wu
Institutional BackgroundInstitutional Background
• The budgetary financial system in China:• In 1994 China established a “tax sharing system” (fen shui
zhi) under which each type of tax is shared by the central and local governments according to a stated percentage.
• Central gov’t receives 75% of the VAT local gov’t keeps• Central gov t receives 75% of the VAT, local gov t keeps 25%
• Central gov’t: corporate income tax from financial institutions and central SOE; local gov’t: corporate income tax from other firms
• All consumption tax goes to central gov’tAll consumption tax goes to central gov t• Personal income tax distribution: Central gov’t (60%),
local (40%) from 2003
1112.4.2015 Ambrose, Deng and Wu
Institutional BackgroundInstitutional Background• The budgetary financial system in China:
• It creates substantial budgetary gap for local governments since the tax reform of 1994.
Institutional BackgroundInstitutional Background• The budgetary financial system in China:
• The local governments are not authorized to levy sales tax, property tax, and in general cannot directly borrow from banks or issue bonds.
• The central government transfers a large portion of budgetary income back to local governments.
• But the transfer payments are generally concentrated in lessBut the transfer payments are generally concentrated in less developed areas, and the central government also places significant restrictions on the uses of most of these funds (e.g., cannot be used for infrastructure).
• Local governments have strong incentives to invest in large-scale urban infrastructure projects since such investments are effective in boosting local economic GDP growth, and GDP growth rate plays an g g g yimportant role in determining future political career of local government officials.
• Until very recently, local Chinese governments are prevented from y y g pdirectly issuing debt to fund mandated capital projects.
1312.4.2015 Ambrose, Deng and Wu
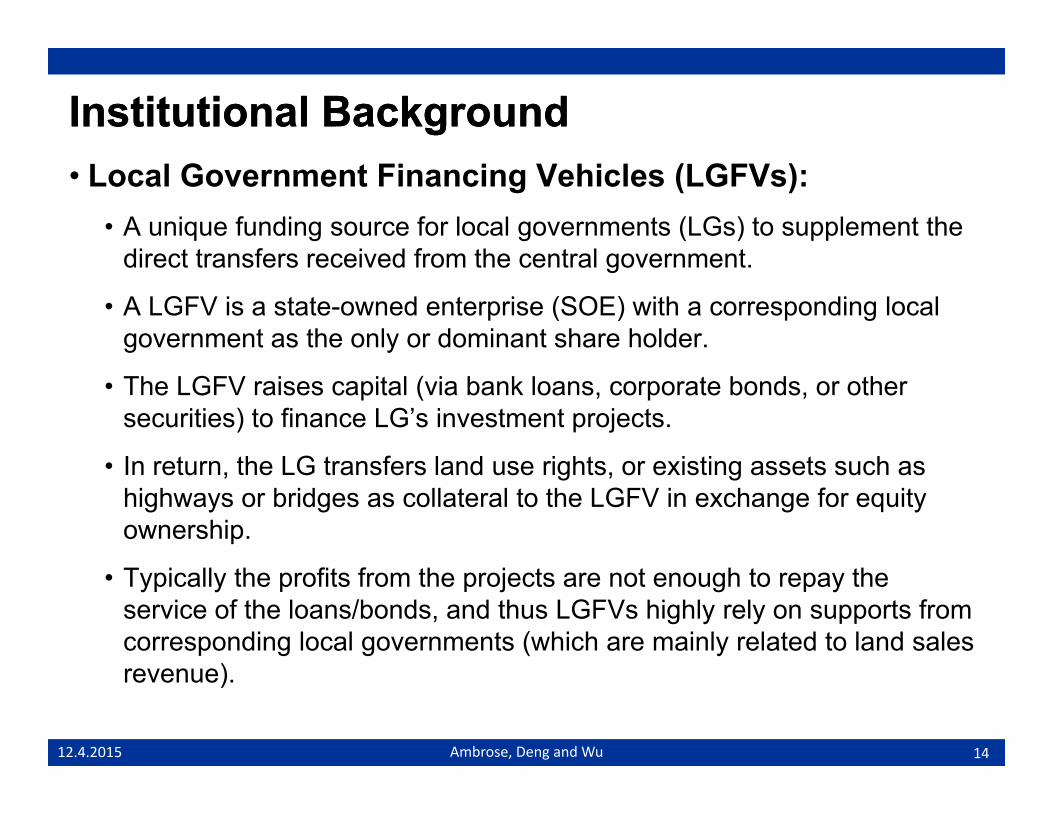
Institutional BackgroundInstitutional Background• Local Government Financing Vehicles (LGFVs):
• A unique funding source for local governments (LGs) to supplement the di t t f i d f th t l tdirect transfers received from the central government.
• A LGFV is a state-owned enterprise (SOE) with a corresponding local government as the only or dominant share holder.
• The LGFV raises capital (via bank loans, corporate bonds, or other securities) to finance LG’s investment projects.
I t th LG t f l d i ht i ti t h• In return, the LG transfers land use rights, or existing assets such as highways or bridges as collateral to the LGFV in exchange for equity ownership.
• Typically the profits from the projects are not enough to repay the service of the loans/bonds, and thus LGFVs highly rely on supports from corresponding local governments (which are mainly related to land sales
)revenue).
1412.4.2015 Ambrose, Deng and Wu
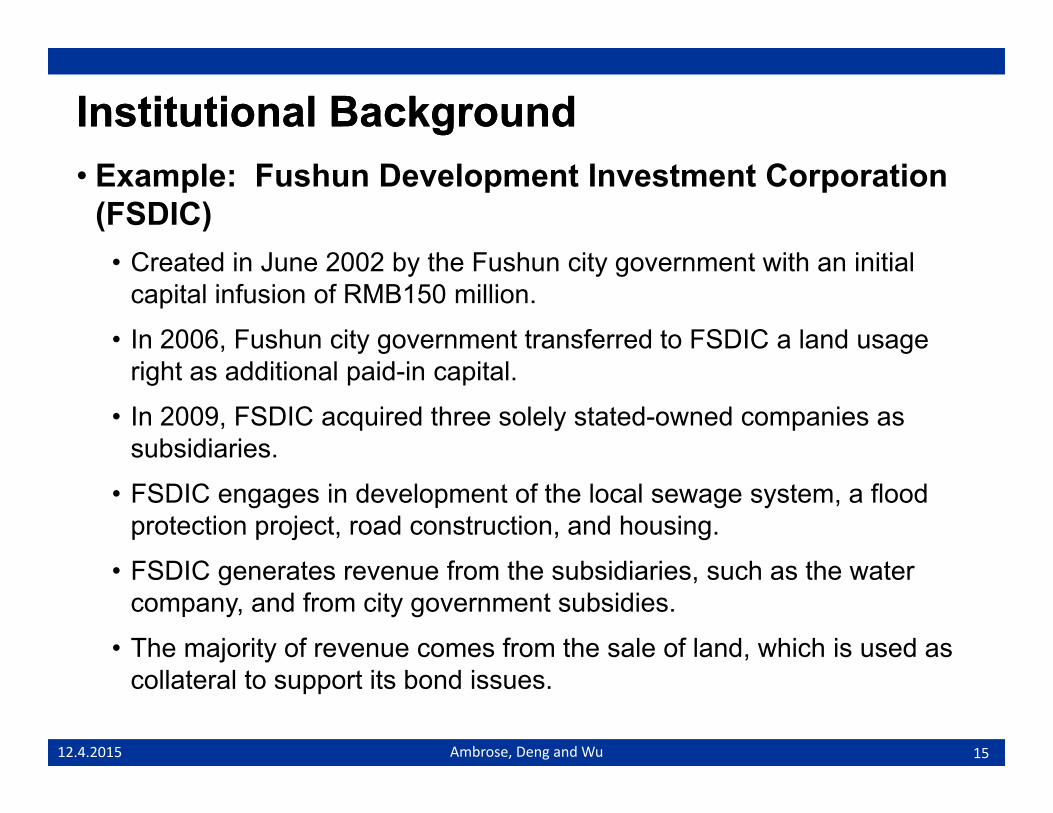
Institutional BackgroundInstitutional Background• Example: Fushun Development Investment Corporation
(FSDIC)C t d i J 2002 b th F h it t ith i iti l• Created in June 2002 by the Fushun city government with an initial capital infusion of RMB150 million.
• In 2006, Fushun city government transferred to FSDIC a land usage right as additional paid-in capital.
• In 2009, FSDIC acquired three solely stated-owned companies as subsidiaries.
• FSDIC engages in development of the local sewage system, a flood protection project, road construction, and housing.
S C f• FSDIC generates revenue from the subsidiaries, such as the water company, and from city government subsidies.
• The majority of revenue comes from the sale of land, which is used as collateral to support its bond issues.
1512.4.2015 Ambrose, Deng and Wu
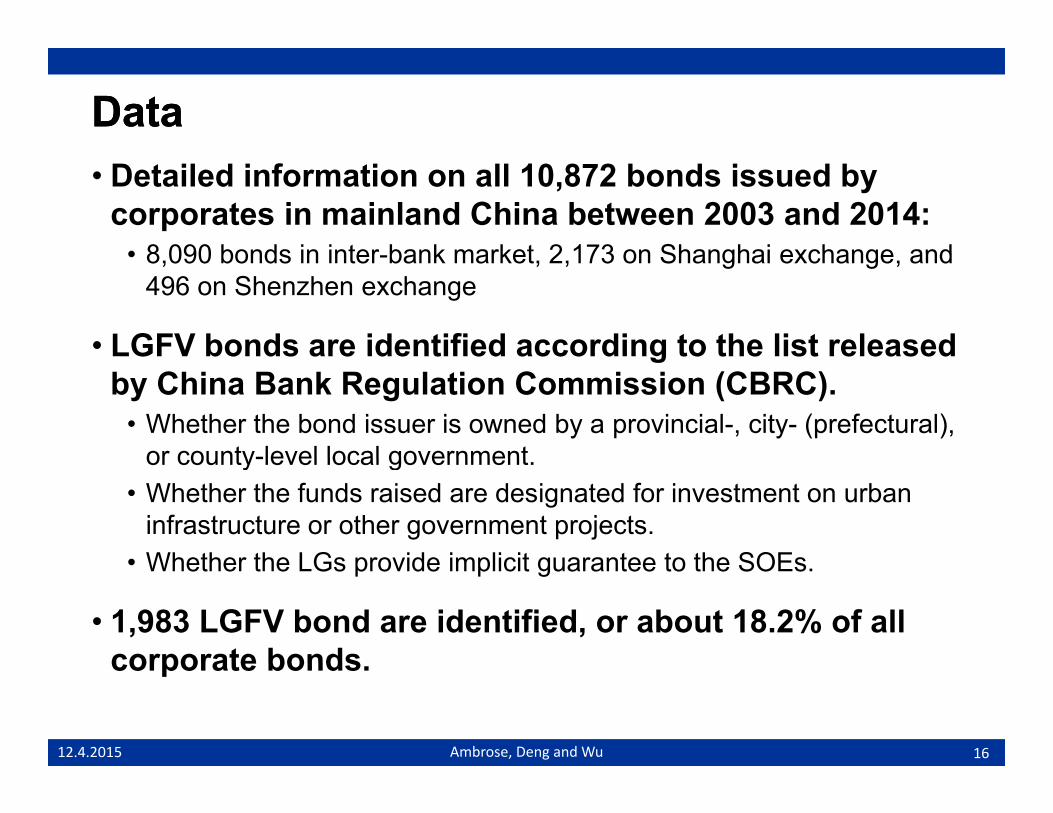
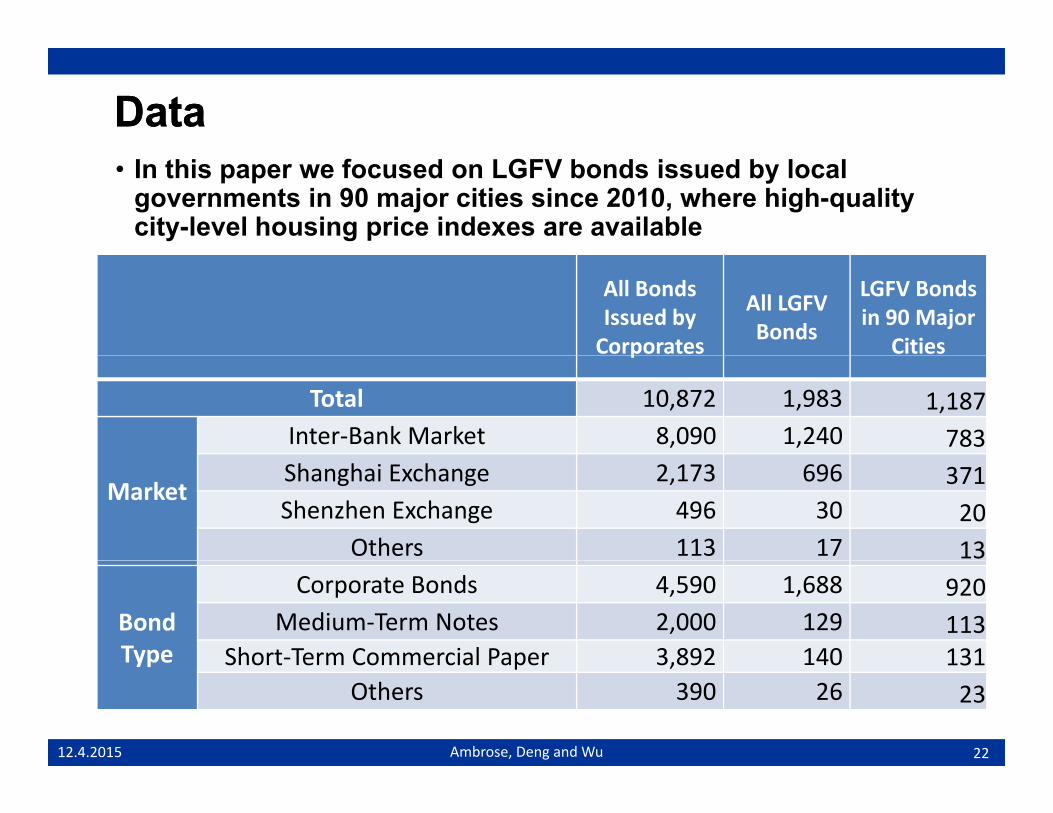
DataData• Detailed information on all 10,872 bonds issued by
corporates in mainland China between 2003 and 2014:• 8 090 bonds in inter bank market 2 173 on Shanghai exchange and• 8,090 bonds in inter-bank market, 2,173 on Shanghai exchange, and
496 on Shenzhen exchange
• LGFV bonds are identified according to the list releasedLGFV bonds are identified according to the list released by China Bank Regulation Commission (CBRC).
• Whether the bond issuer is owned by a provincial-, city- (prefectural), or county-level local governmentor county-level local government.
• Whether the funds raised are designated for investment on urban infrastructure or other government projects.
• Whether the LGs provide implicit guarantee to the SOEs• Whether the LGs provide implicit guarantee to the SOEs.
• 1,983 LGFV bond are identified, or about 18.2% of all corporate bondscorporate bonds.
1612.4.2015 Ambrose, Deng and Wu
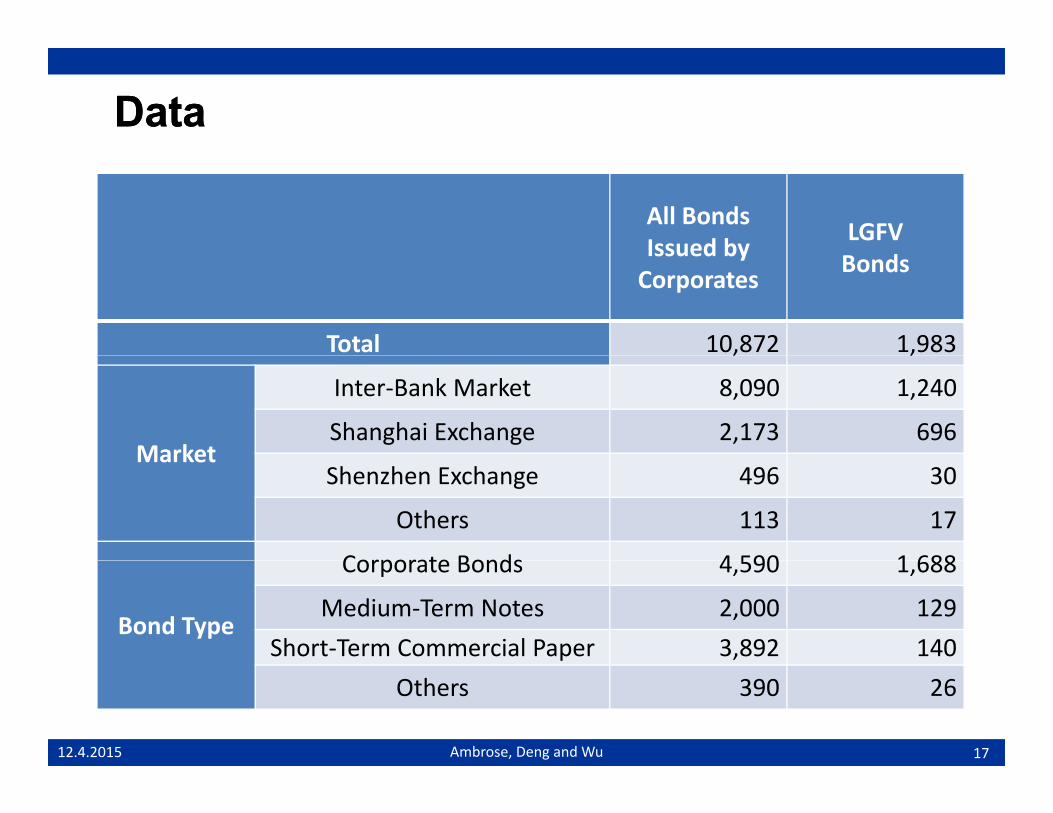
DataData
All Bonds Issued by LGFV Issued by
Corporates Bonds
Total 10,872 1,983, ,
Market
Inter-Bank Market 8,090 1,240
Shanghai Exchange 2,173 696Market
Shenzhen Exchange 496 30
Others 113 17
Corporate Bonds 4 590 1 688
Bond Type
Corporate Bonds 4,590 1,688
Medium-Term Notes 2,000 129Short-Term Commercial Paper 3,892 140
17
Others 390 26
12.4.2015 Ambrose, Deng and Wu
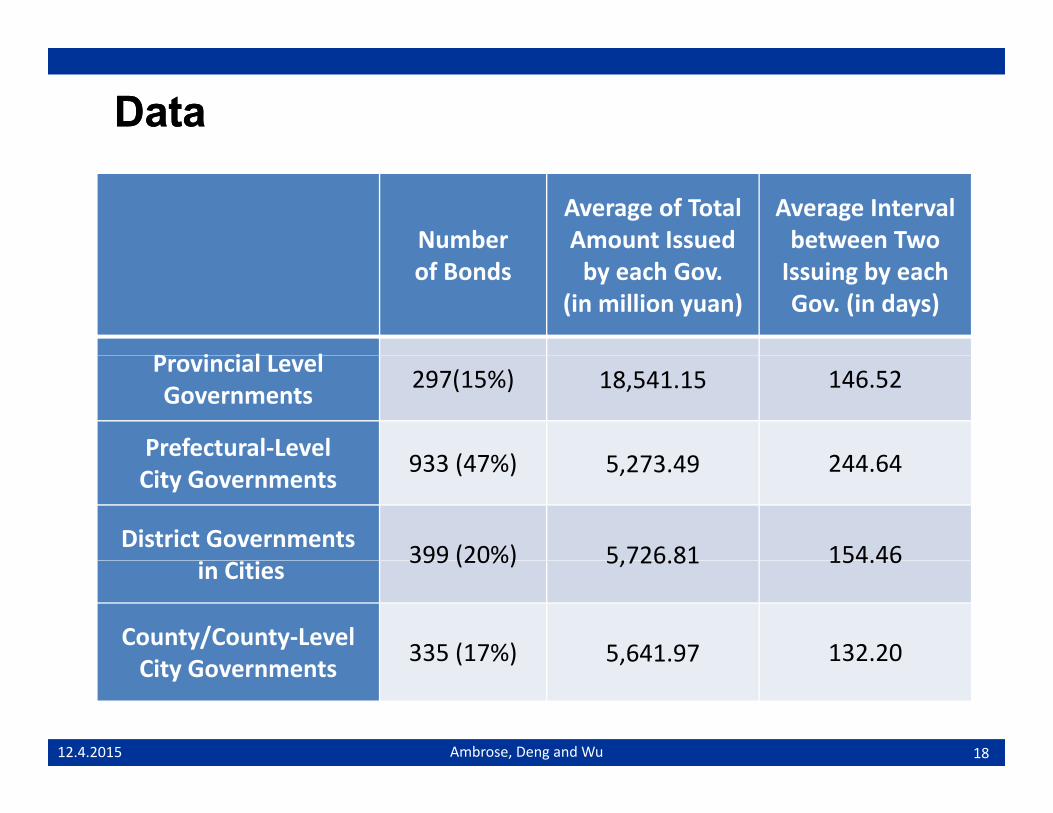
DataData
Number Average of Total Amount Issued
Average Interval between Two
of Bonds by each Gov. (in million yuan)
Issuing by each Gov. (in days)
P i i l L lProvincial Level Governments 297(15%) 18,541.15 146.52
yp Short Term Commercial Paper 3,892 140 131Others 390 26 23
12.4.2015 Ambrose, Deng and Wu
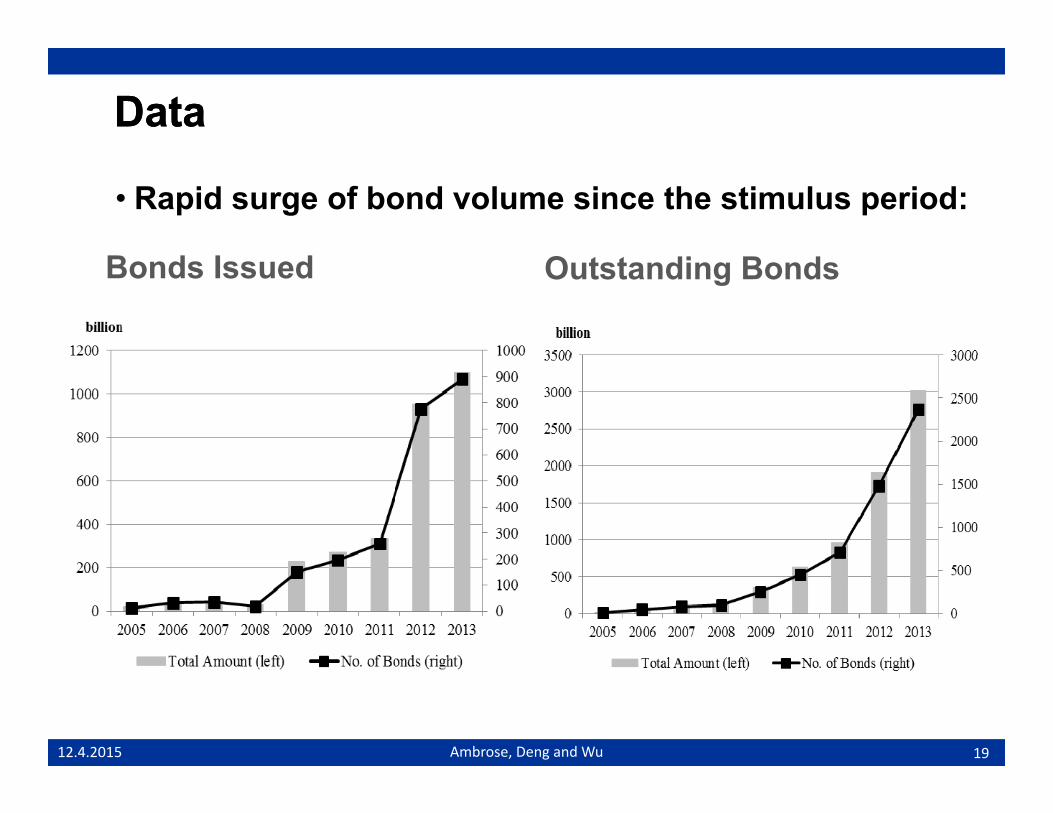
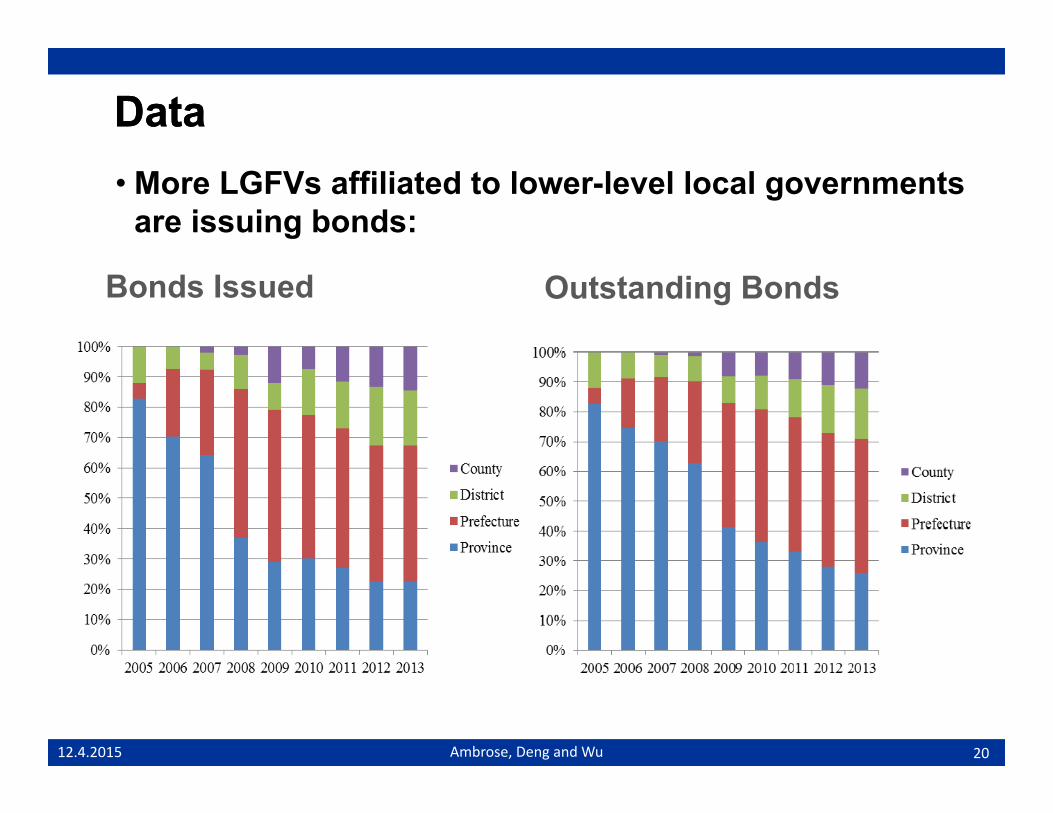
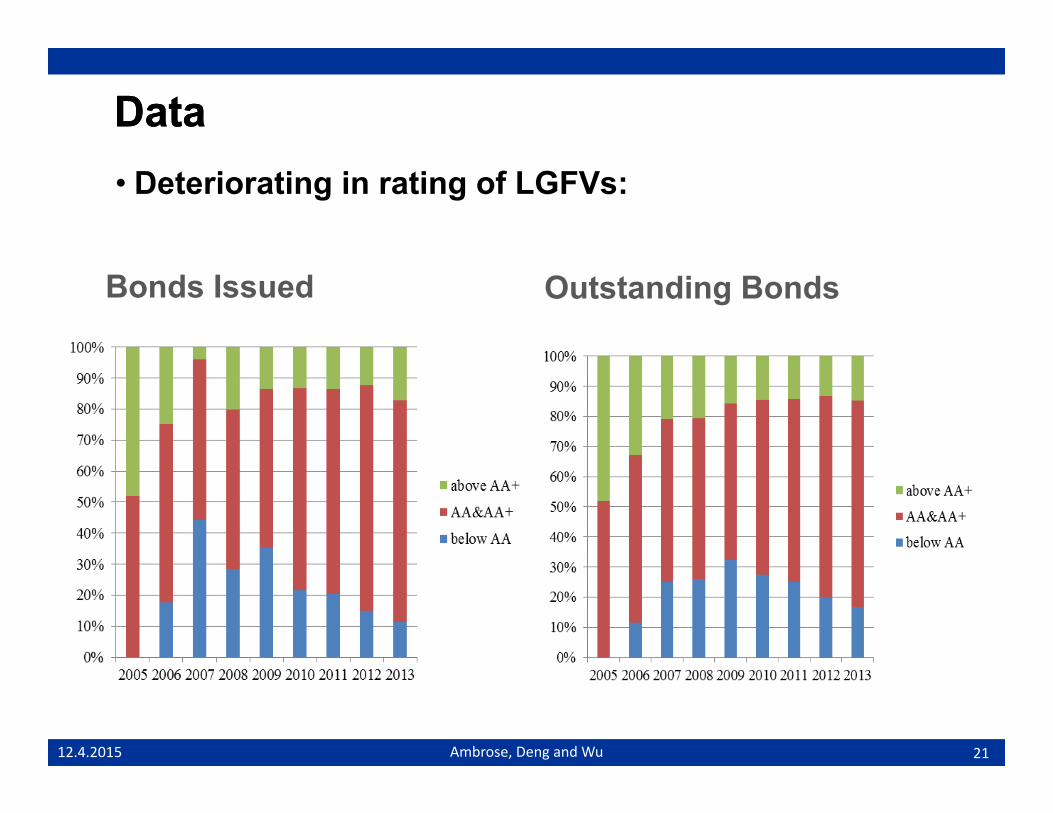
DataData• Preliminary evidence on the linkage with house price
Bonds Issued Outstanding Bonds
2312.4.2015 Ambrose, Deng and Wu
Empirical Results I Empirical Results I –– Offering Yield Spread Offering Yield Spread
2412.4.2015 Ambrose, Deng and Wu
Empirical Results I Empirical Results I –– offering yield premiumsoffering yield premiums
f f h iPerformance of the issuer of LGFV is not important
Rank of the corresponding LG and its economic strength are perceived tostrength are perceived to be important
Significant effect ofSignificant effect of housing market condition on long-term bonds
2512.4.2015 Ambrose, Deng and Wu
Empirical Results I Empirical Results I –– offering yield premiumsoffering yield premiums• Similar pattern does not apply to private firms or non-LGFV SOEs.
Issuers’ own performance is more important for non-LGFV SOEs and private firms
The effect of the rank of local government only exists for g yLGFVs
The linkage between housingThe linkage between housing market conditions and perceived risks only exists for LGFVs
2612.4.2015 Ambrose, Deng and Wu
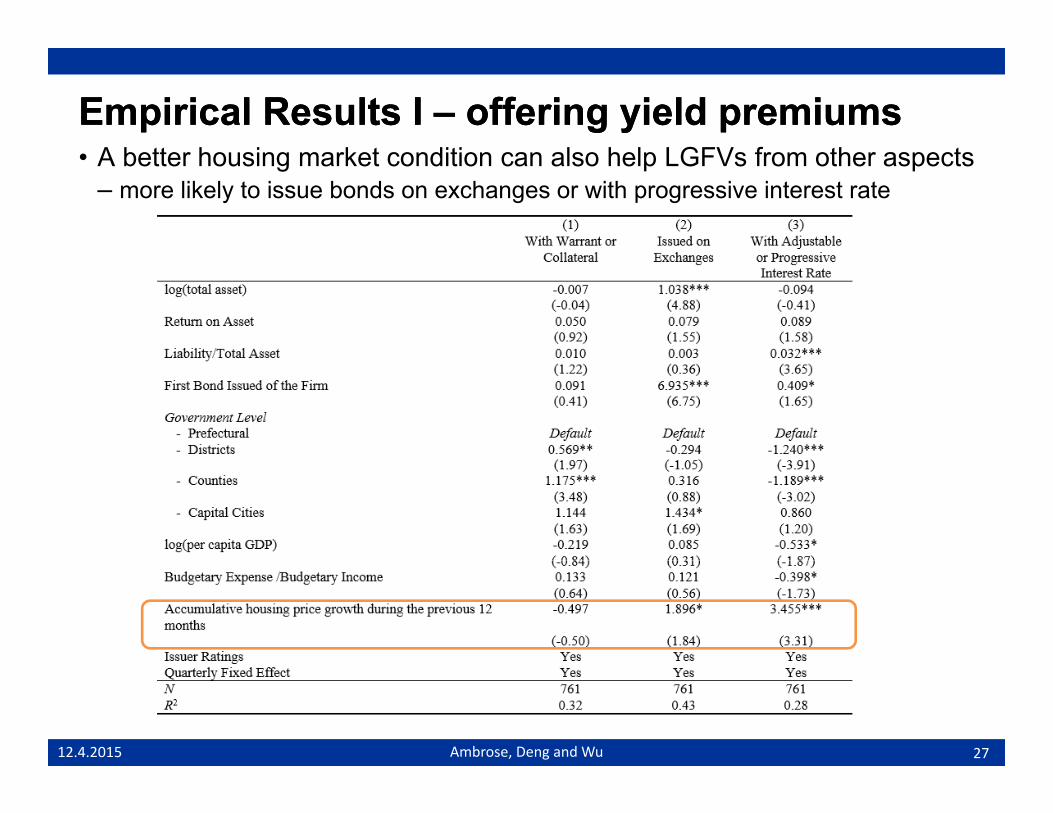
Empirical Results I Empirical Results I –– offering yield premiumsoffering yield premiumsA b tt h i k t diti l h l LGFV f th t• A better housing market condition can also help LGFVs from other aspects – more likely to issue bonds on exchanges or with progressive interest rate
2712.4.2015 Ambrose, Deng and Wu
Empirical Results II Empirical Results II –– Changes in Yield Spread Changes in Yield Spread • Do bond prices react to changes in local housing
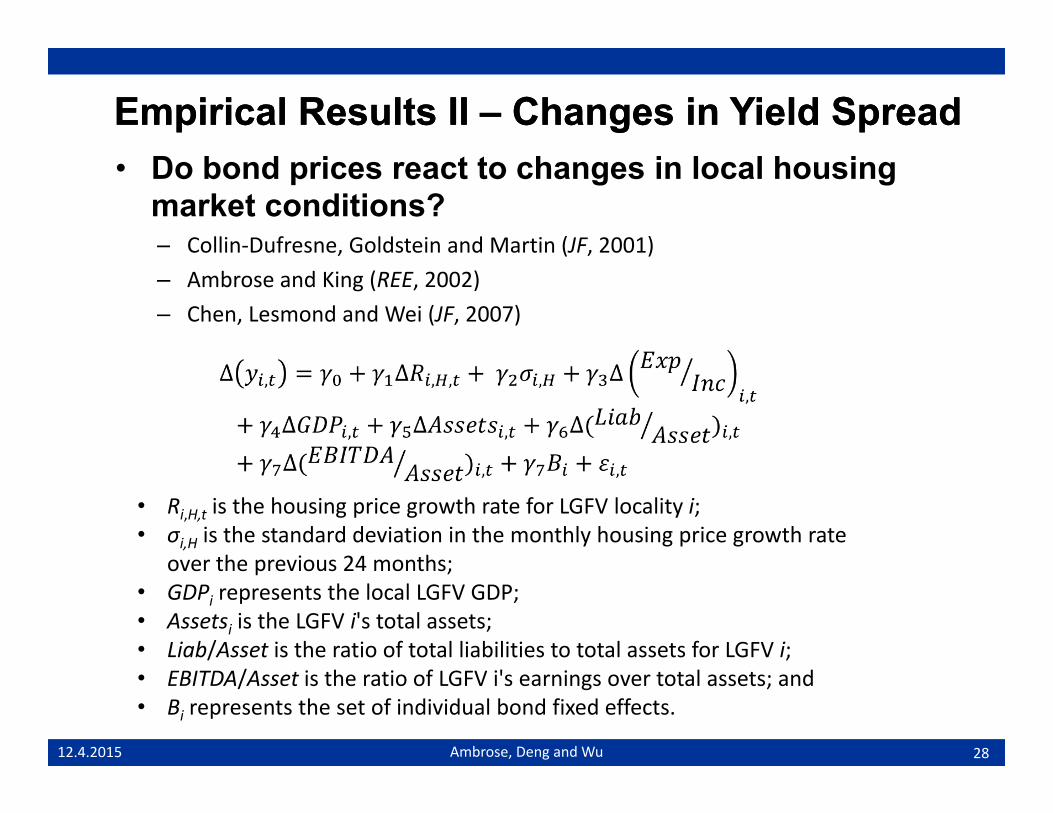
market conditions?– Collin-Dufresne, Goldstein and Martin (JF, 2001), ( , )– Ambrose and King (REE, 2002)– Chen, Lesmond and Wei (JF, 2007)
• Ri,H,t is the housing price growth rate for LGFV locality i; • σi,H is the standard deviation in the monthly housing price growth rate
over the previous 24 months;over the previous 24 months; • GDPi represents the local LGFV GDP;• Assetsi is the LGFV i's total assets;• Liab/Asset is the ratio of total liabilities to total assets for LGFV i;
2812.4.2015 Ambrose, Deng and Wu
• EBITDA/Asset is the ratio of LGFV i's earnings over total assets; and • Bi represents the set of individual bond fixed effects.
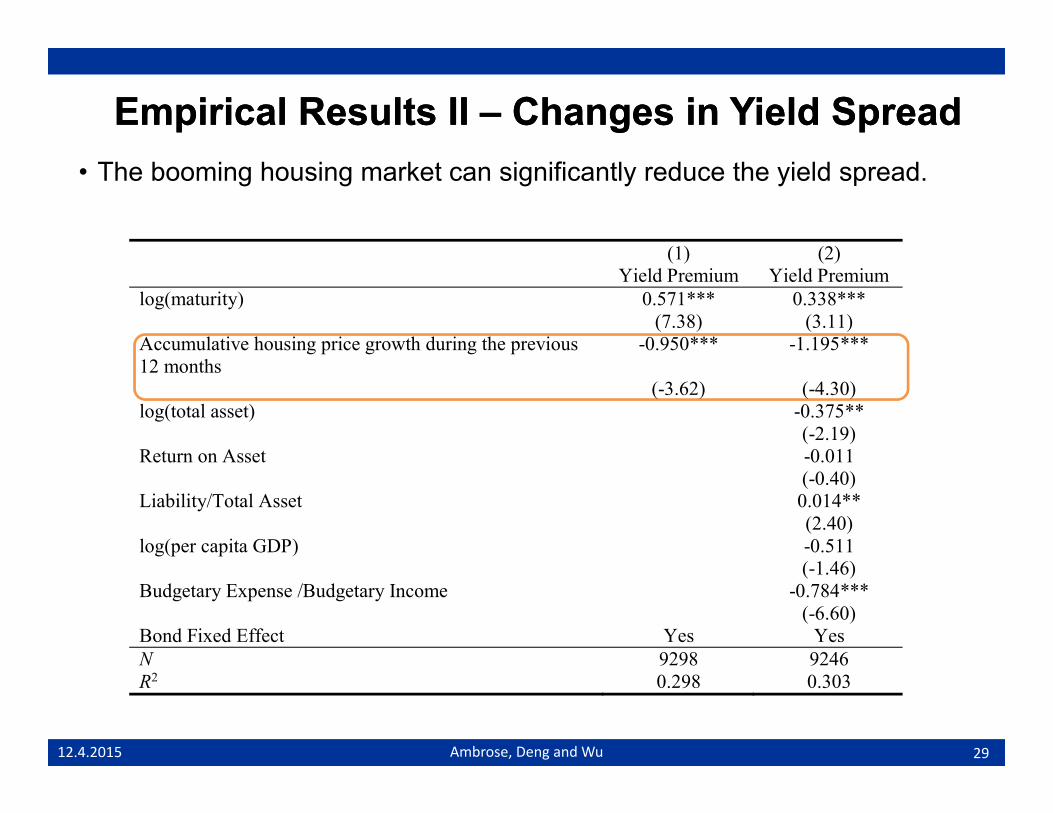
Empirical Results II Empirical Results II –– Changes in Yield SpreadChanges in Yield Spread• The booming housing market can significantly reduce the yield spread.
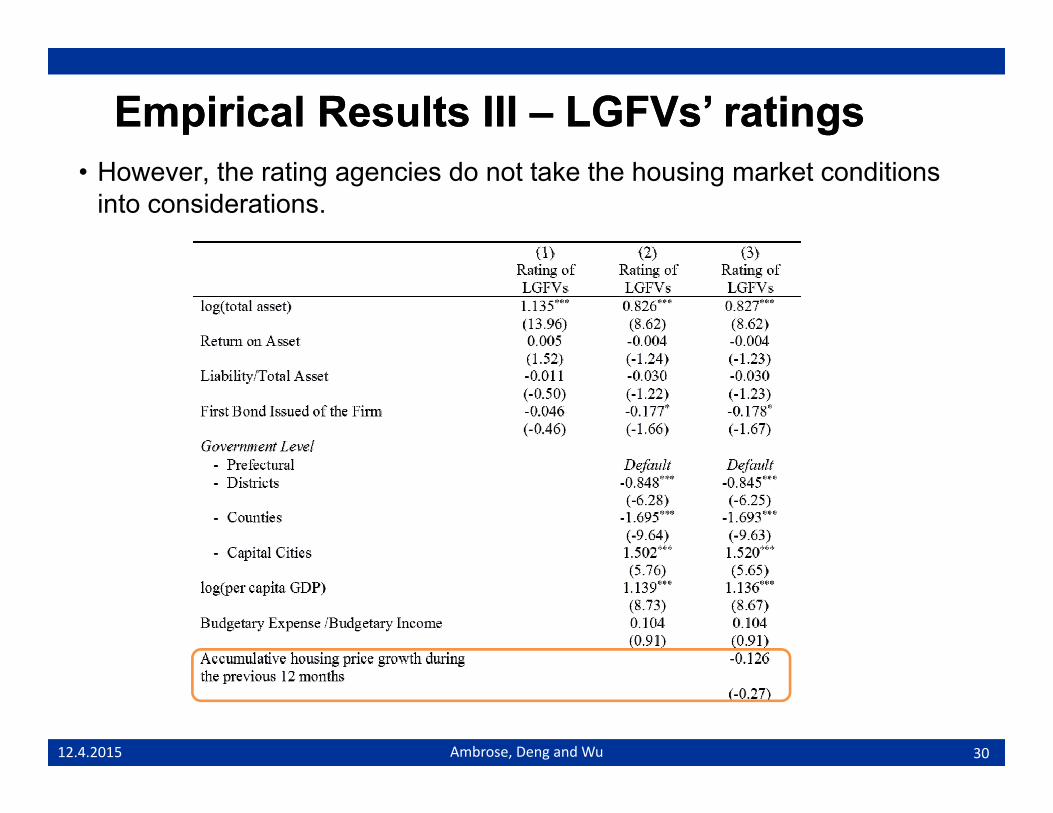
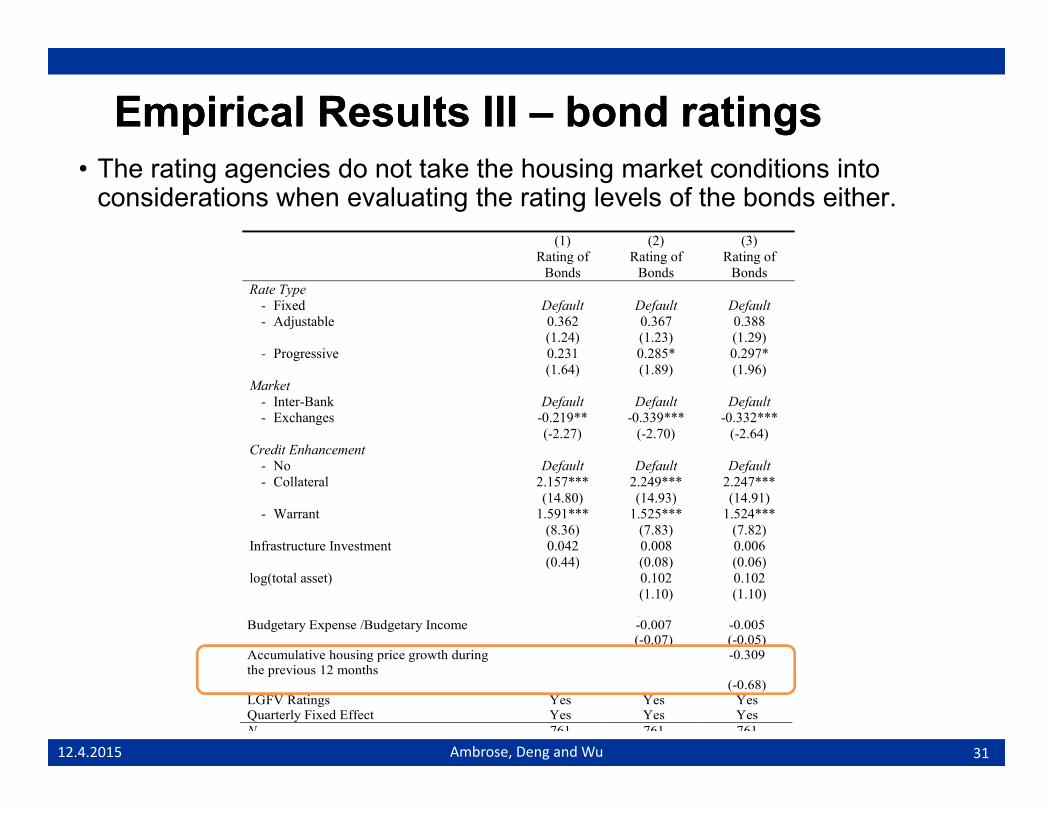
( ) ( )Budgetary Expense /Budgetary Income -0.007 -0.005
(-0.07) (-0.05) Accumulative housing price growth during -0.309
3112.4.2015 Ambrose, Deng and Wu
the previous 12 months (-0.68) LGFV Ratings Yes Yes Yes Quarterly Fixed Effect Yes Yes Yes N 761 761 761
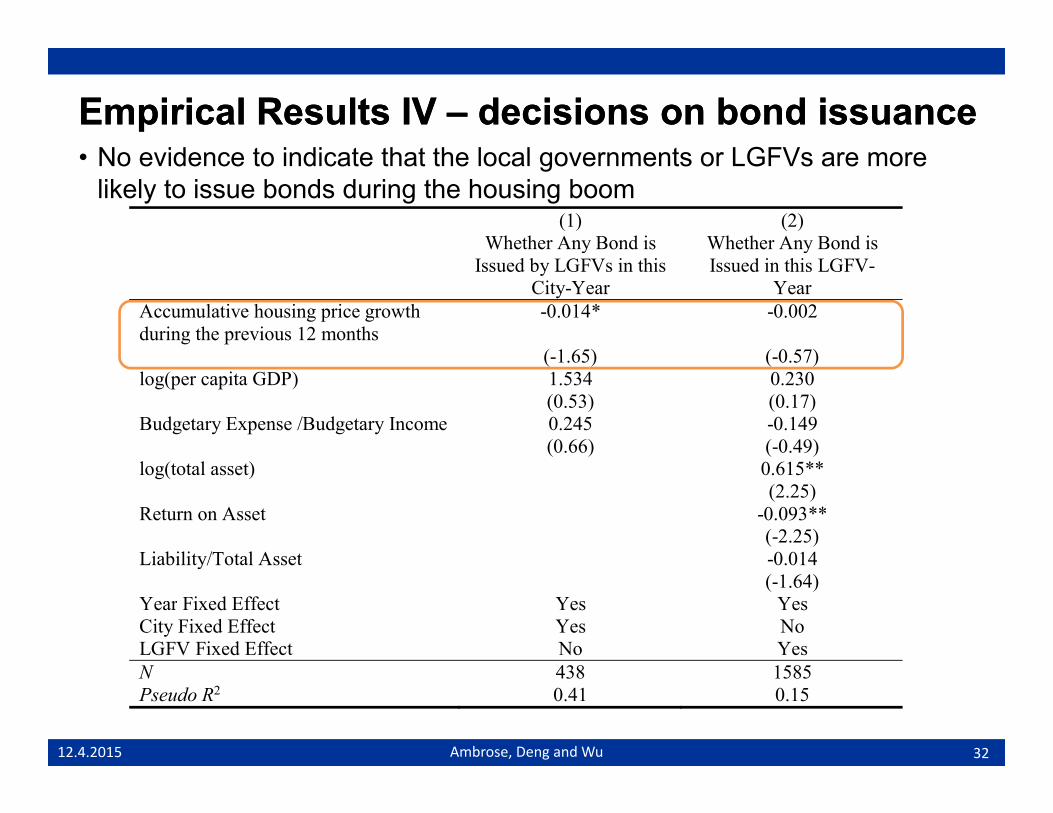
Empirical Results IV Empirical Results IV –– decisions on bond issuancedecisions on bond issuanceN id t i di t th t th l l t LGFV• No evidence to indicate that the local governments or LGFVs are more likely to issue bonds during the housing boom
(1) (2) Whether Any Bond is Whether Any Bond is y
Issued by LGFVs in this City-Year
yIssued in this LGFV-
Year Accumulative housing price growth during the previous 12 months
Empirical Results IV Empirical Results IV –– decisions on bond issuancedecisions on bond issuanceWith b tt h i k t diti th LGFV i lik l t• With a better housing market condition, the LGFV is even more likely to issue a bond with shorter period (column 1), smaller size (column 2),
3312.4.2015 Ambrose, Deng and Wu
Empirical Results V Empirical Results V –– delisted LGFVsdelisted LGFVs• CBRC regularly updated the list of LGFVs, and LGFVs would be
delisted when they are perceived to be profitable enough to survive without local governments’ financial supports.
– According to the CBRC document No. 2011-34, if a LGFV’s operating income can reasonably cover its debt service, it would be delisted from the LGFV list and treated as a normal SOE in their borrowing.
120014001600
600800
10001200
0200400
2010 2011 2012 2013 2014
3412.4.2015 Ambrose, Deng and Wu
Number of LGFVs DelistedNumber of LGFVs Delisted
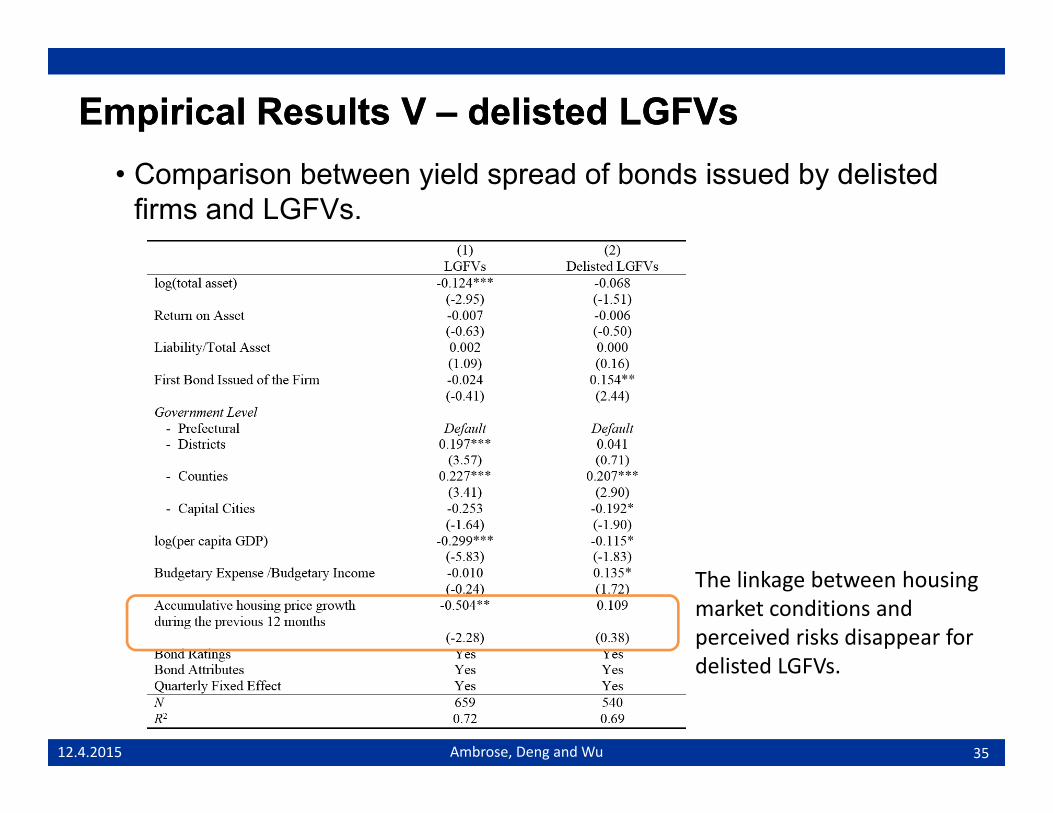
Empirical Results V Empirical Results V –– delisted LGFVsdelisted LGFVs• Comparison between yield spread of bonds issued by delisted
firms and LGFVs.
The linkage between housing market conditions and perceived risks disappear for delisted LGFVs
3512.4.2015 Ambrose, Deng and Wu
delisted LGFVs.
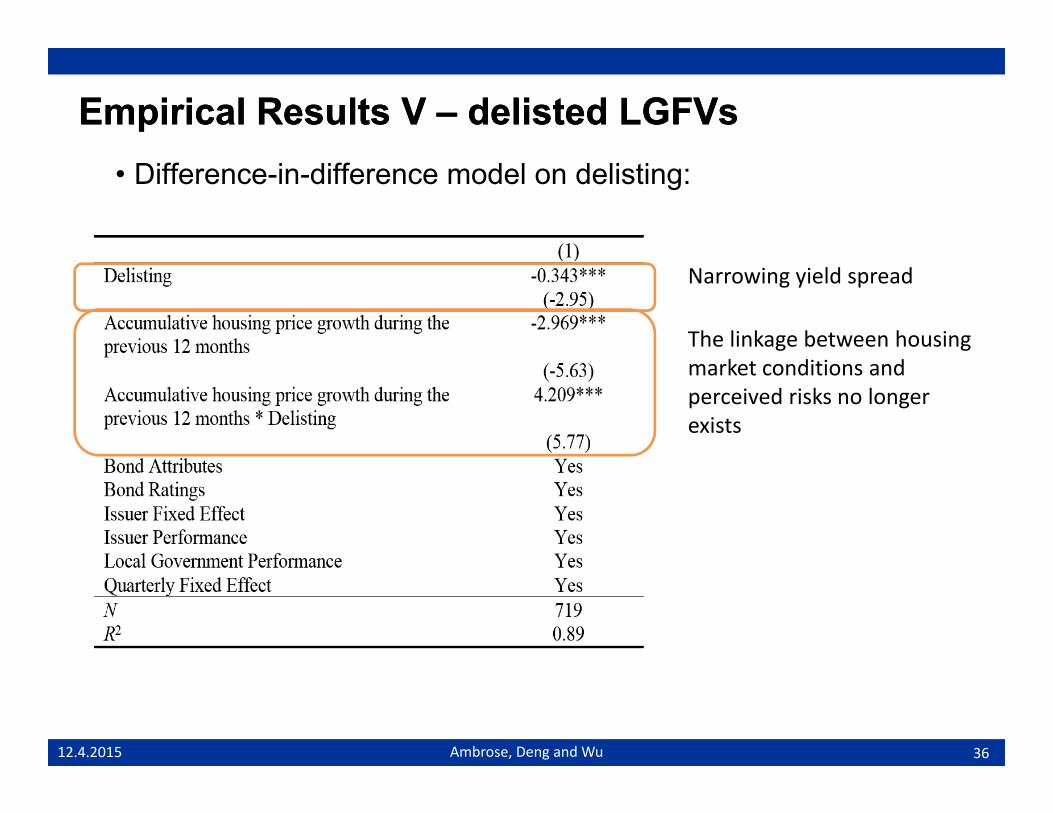
Empirical Results V Empirical Results V –– delisted LGFVsdelisted LGFVs• Difference-in-difference model on delisting:
Narrowing yield spread
The linkage between housing market conditions and perceived risks no longer exists
3612.4.2015 Ambrose, Deng and Wu
ConclusionsConclusions• The intertwining of local Chinese housing markets with government• The intertwining of local Chinese housing markets with government
fiscal policies is a result of the central government engaging in a number of reforms to China’s fiscal system. Chi h d l d i f di f l l t t• China has developed a unique funding source for local governments to obtain capital necessary to fund required large-scale infrastructure investments.
• We utilize a combination of several unique datasets to investigate how the market evaluates the risks associated with local government debt, especially focusing on the effect of housing market conditions.
– Our results indicate that areas with higher expected house price growth are able to issue debt with lower risk premiums.
– The bond market reacts to changes in local housing conditions, as expected.
– The results suggest that investors do price local housing risk into Chinese municipal bond risk premiums.
– However, we find no evidence that local governments tend to issue more bonds d i th h i k t b i i dduring the housing market booming period.