Understanding the Roles of Brønsted Acid and Nickel Sites in Microporous and Mesoporous Light Olefin Oligomerization Catalysts by Anton Nicholas Mlinar A dissertation submitted in partial satisfaction of the requirements for the degree of Doctor of Philosophy in Chemical Engineering in the Graduate Division of the University of California, Berkeley Committee in charge: Professor Alexis T. Bell, Chair Professor Enrique Iglesia Professor T. Don Tilley Fall 2013
Transcript
Understanding the Roles of Brønsted Acid and Nickel Sites in Microporous and Mesoporous Light Olefin Oligomerization Catalysts
by
Anton Nicholas Mlinar
A dissertation submitted in partial satisfaction of the
requirements for the degree of
Doctor of Philosophy
in
Chemical Engineering
in the
Graduate Division
of the
University of California, Berkeley
Committee in charge:
Professor Alexis T. Bell, Chair Professor Enrique Iglesia Professor T. Don Tilley
Fall 2013
Understanding the Roles of Brønsted Acid and Nickel Sites in Microporous and Mesoporous Light Olefin Oligomerization Catalysts
Understanding the Roles of Brønsted Acid and Nickel Sites in Microporous and Mesoporous Light Olefin Oligomerization Catalysts
by
Anton Nicholas Mlinar
Doctor of Philosophy in Chemical Engineering
University of California, Berkeley
Professor Alexis T. Bell, Chair The oligomerization of propene to produce higher molecular weight molecules was investigated as a model reaction pathway for the synthesis of liquid transportation fuels and fuel additives from C2 to C5 light olefins. In this scheme, light olefins could come from a variety of sources including the cracking of petroleum, as a byproduct in the production of hydrocarbons from synthesis gas during Fisher-Tropsch synthesis, or from the dehydration of alcohols created during biomass fermentation. Transformation of these light olefins into heavier molecules could allow for future production of transportation fuels from many carbon-rich sources, including natural gas, coal, and biomass, instead of the current system that relies almost exclusively on petroleum. Microporous and mesoporous Brønsted acidic and exchanged nickel materials are the most common heterogeneous catalysts for the oligomerization of light olefins into heavier products. Much is unknown about the role of the catalyst in influencing the oligomer size and the degree of oligomer branching – both characteristics crucial to the production of high quality liquid fuels – making the selection and design of appropriate oligomerization catalysts challenging. It was therefore the goal of this dissertation to establish how the catalyst site, proximity of sites, and catalyst support influence the final product distribution of oligomers. The discussion begins with an examination of the role of the acid site density in the Brønsted acidic zeolite H-MFI on the activity and selectivity to propene dimers. An increase in the aluminum site density, represented by a decrease in the catalyst Si/Al ratio from 140 to 10, was determined to decrease the conversion of propene to heavier products from 75% to 10% at 548 K. Examination of the reaction pathways for oligomer formation using kinetic analyses and DFT simulations indicate that site density influences the relative rates of oligomer growth and desorption. Specifically, the high loading of hydrocarbons in zeolites with low Si/Al ratios limit oligomer growth beyond the dimer lowering the propene conversion, as fewer oligomers are formed, but also increasing dimer selectivity due to the smaller concentration of long oligomers required for secondary cracking reactions. Regardless of the Si/Al ratio in H-MFI, the activity of the Brønsted acid sites for oligomer cracking and aromatic formation limit the control over the product distribution with these catalysts. To achieve better oligomer control and limit secondary oligomer
2
reactions, heterogeneous nickel-exchanged aluminosilicates were explored. These materials can achieve near complete conversion of ethene to oligomers with > 98% selectivity at high olefin pressures; however, the manner in which these catalysts convert light olefins into heavier products is not understood. Therefore, to determine any potential benefit to using these catalysts over Brønsted acidic zeolites, the reaction mechanism, state of nickel sites, and influence of catalyst support were investigated to determine their roles in catalyst activity and oligomer branching. A series of Ni-exchanged Na-X zeolites with various nickel loadings were successfully synthesized via aqueous ion exchange with nickel (II) nitrate and explored as propene oligomerization catalysts. Characterization of Ni-Na-X indicates that Ni remains Ni2+ both after synthesis and under reaction conditions, contrary to previous reports. Although all catalysts were > 98% selective to oligomers at 453 K and 1-5 bar propene pressure, the catalyst activity was determined to be a strong function of the nickel loading. At high nickel loadings, the catalyst is active immediately upon exposure to propene but deactivates rapidly to 0% conversion. As the nickel loading is decreased below 1 wt%, however, the catalyst exhibits low initial activity and instead activates with time on stream, before deactivating and reaching a non-zero steady-state activity after more than 2000 min of time on stream. Development of a reaction network and subsequent microkinetic model indicates that the activation period is caused by migration of Ni2+ cations from inaccessible positions of the zeolite to the supercage, where catalysis occurs. The subsequent catalyst deactivation is caused by complexation of nearby sites within the zeolite supercage leaving only isolated Ni2+ sites active at steady state. Once an understanding of the time on stream activity profile was established, the role of the support on the catalyst activity and degree of dimer branching was examined. Exchanging the non-catalytic co-cation in the zeolite, Na+ in Ni-Na-X, for other alkali metal and alkaline earth co-cations was determined to influence both the propene oligomerization activity and dimer isomer distribution. Specifically, Li+, the smallest alkali metal co-cation, and Sr2+, the largest alkaline earth co-cation examined, led to the highest dimer branching and catalyst activity per Ni2+ cation in their respective groups. It was determined that this effect was caused by both larger cations expanding the zeolite lattice and alkali metal cations present in the zeolite supercage taking up otherwise open pore volume. This led to the conclusion that space around the Ni2+ cations in the supercage is what governs catalytic activity and dimer branching in these catalysts. The realization that space around the Ni2+ site controls catalyst activity led to the exploration of larger mesoporous aluminosilicate structures as potentially more active propene oligomerization catalysts. To this end, Ni-exchanged MCM-41 and MCM-48 (pore size = 23 Å) and SBA-15 (pore size = 57 Å) were synthesized and examined as oligomerization catalysts. It was determined that the same principles established in zeolites for making an active catalyst, such as high Ni2+ dispersion, were still applicable to these larger-pored systems. As predicted, further increasing the space around the active site did increase the catalyst activity with the highest activity per Ni2+ site existing for the SBA-15 material. The decreased steric constraints from the support in these structures, however, led to increased trimer production as well as catalyst deactivation caused by heavy molecules depositing in the pores. The more open environment also resulted in less control over the degree of dimer branching causing all mesoporous catalysts to produce a 49/51 mixture of branched to linear dimers at 453 K and 1 bar propene pressure.
i
To my wife, Laurie and in loving memory of Mom
ii
Table of Contents List of Figures ................................................................................................................v List of Tables .............................................................................................................. xi List of Abbreviations and Symbols ............................................................................. xii Acknowledgements .................................................................................................... xiv Chapter 1: Introduction ................................................................................................ 1 Chapter 2: Effects of Brønsted Acid Site Proximity on the Oligomerization of Propene in H-MFI .................................................................................................. 5 Abstract ............................................................................................................ 5
2.3 Results and Discussion ............................................................................... 8 2.3.1 Experimental Catalyst Activity and Selectivity ........................... 8 2.3.2 In-situ FTIR Experiments ........................................................... 9 2.3.3 Effect of the Si/Al Ratio on Catalyst Activity and Selectivity ....................................................................................... 9 2.3.4 Theoretical Analysis of the Effects of Si/Al Ratio .................... 14 2.3.5 Consequences of Si/Al Ratio Effect on Formation of Aromatics ...................................................................................... 15
2.4 Conclusions ............................................................................................... 15 2.5 Supplemental Information ........................................................................ 16
2.5.1 Examination of Internal Mass Transfer Limitations ................. 16 2.5.2 Derivation of Eqn. 5 ................................................................... 16
Chapter 3: Propene Oligomerization over Ni-Exchanged Na-X Zeolites ................. 30
3.4 Discussion ................................................................................................ 35 3.4.1 Activation Period ...................................................................... 35
iii
3.4.2 Deactivation Period .................................................................... 37 3.4.3 Modeling Catalytic Activity with Time on Stream .................... 37
3.5 Conclusions ............................................................................................... 41 3.6 Supplemental Information ........................................................................ 42
3.6.1 Characterization of As-Prepared 0.6 wt% Ni-Na-X .................. 42 3.6.2 Characterization of 0.6 wt% Ni-SiO2 ......................................... 42 3.6.3 Steady-State Pressure and Temperature Dependences of 0.6 wt% Ni-Na-X ...................................................................... 42 3.6.4 Investigation of Pore Filling ...................................................... 43 3.6.5 Derivation of Eqn. 8 ................................................................... 43
Chapter 4: The Role of Non-Catalytic M Cations on the Activity and Selectivity of Ni-M-X Zeolites for Propene Oligomerization ............................................... 62 Abstract .......................................................................................................... 62 4.1 Introduction ............................................................................................... 62 4.2 Methods..................................................................................................... 63
4.4 Discussion ................................................................................................ 66 4.4.1 Catalyst Activity with Time on Stream ..................................... 66 4.4.2 Steady-State Catalyst Activity ................................................... 67 4.4.3 Dimer Isomer Distribution ........................................................ 68 4.4.4 Apparent Activation Energies and Pre-Exponential Factors ........................................................................................... 70
4.5 Conclusions ............................................................................................... 70 4.6 Supplemental Information ........................................................................ 71
4.6.1 X-ray Diffraction Data for Ni-M-X Catalysts ........................... 71 4.6.2 Calculation of Supercage Free Volume in Ni-M-X Zeolites .......................................................................................... 71
Chapter 5: Propene Oligomerization using Alkali Metal- and Nickel-Exchanged Mesoporous Aluminosilicate Catalysts ..................................................................85
5.3 Results and Discussion .............................................................................88 5.3.1 Catalyst Characterization ............................................................88 5.3.2 Effects of Ni Loading and Si/Al Ratio ........................................89 5.3.3 Role of the Alkali Metal Cations ...............................................90
iv
5.3.4 Comparison of Ni-Na-MCM-41 to other Heterogeneous Ni Catalysts .........................................................................................91
5.4 Conclusions ................................................................................................93 5.5 Supplemental Information .........................................................................93
5.5.1 Synthesis of Additional Ni-Exchanged Mesoporous Aluminosilicates ............................................................................93 5.5.2 X-ray Diffraction Measurements of MCM-41 and MCM-48 .....94 5.5.3 Temperature-programmed Reduction of Ni-Na-MCM-41 .........94 5.5.4 Activity and Selectivity Comparison of Ni-H-MCM-41 and Ni-Na-MCM-41 .............................................................................94
v
List of Figures Figure 1.1 Propene oligomerization pathway illustrating the formation of higher
molecular weight oligomer molecules as well as examples of the types of dimer isomers that can be produced ....................................................................... 3
Figure 2.1 a) Propene conversion and b) selectivity to hexene in H-MFI zeolites
as a function of temperature and Si/Al ratio ......................................................... 18 Figure 2.2 Conversion of propene, selectivity to hexene, and yield of hexene as a
function of Si/Al ratio in H-MFI at 513 K .......................................................... 19 Figure 2.3 Effects of temperature on the concentrations of C4, C5, and C6
products (left axis) and the C4/C5 ratio (right axis) for propene oligomerization carried out with H-MFI (Si/Al = 40) .................................................................... 19
Figure 2.4 Effect of temperature on FTIR spectra of H-MFI (Si/Al = 40) taken
during the exposure of the catalyst to propene (0.02 bar diluted in helium) ........ 20 Figure 2.5 a) Effects of temperature and Si/Al ratio on the intensity of the IR
peak observed at ca. 1610 cm-1 attributed to aromatic species normalized by the amount of aluminum present in the pellet. b) Change in the intensity of the band at 1610 cm-1 observed at 573 K as a function of time and Si/Al ratio. The spectrum for H-MFI (Si/Al = 140) is similar to that for the H-MFI (Si/Al = 40) catalyst and is not shown for the sake of clarity ............................................ 21
Figure 2.6 Simplified reaction pathway of propene oligomerization on a Brønsted
acid catalyst neglecting side reactions such as cyclization, aromatization, hydrogenation, and the desorption of species larger than the dimer from the surface .................................................................................................................. 22
Figure 2.7 The effect of Si/Al ratio on the fraction of the pore volume of H-MFI
occupied by oligomers assuming every active site were occupied by dimers or trimers ................................................................................................................... 22
Figure 2.8 Value of α from Eqn. 7 as a function of Si/Al ratio ................................. 23 Figure 2.9 Effect of Si/Al ratio on the rate of propene consumption normalized to
the rate of propene consumption at Si/Al = 140. The experimental data were taken from Figure 2 and the model results come from Eqn. 9 ............................. 23
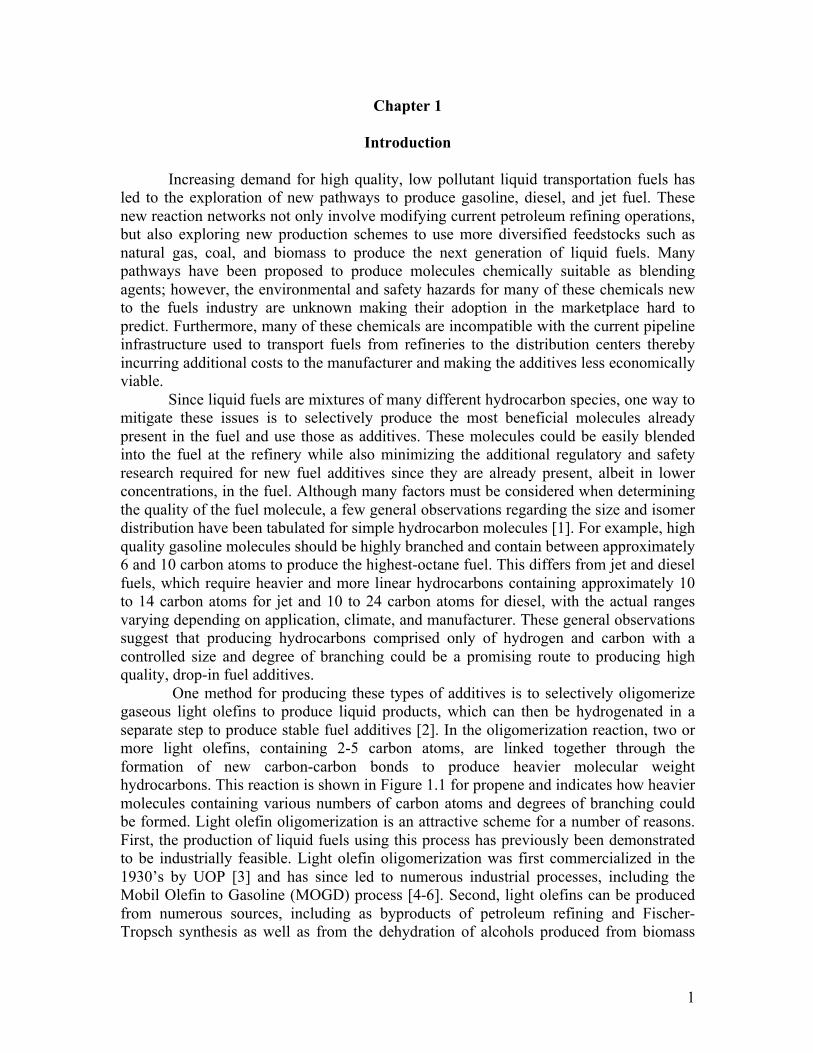
Figure 2.10 View of the central region of a T276 cluster representation of H-MFI.
Oligomerization reactions occur at the central Al site at the T12 position, which is described by quantum mechanics. The rest of the framework including the two next nearest neighbor Al sites containing adsorbed C6-Z species are described by molecular mechanics ..................................................... 24
vi
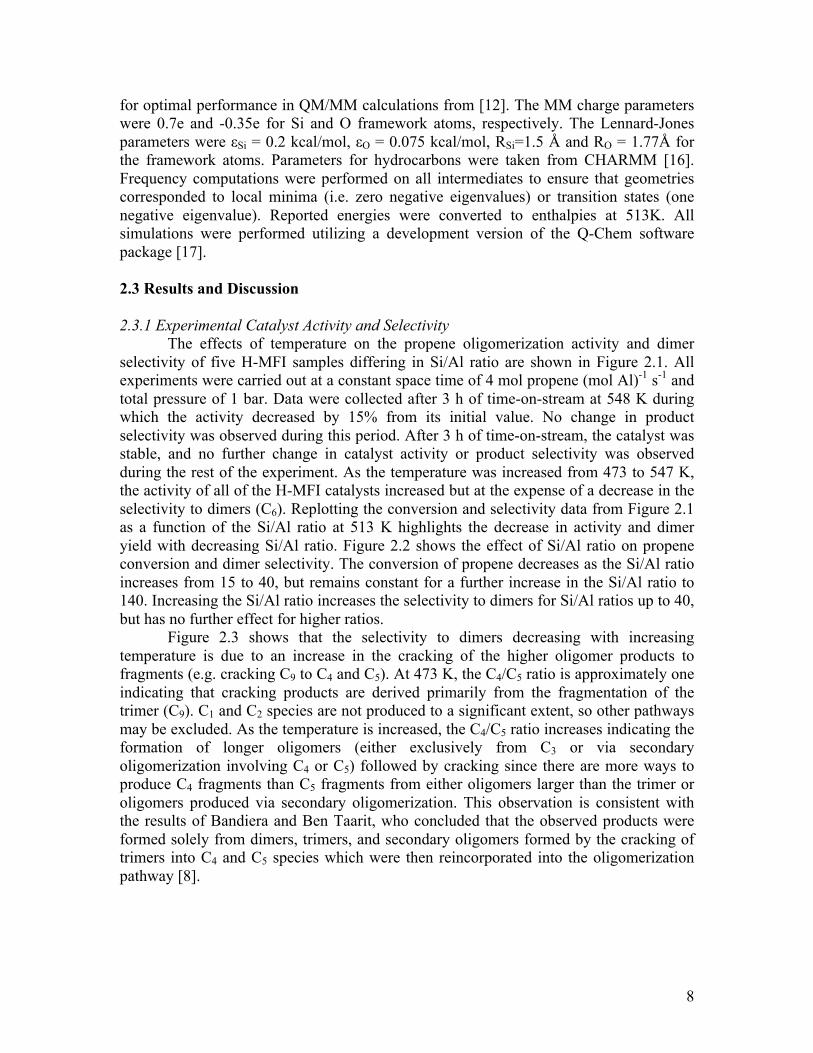
Figure 2.11 Reaction coordinate diagram for the absorption and dimerization of
propene in the presence of NNN C6-Z groups in low Si/Al ratio H-MFI. The 1’ pathway is for the reaction with the primary propene alkoxide species and the 2’ pathway is for the secondary propene alkoxide ......................................... 24
Figure 2.12 Van der Waals surfaces for the trimerization transition state
occurring when NNN C6-Z groups are present. The reacting propene and hexene (blue) take up enough space in the zeolite such that the NNN C6-Z groups (orange) crowd the reaction ...................................................................... 25
Figure 2.13 Reaction coordinate diagram for the formation of C9 via the 1’ and 2’
pathways in the presence of NNN C6-Z groups that occur in low Si/Al ratio MFI ....................................................................................................................... 25
Figure 2.14 Reaction coordinate diagram comparing C9-Z formation with or
without NNN C6-Z groups in low Si/Al ratio and high Si/Al ratio H-MFI, respectively ........................................................................................................... 26
Figure 2.15 SEM images of two H-MFI zeolites with Si/Al = 23 used for internal
mass transfer examination a) 500 nm average diameter b) 300 nm average diameter ................................................................................................................ 27
Figure 3.1 Ni loading and degree of site exchange of Ni-Na-X catalysts
determined from elemental analysis as a function of the nickel nitrate concentration used in the aqueous ion exchange synthesis .................................. 45
Figure 3.2 TPR profiles of 9.3 wt% Ni-Na-X catalyst exchanged in water and
bulk NiO deposited on SiO2 as a reference. The peak at 715 K is due to the reduction of bulk NiO, the peak at 940 K is due to the reduction of exchanged Ni sites, and the peak at ca. 1025 K is due to collapse of the zeolite framework ............................................................................................................ 46
Figure 3.3 Ni XANES spectra for 9.3 wt% and 0.6 wt% Ni-Na-X catalysts after
calcination, 0.6 wt% Ni-Na-X after 90 min time on stream at 453 K and 1 bar propene pressure, and NiO and Ni foil standards ................................................. 46
Figure 3.4 a) Propene oligomerization activity and b) rate of propene
consumption of Ni-Na-X catalysts with varying Ni loadings at 453 K and 1.25 bar propene pressure. The selectivity to oligomer products was >98% for all time on stream ...................................................................................................... 47
Figure 3.5 Effect of propene partial pressure on the activation and deactivation
periods of the 0.6 wt% Ni-Na-X at 453 K ............................................................ 48
vii
Figure 3.6 High temperature treatment of 0.6 wt% Ni-Na-X with 5 bar propene pressure leading to faster activation and deactivation. After the 493 K treatment, the reactor was cooled to 393-453 K and exhibited stable oligomerization activity ........................................................................................ 48
Figure 3.7 Effects of the catalyst support on activation and deactivation of 0.6
wt% supported Ni catalysts at 453 K and 5 bar propene pressure. The Ni-Na-X catalyst required activation whereas the SiO2 supported Ni and Ni-Na-MOR catalysts activated in less than 10 min permitting only the observation of the deactivation period ............................................................................................... 49
Figure 3.8 The faujasite framework illustrating the SI and SII crystal positions
(adapted from [23]). Also shown is the activation mechanism for the catalyst in the presence of propene. 1) After in situ calcination to 773 K, Ni2+ cations occupy the SI positions causing distortions in the hexagonal prism. 2) Presence of propene and lower temperature cause Ni2+ cations to migrate into the SII positions located in the sodalite cages. 3) Once in the sodalite cage, Ni2+ complexes with propene causing the formation of the active species within the zeolite supercage ................................................................................. 50
Figure 3.9 Rate of propene consumption for Ni-Na-X catalysts with various Ni
loadings at 453 K and 1.25 bar propene pressure at peak activity and 90 min after peak activity ................................................................................................. 51
Figure 3.10 A schematic illustrating the proposed complex formed during the
deactivation of the catalyst. It is likely that a number of bridging olefin Ni complexes with varying olefin lengths (n and m) and number of olefin ligands exists ..................................................................................................................... 51
Figure 3.11 Reactions used to model the activation and deactivation of Ni2+ sites
and the dimerization of propene ........................................................................... 52 Figure 3.12 a) Fit of the model derived from Figure 3.11 to the 0.6 wt% Ni-Na-X
time on stream data collected at 1.25 bar propene and 453 K. b) Predicted profiles of the different Ni species as a function of time on stream predicted from the model during the fit in a) ....................................................................... 53
Figure 3.13 Comparison of the model predictions using the kinetic parameters
reported in Table 3.2 to the experimental data for changes in a) propene pressure and b) Ni loading at 453 K. The dashed lines in b) are the predictions of the model when the initial distribution of Ni2+ cations between the sodalite cages and the hexagonal prisms as well as the fraction of Ni sites active for oligomerization are optimized .............................................................................. 55
viii
Figure 3.14 XRD diffractograms of the parent Na-X zeolite and 0.6 wt% Ni-Na-X zeolite after calcination showing that the FAU structure remains after Ni exchange ............................................................................................................... 56
Figure 3.15 Dark-field TEM images of 0.6 wt% Ni-Na-X confirming that NiO
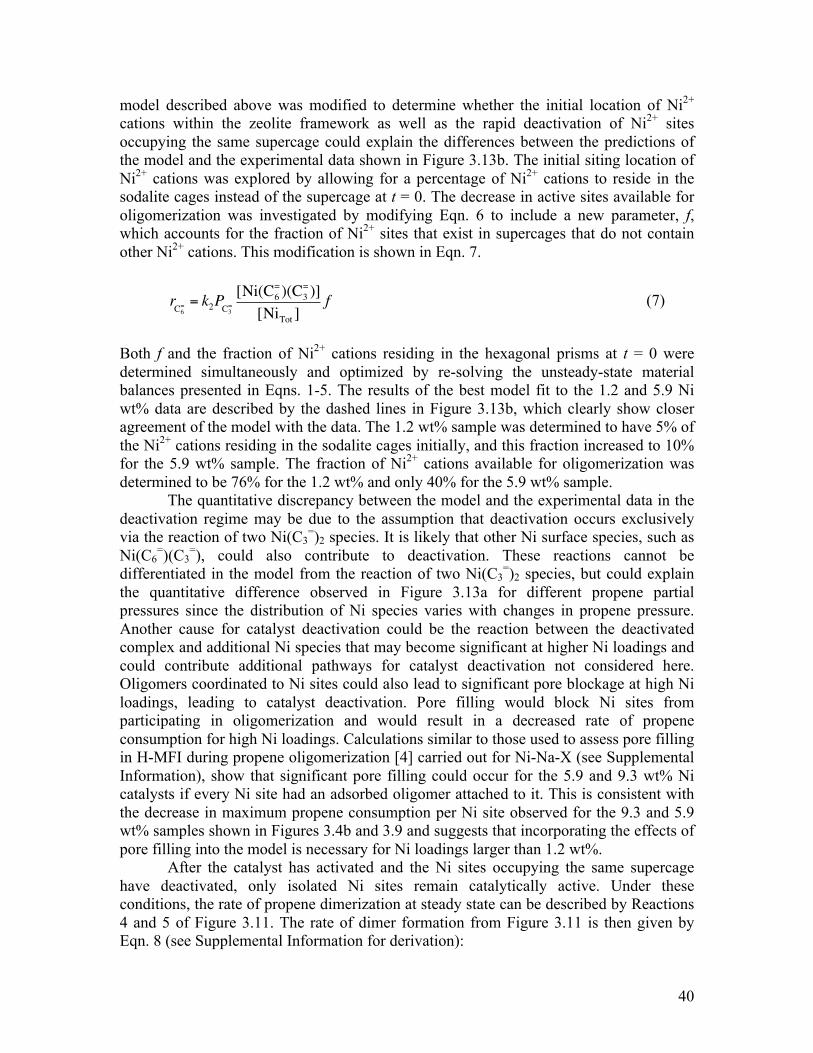
nanoparticles are not formed ................................................................................ 56 Figure 3.16 In situ XANES spectra of the 0.6 wt% Ni-SiO2 catalyst as
synthesized and under reaction conditions indicating that Ni remains Ni2+ throughout the experiment ................................................................................... 57
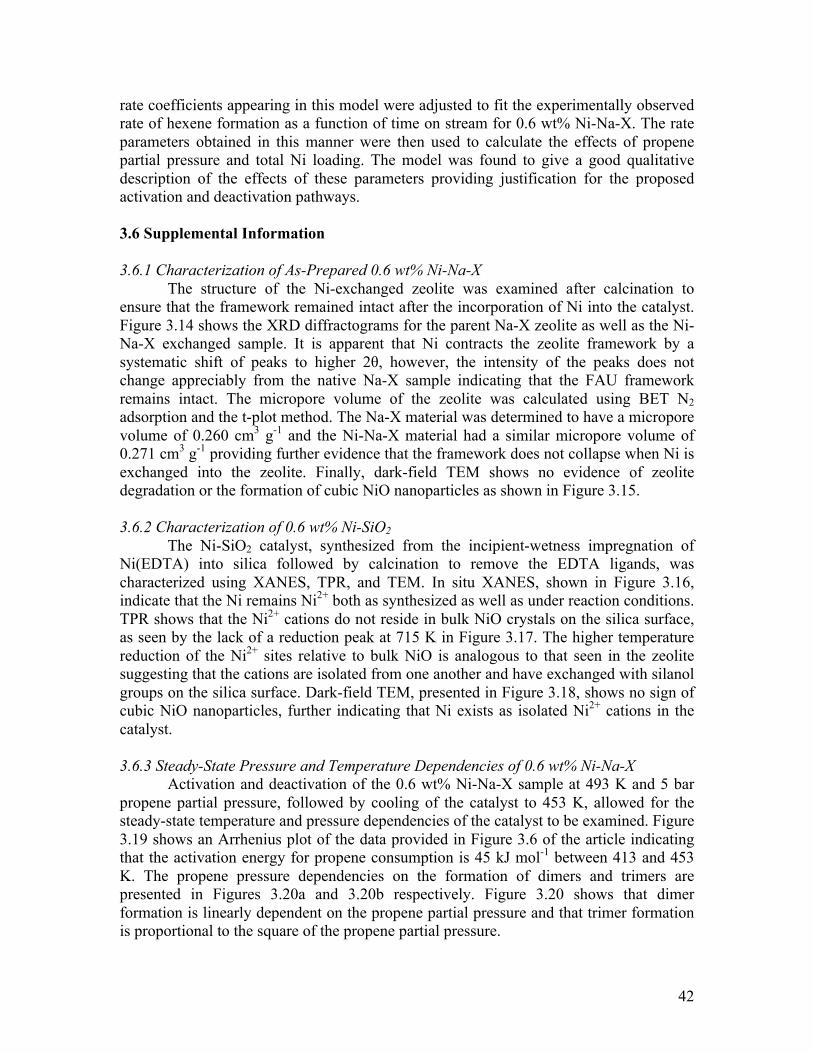
Figure 3.17 TPR spectrum of 0.6 wt% Ni-SiO2 compared with bulk NiO
supported on SiO2 suggesting that bulk NiO does not exist in the catalyst ........ 57 Figure 3.18 Dark-field TEM image of the 0.6 wt% Ni-SiO2 sample confirming
that NiO nanoparticles are not present in the catalyst .......................................... 58 Figure 3.19 Arrhenius plot of the rate of propene consumption for the 0.6 wt%
Ni-Na-X sample between 413 and 453 K ............................................................ 58 Figure 3.20 Effect of the propene partial pressure on the formation rate of a)
dimers and b) trimers at 453 K ............................................................................. 59 Figure 3.21 Percentage of the free pore volume filled for each Ni-Na-X catalyst
examined in this study if a dimer, trimer, or tetramer is coordinated to every Ni2+ cation in the catalyst ..................................................................................... 60
Figure 4.1 Propene dimerization activity as a function of time on stream for Ni-
M-X catalysts with a) alkali metal and b) alkaline earth co-cations at 453 K and 5 bar propene pressure ................................................................................... 74
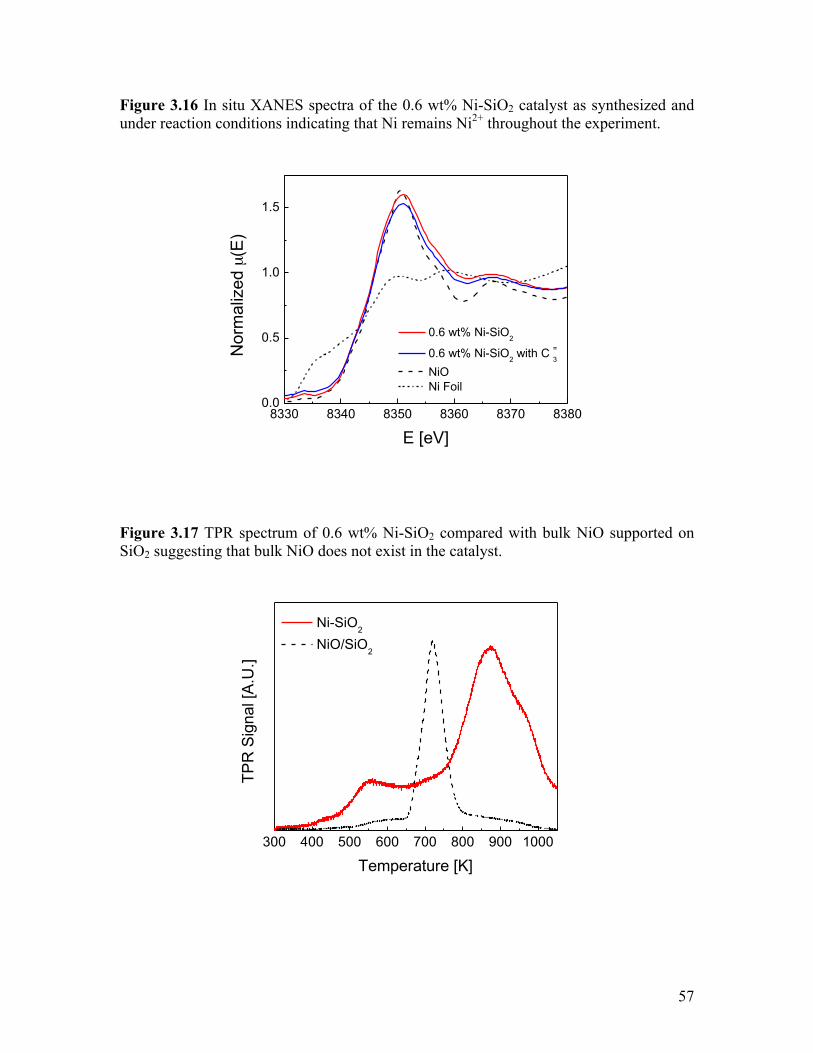
Figure 4.2 Steady-state propene dimerization activity for Ni-M-X catalysts at 453
K and 5 bar propene pressure ............................................................................... 75 Figure 4.3 Percentage of linear and branched dimers produced at steady state for
each Ni-M-X catalyst at 453 K and 5 bar propene pressure ................................ 76 Figure 4.4 Ratio of terminal to internal double bonds in the dimer product for
each Ni-M-X catalyst at 453 K and 5 bar propene pressure ................................ 77 Figure 4.5 Diagram showing the structure of the faujasite framework and the
three general locations that exchanged cations can occupy – hexagonal prisms, sodalite cages, and the supercage ......................................................................... 77
ix
Figure 4.6 Steady-state dimer formation rate at 453 K and 5 bar propene pressure as a function of the free volume per zeolite supercage for both alkali metal- and alkaline earth-exchanged Ni-M-X catalysts .................................................. 78
Figure 4.7 Percentage of dimers with at least one branch versus the free volume
per zeolite supercage at 453 K and 5 bar propene pressure for the alkali metal- and alkaline earth-exchanged Ni-M-X catalysts .................................................. 79
Figure 4.8 Pathways illustrating how dimers with different degrees of branching
can be formed as primary products based on the initial adsorption of propene via the 1’ or 2’ carbon onto the Ni site ................................................................. 80
Figure 4.9 Ratio of di-branched to linear dimers as a function of the supercage
free volume for alkali metal- and alkaline earth-exchanged zeolites at 453 K and 5 bar propene pressure ................................................................................... 81
Figure 4.10 Activation energy for propene dimerization for each Ni-M-X catalyst
as a function of the supercage free volume .......................................................... 81 Figure 4.11 The log of the apparent pre-exponential factor plotted against the
apparent dimerization activation energy for Ni-M-X catalysts indicating a relationship between enthalpy and entropy of activation during the rate-determining step of propene dimerization for alkali metal-exchanged zeolites ... 82
Figure 4.12 XRD diffractograms of the Ni-M-X zeolites after synthesis ................. 83 Figure 5.1 Illustration showing the nature of an exchanged Ni2+ cation in the Ni-
MCM-41 material after calcination in air at 773 K and before exposure to propene .................................................................................................................. 95
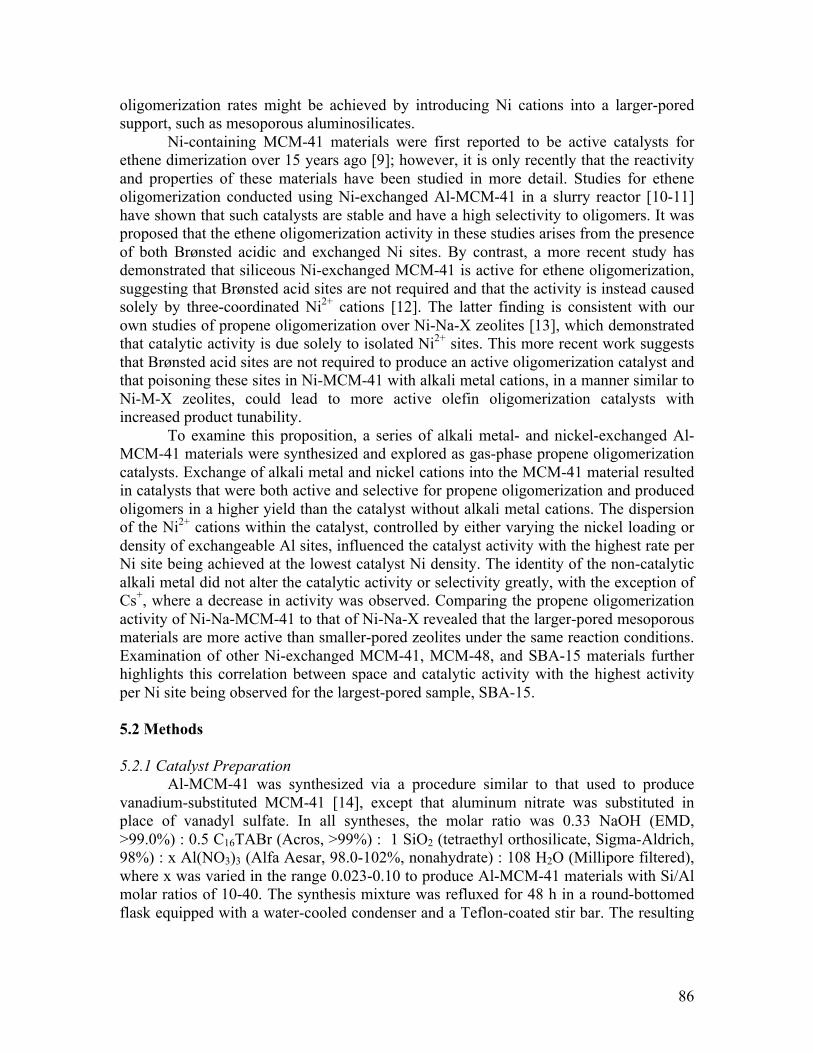
Figure 5.2 Ni loading in Ni-Na-MCM-41 (Si/Al = 20) as a function of the
Ni(NO3)2 exchange concentration ......................................................................... 96 Figure 5.3 Time on stream activity of Ni-Na-MCM-41 (Si/Al = 20) for propene
oligomerization as a function of the catalyst Ni loading. T = 453 K, P = 1 bar propene, F = 30 cm3 min-1 propene (STP) ............................................................. 97
Figure 5.4 Effect of Si/Al ratio in Ni-Na-MCM-41 on the propene
oligomerization time on stream activity at 453 K, 1 bar propene pressure, and 30 cm3 min-1 propene flow rate (STP). Ni loading = 1.07, 0.81, 0.96, and 0.74 wt% for Si/Al = 10-40 respectively ....................................................................... 98
x
Figure 5.5 Propene oligomerization activity at approximately 375 min of time on stream (T = 453 K, P(C3
=) = 1 bar, F(C3=) = 30 cm3 min-1 at STP) as functions
of Ni surface density and average distance between Ni2+ cations within Ni-Na-MCM-41 for nickel loadings spanning 0.3-1.13 wt% Ni and Si/Al ratios spanning 10-40 ...................................................................................................... 99
Figure 5.6 a) Rate of propene consumption per total Ni and b) oligomer
selectivity as a function of time on stream for all Ni-M-MCM-41 (Si/Al = 20). T = 453 K, P = 1 bar, F = 30 cm3 min-1 propene (STP) ........................................ 99
Figure 5.7 Degree of branching in the dimer product as a function of the non-
catalytic co-cation, M, for Ni-M-MCM-41 catalysts at 453 K, 1 bar propene pressure, 30 cm3 min-1 propene (STP), and approximately 150 min time on stream .................................................................................................................. 100
Figure 5.8 Comparison of time on stream propene oligomerization activity of Ni-
Na-MCM-41 (Si/Al = 20) and 0.6 wt% Ni-exchanged Na-X zeolite, from ref. [13] at 453 K, 5 bar propene pressure, and 30 cm3 min-1 propene at STP .......... 100
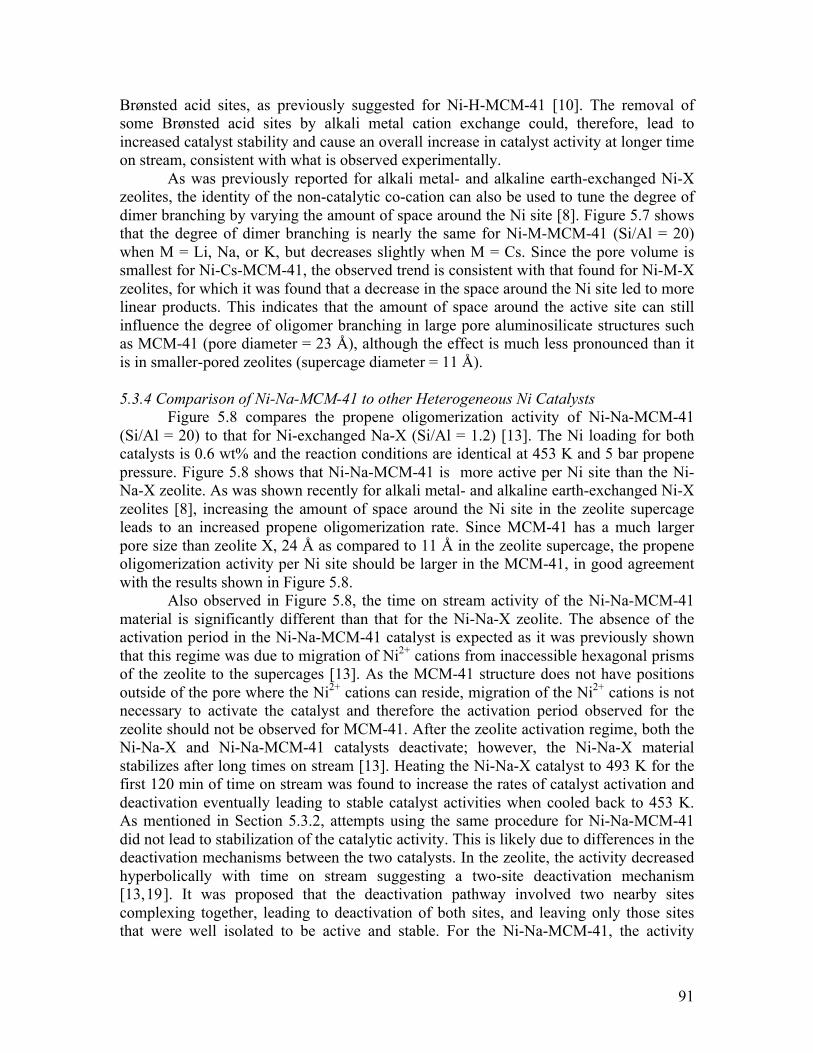
Figure 5.9 Relationship between the pore size of the support and the catalytic
activity of Ni-Na-X, Ni-Na-MCM-41, Ni-Na-MCM-48, and Ni-Na-SBA-15 catalysts after approximately 400 min of time on stream. T = 453 K, P = 5 bar propene pressure, F = 30 cm3 min-1 propene (STP) for all catalysts .................. 101
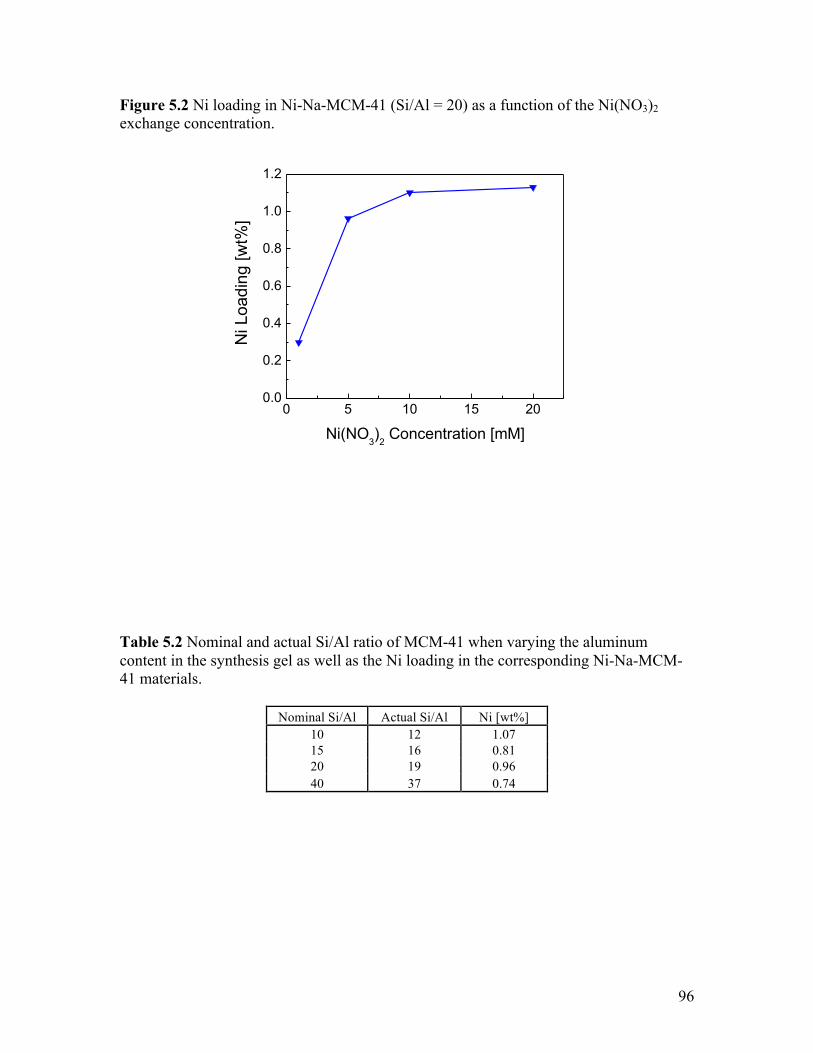
Figure 5.10 Low-angle diffractograms of the Al-MCM-41 (Si/Al = 20) and Al-
MCM-48 materials after synthesis ...................................................................... 101 Figure 5.11 Temperature-programmed reduction of the Ni-Na-MCM-41, Si/Al =
20, sample over the temperature range 500-1073 K ............................................ 102 Figure 5.12 a) Propene conversion and b) oligomer selectivity as a function of
time on stream for the Ni-Na-MCM-41 and Ni-H-MCM-41 catalysts at 453 K and 5 bar propene pressure ................................................................................. 103
xi
List of Tables Table 2.1 IR peak assignments for the major peaks observed in the IR spectra ...... 20 Table 3.1 Elemental analyses of Na-X and Ni-Na-X exchanged with 100 mM
nickel nitrate solution ........................................................................................... 45 Table 3.2 List of optimized rate constants from the fit of the model to the time on
stream data of the 0.6 wt% Ni-Na-X at 1.25 bar propene and 453 K .................. 54 Table 4.1 Elemental analyses of the Ni-M-X zeolites used in this study .................. 73 Table 4.2 Surface area and micropore volume determined from BET N2
adsorption and the unit cell lattice constant determined from XRD for all Ni-M-X zeolites ......................................................................................................... 73
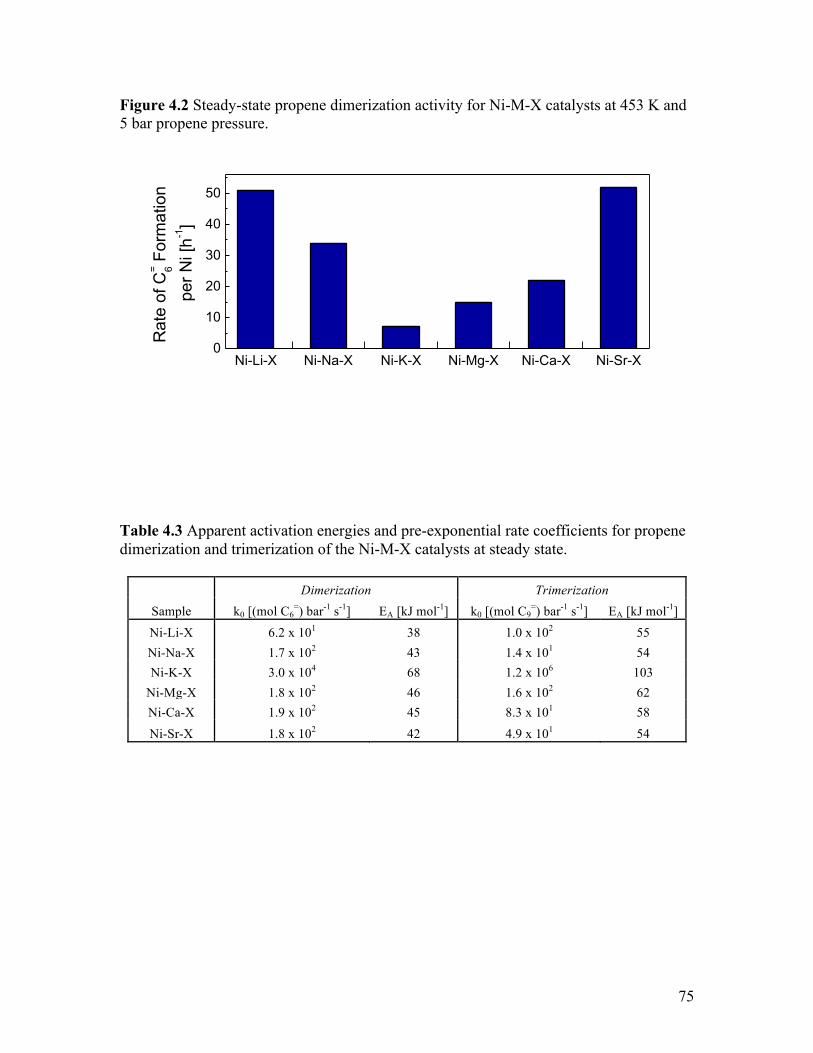
Table 4.3 Apparent activation energies and pre-exponential rate coefficients for
propene dimerization and trimerization of the Ni-M-X catalysts at steady state ....................................................................................................................... 75
Table 4.4 Distribution of hexene isomers formed over Ni-M-X catalysts under
steady-state conditions at 453 K and 5 bar propene ............................................. 76 Table 4.5 Crystallographic supercage volume, supercage volume occupied by co-
cations, and net supercage free volume for each Ni-M-X catalyst calculated using the largest included sphere diameter from ref. [21] and the expansion of the unit cell measured from XRD ......................................................................... 78
Table 5.1 Elemental analysis, BET surface area, BJH pore volume, and average
pore size for the parent H-MCM-41 material and each Ni-M-MCM-41 (Si/Al = 20) catalyst ......................................................................................................... 95
Table 5.2 Nominal and actual Si/Al ratio of MCM-41 when varying the
aluminum content in the synthesis gel as well as the Ni loading in the corresponding Ni-Na-MCM-41 materials ............................................................. 96
Table 5.3 Ni loadings, BET surface areas, BJH pore volumes, and average pore
sizes for Ni-Na-MCM-41, Ni-Na-MCM-48, and Ni-Na-SBA-15 materials synthesized with different pore sizes ..................................................................... 97
xii
List of Abbreviations and Symbols a unit cell lattice constant measured from XRD BET Brunauer-Emmett-Teller theory of gas adsorption BJH Barrett-Joyner-Halenda gas adsorption method Cn a molecule containing n carbon atoms Cn
= a molecule containing n carbon atoms and one carbon-carbon double bond Cn-Z a molecule containing n carbon atoms chemisorbed on a Brønsted acid site DFT density functional theory DHA detailed hydrocarbon analysis gas chromatography technique EA apparent activation energy given in the Arrhenius equation, k = k0 exp(-EA/(RT)) EFAL extra-framework aluminum EXAFS extended X-ray absorption fine structure FAU faujasite zeolite framework FTIR, IR Fourier transform infrared spectroscopy ICP-OES inductively-coupled plasma optical emission spectrometry elemental analysis ki rate constant for reaction i kB Boltzmann constant k0 apparent pre-exponential factor in Arrhenius equation, k = k0 exp(-EA/(RT)) M exchanged alkali metal or alkaline earth cation in Ni-M-X zeolites or Ni- M-MCM-41 mesoporous materials MCM Mobil Composition of Matter; templated mesoporous aluminosilicate material MFI ZSM-5, or MFI, zeolite framework MM molecular mechanics MOGD Mobil Olefin to Gasoline and Distillate process MOR mordenite zeolite framework Ni(Cn
=)m Ni2+ site with m adsorbed molecules each containing n carbon atoms Ni(Sn) Ni2+ cation residing in the Sn location within the faujasite framework NNN next-nearest neighbor aluminum in the zeolite framework P(Cn
=) partial pressure of Cn=
QM quantum mechanics R molar gas constant ri reaction rate for reaction i r’
i reaction rate for reaction i per Brønsted acid site S(Cn) selectivity to molecules containing n carbon atoms SI cation siting location in the hexagonal prisms of the faujasite framework SII cation siting location in the sodalite cages of the faujasite framework SBA-15 Santa Barbara Amorphous 15; templated mesoporous aluminosilicate material SEM scanning electron microscopy
xiii
Si/Al bulk silicon to aluminum ratio in the zeolite or aluminosilicate material STP standard temperature and pressure t, TOS time on stream T reaction temperature T12 framework aluminum atom located at the 12th tetrahedral site in MFI TEM transmission electron microscopy TPR temperature-programmed reduction X zeolite X; faujasite zeolite framework with a Si/Al ratio ≈ 1.2-1.3 XANES X-ray absorption near edge structure XRD X-ray diffraction Y zeolite Y; faujasite zeolite framework with a Si/Al ratio ≈ 2.6 ΔH‡ enthalpy of activation ΔS‡ entropy of activation α proportionality constant relating the relative rates of dimer growth to dimer desorption at a given Si/Al ratio in H-MFI β ratio of dimer desorption rate constants for a given Si/Al ratio relative to that for Si/Al = 140 in H-MFI γ ratio of propene dimerization rate constants for a given Si/Al ratio relative to that at Si/Al = 140 in H-MFI θ angle, in degrees, of X-ray beam with respect to the sample in XRD
xiv
Acknowledgements Of all the parts of this dissertation, this is by far the most difficult section for me to write. Not because it is hard for me to acknowledge those who have helped me get to where I am today, but instead, it is because a mere few sentences cannot even begin to adequately describe all of the help and support I have received from everyone. With that disclaimer, here is my best attempt at acknowledging those who helped make this dissertation possible. First and foremost, I need to thank my family. Although I did not always agree with them at the time, my mother and father did everything they could to raise my sister and I to be responsible, hard-working adults. My dad instilled in me the importance of being honest and humble, and to never let the phrase “I can’t do it” enter into my vocabulary. My mom is the reason that I love science as much as I do and why I am never afraid to ask why something is the way it is. My sister, Mara, has been a constant inspiration to me, especially during graduate school, and I’m really glad that we have grown closer as we have gotten older. I also have to thank my Uncle Keith, who looked after my sister and I as if we were his own kids, and always taught us to never take life too seriously. The dream of pursuing my doctorate began in my final few years in undergrad at the University of Wisconsin, Madison, and so it is only right that I begin my more scientific acknowledgements there. It was the rigorous classes that I took in the Chemical Engineering department that prepared me for and helped me really appreciate the PhD program at Berkeley. In particular, the courses taught by Professors James Dumesic, Sean Palecek, Dan Klingenberg, and Thatcher Root helped shape my thinking as an engineer and gave me the solid fundamental background I so often fall back on. While at Berkeley, I have had the opportunity to meet many different people who helped shape not only my research style, but also the person that I have become five years after entering the program. Professor Alexis Bell has played one of the largest roles as my advisor while I have been here, and I am incredibly grateful that I had the opportunity to work in his group. Our weekly meetings instilled in me the importance of doing careful, rigorous scientific work while still asking the important question of how does this all fit back into the bigger picture. His ability to organize and guide the project when necessary while still allowing me to test my own hypotheses and make mistakes is uncanny and has allowed for me to grow not only as a technical researcher, but also as a presenter, project leader, and more well rounded engineer. Within the Bell research group, many of my lab mates have gone out of their way to help me with various aspects of my project and graduate school as a whole. Fuat Celik, TJ Kim, Bean Getsoian, and Will Vining all took me under their wings when I first joined the group and got me up to speed on research within the lab. Fuat, more than anyone else, guided me in how to carefully plan experiments and keep the lab running smoothly. Both of these skills helped me immensely in keeping my research moving, and for that, I am forever grateful. I also owe a special thank you to Bean for entertaining some rather odd ideas we have come up with in the lab and for taking the time to talk about anything from research to how the Big Ten football season will shape up the next year. In addition to my four aforementioned lab mates, I also need to thank Kris Enslow, Joe Gomes, Sankaranarayanapillai Shylesh, David Hanna, Paul Zimmerman,
xv
Zheng Zhai, Amber Janda, Sebastian Werner, Zhenmeng Peng, Eric Sacia, Rachel Licht, Mike Zboray, Andrew Behn, Georges Siddiqi, Jason Yeo, Arne Dinse, and John Howell. Whether it was discussing research, playing a game of tennis, or just talking about the plans for the weekend, you have all helped make this journey a lot more fun than I could have imagined. I especially need to thank S. Shylesh for taking time out of his own research project to help guide my project and teach me everything I know about catalyst synthesis. While working on the oligomerization project, I had the opportunity to mentor four outstanding visiting scholars and undergraduate students: Gerry Bong, Guillaume Baur, Armando Rodriquez, and Otto Ho. Much of the work presented in this dissertation was only possible because of their time and effort on the project. Although they joined the project to learn from me, I was the one who learned the most from them. I also need to thank a few other friends that I made while working towards my degree here at Berkeley. Rob Carr, Keith Beers, Bryan McCulloch, and Kris Enslow were great roommates and even better Mario Kart players. Thanks for introducing me to Bakesale Betty’s fried chicken sandwiches and making me realize that I am not the only one my age who still listens to 90’s music. Kristin Stangl, our group’s administrative assistant, has been a huge help to my sanity in grad school. I never realized how much work it would be to purchase a chemical or send a package and I would still be here for another year if it wasn’t for her taking care of all of paperwork behind the scenes. Last, but certainly not least, I have to thank my wife, Laurie, for all of the love and support she has given me while I was working on this research project. I never imagined that I would come to graduate school and meet you here, and the culmination of this dissertation has as much to do with me running the experiments as it does with you believing in what I could accomplish. You have always had my back, been there to listen to me when my project wasn’t working, and celebrate with me when it all came together. It has been a great start to a long adventure still waiting ahead of us and I can’t wait to take the next steps down that road with you.
1
Chapter 1
Introduction Increasing demand for high quality, low pollutant liquid transportation fuels has led to the exploration of new pathways to produce gasoline, diesel, and jet fuel. These new reaction networks not only involve modifying current petroleum refining operations, but also exploring new production schemes to use more diversified feedstocks such as natural gas, coal, and biomass to produce the next generation of liquid fuels. Many pathways have been proposed to produce molecules chemically suitable as blending agents; however, the environmental and safety hazards for many of these chemicals new to the fuels industry are unknown making their adoption in the marketplace hard to predict. Furthermore, many of these chemicals are incompatible with the current pipeline infrastructure used to transport fuels from refineries to the distribution centers thereby incurring additional costs to the manufacturer and making the additives less economically viable. Since liquid fuels are mixtures of many different hydrocarbon species, one way to mitigate these issues is to selectively produce the most beneficial molecules already present in the fuel and use those as additives. These molecules could be easily blended into the fuel at the refinery while also minimizing the additional regulatory and safety research required for new fuel additives since they are already present, albeit in lower concentrations, in the fuel. Although many factors must be considered when determining the quality of the fuel molecule, a few general observations regarding the size and isomer distribution have been tabulated for simple hydrocarbon molecules [1]. For example, high quality gasoline molecules should be highly branched and contain between approximately 6 and 10 carbon atoms to produce the highest-octane fuel. This differs from jet and diesel fuels, which require heavier and more linear hydrocarbons containing approximately 10 to 14 carbon atoms for jet and 10 to 24 carbon atoms for diesel, with the actual ranges varying depending on application, climate, and manufacturer. These general observations suggest that producing hydrocarbons comprised only of hydrogen and carbon with a controlled size and degree of branching could be a promising route to producing high quality, drop-in fuel additives. One method for producing these types of additives is to selectively oligomerize gaseous light olefins to produce liquid products, which can then be hydrogenated in a separate step to produce stable fuel additives [2]. In the oligomerization reaction, two or more light olefins, containing 2-5 carbon atoms, are linked together through the formation of new carbon-carbon bonds to produce heavier molecular weight hydrocarbons. This reaction is shown in Figure 1.1 for propene and indicates how heavier molecules containing various numbers of carbon atoms and degrees of branching could be formed. Light olefin oligomerization is an attractive scheme for a number of reasons. First, the production of liquid fuels using this process has previously been demonstrated to be industrially feasible. Light olefin oligomerization was first commercialized in the 1930’s by UOP [3] and has since led to numerous industrial processes, including the Mobil Olefin to Gasoline (MOGD) process [4-6]. Second, light olefins can be produced from numerous sources, including as byproducts of petroleum refining and Fischer-Tropsch synthesis as well as from the dehydration of alcohols produced from biomass
2
fermentation. Finally, separation of the oligomers from the unreacted light olefins is relatively easy due to the large difference in boiling points between the reactants and products meaning fuel additives could potentially be produced cheaply given a highly active and selective catalyst. Many different heterogeneous microporous and mesoporous Brønsted acidic and supported nickel catalysts have been shown to be active for light olefin oligomerization [7]. Much of the research with these systems has focused on how the reaction conditions and post-synthesis modification of the catalyst can influence the catalyst activity and oligomer molecular weight distribution. It has been shown that reactivity and selectivity differences exist between Brønsted acidic and nickel-containing catalysts for olefins of different sizes; however, little is fundamentally understood about how these systems operate. This makes choosing and designing an oligomerization catalyst appropriate for a given application, such as the production of diesel fuel, difficult and limits the rational development of new oligomerization catalysts. The objective of this study was to establish how the choice of catalyst, either a Brønsted acidic or nickel-exchanged material, and the properties of that catalyst, such as active site loading and interactions with the support, influence the distribution of light olefin oligomers produced under similar reaction conditions. Chapter 2 begins the investigation by examining how the density of Brønsted acid sites in the medium-pore zeolite H-MFI, which is one of the catalysts of choice in the MOGD process [4-5], can influence the molecular weight distribution of products. It was determined that a close proximity of sites leads to a lower catalyst activity but an increased selectivity to oligomers versus smaller cracking products. These effects were attributed through experiment and DFT simulations to be caused by steric constraints imposed by adsorbed oligomers limiting large oligomer growth at high active site densities. Unfortunately, it was determined that all of the catalysts were also active for oligomer cracking and aromatization, leading to low oligomer selectivity and limiting the control over the types of oligomers produced. Since product control is important for using the oligomers as high-quality liquid fuels and additives, a different class of catalysts that are not active for oligomer cracking and aromatics formation is desirable. As discussed earlier, heterogeneous nickel aluminosilicates are also active for light olefin oligomerization and are inherently more selective to oligomers under oligomerization reaction conditions. These nickel-containing aluminosilicate materials are much less studied than Brønsted acidic catalysts, however, making the choice of catalyst for a given application particularly challenging. Chapter 3 begins to address how nickel aluminosilicates catalyze light olefin oligomerization by examining Ni-exchanged Na-X zeolites as catalysts for propene oligomerization. It was determined that the active site in the catalyst is an exchanged Ni2+ species, consistent with the active species in liquid-phase organometallic nickel oligomerization catalysts. The activity profile was found to be a complex function of time on stream with the catalyst activating and deactivating before reaching steady state. The activation period was attributed to Ni2+ cations migrating from inaccessible positions within the zeolite to the zeolite supercage where oligomerization occurs. Catalyst deactivation was found to be most prevalent for catalysts with large nickel loadings and led to the discovery that only catalysts with low Ni loadings (< 1 wt%) were stable at long times. An initial higher temperature treatment was found to speed up the activation
3
and deactivation processes allowing for the steady-state regime to be studied more easily. Using this approach, the propene partial pressure dependence and activation energies for dimer and trimer formation were determined for the first time using a heterogeneous Ni-based oligomerization catalyst and found to be similar to those reported for their homogeneous analogues. With an understanding of how to produce a stable gas-phase propene oligomerization catalyst, tuning of the Ni-X zeolite to selectively produce different fuel additives was explored. Chapter 4 discusses the role of the non-catalytic, charge-compensating cation (Na+ in Ni-Na-X) in the catalyst during propene oligomerization. Exchange of the Na+ ion with other alkali metal and alkaline earth cations showed that space within the zeolite supercage governs both the activity and selectivity of the catalyst. In particular, it was determined that catalysts with more free space within the supercage led to increased activity and branching in the dimer product. This observation led to the development of even larger pored Ni-exchanged MCM-41, MCM-48, and SBA-15 catalysts as reported in Chapter 5. Indeed, the larger pores of the MCM-41 materials (24 Å in MCM-41 as compared to 11 Å in zeolite X) were found to increase catalyst activity beyond what was observed with Ni-X zeolites while still maintaining >98% oligomer selectivity. Varying the nickel loading and density of exchange sites within the MCM-41 material showed that high dispersion of Ni2+ sites is important for maximizing activity in nickel-exchanged mesoporous materials, agreeing well with the results gathered using Ni-Na-X zeolites. The larger space around the Ni2+ active site in the mesoporous materials limited the control of dimer branching, however, giving instead a 49/51 ratio of branched/linear products regardless of support or identity of the alkali metal co-cation. This suggests that a highly active, tunable oligomerization catalyst could be produced by tightly controlling the sterics immediately around the active site while having large open pore spaces to maintain high catalyst activity. Figure 1.1 Propene oligomerization pathway illustrating the formation of higher molecular weight oligomers and the types of dimer isomers that can be produced.
!"#$ %&'&()*'$
+$!"#$
!,#$ %&'&()*'$
+$!"#$
!-#$ %&'&()*'$
+$!"#$.$
(/01&2$ 340452&0%617$
7/52&0%617$
4
References: [1] A.M. Hochhauser, Gasoline and Other Motor Fuels, in: Kirk-Othmer Encyclopedia of Chemical Technology, 2004, p. 386-435. [2] M. Marchionna, M. Di Girolamo, R. Patrini, Catal Today 65 (2001) 397-403. [3] V.N. Ipatieff, G. Egloff, Oil Gas J. 33 (1935) 31-32. [4] S.A. Tabak US Patent 4433185 (1984) to Mobil Oil Corporation. [5] H. Owen, S.K. Marsh, B.S. Wright US Patent 4456779 (1984) to Mobil Oil Corporation. [6] N.Y. Chen, W.E. Garwood, F.G. Dwyer, Shape Selective Catalysis in Industrial Applications, Marcel Dekker Inc., New York, 1996, p. 168-172. [7] A. Corma, S. Iborra, in: E.G. Derouane (Ed.), Catalysts for Fine Chemical Synthesis, vol. 4, J. Wiley & Sons Ltd., UK, 2006, p. 125-132.
5
Chapter 2
Effects of Brønsted Acid Site Proximity on the Oligomerization of Propene in H-MFI
Abstract The oligomerization of propene was investigated over H-MFI zeolites with varying Si/Al ratios. For a constant space time per active site, the conversion of propene as well as the selectivity to products of different carbon number were affected by the density of the sites within the zeolite. In particular, as the Si/Al ratio decreased, corresponding to an increase in site proximity, the rate of oligomerization per site decreased but the selectivity to dimers relative to cracking products increased. These effects were shown to arise from the effects of molecular crowding on the rate coefficient for propene trimer formation and were confirmed by quantum chemical analysis of the energetics of propene oligomerization. It was found that the activation for propene dimerization is unaffected by the presence of oligomers on nearby sites, but the activation energy for propene trimerization relative to desorption of hexene increases by 19 kcal mol-1 when two next nearest neighbor sites are occupied by oligomers. In situ IR spectroscopy observations showed the buildup of aromatic species with time-on-stream. The accumulation of these species increases with decreasing Si/Al ratio, suggesting that increasing proximity of Brønsted acid sites enhances the formation of aromatic species. 2.1 Introduction The selective oligomerization of C2-C5 olefins offers a promising synthetic pathway for the production of a wide variety of higher molecular weight compounds that could be used as detergents, gasoline additives, and diesel fuel [1]. Work by several investigators has shown that H-MFI is an active catalyst for this purpose and that the narrow pores of the zeolite limit the formation of polyaromatic compounds, which are precursors to the formation of coke [2-6]. The effects of reaction temperature and pressure on oligomerization activity have been investigated and can be adjusted to tailor the types of oligomerization products produced. For example, high pressures and low temperatures favor higher molecular weight oligomers more suitable for diesel fuel, while higher temperatures and near-ambient pressures favor the formation of lower molecular weight oligomers and aromatics that are more suitable for gasoline.
Due to the complexity of the reaction network, few in-depth studies have been reported from which to draw mechanistic insight and an understanding of how the Si/Al ratio might affect catalyst activity and product distribution [7-8]. While a low Si/Al ratio might be desirable to maximize the concentration of Brønsted acid sites per gram of catalyst, several recent studies have reported that the proximity of active centers, which increases with decreasing Si/Al ratio, could be detrimental to catalyst activity and/or product selectivity. For example, it has been shown that the distribution of olefins, paraffins, and aromatics produced during 1-butene cracking on H-MFI at 773 K is influenced by the proximity of Brønsted acid sites to one another [9]. In this study it was
6
reported that close proximity of acid sites enhanced the formation of aromatics and dimers, whereas isolated sites were more active for hydrocarbon cracking. Furthermore, a study of dimethoxymethane carbonylation in Brønsted acid zeolites showed that an increase in the Si/Al ratio, corresponding to a decrease in the proximity of sites, caused an increase in the carbonylation rate per site in H-MFI [10]. This increase was attributed to an increased repulsion between adsorbed species at low Si/Al ratios. These studies pose the question of whether site proximity might affect other reactions carried out in zeolites such as olefin oligomerization in H-MFI. The goal of the present study was to understand how the proximity of Brønsted acid sites in H-MFI influences the activity and product selectivity for propene oligomerization. Since the acid site proximity increases with decreasing Si/Al ratio, studies were carried out with Si/Al ratios of 140 to 12, corresponding to Al concentrations of 0.7 to 7.3 Al per unit cell. It was found that high Al concentrations per unit cell limit the growth of propene oligomers due to the effects of molecular crowding at the active site. It was also observed that the selectivity to dimers over cracking products increased with decreasing Si/Al ratio but the conversion of propene decreased. Quantum chemical calculations aimed at identifying the influence of Al site proximity on the oligomerization of propene support this interpretation of the experimental observations. A further observation of this study is that the rate of aromatics formation per Al increases with decreasing Si/Al ratio suggesting that the creation of aromatic compounds may be enhanced by the proximity of Brønsted acid sites. 2.2 Methods 2.2.1 Catalyst Preparation Five MFI samples were obtained in the ammonium form from Zeolyst (Si/Al ratio = 12, 15, 25, 40, 140). Each catalyst was placed in a quartz boat and heated in a horizontal quartz tube to 773 K at 2 K min-1 under 100 mL min-1 of air (Praxair, zero-grade) and held for three hours at 773 K to convert to the Brønsted acid form of the catalyst. The catalysts were then stored in a desiccator until use to limit the adsorption of ambient water. 2.2.2 Steady-State Catalytic Experiments A 6.35 mm outer diameter quartz tube reactor with a 12.7 mm outer diameter bubble in the center was layered with quartz wool, 60-230 mg of catalyst, and finally another layer of quartz wool to create a fixed catalyst bed. The temperature was monitored by using a quartz-sheathed K-type thermocouple placed directly into the catalyst bed. The amount of catalyst loaded into the reactor was varied to allow for a constant space time of 4 mol propene (mol Al)-1 s-1 during the experiment while eliminating catalyst bed channeling. All catalysts were heated to 773 K for three hours at 2 K min-1 in 100 cm3 min-1 of air prior to the introduction of propene to remove residual moisture adsorbed by the catalyst while preparing the reactor. Catalytic experiments were performed with a feed of 25 vol% propene (Praxair, 99.9%) diluted in helium (Praxair, 99.999%) at either 60 cm3 min-1 or 120 cm3 min-1 to maintain a constant space time as described earlier. The experiments were all performed at atmospheric pressure with a pressure drop of less than 7 kPa across the reactor. The
7
catalyst was allowed to stabilize for 3 h before data were collected to ensure that steady-state was achieved. Products were analyzed using an Agilent 6890N gas chromatograph equipped with a 30 m HP-Plot Q column and a flame ionization detector. Propene conversion was calculated using one of two methods: based on the amount of propene reacted for conversions >10% and on the amount of C4-C6 products observed for conversions <10%. In the limit of 10% conversion, both methods provided similar conversion percentages. Dimer selectivity was calculated from the amount of propene reacted to form C6 species relative to the amount of propene reacted to form all observed products using the following formula, where [Ci] is the concentration of hydrocarbons with carbon number i observed in the reactor effluent:
!
S(C6) =6[C6]
4[C4 ]+ 5[C5]+ 6[C6]"100% (1)
The space time was calculated on a per aluminum atom basis and was held constant for all experiments at a value of 4 mol propene (mol Al)-1 s-1. 2.2.3 FTIR Spectroscopy Experiments Experiments were performed in a FTIR transmission cell, similar to that described in ref. [11]. The catalyst in the form of a pressed pellet (20-80 mg) is contained inside this low-dead-volume cell. After assembly, an air flow of 100 cm3 min-1 was passed through the cell as it was heated to 773 K at 2 K min-1 in order to remove residual moisture. The cell was then cooled to 298 K and purged with helium while collecting spectra to determine the state of the catalyst prior to reaction. A 100 cm3 min-1 flow of 2 vol% propene in helium was introduced to the catalyst pellet at ambient pressure and heated from 298 K to 573 K at 2 K min-1 to examine the effects of temperature for each catalyst. 2.2.4 Quantum Mechanical/Molecular Mechanical Modeling Quantum mechanics/molecular mechanics (QM/MM) simulations [12] were employed in collaboration with Dr. Paul Zimmerman to study the effects of acid site proximity on the oligomerization of propene in MFI. A large cluster, consisting of 276 tetrahedral centers (T276), was constructed using the bulk crystallographic structure of MFI determined from x-ray diffraction [13]. Although the most common position of the Al in MFI lattices is not known, there is some evidence that the T12 position is favored and therefore T12 was chosen as the central MFI acid site [14, 15]. The active site was modeled using a QM region of 5 tetrahedral atoms (T5) centered at the T12 active site with the rest of the cluster being modeled by molecular mechanics. Hydrocarbons were described by molecular mechanics at neighboring acid sites to the central T12 site. The charges on the atoms located at the cluster surface were scaled such that the cluster had net zero charge. During geometry optimizations, the lattice atoms away from active regions were kept frozen at their crystallographic positions, however, hydrocarbons adsorbed away from the active site were allowed to fully relax in response to changes in the active region.
All simulations employ the ωB97X-D density functional paired with the 6-31G* basis set and utilized the MM charge and Lennard-Jones parameters for Si and O chosen
8
for optimal performance in QM/MM calculations from [12]. The MM charge parameters were 0.7e and -0.35e for Si and O framework atoms, respectively. The Lennard-Jones parameters were εSi = 0.2 kcal/mol, εO = 0.075 kcal/mol, RSi=1.5 Å and RO = 1.77Å for the framework atoms. Parameters for hydrocarbons were taken from CHARMM [16]. Frequency computations were performed on all intermediates to ensure that geometries corresponded to local minima (i.e. zero negative eigenvalues) or transition states (one negative eigenvalue). Reported energies were converted to enthalpies at 513K. All simulations were performed utilizing a development version of the Q-Chem software package [17].
2.3 Results and Discussion 2.3.1 Experimental Catalyst Activity and Selectivity The effects of temperature on the propene oligomerization activity and dimer selectivity of five H-MFI samples differing in Si/Al ratio are shown in Figure 2.1. All experiments were carried out at a constant space time of 4 mol propene (mol Al)-1 s-1 and total pressure of 1 bar. Data were collected after 3 h of time-on-stream at 548 K during which the activity decreased by 15% from its initial value. No change in product selectivity was observed during this period. After 3 h of time-on-stream, the catalyst was stable, and no further change in catalyst activity or product selectivity was observed during the rest of the experiment. As the temperature was increased from 473 to 547 K, the activity of all of the H-MFI catalysts increased but at the expense of a decrease in the selectivity to dimers (C6). Replotting the conversion and selectivity data from Figure 2.1 as a function of the Si/Al ratio at 513 K highlights the decrease in activity and dimer yield with decreasing Si/Al ratio. Figure 2.2 shows the effect of Si/Al ratio on propene conversion and dimer selectivity. The conversion of propene decreases as the Si/Al ratio increases from 15 to 40, but remains constant for a further increase in the Si/Al ratio to 140. Increasing the Si/Al ratio increases the selectivity to dimers for Si/Al ratios up to 40, but has no further effect for higher ratios.
Figure 2.3 shows that the selectivity to dimers decreasing with increasing temperature is due to an increase in the cracking of the higher oligomer products to fragments (e.g. cracking C9 to C4 and C5). At 473 K, the C4/C5 ratio is approximately one indicating that cracking products are derived primarily from the fragmentation of the trimer (C9). C1 and C2 species are not produced to a significant extent, so other pathways may be excluded. As the temperature is increased, the C4/C5 ratio increases indicating the formation of longer oligomers (either exclusively from C3 or via secondary oligomerization involving C4 or C5) followed by cracking since there are more ways to produce C4 fragments than C5 fragments from either oligomers larger than the trimer or oligomers produced via secondary oligomerization. This observation is consistent with the results of Bandiera and Ben Taarit, who concluded that the observed products were formed solely from dimers, trimers, and secondary oligomers formed by the cracking of trimers into C4 and C5 species which were then reincorporated into the oligomerization pathway [8].
9
2.3.2 In-situ FTIR Experiments Figure 2.4 shows IR spectra collected as a function of increasing temperature while passing propene over MFI (Si/Al = 40). The assignments of the peaks seen in these spectra are given in Table 2.1 [7, 18-19]. The spectra shown in Figure 2.4 are representative of those observed for MFI samples with other Si/Al ratios. No changes in the spectrum were observed after the first set of averaged scans (~ 45 s time-on-stream). Within the first minute of propene introduction at room temperature, all of the free Brønsted acid sites are consumed as indicated by the disappearance of the free Brønsted acid site peak in MFI at 3610 cm-1. Adsorbed oligomerization products are observed by the growth of strong CH2 and CH3 absorption bands at 2955, 2933, 2880, 2865, 1467, 1458, 1377, and 1367 cm-1. The peaks at 3700 and 3470 cm-1 are attributable to the interaction of paraffinic species, such as the tails of a growing oligomer, with SiOH and Brønsted acid sites, respectively, and have been observed previously in studies of propene oligomerization on MFI at near-ambient temperatures [7]. Figure 2.4 shows little change in the IR spectra below a temperature of 473 K; this is consistent with propene conversions of <<1% below 473 K. Above 473 K, the Brønsted acid peak at 3610 cm-1 slowly reappears and the broad peak at 3470 cm-1 diminishes in intensity. It is also observed that the peaks attributed to CH2 and CH3 groups begin to decrease in intensity indicating fewer or shorter hydrocarbon molecules within the zeolite. The peak at 1510 cm-1 also increases in intensity and a new peak appears at ca. 1610 cm-1. Although the peak at 1510 cm-1 has been assigned to different species including aromatics [18] and carbocations in H-zeolites [19], the feature at 1610 cm-1 can be exclusively assigned to the C=C-C stretches of aromatic species [18] and has been previously reported to be due to the formation of monoaromatic species within H-MFI during propene oligomerization [20]. The intensity of the 1610 cm-1 peak increased with increasing temperature but also with decreasing Si/Al ratio when normalized to the amount of aluminum in each zeolite (Figure 2.5a). It was further observed that holding the temperature at 573 K caused the continued growth of the peak at 1610 cm-1 for all samples, the fastest increase being observed for the lowest Si/Al ratio (see Figure 2.5b). These data indicate that the formation of aromatics increases with time-on-stream and that aromatics are formed most readily at low Si/Al ratios. 2.3.3 Effect of the Si/Al Ratio on Catalyst Activity and Selectivity A number of possible causes were considered for the observed effects of Si/Al ratio on propene conversion and product selectivity. Space time experiments at 548 K showed that the C4, C5, and C6 product selectivities did not change with changes in conversion indicating that changes in product selectivity between MFI with different Si/Al ratios is not due to differences in propene conversion. Previous studies have shown that the acidity of H-MFI zeolites is constant over the range of Si/Al ratios used in this study [9, 21-22], suggesting that the intrinsic activity of each isolated site should be similar. The possibility that the amount of extra-framework aluminum (EFAL) varied with Si/Al ratio was investigated by infrared spectroscopy. The presence of EFAL is identified by a hydroxyl peak located at 3660 cm-1 [7, 23]. The intensity of this feature was small for all Si/Al ratios and did not vary with the Si/Al ratio when scaled per Al, in agreement with similar findings reported for Zeolyst MFI samples [24]. Since the fraction of EFAL per total Al did not vary with the Si/Al ratio and the space time was kept
10
constant per total Al, the amount of EFAL present in each experiment was constant and, hence, differences in the fraction of EFAL cannot explain the observed effects of Si/Al ratio on the activity and selectivity of H-MFI for propene oligomerization.
The possibility that external or internal mass transfer effects affected the experimental results was also considered. The influence of external mass transfer was investigated by varying the gas flow rate while maintaining a constant space time by proportionally varying the amount of catalyst. The observed conversions and selectivities remained constant suggesting that external mass transfer limitations were negligible. The effects of intraparticle mass transfer was investigated by pressing and sieving the catalyst to change the particle size from 104-125 µm to 43-45 µm and intracrystalline mass transfer was investigated by using two different zeolite samples with similar Si/Al ratios but different crystal sizes, 300 and 500 nm. In both cases, the observed conversions and selectivities were similar suggesting that internal mass transfer was adequate (Further discussion of mass transfer limitations can be found in the Supplemental Information). The reaction kinetics were examined next with the aim of establishing whether the observed effects of Si/Al ratio could be attributed to changes in one or more of the rate coefficients involved in describing the kinetics of propene oligomerization. Figure 2.6 illustrates a possible pathway leading to the products observed at low conversions. In this scheme all of the reactions are taken to be irreversible. The overall rate of propene consumption in this network can be written as
!
rC3= = ka[C3=][H - Z] + knp[C3
=][Cn - Z]n=3,6,..." (2)
Here ka is the rate constant for propene adsorption onto a Brønsted acid site and knp is the rate constant for reaction of propene with an adsorbed oligomer species containing n carbon atoms. The selectivity to dimers over all observed products from Figure 2.6 is
!
S(C6) =2k6t[C6 - Z]
2k6t [C6 - Z]+ 3k9c[C9 - Z] (3)
where k6t is the rate constant for dimer desorption from the acid site and k9c is the rate constant for cracking of the adsorbed trimer to C4 and C5 species.
In agreement with Bandiera and Ben Taarit [8], our experiments did not show molecules larger than C6 in significant concentrations in the reactor effluent and, therefore, desorption of trimers from the catalyst can be neglected. Furthermore, as addressed in Section 2.3.1, the formations of oligomers larger than trimers need not be invoked to account for all of the observed products. These constraints mean that reaction r9p can be neglected leading to the rate of trimer formation equaling the rate of trimer cracking at steady-state (r6p = r9c) and simplifying the dimer selectivity to
11
!
S(C6) =2k6t [C6 - Z]
2k6t [C6 - Z]+ 3k6p[C3=][C6 - Z]
=1
1+32k6p[C3
=]k6t
(4)
It is evident from Eqn. 4 that the dimer selectivity is determined exclusively by the relative rates of propagation (r6p) and termination (r6t). The expression for the rate of propene consumption given in Eqn. 2 can also be simplified by neglecting the formation of oligomers larger than the trimers resulting in the following expression for propene consumption her site (derivation provided in the supplemental information):
€
r 'C3= =
2ka[C3=]+ k6p[C3
=] ka[C3=]
k6p[C3=]+ k6t
⎛
⎝ ⎜ ⎜
⎞
⎠ ⎟ ⎟
1+kak3p
+ka[C3
=]k6p[C3
=]+ k6t1+
k6p[C3=]
k9c
⎛
⎝ ⎜
⎞
⎠ ⎟
(5)
IR spectra collected for propene oligomerization as a function of temperature (see
Figure 2.4) show that a large fraction of the Brønsted acid sites are occupied by adsorbed species below 523 K. Furthermore, our QM/MM calculations reveal that the activation energy for trimer cracking (r9c) is lower than that for trimer formation (r6p) suggesting that C9-Z is not present in large concentrations. These observations allow the first and last terms of the denominator in Eqn. 5 to be neglected so that this equation can be rewritten as
€
r 'C3= =
2+k6p[C3
=]k6p[C3
=]+ k6t1
k3p[C3=]
+1
k6p[C3=]+ k6t
(6)
It is therefore evident that, as in the case of dimer selectivity, the rate of propene consumption is a strong function of the relative rates of dimer propagation and termination (r6p and r6t respectively).
The absence of free Brønsted acid sites during reaction at low temperatures leads to the possibility that nearby adsorbed species could influence the values of k6p and k6t present in Eqns. 4 and 6 via steric crowding. To support this hypothesis, the amount of open pore volume as a function of Si/Al ratio was calculated assuming that every Brønsted acid site is occupied by adsorbed species. The free volume of the rigid zeolite was calculated using geometric data obtained from the International Zeolite Association [25] and the volume occupied by the oligomers was calculated assuming that the hydrocarbons could be represented as cylinders based on parameters reported by Jiménez-Cruz and Laredo [26]. The results of these calculations are shown in Figure 2.7.
12
It is clear that at high Si/Al ratios, there is adequate space within the zeolite framework to accommodate dimers, trimers, or longer oligomers adsorbed onto every active site. As the Si/Al ratio decreases, however, the open pore volume is quickly occupied by adsorbed oligomers. At a Si/Al ratio of 12, the zeolite cannot accommodate a trimer adsorbed onto every active site, as this would require more than 100% of the zeolite pore volume. These calculations suggest that oligomers formed in low Si/Al ratio zeolites will be close in proximity to one another and could impede the growth of the oligomers within the pore structure. The result of the preceding analysis suggests that the decreased propene conversion and increased dimer selectivity observed for low Si/Al ratio H-MFI could be due to steric constraints imposed by the zeolite structure as well as nearby adsorbed oligomers. Specifically, it is proposed that adsorbed oligomers in close proximity to each other limit the growth rate of trimers at low Si/Al ratios and, hence, increase the ratio of dimer termination relative to propagation causing a decrease in k6p[C3
=]/k6t and therefore an increase in dimer selectivity, in accordance with Eqn. 4.
Rearranging Eqn. 4 enables k6p[C3=] to be related to k6t by a proportionality
constant, α, as follows
!
k6p[C3=]
k6t=23
1S(C6)
"1#
$ %
&
' ( ) * (7)
Since the dimer selectivity varies with Si/Al ratio as shown in Figure 2.2, α is a function of Si/Al ratio and can be determined directly from the experimentally measured dimer selectivity for each catalyst (Figure 2.8). The rate of propene consumption given in Eqn. 6 can then be simplified using α to eliminate k6p[C3
=].
r 'C3= =2+ !1+!
1k3p[C3
= ]+
1k6t 1+!( )
(8)
Eqn. 8 can be simplified further in two limiting cases. In the first case, the propagation rate coefficients are considered independent of oligomer chain length (k3p = k6p) as suggested by Borges, et al. [27] resulting in Eqn. 9.
€
r 'C3= =2α 1+α( )+α 2
1+2αk6t (9)
The other limiting case is where the dimerization rate coefficient is considered much smaller than the trimerization rate coefficient (k3p << k6p) and is suggested by the results presented in Section 2.3.4. This simplification results in Eqn. 10.
r 'C3= = 2+ !
1+!!
"#
$
%& k3p[C3
= ] (10)
13
It is apparent from Eqn. 9 that a decrease in α (k6p[C3
=]/k6t) would lead to a decrease in the rate of propene consumption, as the numerator in this equation decreases more rapidly than the denominator. The rate of propene consumption given in Eqn. 10 behaves similarly since a decrease in α leads to a decrease in α /(1+ α). Since a decrease in α corresponds to an increase in steric crowding near the active site, Eqns. 9 and 10 predict that the rate of propene consumption would decrease with decreasing Si/Al ratio, in agreement with the experimental results presented in Figure 2.2. The decrease in propene conversion and the increase in dimer selectivity with decreasing Si/Al ratios can be further related through α and either Eqn. 9 or Eqn. 10. In the case of the propagation rate coefficients being equal, k6t is unknown so the ratio of Eqn. 9 for two Si/Al ratios is more useful.
r 'C3= Si/Al = X( )
r 'C3= Si/Al =140( )
=
2! 1+!( ) + ! 2
1+ 2!
!
"#
$
%&Si/Al=X
2! 1+!( ) + ! 2
1+ 2!
!
"#
$
%&Si/Al=140
"
where "=k6t Si/Al = X( )k6t Si/Al =140( )
(11)
In Eqn. 11, the ratio of k6t with Si/Al = X and k6t with Si/Al =140 is defined as β. A similar analysis can be performed for k3p << k6p using Eqn. 10 to eliminate the unknown k3p[C3
=].
€
r 'C3= Si/Al = X( )r 'C3= Si/Al =140( )
=2 +
α1+α
⎛
⎝ ⎜
⎞
⎠ ⎟ Si/Al=X
2 +α1+α
⎛
⎝ ⎜
⎞
⎠ ⎟ Si/Al=140
γ
where γ =k3p Si/Al = X( )k3p Si/Al =140( )
(12)
Here the ratio of the unknown k3p at Si/Al = X and k3p at Si/Al = 140 is defined as γ.
To determine whether these equations could represent the effects of Si/Al ratio on the relative rate of propene consumption, we assumed that β = 1.0 and γ = 1.0, which implies that k6t and k3p[C3
=] are independent of Si/Al ratio in Eqns 11 and 12 respectively. The predictions from Eqns. 11 and 12 based on these assumptions are shown in Figure 2.9. It is apparent that the models match the experimental data qualitatively but under predicts the decrease in the rate of propene consumption at low Si/Al ratios. The discrepancy between the model and the data could be due to small effects of molecular
14
crowding on the dimer desorption rate coefficient (k6t) or the dimerization rate coefficient (k3p[C3
=]), as suggested by the quantum chemical analyses discussed below.
2.3.4 Theoretical Analysis of the Effects of Si/Al Ratio Ab initio QM/MM simulations were performed to identify the effects of steric crowding on the kinetics of propene oligomerization. The key reactions considered were the adsorption of propene on the Brønsted acid site and the dimerization and trimerization of propene to C6-Z and C9-Z species respectively. The primary reactive site in the model is an Al atom at the T12 position in a 276 tetrahedral (Al or Si) atom MFI cluster. To model the interactions between the active site and nearby adsorbed oligomers, linear C6-Z species are adsorbed via the 2’, or secondary, position to two acid sites at next nearest neighbor (NNN) positions of the T12 site, as shown in Figure 2.10. It is evident from this figure that severe molecular crowding at the active site could occur.
The physisorption of propene to the acid site was determined to be an unactivated process characterized by an enthalpy of adsorption at 513 K of -22.5 kcal mol-1. The simulations indicate that 9.0 kcal mol-1 of this enthalpy change is due to interactions between the π-bond of propene and Brønsted acid site proton. As shown in Figure 2.11, the model predicts that chemisorbed propene is only slightly more strongly bound to the acid site compared to physisorbed propene (by ~1-2 kcal mol-1), consistent with the results reported by Namuangruk et al. [28] for the ethene adsorption in FAU. The intrinsic barriers for chemisorption at 513 K were determined to be 19.8 and 11.7 kcal mol-1 for absorption to the 1’, or primary, and 2’, or secondary, carbons of propene respectively. Previous studies have suggested that the concerted dimerization of physisorbed olefins has a high-energy barrier relative to stepwise dimerization with chemisorbed propene [28-29]; therefore, only stepwise dimerization involving chemisorbed propene was considered. Figure 2.11 shows the process for formation of C6-Z via reaction of a second propene with C3-Z. The intrinsic barriers for these processes are 26.8 and 30.5 kcal mol-1 for the 1’ and 2’ chemisorbed species, respectively. When NNN C6-Z moieties are removed from the simulation, the barriers are 26.0 and 33.3 kcal mol-1 respectively. This indicates that NNN C6-Z groups present at low Si/Al ratio can influence the activation energy for C6-Z formation but only to a relatively small degree validating the assumption that γ = 1 in Eqn. 12 and Figure 2.9. The addition of propene to C6-Z, the second oligomerization step, was also considered. Although the activation energy for dimerization did not change significantly when neighboring C6-Z groups were present, Figure 2.7 suggests that the available zeolite pore volume could saturate with the addition of a third propene molecule at low Si/Al ratios. Figure 2.12 shows the van der Waals surfaces of the transition state for the reaction of propene with C6-Z when two NNN C6-Z species are present. As can be seen, only limited space is available for the reaction to occur when two adsorbed NNN C6-Z species are present.
Figure 2.13 shows the energy profile pathway for the reaction of propene with the C6-Z species adsorbed via the 1’ or 2’ position in the presence of NNN species. It is notable that while the heat of propene adsorption onto a 1’ C6-Z species is larger than that for the adsorption onto 2’ C6-Z species, the activation enthalpies for both the 1’ and 2’ species are about the same, 28.4 and 29.0 kcal mol-1, respectively.
15
The effect of NNN C6-Z species on the formation of C9-Z species is illustrated in Figure 2.14. This figure shows the activation enthalpies for trimerization and dimer desorption with and without NNN C6-Z species. In the absence of NNN C6-Z groups, the intrinsic barrier for C9-Z formation is 1.0 kcal mol-1 higher than for hexene desorption. This difference increases to 19.4 kcal mol-1 when neighboring NNN C6-Z species are present suggesting that k6p[C3
=]/k6t should decrease significantly in the presence of NNN C6-Z species. Since the probability of having NNN sites increases with decreasing Si/Al ratio, this means k6p[C3
=]/k6t will be lowest for low Si/Al ratio MFI and predicts that the dimer selectivity will increase and the rate of propene consumption will decrease with decreasing Si/Al ratio. These predictions are consistent with the experimental results presented in Figures 2.1 and 2.2. Furthermore, the QM/MM model predicts that the presence of two NNN C6-Z groups will increase the enthalpy of dimer desorption by approximately 3 kcal mol-1 (Figure 2.14) suggesting that k6t should decrease slightly with decreasing Si/Al ratio. Thus, the assumption that β = 1 in Eqn. 9 and Figure 2.9 seems reasonable. 2.3.5 Consequences of Si/Al Ratio Effect on Formation of Aromatics
In addition to the influence of the active site density on propene conversion and dimer selectivity, the results presented in Figure 2.5 indicates that the Si/Al ratio of H-MFI could affect the amount of aromatic species produced. Although all of the catalysts examined produced aromatic species (as evidenced by the IR peak at 1610 cm-1), the amount of aromatics produced differed in each catalyst, the lowest Si/Al ratio zeolites producing the most aromatic species per Al (Figure 2.5a). Figure 2.5b further shows that the amount of aromatic species increases most rapidly with time-on-stream for the lowest Si/Al ratio under constant reaction conditions. These results suggest that aromatics formation could be enhanced by the presence of Brønsted acid sites in proximity to one another, consistent with the observations reported by Sazama, et al. for 1-butene cracking H-MFI at 773 K [9]. This effect suggests that the increasing proximity of adsorbed dimers and trimers at low Si/Al ratios could induce the formation of aromatic species.
2.4 Conclusions Propene oligomerization was investigated using H-MFI with five different Si/Al ratios. As the Si/Al ratio decreases, the oligomerization activity decreases and the selectivity to dimers increases. This effect cannot be attributed to differences in acid strength, the presence of extra-framework aluminum species, or mass transfer effects. A kinetic analysis suggests that the observed effects of Si/Al ratio are caused by adsorbed oligomers on active sites at low Si/Al ratios. Specifically, at low Si/Al ratios, the steric constraints imposed by adsorbed oligomers on nearby active sites restricts the formation of propene trimers thereby decreasing propene conversion and enhancing the selectivity to dimers. This interpretation is supported by a quantum chemical analysis of the reaction energetics. It is found that oligomers adsorbed on next nearest neighbor sites do not affect the activation energy for propene dimerization but have a significant effect on the activation energy of propene trimerization relative to dimer desorption. The increased barrier to trimerization limits the extent to which C9-Z species and their cracking products (C4 and C5 species) are produced thereby increasing the selectivity to dimers and decreasing the propene conversion at lower Si/Al ratios. The proximity of acid sites
16
also influences the amount of aromatic species produced, with the extent of formation of these species increasing with decreasing Si/Al ratio. This observation suggests that the proximity of Brønsted acid sites and adsorbed oligomers in low Si/Al ratio H-MFI may constrain the oligomers within the zeolite pore leading to an enhancement in aromatics formation. 2.5 Supplemental Information 2.5.1 Examination of Internal Mass Transfer Limitations
To examine internal mass transfer limitations in more detail, a Weisz-Prater analysis was performed. The diffusion coefficient for propene in H-MFI where large olefins and aromatics are present is not readily available, so the diffusion coefficient for ethene in a similar system where ethene and benzene are present in a MFI zeolite [30] was used. Using this diffusion coefficient, the reaction rate of H-MFI with a Si/Al ratio of 40 at 548 K, and a crystal size of 500 nm (determined from SEM, shown in Figure 2.15), the Weisz-Prater parameter was determined to be 0.1. This suggests that, even under the worst-case scenario, intracrystalline mass transfer limitations are not sufficiently large to explain the drastic changes observed in propene conversion at different Si/Al ratios.
2.5.2 Derivation of Eqn. 5 Start with the overall rate of propene consumption given in Section 2.3.3 (Eqn. 2):
This equation can be simplified by assuming oligomerization does not occur past the formation of the trimer.
!
rC3= = ka[C3=][H " Z]+ k3p[C3
=][C3 " Z]+ k6p[C3=][C6 " Z]
Invoking pseudo steady-state approximations, the intermediate surface complexes can be eliminated
d [C3 !Z]dt
= ka[C3= ][H!Z]! k3p[C3
= ][C3 !Z]= 0
[C3 !Z]=kak3p[H!Z]
d [C6 !Z]dt
= k3p[C3= ][C3 !Z]! k6p[C3
= ][C6 !Z]! k6t[C6 !Z]= 0
!
rC3= = ka[C3=][H - Z] + knp[C3
=][Cn - Z]n=3,6,..."
17
[C6 !Z]=
k3p[C3= ]
k6p[C3= ]+ k6t
[C3 !Z]=ka[C3
= ]k6p[C3
= ]+ k6t[H!Z]
d [C9 !Z]dt
= k6p[C3= ][C6 !Z]! k9c[C9 !Z]= 0
[C9 !Z]=k6p[C3
= ]k9c
[C6 !Z]=k6p[C3
= ]k9c
ka[C3= ]
k6p[C3= ]+ k6t
"
#$$
%
&''[H!Z]
These approximations give rise to the new rate equation:
!
rC3= = ka[C3=][H " Z]+ ka[C3
=][H " Z]+ k6p[C3=]
ka[C3=]
k6p[C3=]+ k6t
#
$ % %
&
' ( ( [H " Z] = 0
rC3= = 2ka[C3=]+ k6p[C3
=]ka[C3
=]k6p[C3
=]+ k6t
#
$ % %
&
' ( (
)
* + +
,
- . . [H " Z] = 0
The concentration of vacant sites can be eliminated using a site balance.
!
[Z] = [H " Z]+ [C3 " Z]+ [C6 " Z]+ [C9 " Z]
[Z] = [H " Z]+kak3p[H " Z]+
ka[C3=]
k6p[C3=]+ k6t
1+k6p[C3
=]k9c
#
$ %
&
' ( [H " Z]
[H " Z] =[Z]
1+kak3p
+ka[C3
=]k6p[C3
=]+ k6t1+
k6p[C3=]
k9c
#
$ %
&
' (
Now the rate of propene consumption per site can be rewritten (Eqn. 5 in the text):
!
r 'C3= =rC3=[Z]
=
2ka[C3=]+ k6p[C3
=] ka[C3=]
k6p[C3=]+ k6t
"
# $ $
%
& ' '
1+kak3p
+ka[C3
=]k6p[C3
=]+ k6t1+
k6p[C3=]
k9c
"
# $
%
& '
18
Figure 2.1 a) Propene conversion and b) selectivity to hexene in H-MFI zeolites as a function of temperature and Si/Al ratio. a)
Figure 2.2 Conversion of propene, selectivity to hexene, and yield of hexene as a function of Si/Al ratio in H-MFI at 513 K.
Figure 2.3 Effects of temperature on the concentrations of C4, C5, and C6 products (left axis) and the C4/C5 ratio (right axis) for propene oligomerization carried out with H-MFI (Si/Al = 40).
0 20 40 60 80 100 120 140 1600
10
20
30
40
50
60
[%]
Si/Al
C3 Conversion C6 Selectivity C6 Yield
470 480 490 500 510 520 530 540 5500
1
2
3
4
0.9
1.0
1.1
1.2
1.3
1.4
Prod
uct C
ompo
sitio
n [m
ol %
]
Temperature [K]
C4
C5
C6
C4/C
5 Rat
io
20
Figure 2.4 Effect of temperature on FTIR spectra of H-MFI (Si/Al = 40) taken during the exposure of the catalyst to propene (0.02 bar diluted in helium).
Table 2.1 IR peak assignments for the major peaks observed in the IR spectra [7, 18-20].
Peak [cm-1] Assignment 3745 O-H Stretch in SiOH Groups 3700 O-H Stretch of Physisorbed Alkane on Si-OH groups 3610 O-H Stretch of Brønsted acid Site 3470 O-H Stretch of Physisorbed Alkane on Brønsted acid Site 2955 CH3 Asymmetric Stretch 2933 CH2 Asymmetric Stretch 2880 CH3 Symmetric Stretch 2865 CH2 Symmetric Stretch
ca. 1610 C=C-C Aromatic Ring Stretch 1510 C=C-C Aromatic Ring Stretch; Carbocation in H-Zeolites 1467 CH2 Bend 1458 CH3 Asymmetric Bend 1377 CH3 Symmetric Bend; gem-Dimethyl Doublet 1367 gem-Dimethyl Doublet
Figure 2.5 a) Effects of temperature and Si/Al ratio on the intensity of the IR peak observed at ca. 1610 cm-1 attributed to aromatic species normalized by the amount of aluminum present in the pellet. b) Change in the intensity of the band at 1610 cm-1 observed at 573 K as a function of time and Si/Al ratio. The spectrum for H-MFI (Si/Al = 140) is similar to that for the H-MFI (Si/Al = 40) catalyst and is not shown for the sake of clarity. a)
b)
400 450 500 5500.00
0.02
0.04
0.06
0.08
0.10
0.12
0.14
1610
cm
-1 P
eak
Inte
nsity
[A.U
.]
Temperature [K]
Si/Al = 12 Si/Al = 15 Si/Al = 25 Si/Al = 40
0 200 400 600 800 10000.00
0.05
0.10
0.15
0.20
0.25
1610
cm
-1 P
eak
Inte
nsity
[A.U
.]
TOS [s]
Si/Al = 12 Si/Al = 15 Si/Al = 25 Si/Al = 40
22
Figure 2.6 Simplified reaction pathway of propene oligomerization on a Brønsted acid catalyst neglecting side reactions such as cyclization, aromatization, hydrogenation, and the desorption of species larger than the dimer from the surface.
Figure 2.7 The effect of Si/Al ratio on the fraction of the pore volume of H-MFI occupied by oligomers assuming every active site were occupied by dimers or trimers.
0 20 40 60 80 100 120 140 1600
20
40
60
80
100
120
Dimer Trimer
% P
ore
Vol
ume
Fille
d
Si/Al
23
Figure 2.8 Value of α from Eqn. 7 as a function of Si/Al ratio.
Figure 2.9 Effect of Si/Al ratio on the rate of propene consumption normalized to the rate of propene consumption at Si/Al = 140. The experimental data were taken from Figure 2 and the model results come from Eqn. 9.
0 20 40 60 80 100 120 140 160
0.6
0.8
1.0
1.2
1.4
1.6
1.8
Alp
ha [-
]
Si/Al
0 20 40 60 80 100 120 140 1600.0
0.2
0.4
0.6
0.8
1.0
1.2
Rat
e (S
i/Al =
x)/R
ate
(Si/A
l = 1
40)
Si/Al
Data Model, β = 1 Model, γ = 1
24
Figure 2.10 View of the central region of a T276 cluster representation of H-MFI. Oligomerization reactions occur at the central Al site at the T12 position, which is described by quantum mechanics. The rest of the framework including the two next nearest neighbor Al sites containing adsorbed C6-Z species are described by molecular mechanics.
Figure 2.11 Reaction coordinate diagram for the absorption and dimerization of propene in the presence of NNN C6-Z groups in low Si/Al ratio H-MFI. The 1’ pathway is for the reaction with the primary propene alkoxide species and the 2’ pathway is for the secondary propene alkoxide.
Active site
NNN C6-Z
NNN C6-Z
25
Figure 2.12 Van der Waals surfaces for the trimerization transition state occurring when NNN C6-Z groups are present. The reacting propene and hexene (blue) take up enough space in the zeolite such that the NNN C6-Z groups (orange) crowd the reaction.
Figure 2.13 Reaction coordinate diagram for the formation of C9 via the 1’ and 2’ pathways in the presence of NNN C6-Z groups that occur in low Si/Al ratio MFI.
26
Figure 2.14 Reaction coordinate diagram comparing C9-Z formation with or without NNN C6-Z groups in low Si/Al ratio and high Si/Al ratio H-MFI, respectively.
27
Figure 2.15 SEM images of two H-MFI zeolites with Si/Al = 23 used for internal mass transfer examination a) 500 nm average diameter b) 300 nm average diameter. a)
b)
1 μm
2.5 μm
28
References: [1] M. Marchionna, M. Di Girolamo, R. Patrini, Catal. Today 65 (2001) 397-403. [2] M.L. Occelli, J.T. Hsu, L.G. Galya, J. Mol. Catal. 32 (1985) 377-390. [3] A. Corma, S. Iborra, in: E.G. Derouane (Ed.), Catalysts for Fine Chemical Synthesis, vol. 4, J. Wiley & Sons Ltd, UK, 2006, p. 125-132. [4] N.Y. Chen, W.E. Garwood, F.G. Dwyer, Shape Selective Catalysis in Industrial Applications, Marcel Dekker Inc., New York, 1996, p. 168-172. [5] W.E. Garwood, in: G.D. Stucky, F.G. Dwyer (Eds.), ACS Symposium Series 218, American Chemical Society, Washington, DC (1983) 383-396. [6] R.J. Quann, L.A. Green, S.A. Tabak, F.J. Krambeck, Ind. Eng. Chem. Res. 27 (1988) 565-570. [7] G. Spoto, S. Bordiga, G. Ricchiardi, D. Scarano, A. Zecchina, E. Borello J. Chem. Soc. Faraday Trans. 90 (1994) 2827-2835. [8] J. Bandiera, Y. Ben Taarit, Appl. Catal. A-Gen. 132 (1995) 157-167. [9] P. Sazama, J. Dědeček, V. Gábová, B. Wichterlová, G. Spoto, S. Bordiga, J. Catal. 254 (2008) 180-189. [10] F.E. Celik, T.J. Kim, A.T. Bell, J. Catal. 270 (2010) 185-195. [11] J.F. Joly, N. Zanier-Szydlowski, S. Colin, F. Raatz, J. Saussey, J.C. Lavalley, Catal. Today 9 (1991) 31. [12] P.M. Zimmerman, M. Head-Gordon, A.T. Bell, J. Chem. Theory Comput. 7 (2011) 1695-1703. [13] D.H. Olson, G.T. Kokotailo, S.L. Lawton, W.M. Meier, J. Phys. Chem.-US 85 (1981) 2238-2243. [14] D.H. Olson, N. Khosrovani, A.W. Peters, B.H. Toby, J. Phys. Chem. B 104 (2000), 4844-4848. [15] B.F. Mentzen, M. Sacerdote-Peronnet, Mater. Res. Bull. 29 (1994), 1341-1348. [16] (a) N. Foloppe, A.D. MacKerell, J. Comput. Chem. 21 (2000) 86–104. (b) D. Yin, A.D. MacKerell, J. Comput. Chem. 19 (1998), 334–348. (c) K. Vanommeslaeghe, E. Hatcher, C. Acharya, S. Kundu, S. Zhong, J. Shim, E. Darian, O. Guvench, P. Lopes, I. Vorobyov, A.D. MacKerell, J. Comput. Chem. 31 (2010) 671-690. [17] Y. Shao, L.F. Molnar, et al., Phys. Chem. Chem. Phys. 8 (2006), 3172–3191. [18] J. Coates, in: R.A. Meyers (Ed.), Encyclopedia of Analytical Chemistry, J. Wiley & Sons Ltd, UK, 2000, p. 1-23. [19] I. Kiricsi, H. Förster, G. Tasi, J.B. Nagy, Chem. Rev. 99 (1999) 2085-2114. [20] A.K. Ghosh, R.A. Kydd, J. Catal. 100 (1986) 185-195. [21] D. Freude, M. Hunger, H. Pfeifer, W. Schwieger, Chem. Phys. Lett. 128 (1986) 62-66. [22] D.J. Parrillo, C. Lee, R.J. Gorte, Appl. Catal. A-Gen. 110 (1994) 67-74. [23] L. Kubelková, J. Nováková, K. Nedomová, J. Catal. 124 (1990) 441-450. [24] R. Gounder, E. Iglesia, J. Amer. Chem. Soc. 131 (2009) 1958-1971. [25] IZA Online, www.iza-structure.org/databases/ Accessed on January 20, 2011. [26] F. Jiménez-Cruz, G.C. Laredo, Fuel 83 (2004) 2183-2188. [27] P. Borges, R. Ramos Pinto, M.A.N.D.A. Lemos, F. Lemos, J.C. Védrine, E.G. Derouane, F. Ramôa Ribeiro, Appl. Catal. A-Gen. 324 (2007) 20-29. [28] S. Namuangruk, P. Pantu, J. Limtrakul, ChemPhysChem 6 (2005) 1333-1339.
29
[29] S. Svelle, S. Kolboe, O. Swang, J. Phys. Chem. B 108 (2004) 2953-2962. [30] N. Hansen, R. Krishna, J.M. van Baten, A.T. Bell, F.J. Keil, J. Phys. Chem. C 113 (2009) 235-246.
30
Chapter 3
Propene Oligomerization over Ni-Exchanged Na-X Zeolites
Abstract
The oligomerization of propene was investigated over a series of nickel ion-exchanged Na-X zeolites with varying Ni loadings. Catalyst characterization by temperature-programmed reduction, elemental analysis, and XANES indicates that all of the exchanged Ni is present as Ni2+ that charge-compensates two exchange sites. The selectivity to propene oligomers remained greater than 98% for all Ni-Na-X with dimers being the main product. In contrast, the activity of Ni-Na-X was determined to depend strongly on Ni loading. At low to intermediate Ni loadings, the catalyst activates, reaches a maximum activity and then deactivates with time on stream. The rates of activation and deactivation are functions of the Ni content in the zeolite and both increase with increasing Ni loading. Stable activity was achieved for low Ni loadings (< 0.6 wt%) by rapidly activating and deactivating the catalyst in propene at elevated temperature. The rate of propene dimerization measured under steady-state conditions is first-order in propene and characterized by an activation energy of 45 kJ mol-1. Activation of Ni-Na-X is attributed to migration of the Ni2+ cations from hexagonal prisms of the zeolite into the supercage where the cations form a catalytically active Ni2+-olefin complex. Deactivation is proposed to occur via the reaction of two nearby Ni-olefin complexes leading to the deactivation of both sites. A model for the dynamics of activation and deactivation and for the dimerization of propene to hexene is proposed. This model provides a satisfactory description of the effects of propene partial pressure and Ni loading on the rate of propene dimerization as a function of time on stream. 3.1 Introduction Oligomerization of light olefins, C2-C5, is of substantial interest as a means for producing high-volume hydrocarbons including gasoline and diesel fuels [ 1 - 2 ]. Heterogeneous Brønsted acid catalysts, including zeolites, are known to catalyze olefin oligomerization at moderate temperature and pressure; however, the selectivity to oligomers is low as the Brønsted acid sites are also active for product cracking and aromatization under operating conditions [2-4]. Furthermore, although the Brønsted acids catalysts are highly active for C3-C5 olefin oligomerization, the oligomerization of ethene is more difficult and requires higher temperatures to reach meaningful conversions [3]. A number of authors have considered Ni-based catalysts as an alternative to Brønsted acid catalysts because such catalysts are highly selective to oligomers and active for ethene oligomerization [3, 5-9]. These catalysts have been shown to be highly active for olefin oligomerization at lower temperatures but higher pressures than those required for Brønsted acid catalysts. For example, it has been shown that Ni-exchanged aluminosilicates can realize 99% ethene conversion with 97% selectivity to oligomers at 393 K and 35 bar [9].
31
Although numerous Ni-exchanged aluminosilicates, including zeolites, have been shown to be active catalysts for olefin oligomerization, there is little consensus regarding how the catalysts function. Ni catalysts have been reported to possess an activation period when the olefin is first introduced to the catalyst [9-11], but the cause of the activation period is not known. It has also been reported that the catalyst can deactivate with time on stream, which has been attributed to site blocking by the formation of long oligomers [6, 12-13] or to the irreversible reduction of the Ni site to inactive Ni0 [14], but neither of these mechanisms explain the long-term catalyst stability observed at higher pressure [9]. There is also disagreement concerning the nature of the active site, with various authors having reported it to be Ni2+ [11, 15], Ni+ [10-11, 15], or a pair of Ni and H+ sites [13, 16-17]. Lack of agreement between the active site and an understanding of the causes of catalyst activation and deactivation make elucidating the mechanism for olefin oligomerization challenging. The goal of this study is to establish the causes of catalyst activation and deactivation during low pressure olefin oligomerization of propene in Ni-exchanged zeolites as well as the state of the active site through these transformations. A series of Ni-exchanged Na-X zeolites were synthesized with varying Ni weight loadings to probe the effects of Ni loading on the activity and catalyst selectivity. The Ni weight loading of the catalyst was determined to influence both the time required to activate and deactivate the catalyst. Comparison between the Ni-Na-X zeolite and a catalyst containing isolated Ni cations on SiO2 shows that the activation period is due to the zeolite framework and is consistent with migration of Ni from the hexagonal prisms of the zeolite to the supercage. The deactivation of the catalyst was determined to be inversely proportional to the time on stream and suggests that the loss of activity is caused by a two-site deactivation mechanism. A model of the reaction kinetics was developed and shows that the proposed activation and deactivation mechanisms are consistent with the experimental results. The oxidation state of the Ni cations was explored using in situ XANES experiments and have shown that Ni remains Ni2+ throughout the synthesis and reaction with propene suggesting that stable steady-state activity is due to isolated Ni2+ complexes. 3.2 Methods 3.2.1 Catalyst Preparation Ni-Na-X was prepared by aqueous ion-exchange of 5 g of Na-X (Sigma-Aldrich, 13X, powder) with 100 mL of 1-100 mM Ni(NO3)2 (Sigma-Aldrich, 99.999% trace metals basis, hexahydrate) solution. The exchange was performed at 343 K for 16 h in a round-bottomed flask equipped with a Teflon coated stir-bar and a water-cooled condenser. The exchanged zeolite was filtered, washed with deionized water (Millipore), and dried before being rewashed and dried to remove residual nickel nitrate. The catalyst was placed in a quartz boat and heated in a horizontal quartz tube furnace to 773 K at 2 K min-1 under 100 cm3 min-1 air (Praxair, zero-grade) and held at 773 K for 3 h to remove the nitrate groups and residual water. After calcination, the samples were stored in a desiccator to limit the readsorption of water vapor. Ni-Na-MOR was prepared using the same procedure with 5 g of Na-MOR (Zeolyst, Si/Al = 6.5) and 100 mL of 5 mM Ni(NO3)2 solution.
32
A Ni-SiO2 catalyst was synthesized as follows: 390 mg of Ni(NO3)2�6H2O and 405 mg of H-EDTA (Sigma-Aldrich, 99%) were added to 15 mL of water (Millipore) to create a solution with an approximately 1:1 molar ratio of Ni to H-EDTA. The mixture was then heated to 343 K for 6 h to dissolve most of the H-EDTA and resulted in the solution changing color from deep green to blue suggesting the formation of a Ni-EDTA complex [18]. Incipient-wetness impregnation of 2.30 g of solution into 2.00 g of Silicycle silica (average pore diameter = 150 Å; surface area = 300 m2 g-1) followed by calcination at 773 K under 100 cm3 min-1 of air to remove the EDTA ligands produced the 0.6 wt% Ni-SiO2 catalyst. After calcination, the catalyst was stored in a desiccator to limit readsorption of water vapor. 3.2.2 Catalyst Characterization Catalysts were characterized by a number of different techniques. Ni, Na, Si, and Al contents were determined using inductively-coupled plasma optical emission spectroscopy conducted at Galbraith Laboratories in Knoxville, TN. Micropore volume measurements were obtained using the t-plot method with N2 (Praxair, 99.999%) adsorption and were collected using a Micromeritics Gemini VII BET instrument. Prior to carrying out the BET experiments, samples were outgassed overnight at 393 K under vacuum to remove residual adsorbed water. X-ray diffraction (XRD) data were obtained by immobilizing the catalyst powder on a XRD sample plate using Vaseline. The sample was then analyzed with a Siemens D5000 diffractometer using Cu Kα radiation and a scintillation counter detector. Data were digitally recorded from 7-35° 2θ with a step size of 0.015°. Temperature-programmed reduction (TPR) experiments were carried out by loading 7-30 mg of sample into a quartz U-tube, which was then attached to a Quantasorb TPR instrument. The sample was heated at 10 K min-1 to 1048 K in 1% H2 diluted in argon (Praxair, certified standard) and the consumption of H2 was monitored using a thermal conductivity detector. Transmission electron microscopy (TEM) was performed by Dr. Zhenmeng Peng at the Electron Microscopy Laboratory of the University of California, Berkeley. High-angle annular dark-field scanning transmission electron microscopy (HAADF-STEM) images were taken using a FEI Tecnai F20 microscope operated at an accelerating voltage of 200 kV and equipped with an electron-gun monochromator. Samples were prepared by sonicating 50 mg of sample in 10 mL of isopropyl alcohol to create a suspension that was then dropped onto a carbon-coated copper grid and dried in ambient air. Ni K-edge x-ray absorption data were collected at the Advanced Photo Source at Argonne National Lab on beamline 10-BM. Sample pellets were pressed into a sample holder that was then placed in a horizontal quartz tube between two ionization chamber detectors. A Ni reference foil was placed after the second ionization chamber allowing the collected sample spectra to be aligned to the foil. In situ experiments were carried out by placing the sample tube in a furnace located between the ionization chambers where the sample was heated to 773 K in 100 cm3 min-1 of air and held at temperature for one hour to remove moisture. The cell was then cooled to the reaction temperature of 453 K and purged with 100 cm3 min-1 of helium for 15 min before switching to 30 cm3 min-1 of propene and holding at 453 K for 8 h. Data were analyzed using the Athena program of the IFEFFIT software package [19-20].
33
3.2.3 Measurement of Reaction Rates
Measurements of catalyst activity were performed using a ½” stainless steel reactor that was pinched in the middle to allow for the creation of a fixed bed. Quartz wool was placed inside the reactor followed by 200 mg of catalyst diluted with 100 mg of Silicycle silica. Additional quartz wool was placed on top of the catalyst to create a fixed bed. A K-type thermocouple was then inserted directly into the fixed bed to monitor the temperature. The reaction pressure was controlled digitally using a Tescom back-pressure regulator.
Prior to each experiment, samples were calcined in situ in 100 cm3 min-1 of air. The sample temperature was raised to 773 K at 2 K min-1 and held for 3 h to remove water that had readsorbed while preparing the reactor. Samples were then cooled to reaction temperature at 2 K min-1, flushed with 100 cm3 min-1 helium for 5 min, and then contacted with 30 cm3 min-1 of propene (Praxair, 99.9%) while increasing pressure to reaction conditions. Products were analyzed using an Agilent 7890A gas chromatograph equipped with a gas-sampling valve, a 30 m HP-Plot Q column, and a flame ionization detector.
3.3 Results 3.3.1 Catalyst Characterization The catalyst Ni loading and degree of site exchange, determined from elemental analysis, is shown in Figure 3.1 for each catalyst used in this study. For Ni(NO3)2 concentrations between 1 and 50 mM, the Ni loading increases linearly with the concentration of Ni(NO3)2, as expected for complete exchange of two Na+ cations by one Ni2+ cation. The only data point that lies below this line is for the sample prepared using the 100 mM Ni(NO3)2 exchange solution, indicating that beyond 37% exchange, not all of the Ni2+ cations are removed from the exchange solution. Table 3.1 shows that even for this catalyst, all of the Ni2+ cations exchanged into the catalyst still charge-compensate two exchange sites. XRD, BET, and TEM characterization of the 0.6 wt% Ni-Na-X catalyst confirmed that the zeolite framework remained intact after Ni exchange and subsequent calcination (see Supplemental Information). TPR measurements shown in Figure 3.2 confirm that all of the Ni present in the Ni-Na-X samples resides as charge-compensating cations. The 9.3 wt% Ni-Na-X sample exhibits two strong reduction peaks at 940 K and ~1025 K. Control experiments with NiO supported on silica show that neither of these peaks is attributable to bulk NiO which reduces at approximately 715 K [21]. The peak at 1025 K has been previously observed in the TPR spectrum of Ni-X [22] and has been attributed to the degradation of the zeolite. We have confirmed this assignment through the observation of a similar peak in the TPR spectrum of the parent Na-X zeolite. The high temperature peak at 940 K observed in the TPR spectrum of Ni-Na-X is attributable to the reduction of charge-compensating Ni2+ cations and has been observed in the TPR spectrum of Ni-exchanged MFI [21].
X-ray absorption spectroscopy was used to establish the oxidation state of Ni in the samples used for the present study. Figure 3.3 shows the Ni XANES region for the 9.3 wt% and 0.6 wt% Ni-Na-X samples along with two Ni standards: NiO and Ni metal
34
foil. It is apparent that the edge energies of the Ni-Na-X samples are similar to that for NiO indicating that Ni is 2+ in the as-prepared samples, although the edge positions for Ni-Na-X are shifted slightly from that for NiO. This shift is likely due to the difference between the Ni coordination environment and Ni-O bond distances of Ni in the zeolite from those for Ni in the purely octahedral NiO, as has been suggested by UV-visible [23] and DFT [24] studies of Ni-Na-X.
Exposure of the catalyst to propene under catalytic conditions (453 K, 1 bar) does not shift the Ni edge appreciably, as seen in Figure 3.3. This suggests that Ni remains Ni2+ under catalytic conditions and that the active site is likely comprised of a Ni2+ species. The in situ XANES experiment was carried out for an additional 8 h with no difference observed between scans suggesting that Ni remains Ni2+ throughout the experiments discussed below.
The Ni-SiO2 catalyst was characterized by XANES, TPR, and TEM experiments (see Supplemental Information). The XANES data confirmed that Ni is present solely as Ni2+ after incipient-wetness impregnation and calcination. In addition, TPR and TEM show no evidence for the formation of bulk NiO in the catayst. These results are consistent with the formation of isolated Ni2+ cations that have exchanged with silanol groups on the silica to produce bridging species analogous to that in ion-exchanged Ni-Na-X.
3.3.2 Catalyst Activity The effect of Ni loading on the propene oligomerization activity of Ni-Na-X catalysts at 453 K and a propene partial pressure of 1.25 bar is shown in Figure 3.4. All catalysts exhibited > 98% selectivity to oligomers (hexene and nonene) during the first hour of time on stream with the only other products observed being olefins produced from oligomer cracking. Control experiments using Na-X showed less than 0.1% conversion of propene to products and that hexene cracking is due to residual Brønsted acid sites in the zeolite. These sites deactivated after 1 h of time on stream after which the selectivity to propene oligomers became > 99.5% for the duration of the experiment. Under these conditions, dimers accounted for > 90% of products with trimers accounting for the remainder of the products.
Figure 3.4 shows that the 9.3 wt% Ni-Na-X sample exhibits high initial activity but then rapidly deactivates with time on stream. As the Ni loading decreases, the initial conversion of propene decreases to zero and the catalyst exhibits an activation period that increases in duration with decreasing Ni content. After the initial activation period, the low Ni loaded catalysts deactivate with time on stream, although at a rate slower than that observed for the 9.3 wt% sample. The decrease in the deactivation rate is evident when examining catalytic activity at long times on stream. After 2100 min of time on stream, 0.6 wt% Ni-Na-X still exhibits 0.67% propene conversion whereas 9.3 wt% Ni-Na-X is inactive after the same duration. Recalcination of the catalyst in air at 773 K for 3 h completely regenerated the catalyst and did not change the activation or deactivation periods when olefin was reintroduced at 453 K. It was also observed that switching to helium after the experiment and holding the temperature at 673 K for 3 h led to partial regeneration of the catalyst activity suggesting that an oxidizing environment is not required to regain catalytic activity.
35
Stabile catalytic activity was only observed for the low Ni-loaded catalysts; however, the long activation and deactivation periods of these catalysts required exceptionally long times-on-stream to attain steady-state at 453 K. To overcome this limitation, the effects of temperature and olefin pressure were explored as potential means to decrease the time to achieve steady-state activity. While raising the propene pressure from 1.25 bar to 5 bar decreased the time required to reach maximum activity from 194 min to 151 min for the 0.6 wt% Ni-Na-X, it did not change the deactivation profile significantly, as shown in Figure 3.5. However, increasing the initial temperature to 493 K significantly decreased the time required for catalyst activation, as shown in Figure 3.6. After activation at 493 K, the catalyst could be cooled to the desired reaction temperature and stable catalytic activity could be achieved. Using this procedure, the temperature and pressure dependencies of the catalyst could be explored at steady-state (see Supplemental Information for data). It was determined that the apparent activation energy for propene consumption between 413 and 453 K is 45 kJ mol-1. The rate of dimer formation is linearly dependent on the propene pressure between 1 and 5 bar, whereas the trimer formation rate is proportional to the square of the propene pressure over the same range. Extrapolating to zero propene pressure gives non-zero formation rates for both the dimer and trimer. This feature is attributed to the formation of dimers and trimers on Brønsted acid sites that become saturated by adsorbed oligomers, and therefore become zero-order in propene, at propene pressures below 1 bar. Subtraction of the extrapolated non-zero dimer and trimer formation rates at zero bar from the oligomer formation rates at all measured pressures gives the expected first-order and second-order pressure dependencies for dimer and trimer formation, respectively, providing evidence for the existence of the saturated sites. The influence of the support on propene oligomerization activity was explored by comparing the catalyst activity as a function of time on stream for isolated Ni sites supported on SiO2 (Ni-SiO2), Ni-Na-MOR, and Ni-Na-X. Figure 3.7 shows the activity of 0.6 wt% Ni-Na-X, 0.6 wt% Ni-Na-MOR, and 0.6 wt% Ni-SiO2 for propene oligomerization at 453 K and 5 bar. The Ni-SiO2 and Ni-Na-MOR catalysts did not exhibit an activation period and showed high initial activity followed by rapid deactivation with time on stream. This behavior was quite different from that of the Ni-Na-X catalyst, which required 151 min to activate and reach peak activity before the activity began to decrease at a rate slower than that for the Ni-SiO2 catalyst. 3.4 Discussion 3.4.1 Activation Period The results shown in Figure 3.7 suggest that the activation period observed for Ni-Na-X is a consequence of the faujasite structure, since neither Ni-SiO2 nor Ni-Na-MOR catalysts exhibit an activation period. Furthermore, it is observed in Figure 3.4 that the time required to activate Ni-Na-X is a function of the Ni loading and that it decreases with increasing Ni content.
A review of the literature provides some insight into the processes responsible for the activation of Ni-Na-X. It has been previously reported that, after calcination, Ni resides inside the hexagonal prisms and sodalite cages, or SI and SII sites of the faujasite zeolite respectively (see Figure 3.8), when the degree of cation exchange is less than 40%
36
[25]. This corresponds to all catalysts examined with the exception of the 9.3 wt% Ni-Na-X sample, for which 57% of the Na cations are exchanged. These observations suggest that the Ni2+ cations situated in the hexagonal prisms and sodalite cages are not active for propene oligomerization. Consistent with this hypothesis is our observation of the immediate oligomerization of propene for the 9.3 wt% Ni-exchanged sample in contrast to the slow activation observed for the 0.6 wt% Ni-Na-X sample. Further support for our interpretation comes from XRD, EXAFS, and DFT studies showing that the Ni cations in Ni-Y and Ni-X are mobile and can occupy different site locations within the zeolite [24-29]. In the presence of water, the Ni cations are found to reside in the supercage of the zeolite framework. Upon heating Ni-exchanged faujasite in dry gas, water desorbs from the Ni cation-water complex and the Ni cations migrate into the hexagonal prisms and sodalite cages. Although the mechanism of Ni migration is not understood, it is proposed that the loss of coordinating water ligands leads to undercoordination of the Ni cations remaining in the supercage causing them to migrate into the hexagonal prisms of the zeolite where they can coordinate with lattice oxygen atoms and thereby be stabilized. This process was shown to be reversible and the addition of water as well as decreasing the temperature caused the Ni to migrate back into the supercage. It has also been observed that the time to reduce Ni in Ni-exchanged Na-Y zeolites depends on the extent of Ni exchange [26]. This dependence is thought to be due to local distortions in the lattice surrounding the Ni cations occupying hexagonal prisms. The reduction of the Ni cations residing in the SI sites causes migration of the Ni atoms out of the hexagonal prism thereby allowing the lattice to relax, which in turn encourages Ni located in adjacent hexagonal prisms to reduce leading to faster Ni reduction times with increased Ni loading.
We propose that the activation period in the propene/Ni-Na-X system is caused by the migration of Ni2+ cations to the supercage facilitated by the presence of propene instead of water. An illustration demonstrating the activation process is given in Figure 3.8. Before the introduction of propene, the Ni2+ cations reside in the SI sites of the zeolite as a consequence of the in situ calcination of the catalyst to 773 K in air (location 1). Upon introduction of a coordinating ligand, i.e. propene, at 543 K, the Ni2+ cations slowly migrate into the sodalite cages (location 2), where they are then complexed by propene at the sodalite/supercage windows leading to the Ni2+-propene complex migrating into the supercage (location 3). As was previously reported for Ni2+ reduction in Na-X [26] and observed in a recent DFT study [24], the movement of one Ni2+ cation out of the SI site causes the distorted hexagonal prism to relax and can thereby encourage nearby Ni cations residing in SI sites to undergo the same migration. This assisted migration reaction explains the exponential activation with time on stream and the increasing activation time with decreased Ni loading. Finally, the activation of Ni-Na-X does not involve a change in the oxidation state of the Ni2+ cations, consistent with the in situ XANES observations.
It should be noted that the proposed cause of activation for Ni-Na-X is consequence of the FAU framework structure, which contains hexagonal cages that are accessible to Ni2+ cations. The hexagonal cages are not present in either amorphous SiO2 or MOR, and it is for this reason that Ni2+ cations on these supports are active immediately upon exposure to propene.
37
3.4.2 Deactivation Period Figure 3.4 shows that all of the catalysts investigated deactivated with time on stream, but the rate and extent of deactivation depended on the Ni loading. As the Ni loading increased beyond 0.6 wt%, the rate of propene consumption per Ni site decreased at peak activity and the extent of deactivation increased. These observations are shown in Figure 3.9 and illustrate that below 0.6 wt%, the catalyst does not deactivate significantly within 90 mins of time on stream after peak activity. This corresponds to 4% of the sites exchanged with Ni, or approximately one Ni2+ cation per every four to five zeolite supercages on average. Therefore, maximum specific activity and stability are achieved when the Ni cations exchanged into Na-X are highly dispersed. The loss in oligomerization activity from the maximum value is inversely dependent on the time on stream, suggesting that deactivation involves two sites [30], rather than the formation of long oligomers on one Ni site, as has been previously suggested [6, 12-13]. Furthermore, the deactivation cannot be caused by the growth of oligomers on one site blocking other active sites since increased propene partial pressure, and therefore increased conversion to oligomers, did not influence the rate of deactivation as observed in Figure 3.5. Reduction of Ni2+ cations to form Ni0 clusters, previously suggested as the cause for catalyst deactivation in a similar system [14], cannot explain the loss in catalytic activity either as the in situ XANES experiments show that Ni2+ sites continue to be present even in the deactivated catalyst. We propose that deactivation is caused by the reaction between two nearby Ni2+-olefin complexes in which a shared bridging olefin prevents carbon-carbon bond formation between olefins on the same Ni2+ site. A schematic of this interaction is illustrated in Figure 3.10. Although no direct evidence for such a complex is observed, the proposed deactivation mechanism explains a number of experimental observations. Formation of the complex requires two sites for every deactivation event and means that the decay of activity with time on stream is hyperbolic. The formation of a bridged olefin complex is supported by the observation that neither new gas-phase products nor new FTIR absorption bands attributable to molecules other than adsorbed oligomers were observed during deactivation. Furthermore, it was observed that heating the catalyst in an inert atmosphere to 673 K after the experiment led to partial regeneration of catalyst activity. This is consistent with the proposed bridged olefin complex as heating the catalyst would allow for removal of the bridged olefin species and would not require an oxidizing atmosphere. Finally, the formation of the proposed complex would be hindered at high propene partial pressures since breaking apart of the complex to two Ni sites could accommodate more propene and is consistent with the high catalyst stability previously reported at 35 bar [9]. 3.4.3 Modeling Catalytic Activity with Time on Stream A model was developed to describe the kinetics of catalyst activation and deactivation, as well as the effects of propene pressure and Ni loading on the formation of hexene. The reactions considered in the model are shown in Figure 3.11. The first three reactions account for the migration of Ni2+ cations from the hexagonal prisms to the supercage of the zeolite. Reaction 1 represents the unassisted migration of Ni2+ from the
38
hexagonal prisms to the six-membered ring windows between the sodalite cages and the supercage and is described by the rate coefficient km. Reaction 2 is similar to Reaction 1 except that relaxation of hexagonal prisms in the zeolite, corresponding to migration of Ni from those prisms into the sodalite cage and supercages, is assumed to enhance the reaction rate and leads to the exponential activation with time on stream. This reaction is characterized by the rate coefficient kn and scales with the square of the Ni content as each Ni2+ cation residing in a hexagonal prism induces stress on the zeolite framework. The final step in the activation process, Reaction 3, is the reaction of propene with Ni2+ residing in the six-membered ring windows between the sodalite cage and supercage, which allows the Ni2+ cations to fully migrate into the supercage and form the active Ni sites. This reaction is not elementary and is likely comprised of multiple steps with the rate determining step being bimolecular, and therefore first-order in propene, rather than trimolecular as the reaction is written. Reactions 4 and 5 in Figure 3.11 depict a sequence of steps by which the dimer could be formed. We note that this set of reactions is intended to capture the kinetics of dimer formation and that the actual sequence of elementary steps required to form hexene may be more complex. Reaction 4 represents the formation of the adsorbed dimer from the reaction between one molecule of propene and the activated Ni2+ complex generated in Reaction 3 and is described by the rate coefficient k1. Following dimerization, propene displaces the adsorbed dimer in Reaction 5, described by the rate coefficient k2, to produce hexene and regenerate the active site. Reaction 5 is expected to be reversible, but the reverse of Reaction 5 is neglected due to the small concentrations of hexene present at low conversions. Reaction 6 describes the deactivation pathway in which two Ni(C3
=)2 are assumed to react thereby forming a complex that deactivates both sites. This process is characterized by the rate coefficient kD. Multiple reaction rate expressions were explored for the catalyst deactivation, but the best fits of the model to the data were achieved using a reaction rate that depends on the square of the concentration of Ni(C3
=)2. This implies that deactivation is related to the total Ni content in the zeolite rather than the proximity of Ni sites to one another and may suggest that activated Ni2+ sites in the supercage may be mobile. The unsteady-state material balances for the species present in Figure 3.11 are as follows:
This coupled set of differential equations can be solved numerically, assuming that all of the Ni2+ cations reside in the hexagonal prisms of the zeolite at the beginning of the reaction, that is to say [Ni(SI)] = [NiTot] at t = 0. The rate of hexene formation per site can then be determined using Eqn. 6.
(6)
A MATLAB script was written to solve Eqns. 1-5 and a nonlinear regression function was then used to optimize the rate coefficients for the rate of dimer formation, Eqn. 6, as a function of time on stream for 0.6 wt% Ni-Na-X. The results of the model fitted to these data are shown in Figure 3.12a with concentrations of the different Ni species shown in Figure 3.12b. The optimized rate coefficients are presented in Table 3.2. It is evident from the fit that the model accurately describes both the exponential activation and the hyperbolic deactivation of the catalyst with time on stream and agrees well with the data throughout the entire activity profile. The model was used to explore the effects of propene pressure and Ni loading on the rate of hexene formation as a function of time on stream. The results of these simulations are shown in Figure 3.13 using the rate coefficients given in Table 3.2. As seen in Figure 3.13a, increasing the propene pressure from 1.25 bar to 5 bar increases the rate of dimer formation but has little effect on the time needed to reach peak activity, consistent with the results presented earlier in Figure 3.5. Figure 3.13b compares the predictions of the model with the experimental data for different Ni loadings as a function of time on stream. The predictions obtained from the model are presented in Figure 3.13b as solid lines. The model predicts faster activation and deactivation with increasing Ni loading, consistent with what is observed experimentally. The predictions of the model to changes in Ni loading and propene partial pressure demonstrate that the model provides a reasonable interpretation of the experimental results; however, quantitative differences between the model and experimental data remain for Ni loadings above 0.6 wt%. One reason for these differences is that the model assumes that all of the Ni2+ cations reside in the SI cages at t = 0. As shown in Figure 3.13b, the rate coefficients determined from the fit to the data for 0.6 wt% Ni-Na-X accurately describe the activation period when the Ni loading is decreased to 0.16 wt%, supporting the assumption that all Ni2+ cations reside in the hexagonal prisms within the zeolite at low Ni loadings. When the Ni loading is increased above 0.6 wt%, the model predicts a slower activation than what is observed experimentally. This could be due to Ni2+ cations residing in the sodalite cages at higher Ni loadings, as previously observed in Ni-exchanged faujasite [25]. The model also overpredicts the peak activity per Ni2+ site at 1.2 and 5.9 wt% Ni loading. This could be a consequence of assuming that all Ni2+ cations that migrate into the supercages of the zeolite can produce oligomers. It is conceivable however, that at higher Ni loadings, Ni2+ cations migrating into the same supercage deactivate each other before Reactions 4 and 5 in Figure 3.11 can proceed. To explore this possibility, the
d[deactivated complex]dt
= kD[Ni(C3= )2 ] 2
rC6= = k2PC3=
[Ni(C6= )(C3
= )][NiTot ]
40
model described above was modified to determine whether the initial location of Ni2+ cations within the zeolite framework as well as the rapid deactivation of Ni2+ sites occupying the same supercage could explain the differences between the predictions of the model and the experimental data shown in Figure 3.13b. The initial siting location of Ni2+ cations was explored by allowing for a percentage of Ni2+ cations to reside in the sodalite cages instead of the supercage at t = 0. The decrease in active sites available for oligomerization was investigated by modifying Eqn. 6 to include a new parameter, f, which accounts for the fraction of Ni2+ sites that exist in supercages that do not contain other Ni2+ cations. This modification is shown in Eqn. 7.
rC6= = k2PC3=
[Ni(C6= )(C3
= )][NiTot ]
f (7)
Both f and the fraction of Ni2+ cations residing in the hexagonal prisms at t = 0 were determined simultaneously and optimized by re-solving the unsteady-state material balances presented in Eqns. 1-5. The results of the best model fit to the 1.2 and 5.9 Ni wt% data are described by the dashed lines in Figure 3.13b, which clearly show closer agreement of the model with the data. The 1.2 wt% sample was determined to have 5% of the Ni2+ cations residing in the sodalite cages initially, and this fraction increased to 10% for the 5.9 wt% sample. The fraction of Ni2+ cations available for oligomerization was determined to be 76% for the 1.2 wt% and only 40% for the 5.9 wt% sample. The quantitative discrepancy between the model and the experimental data in the deactivation regime may be due to the assumption that deactivation occurs exclusively via the reaction of two Ni(C3
=)2 species. It is likely that other Ni surface species, such as Ni(C6
=)(C3=), could also contribute to deactivation. These reactions cannot be
differentiated in the model from the reaction of two Ni(C3=)2 species, but could explain
the quantitative difference observed in Figure 3.13a for different propene partial pressures since the distribution of Ni species varies with changes in propene pressure. Another cause for catalyst deactivation could be the reaction between the deactivated complex and additional Ni species that may become significant at higher Ni loadings and could contribute additional pathways for catalyst deactivation not considered here. Oligomers coordinated to Ni sites could also lead to significant pore blockage at high Ni loadings, leading to catalyst deactivation. Pore filling would block Ni sites from participating in oligomerization and would result in a decreased rate of propene consumption for high Ni loadings. Calculations similar to those used to assess pore filling in H-MFI during propene oligomerization [4] carried out for Ni-Na-X (see Supplemental Information), show that significant pore filling could occur for the 5.9 and 9.3 wt% Ni catalysts if every Ni site had an adsorbed oligomer attached to it. This is consistent with the decrease in maximum propene consumption per Ni site observed for the 9.3 and 5.9 wt% samples shown in Figures 3.4b and 3.9 and suggests that incorporating the effects of pore filling into the model is necessary for Ni loadings larger than 1.2 wt%. After the catalyst has activated and the Ni sites occupying the same supercage have deactivated, only isolated Ni sites remain catalytically active. Under these conditions, the rate of propene dimerization at steady state can be described by Reactions 4 and 5 of Figure 3.11. The rate of dimer formation from Figure 3.11 is then given by Eqn. 8 (see Supplemental Information for derivation):
41
rC6= =
k1k2PC3= [Ni]k1 + k2
= kappPC3= [Ni] (8)
In this equation, [Ni] represents the concentration of Ni sites that remain active after the activation and deactivation of the catalyst. Eqn. 8 predicts that the formation of hexene should be proportional to the propene partial pressure, in good agreement with the results presented earlier. The apparent rate coefficient for dimerization, kapp, can be calculated at 453 K using Eqn. 8 and the values of k1 and k2 provided in Table 3.2. The resulting value of kapp is 0.56 bar-1 min-1. The apparent dimerization rate coefficient determined experimentally for the 0.6 wt% Ni catalyst is 0.13 bar-1 min-1 at 453 K, assuming that all Ni2+ cations are active, after stabilization of the catalyst using the high temperature activation/deactivation procedure outlined in Figure 3.6. From these figures, it is concluded that only 23% of the Ni sites in the 0.6 wt% Ni catalyst are active at steady state. 3.5 Conclusions
A series of ion-exchanged Ni-Na-X zeolites with varying Ni loadings were examined as catalysts for propene oligomerization. All Ni in Ni-Na-X is present as isolated Ni2+ cations that charge-compensate two Al atoms in the zeolite framework. In situ XANES shows that the oxidation state of the Ni2+ cations does not change when propene is introduced and remains Ni2+ throughout the course of propene oligomerization.
Ni-Na-X catalysts exhibit > 98% selectivity to oligomers independent of time on stream but the Ni loading has a large influence on the catalyst activity. At the highest Ni loading, 9.3 wt%, the catalyst possesses high initial activity but rapidly deactivates with time on stream. As the Ni loading decreases, the initial activity drops to zero and the catalyst acquires an activation period. After activation, all of the low Ni-loading catalysts deactivate in a manner similar to the 9.3 wt% sample; however, the dimerization activity does not completely disappear for catalysts below 0.6 wt% Ni and stable dimerization activity can be achieved at long times for these catalysts. The time to activate such low Ni-loaded catalysts can be greatly reduced by increasing the temperature at which activation is carried out to 493 K. Under steady-state conditions, the rate of propene dimerization is first-order in propene partial pressure and the activation energy is 45 kJ mol-1.
Activation of the catalyst is attributed to the migration of Ni2+ cations from the hexagonal prisms to the sodalite cages of the zeolite, i.e., from SI sites to SII sites. Once in the sodalite cages, the Ni2+ cations complex with propene to form sites which are active for propene oligomerization. Catalyst deactivation is hyperbolic with time on stream, suggesting that deactivation involves the interaction of two activated sites. The proposed model is consistent with enhanced deactivation at high Ni loadings and suggests that the stable dimerization activity of the low Ni loading catalysts after deactivation is due to isolated Ni2+-olefin sites.
Based on the observations reported above, a model of the kinetics of catalyst activation and deactivation, as well as the dimerization of propene, was developed. The
42
rate coefficients appearing in this model were adjusted to fit the experimentally observed rate of hexene formation as a function of time on stream for 0.6 wt% Ni-Na-X. The rate parameters obtained in this manner were then used to calculate the effects of propene partial pressure and total Ni loading. The model was found to give a good qualitative description of the effects of these parameters providing justification for the proposed activation and deactivation pathways. 3.6 Supplemental Information 3.6.1 Characterization of As-Prepared 0.6 wt% Ni-Na-X The structure of the Ni-exchanged zeolite was examined after calcination to ensure that the framework remained intact after the incorporation of Ni into the catalyst. Figure 3.14 shows the XRD diffractograms for the parent Na-X zeolite as well as the Ni-Na-X exchanged sample. It is apparent that Ni contracts the zeolite framework by a systematic shift of peaks to higher 2θ, however, the intensity of the peaks does not change appreciably from the native Na-X sample indicating that the FAU framework remains intact. The micropore volume of the zeolite was calculated using BET N2 adsorption and the t-plot method. The Na-X material was determined to have a micropore volume of 0.260 cm3 g-1 and the Ni-Na-X material had a similar micropore volume of 0.271 cm3 g-1 providing further evidence that the framework does not collapse when Ni is exchanged into the zeolite. Finally, dark-field TEM shows no evidence of zeolite degradation or the formation of cubic NiO nanoparticles as shown in Figure 3.15. 3.6.2 Characterization of 0.6 wt% Ni-SiO2
The Ni-SiO2 catalyst, synthesized from the incipient-wetness impregnation of Ni(EDTA) into silica followed by calcination to remove the EDTA ligands, was characterized using XANES, TPR, and TEM. In situ XANES, shown in Figure 3.16, indicate that the Ni remains Ni2+ both as synthesized as well as under reaction conditions. TPR shows that the Ni2+ cations do not reside in bulk NiO crystals on the silica surface, as seen by the lack of a reduction peak at 715 K in Figure 3.17. The higher temperature reduction of the Ni2+ sites relative to bulk NiO is analogous to that seen in the zeolite suggesting that the cations are isolated from one another and have exchanged with silanol groups on the silica surface. Dark-field TEM, presented in Figure 3.18, shows no sign of cubic NiO nanoparticles, further indicating that Ni exists as isolated Ni2+ cations in the catalyst.
3.6.3 Steady-State Pressure and Temperature Dependencies of 0.6 wt% Ni-Na-X Activation and deactivation of the 0.6 wt% Ni-Na-X sample at 493 K and 5 bar propene partial pressure, followed by cooling of the catalyst to 453 K, allowed for the steady-state temperature and pressure dependencies of the catalyst to be examined. Figure 3.19 shows an Arrhenius plot of the data provided in Figure 3.6 of the article indicating that the activation energy for propene consumption is 45 kJ mol-1 between 413 and 453 K. The propene pressure dependencies on the formation of dimers and trimers are presented in Figures 3.20a and 3.20b respectively. Figure 3.20 shows that dimer formation is linearly dependent on the propene partial pressure and that trimer formation is proportional to the square of the propene partial pressure.
43
3.6.4 Investigation of Pore Filling The feasibility of pore filling contributing to catalyst deactivation for catalysts with varying Ni loadings was examined by comparing the volume of adsorbed oligomers to the free volume of the zeolite. The zeolite pore volume was determined from BET as presented above and was kept constant at 0.271 cm3 g-1 for all catalysts. The volume occupied by oligomers was determined as follows. First, the volume of linear C6, C9, and C12 was taken from [31], using extrapolation to obtain volumes for C9 and C12, and these values were used as the molecular volume of dimers, trimers, and tetramers, respectively. The moles of Ni atoms per gram of catalyst was then calculated from the weight loading of the catalyst, and using the assumption that one oligomer is bound to each Ni atom, the volume of adsorbed oligomers could be determined. The ratio of this volume to the free volume of the zeolite is then used to determine how much of the zeolite pore volume is accessible for oligomerization. Results of this calculation are shown in Figure 3.21 for all catalysts examined in this study and show that pore filling is not a concern for catalysts with low Ni loadings. However, once the Ni loading becomes larger than 1.2 wt%, the pore volume occupied by adsorbed oligomers becomes significant with 85% of the pores being filled if every Ni2+ cation in the 9.3 wt% sample is occupied by only one tetramer. Since it is likely that some sites could have multiple oligomers adsorbed as well, this suggests that pore filling could be blocking sites and deactivating the catalyst for the 5.9 and 9.3 wt% Ni catalysts. 3.6.5 Derivation of Eqn. 8 From Scheme 1, the dimer can only be formed in step 5 and forms with the rate
rC6= = k2PC3= [Ni(C6
= )(C3= )]
At steady-state, the change in the concentration of [Ni(C6
=)(C3=)] does not change with
time meaning that [Ni(C6=)(C3
=)] can be related to [Ni(C3=)2] and the rate of C6
= formation can be rewritten.
d[Ni(C6= )(C3
= )]dt
= k1PC3= [Ni(C3= )2 ]! k2PC3= [Ni(C6
= )(C3= )]= 0
[Ni(C6= )(C3
= )]= k1k2[Ni(C3
= )2 ]
rC6= = k1PC3= [Ni(C3
= )2 ]
At steady state, all of the active Ni sites are occupied by either two propene molecules or one propene and one hexene molecule. This means that [Ni(C3
=)2] can be related back to the total amount of active Ni remaining in the catalyst giving rise to Eqn. 7 in the article.
44
[Ni]= [Ni(C3= )2 ]+[Ni(C6
= )(C3= )]
[Ni]= [Ni(C3= )2 ]+
k1k2[Ni(C3
= )2 ]
[Ni(C3= )2 ]=
[Ni]
1+ k1k2
rC6= =
k1PC3= [Ni]
1+ k1k2
=k1k2PC3= [Ni]k1 + k2
45
Figure 3.1 Ni loading and degree of site exchange of Ni-Na-X catalysts determined from elemental analysis as a function of the nickel nitrate concentration used in the aqueous ion exchange synthesis.
Table 3.1 Elemental analyses of Na-X and Ni-Na-X exchanged with 100 mM nickel nitrate solution. Elemental Analysis [wt%] Sample Si Al Na Ni Si/Al (2Ni+Na)/Al % Exchange
Figure 3.2 TPR profiles of 9.3 wt% Ni-Na-X catalyst exchanged in water and bulk NiO deposited on SiO2 as a reference. The peak at 715 K is due to the reduction of bulk NiO, the peak at 940 K is due to the reduction of exchanged Ni sites, and the peak at ca. 1025 K is due to collapse of the zeolite framework.
Figure 3.3 Ni XANES spectra for 9.3 wt% and 0.6 wt% Ni-Na-X catalysts after calcination, 0.6 wt% Ni-Na-X after 90 min time on stream at 453 K and 1 bar propene pressure, and NiO and Ni foil standards.
300 400 500 600 700 800 900 1000
TPR
Sig
nal [
A.U
.]
Temperature [K]
Ni-Na-X NiO/SiO2
8330 8340 8350 8360 8370 83800.0
0.5
1.0
1.5
Nor
mal
ized
µ(E
)
E [eV]
9.3 wt% Ni-Na-X 0.6 wt% Ni-Na-X 0.6 wt% Ni-Na-X with C =3 NiO Ni Foil
47
Figure 3.4 a) Propene oligomerization activity and b) rate of propene consumption of Ni-Na-X catalysts with varying Ni loadings at 453 K and 1.25 bar propene pressure. The selectivity to oligomer products was >98% for all time on stream. a)
b)
0 50 100 150 200 250 300 350 400 4500
1
2
3
4
5
6
7
8
C= 3 C
onve
rsio
n [%
]
TOS [min]
9.3 wt% Ni 5.9 wt% Ni 1.2 wt% Ni 0.6 wt% Ni 0.16 wt% Ni
0 50 100 150 200 250 300 350 400 4500
20
40
60
80
100 0.6 wt% Ni 0.16 wt% Ni
TOS [min]
9.3 wt% Ni 5.9 wt% Ni 1.2 wt% Ni
per
Ni [
h-1]
Rat
e of
C= 3 C
onsu
mpt
ion
48
Figure 3.5 Effect of propene partial pressure on the activation and deactivation periods of the 0.6 wt% Ni-Na-X at 453 K.
Figure 3.6 High temperature treatment of 0.6 wt% Ni-Na-X with 5 bar propene pressure leading to faster activation and deactivation. After the 493 K treatment, the reactor was cooled to 393-453 K and exhibited stable oligomerization activity.
0 100 200 300 400 500 6000
40
80
120
160
200
per
Ni [
h-1]
Rat
e of
C= 3 C
onsu
mpt
ion
TOS [min]
P(C=3) = 1.25 bar
P(C=3) = 5 bar
0 400 800 1200 1600 20000
20
40
60
80
100
120
140
160
180
TOS [min]
T = 493 K T = 393 K T = 453 K T = 433 K T = 413 K
per
Ni [
h-1]
Rat
e of
C= 3 C
onsu
mpt
ion
49
Figure 3.7 Effects of the catalyst support on activation and deactivation of 0.6 wt% supported Ni catalysts at 453 K and 5 bar propene pressure. The Ni-Na-X catalyst required activation whereas the SiO2 supported Ni and Ni-Na-MOR catalysts activated in less than 10 min permitting only the observation of the deactivation period.
0 50 100 150 200 250 3000
20
40
60
80
100
120
140
160
180
TOS [min]
Ni-Na-X Ni-SiO2
Ni-Na-MOR
per
Ni [
h-1]
Rat
e of
C= 3 C
onsu
mpt
ion
50
Figure 3.8 The faujasite framework illustrating the SI and SII crystal positions (adapted from [23]). Also shown is the activation mechanism for the catalyst in the presence of propene. 1) After in situ calcination to 773 K, Ni2+ cations occupy the SI positions causing distortions in the hexagonal prism. 2) Presence of propene and lower temperature cause Ni2+ cations to migrate into the SII positions located in the sodalite cages. 3) Once in the sodalite cage, Ni2+ complexes with propene causing the formation of the active species within the zeolite supercage.
SI
SII
2
3 1
51
Figure 3.9 Rate of propene consumption for Ni-Na-X catalysts with various Ni loadings at 453 K and 1.25 bar propene pressure at peak activity and 90 min after peak activity.
Figure 3.10 A schematic illustrating the proposed complex formed during the deactivation of the catalyst. It is likely that a number of bridging olefin Ni complexes with varying olefin lengths (n and m) and number of olefin ligands exists.
0.1 1 10 1001
10
100
Peak Activityss
Activity 90 min after Peak Activity
% of Sites Exchanged with Ni
per
Ni [
h-1]
Rat
e of
C= 3 C
onsu
mpt
ion
O
O
O
O
Ni Ni
Si Si
Al Al
Al Al
Cn=
Cm=
R
52
Figure 3.11 Reactions used to model the activation and deactivation of Ni2+ sites and the dimerization of propene.
Figure 3.12 a) Fit of the model derived from Figure 3.11 to the 0.6 wt% Ni-Na-X time on stream data collected at 1.25 bar propene and 453 K. b) Predicted profiles of the different Ni species as a function of time on stream predicted from the model during the fit in a). a)
b)
0 50 100 150 200 250 300 350 400 4500
5
10
15
20
25
30
35
40
TOS [min]
Data Model
per
Ni [
hr-1]
Rat
e of
C= 6 F
orm
atio
n
0 50 100 150 200 250 300 350 400 4500.0
0.2
0.4
0.6
0.8
1.0 Ni(C6
=)(C3=)
deact. Ni
TOS [min]
Ni(SI) Ni(SII)
Ni(C3=)2
Fra
ctio
nal S
ite C
over
age,
θi
Ni(SII) x 2
54
Table 3.2 List of optimized rate constants from the fit of the model to the time on stream data of the 0.6 wt% Ni-Na-X at 1.25 bar propene and 453 K.
Rate Constant Regression Value Units
km 2.93 x 10⁻⁶ s-1
kn 6.73 x 100 gcat (mol Ni)-1 s-1
ka 1.15 x 10⁻² bar-1 s-1
k1 1.18 x 10⁻² bar-1 s-1
k2 4.62 x 10⁻² bar-1 s-1
kD 4.69 x 10⁻¹ gcat (mol Ni)-1 s-1
55
Figure 3.13 Comparison of the model predictions using the kinetic parameters reported in Table 3.2 to the experimental data for changes in a) propene pressure and b) Ni loading at 453 K. The dashed lines in b) are the predictions of the model when the initial distribution of Ni2+ cations between the sodalite cages and the hexagonal prisms as well as the fraction of Ni sites active for oligomerization are optimized. a)
b)
0 50 100 150 200 250 300 350 400 4500
20
40
60
80
100
120
140
160
TOS [min]
P(C=3) = 1.25 bar
P(C=3) = 5 bar
per
Ni [
hr-1]
Rat
e of
C= 6 F
orm
atio
n
0 100 200 300 400 500 600 7000
5
10
15
20
25
30
35
40
TOS [min]
5.9 wt% Ni 1.2 wt% Ni 0.6 wt% Ni 0.16 wt% Ni
per
Ni [
hr-1]
Rat
e of
C= 6 F
orm
atio
n
56
Figure 3.14 XRD diffractograms of the parent Na-X zeolite and 0.6 wt% Ni-Na-X zeolite after calcination showing that the FAU structure remains after Ni exchange.
Figure 3.15 Dark-field TEM images of 0.6 wt% Ni-Na-X confirming that NiO nanoparticles are not formed.
10 15 20 25 30 350
100
200
300
400 Na-X Ni-Na-X
Inte
nsity
[A.U
]
Angle (2θ) [degrees]
57
Figure 3.16 In situ XANES spectra of the 0.6 wt% Ni-SiO2 catalyst as synthesized and under reaction conditions indicating that Ni remains Ni2+ throughout the experiment.
Figure 3.17 TPR spectrum of 0.6 wt% Ni-SiO2 compared with bulk NiO supported on SiO2 suggesting that bulk NiO does not exist in the catalyst.
8330 8340 8350 8360 8370 83800.0
0.5
1.0
1.5
Nor
mal
ized
µ(E
)
E [eV]
0.6 wt% Ni-SiO2
0.6 wt% Ni-SiO2 with C =3 NiO Ni Foil
300 400 500 600 700 800 900 1000
TPR
Sig
nal [
A.U
.]
Temperature [K]
Ni-SiO2
NiO/SiO2
58
Figure 3.18 Dark-field TEM image of the 0.6 wt% Ni-SiO2 sample confirming that NiO nanoparticles are not present in the catalyst.
Figure 3.19 Arrhenius plot of the rate of propene consumption for the 0.6 wt% Ni-Na-X sample between 413 and 453 K.
0.26 0.27 0.28 0.291.0
1.5
2.0
2.5
Data Linear Fit
ln(k
app)
[h-1]
1000/RT
EA, app = 45 kJ/mol
59
Figure 3.20 Effect of the propene partial pressure on the formation rate of a) dimers and b) trimers at 453 K. a)
b)
0 1 2 3 4 50
5
10
15
20
25
Rat
e of
C= 6 F
orm
atio
n pe
r Ni [
h-1]
P(C=3) [bar]
0 5 10 15 20 25 300.0
0.2
0.4
0.6
0.8
1.0
1.2
Rat
e of
C= 9 F
orm
atio
n pe
r Ni [
h-1]
P(C=3)
2 [bar2]
60
Figure 3.21 Percentage of the free pore volume filled for each Ni-Na-X catalyst examined in this study if a dimer, trimer, or tetramer is coordinated to every Ni2+ cation in the catalyst.
0 1 2 3 4 5 6 7 8 9 100
102030405060708090
100
Ni loading [wt%]
Dimer Trimer Tetramer
% o
f Por
e Vo
lum
e Fi
lled
[%]
61
References: [1] M. Marchionna, M. Di Girolamo, R. Patrini, Catal Today 65 (2001) 397-403. [2] A. Corma, S. Iborra, in: E.G. Derouane (Ed.), Catalysts for Fine Chemical Synthesis, vol. 4, J. Wiley & Sons Ltd., UK, 2006, p. 125-132. [3] N.Y. Chen, W.E. Garwood, F.G. Dwyer, Shape Selective Catalysis in Industrial Applications, Marcel Dekker Inc., New York, 1996, p. 168-172. [4] A.N. Mlinar, P.M. Zimmerman, F.E. Celik, M. Head-Gordon, A.T. Bell, J. Catal. 288 (2012) 65-73. [5] T. Yashima, Y. Ushida, M. Ebisawa, N. Hara, J. Catal. 36 (1975) 320-326. [6] G. Wendt, E. Fritsch, D. Deininger, R. Schöllner, React. Kinet. Catal. Letter. 16 (1981) 137-141. [7] I.E. Maxwell, Adv. Catal. 31 (1982) 1-76. [8] J. Heveling, A. Van der Beek, M. De Pender, Appl. Catal. 42 (1988) 325-336. [9] J. Heveling, C.P. Nicolaides, M.S. Scurrell, Appl. Catal. A-Gen. 173 (1998) 1-9. [10] I.V. Elev, B.N. Shelimov, V.B. Kazansky, J. Catal. 89 (1984) 470-477. [11] A.K. Ghosh, L. Kevan, J. Phys. Chem. 94 (1990) 3117-3121. [12] D. Kiessling, G.F. Froment, Appl. Catal. 71 (1991) 123-138. [13] V. Hulea, F. Fajula, J. Catal. 225 (2004) 213-222. [14] A. Brückner, U. Bentrup, H. Zanthoff, D. Maschmeyer, J. Catal. 266 (2009) 120-128. [15] L. Bonneviot, D. Olivier, M. Che, J. Mol. Catal. 21 (1993) 415-430. [16] R. Spinicci, A. Tofanari, Mater. Chem. Phys. 25 (1990) 375-383. [17] F.T.T. Ng, D.C. Creaser, Appl. Catal. A-Gen. 119 (1994) 327-339. [18] A.I. Tsyganok, K. Suzuki, S. Hamakawa, K. Takehira, T. Hayakawa, Catal. Lett. 77 (2001) 75-86. [19] M. Newville, J. Synchrotron Radiat. 8 (2001) 96-100. [20] B. Ravel, M. Newville, J. Synchrotron Radiat. 12 (2005) 537-541. [21] A.J. Maia, B. Louis, Y.L. Lam, M.M. Pereira, J. Catal. 269 (2010) 103-109. [22] C. Weidenthaler, W. Schmidt, Chem. Mater. 12 (2000) 3811-3820. [23] C. Lepetit, M. Che, J. Phys. Chem. 100 (1996) 3137-3143. [24] H. Guesmi, D. Costa, D. Berthomieu, P. Massiani J. Phys. Chem. C 115 (2011) 5607-5618. [25] P. Gallezot, B. Imelik, J. Phys. Chem. 77 (1973) 652-656. [26] J.M. Thomas, C. Williams, T. Rayment, J. Chem. Soc. Faraday Trans. 1 84 (1988) 2915-2931. [27] E. Dooryhee, C.R.A. Catlow, J.W. Couves, P.J. Maddox, J.M. Thomas, G.N. Greaves, A.T. Steel, R.P. Townsend, J. Phys. Chem. 95 (1991) 4514-4521. [28] J.F. Groust, C. Pommier, L. Stievano, F. Villain, C. Giorgetti, F. Baudelet, P. Massiani, Catal. Lett. 102 (2005) 257-260. [29] H. Guesmi, P. Massiani, Catal. Today 177 (2011) 25-30. [30] J.B. Butt, E.E. Petersen, Activation, Deactivation, and Poisoning of Catalysts, Academic Press, Inc., San Diego, 1988, p. 34. [31] F. Jiménez-Cruz, G.C. Laredo, Fuel 83 (2004) 2183-2188.
62
Chapter 4
The Role of Non-Catalytic M Cations on the Activity and Selectivity of Ni-M-X Zeolites for Propene Oligomerization
Abstract A series of alkali metal- or alkaline earth-exchanged Ni-X zeolites containing approximately 0.6 wt% Ni as Ni2+ cations were examined as catalysts for propene oligomerization at 453 K and 5 bar. In the presence of propene, the activity of alkali metal-exchanged zeolites (Ni-Li-X, Ni-Na-X, and Ni-K-X) increased with time on stream, reached a maximum, and then decreased, ultimately reaching steady-state. By contrast, the activity of alkaline earth-exchanged zeolites (Ni-Mg-X, Ni-Ca-X, and Ni-Sr-X) was high initially, and then decreased until steady-state activity was achieved. The primary product formed in all cases was hexene (90%) with nonene being the only other product observed (10%). Approximately 20% of the hexene contained terminal carbon-carbon double bonds and 80% internal carbon-carbon double bonds. Both the rate of propene dimerization and the ratio of branched to linear hexene isomers was determined to depend on the identity of the charge-compensating cation with the dimerization rate and degree of dimer branching increasing with increasing free volume in the zeolite supercages. For alkali-exchanged zeolites, the apparent activation energy for hexene formation was found to decrease from 68 kJ mol-1 to 38 kJ mol-1 with increasing supercage volume, whereas the apparent activation energy for dimerization with alkaline earth-exchanged zeolites decreased from 47 kJ mol-1 to 42 kJ mol-1 with increasing supercage volume. The apparent activation energy for trimer formation was approximately 10-15 kJ mol-1 greater than that for dimer formation, suggesting that steric constraints imposed by the zeolite may inhibit the growth of larger oligomers. 4.1 Introduction The oligomerization of light C2-C5 olefins to produce transportation fuels and precursors for detergents and surfactants has been widely studied [1-3]. Heterogeneous Brønsted acid catalysts [1-4] as well as homogeneous and heterogeneous nickel catalysts [1-3, 5-6] have been reported to be highly active for this purpose. Nickel-exchanged aluminosilicates, including zeolites, are particularly promising as they have been previously shown to exhibit high oligomer selectivity while maintaining high stability during ethene oligomerization [7-8]. Little is known, however, about how Ni loading and the identity of the non-catalytic, charge compensating cation affect the activity and selectivity of such catalysts for light olefin oligomerization. To this end, we have recently reported a study of Ni-Na-X aimed at identifying the role of Ni loading on the activity and stability of this catalyst for propene dimerization [9]. Catalyst characterization by TPR and XANES revealed that the Ni is present as Ni2+ and that reduction of these cations to Ni0 does not occur during the reaction. It was also shown that the propene oligomerization activity of Ni-Na-X increases with time on stream and reaches peak activity before decaying and ultimately reaching steady-state activity. A model for the
63
transient behavior with time on stream was developed that accounts for migration of Ni2+ cations, located initially in the hexagonal prisms of the framework, to the zeolite supercage where the active Ni2+ complex forms upon exposure of the catalyst to propene. Furthermore, the model accounts for catalyst deactivation via interaction of Ni-propene complexes located within a single supercage and that stable activity is achieved once the concentration of Ni2+ per supercage becomes fewer than one on average. It has been previously shown that the nature of the charge compensating co-cation (e.g., Li+, Na+, K+) can influence the activity and oligomer selectivity of Ni-exchanged Y zeolites used for liquid-phase butene oligomerization [10]; however, this study provides little insight into the role of the co-cations at steady-state or during the activation and deactivation periods observed with Ni-Na-X. The goal of the present study was therefore to determine how the nature of the co-cation (M) influences the time on stream and steady-state activity and selectivity of Ni-exchanged M-X zeolites during gas-phase propene oligomerization. This was accomplished by first exchanging Na in the parent Na-X zeolite for alkali metal (Li, Na, or K) or alkaline earth metal (Mg, Ca, Sr) cations and then exchanging Ni into the zeolite to generate Ni-M-X with approximately 0.6 wt% Ni loading. These materials were then investigated for propene oligomerization with the goal of establishing the role of the co-cation in determining the catalyst activity for propene dimerization and the distribution of hexene dimers formed. 4.2 Methods 4.2.1 Catalyst Preparation A series of alkali metal and alkaline earth cation-exchanged X zeolites were prepared as follows: 10 grams of Na-X (Sigma-Aldrich, 13X, powder) was mixed with 200 mL of 1 M LiNO3 (Sigma, >99.0%), KNO3 (Mallinckrodt Baker), Mg(NO3)2 (Alfa Aesar, 98.0-102.0%, hexahydrate), Ca(NO3)2 (Sigma-Aldrich, >99.0%, tetrahydrate), or Sr(NO3)2 (Sigma-Aldrich, >99.0%) prepared using water purified by passage through a Millipore filter. The mixture was heated to 333 K in a round-bottomed flask equipped with a Teflon coated stir-bar and water-cooled condenser and held for 6 h at temperature before being filtered and rinsed with Millipore purified water to remove residual nitrates from the catalyst. The procedure was repeated three times and the resulting M-X zeolite was kept in a vacuum oven overnight to remove any adsorbed water. Nickel was introduced into the M-X zeolites by contacting 2.24 to 2.83 grams of M-X with 50 mL of a 5 mM solution of Ni(NO3)2 (Sigma-Aldrich, 99.999% trace metals basis, hexahydrate). The weight of M-X zeolite used was determined to maintain a 4% Ni exchange of Ni for M in all catalysts assuming complete exchange of the Na+ for M+ or M2+ cations. The exchange was performed in the same apparatus described above with the mixture being heated to 333 K and held at temperature for 16 h before being filtered and rinsed with Millipore-purified water. The resulting Ni-M-X catalyst was placed in a horizontal quartz tube furnace, heated to 773 K at 2 K min-1 in air (Praxair, zero-grade) flowing at 100 cm3 min-1, and held at 773 K for 3 h to remove water and nitrate groups still left in the catalyst. After calcination, the sample was stored in a desiccator to limit the readsorption of atmospheric moisture.
64
4.2.2 Catalyst Characterization The Si, Al, Na, Ni, and M content of each catalyst were determined by elemental analysis performed by Galbraith Laboratories (Knoxville, TN). Catalyst micropore volumes and surface areas were determined from the t-plot, Horvath-Kawazoe, and BET methods using N2 (Praxair, 99.999%) adsorption measurements collected using a Micromeritics Gemini VII BET instrument. All samples were outgassed overnight at 393 K under vacuum to remove residual water prior to taking the BET measurements. Samples for X-ray analysis were immobilized on a sample plate with Vaseline and X-ray diffraction (XRD) patterns were collected on a Siemens D5000 diffractometer using Cu Kα radiation and recorded digitally from 2θ = 5-35° with a step size of 0.01°. 4.2.3 Measurement of Reaction Rates
Catalytic activity measurements were carried out using a 0.5 inch outer diameter stainless steel reactor with a pinch in the middle to allow for the creation of a fixed bed. Quartz wool was placed inside the reactor followed by a mixture of 200 mg of catalyst diluted in 300 mg of Silicycle silica (average pore diameter = 150 Å; surface area = 300 m2 g-1). Additional quartz wool was then placed on top of the catalyst to create a fixed bed. The temperature was monitored using a K-type thermocouple that was inserted directly into the fixed bed and the reaction pressure was controlled digitally using a Tescom back-pressure regulator.
Prior to each experiment, samples were calcined in situ to 773 K for 3 h (2 K min-
1 ramp rate) in 1 bar air flowing at 100 cm3 min-1 to remove any adsorbed water. The reactor was then cooled to reaction temperature at 2 K min-1 and flushed with 100 cm3 min-1 of helium for 5 min before introducing 30 cm3 min-1 (STP) of propene (Praxair, 99.9%) and increasing the pressure to reaction conditions. Reaction products were analyzed using an Agilent 7890A gas chromatograph equipped with a gas-sampling valve, a 30 m HP-Plot Q column, and a flame ionization detector. More detailed isomer analysis was performed using the detailed hydrocarbon analysis (DHA) technique developed by Wasson-ECE consisting of a second gas sampling valve, 100 m column, and flame ionization detector within the gas chromatograph. The resulting chromatogram was analyzed using the Envantage Dragon DHA software package purchased from Wasson-ECE.
4.3 Results 4.3.1 Catalyst Characterization The composition of the three alkali metal and three alkaline earth-exchanged Ni-X catalysts used in this study was determined by elemental analysis and is shown in Table 4.1. The data show that the Si/Al ratio is approximately 1.2, the same as that of the parent Na-X catalyst, and that a large majority of the Al (≥ 94%) is charge compensated by cations suggesting that the number of exchange sites in the catalyst is not greatly changed during catalyst preparation. Furthermore, the Ni/Al ratio indicates that approximately 4% of the Al sites are charge compensated by Ni in all of the catalysts, assuming Ni remains Ni2+ after catalyst preparation and that it charge compensates two exchange sites within the catalyst (as previously shown for Ni-Na-X [9]).
65
Table 4.2 presents the BET surface area, micropore volumes, and lattice constants derived from the XRD data. All Ni-M-X catalysts exhibited x-ray diffraction peaks characteristic of zeolite X indicating that the framework structure of the zeolite was not affected by catalyst preparation (see Supplemental Information). The measured BET surface areas and lattice constants, a, are similar to those previously published for M-X zeolites [11] further indicating that the zeolite framework remains intact after catalyst preparation and suggesting that the cations reside as charge compensating cations within the zeolite. 4.3.2 Catalyst Activity The rate of dimer formation as a function of time on stream at 453 K and 5 bar propene pressure is shown in Figures 4.1a and 4.1b for the alkali metal- and alkaline earth-exchanged Ni-X zeolites, respectively. Under these conditions, all of the catalysts exhibited greater than 98% selectivity to oligomers, of which dimers constituted more than 90% with the remainder being trimers. As previously reported for Ni-Na-X [9], the catalytic activity arises from the presence of exchanged Ni2+ sites within the catalyst and not from the parent Na-X material which converts <0.1% of the propene into products under reaction conditions. Figure 4.1 shows that the alkali metal-exchanged zeolites exhibit an activation period, reach peak activity, and then deactivate with time on stream. The Ni-Li-X catalyst behaves differently from the Ni-Na-X or Ni-K-X catalysts and passes through a second peak in activity before eventually deactivating in a manner similar to the Na and K catalysts. In contrast to the alkali metal-exchanged zeolites, Ni-X catalysts with alkaline earth cations start at high activity and continuously deactivate with time on stream. For both the alkali metal- and alkaline earth-exchanged catalysts, complete deactivation does not occur, but instead approaches steady-state activity after more than 2000 min time on stream as shown previously for Ni-Na-X [9]. Based on our findings with Ni-Na-X [9], steady-state activity could be achieved more quickly by heating the catalyst at 493 K for the first 120 min of time on stream and then cooling it to the desired reaction temperature. Using this procedure it became possible to examine the effects of the non-catalytic, charge compensating cation under steady-state conditions. Figure 4.2 shows the steady-state activity of each catalyst at 453 K and 5 bar propene pressure after the high temperature treatment at 493 K for 120 min. It is noted that the steady-state activities determined after pretreatment at 493 K, presented in Figure 4.2, agree well with the activities that are expected after achieving steady state at long time on stream at 453 K (shown in Figure 4.1). This suggests that treatment at the higher temperature does not change the steady-state activity of the catalyst but, instead, allows steady-state activity to be achieved more rapidly. The results presented in Figure 4.2 show that the steady-state activity of the alkali metal-exchanged zeolites increases with decreasing cation size, in the order Ni-Li-X > Ni-Na-X > Ni-K-X. By contrast, the alkaline earth-exchanged zeolites exhibit the opposite trend with the activity increasing in the order Ni-Mg-X < Ni-Ca-X < Ni-Sr-X. In our previous study with Ni-Na-X, we determined that the rates of dimer and trimer formation were first- and second-order, respectively, in the partial pressure of propene [9]. Assuming the same partial pressure dependencies, apparent activation energies and pre-exponential factors for dimerization and trimerization were determined
66
at steady-state for temperatures between 453 and 423 K for all of the catalysts examined in this study. The results of these experiments are summarized in Table 4.3. It is seen that the catalysts with the highest steady-state dimerization activity have the lowest activation energies and lowest pre-exponential factors. For both alkali metal- and alkaline earth-exchanged zeolites, the apparent activation energy and pre-exponential coefficient for dimerization increases with decreasing steady-state dimerization activity. The activation energy for trimerization, also shown in Table 4.3, is higher than that for dimerization in all cases, suggesting that steric constraints by the zeolite inhibit trimerization and further oligomerization. The distribution of hexene isomers formed under steady-state conditions is presented in Table 4.4 for each Ni-M-X catalyst. Three classes of structural isomers were observed – linear, mono-branched, and di-branched hexenes. A summary of the degree of dimer branching for each catalyst is given in Figure 4.3. The highest degree of branching is observed for the largest cation, Sr, in the alkaline earth Ni-X series, whereas for alkali metal-exchanged Ni-X catalysts, the smallest cation, Li, produces the highest percentage of branched dimers. The percentage of terminal versus internal double bonds measured under steady-state conditions is shown in Figure 4.4. The alkaline earth-exchanged catalysts produced slightly more terminal alkenes than the alkali metal-exchanged zeolites, but in general, the percentage of dimers with terminal double bonds relative to internal double bonds was not found to depend strongly on the nature of the co-cation. Instead, it was observed that the percentage of hexenes having terminal double bonds remained relatively constant at around 20% for all Ni-M-X catalysts. 4.4 Discussion 4.4.1 Catalyst Activity with Time on Stream The results presented in Figure 4.1 show that the activity of Ni-M-X with time on stream depends strongly on the identity of the non-catalytic, charge-compensating cation. Ni-M-X catalysts exchanged with monovalent, alkali metal cations exhibit low activity at short times, activate with time on stream, reach a peak activity, and then deactivate. Our previous work with Ni-Na-X has shown that the activation period is caused by migration of Ni2+ cations within the zeolite framework [9]. In the as-prepared catalyst with small Ni loadings (≤ 0.6 wt%), the Ni2+ cations reside exclusively in the hexagonal cages of the zeolite where they are best stabilized by the framework O atoms [12-15]. Upon exposure to propene at elevated temperature, Ni2+ cations can migrate from the hexagonal cages to the walls of the sodalite cages where they can be extracted into the zeolite supercages via formation of Ni-propene complexes [9]. These complexes are thought to be the active centers for propene dimerization but complexation between two nearby active centers can lead to the formation of an inactive species, which is proposed to be the cause for the loss of catalyst activity with time on stream. The qualitatively similar behavior of Ni-Li-X and Ni-K-X to Ni-Na-X, seen in Figure 4.1, suggests that the changes in catalyst activity with time on stream can be interpreted in an identical manner for all catalysts involving alkali metal cations with low Ni loadings. Prior XRD studies with dehydrated Ni-exchanged faujasite zeolites have shown that the co-cation affects the location of Ni2+ cations within the zeolite [16-18]. Exchange
67
of the Na+ cations for Mg2+ or Ca2+ cations causes the hexagonal prisms to become occupied by the Mg2+ or Ca2+ cations thereby limiting Ni migration to these locations. Therefore, it is proposed that the difference between alkali metal- and alkaline earth-exchanged Ni-M-X at short time on stream is caused by differences in Ni2+ siting at the beginning of the reaction. In contrast to alkali metal-exchanged X, the Ni2+ cations in alkaline earth-exchanged X are located initially in the sodalite cages since the hexagonal prisms are already occupied by the divalent alkaline earth co-cations. Consequently, the catalyst is active upon exposure of the catalyst to propene, since there is no need to extract the Ni2+ cations from the hexagonal cages, as is the case for alkali metal-exchanged Ni-M-X zeolites. 4.4.2 Steady-State Catalyst Activity As shown in Figures 4.2 and 4.3, the identity of the non-catalytic, charge-compensating cation influences the steady-state rate of propene dimerization and the degree of dimer branching. The activity of the alkaline earth-exchanged zeolites increases from Mg to Sr, whereas the activity of alkali metal-exchanged zeolites decreases from Li to K. Several factors may explain the observed patterns. The first is the electronegativity of the co-cations as has been previously proposed to explain the reactivity differences for 1-butene oligomerization in Ni-M-Y catalysts [10]. Since the electronegativity of both alkali metal and alkaline earth cations decreases when proceeding down a column in the periodic table however [19-20], this explanation cannot explain the opposite trends observed for alkali metal and alkaline earth Ni-M-X and is therefore not likely to play a major role in explaining the observed trends in activity for propene dimerization. Another possibility involves the size and charge of the non-catalytic cations. The exchange of different cations into zeolite X has been shown to affect the size of the zeolite unit cell with both larger alkali metal and alkaline earth cations leading to an increase in the unit cell size [11]. Table 4.2 shows that similar trends are observed for the Ni-M-X zeolites used in this study. BET measurements show that the pore volume accessible to N2 decreases with increasing cation size for alkali metals and first increases and then decreases with increasing alkaline earth cation size. Taken together, these results suggest that there may be differences between the two groups of exchanged zeolites with a competing effect between zeolite lattice expansion and the available pore volume within the zeolite supercage as the size of the exchanged cation changes. Since steady-state oligomerization occurs at isolated Ni2+ cations residing in the supercage [9], changes in free volume within the supercage could likely influence catalyst activity. To correctly account for changes in the supercage free volume, however, two factors need to be taken into account. The first is the expansion of the zeolite unit cell when larger co-cations are present, as previously reported [11], and also shown in Table 4.2. The second is the size and locations of the co-cations in the zeolite framework. The molecular formula of zeolite X is (M2
+ or M2+)43.5Si105Al87O384 assuming that all exchange sites can be exchanged with cations, a good assumption based on the elemental results presented in Table 4.1. Since all catalysts have approximately 4% of the exchange sites occupied by Ni2+, this means that approximately 84 alkali metal cations and 40 alkaline earth cations are present per unit cell in the alkali metal- and alkaline earth-exchanged zeolites, respectively. It has been previously reported that only 64 monovalent cations can be accommodated within the hexagonal prisms and sodalite cages of the
68
zeolite [18]. This fact, together with the strong preference for divalent cations to reside inside the hexagonal prisms and sodalite cages (see Section 4.4.1), means that all of the co-cations in the alkaline earth-exchanged zeolites can be accommodated in the sodalite cages and hexagonal prisms. By contrast, only 64 alkali metal cations can be located within the hexagonal prisms and sodalite cages, requiring approximately 22 monovalent co-cations to reside within the supercage. Consequently, one expects that for the same unit cell size, the free volume within the supercages of zeolite X will be smaller for alkali metal cations than for alkaline earth cations. The free volume in the zeolite supercage was estimated by using the maximum diameter of a sphere that could be included within the zeolite [21]. Since this sphere resides exclusively in the supercage and can be related to the unit cell size, this approach allows for the observed changes in unit cell size to be directly related back to changes in the supercage diameter, and thus, changes in the supercage free volume. For the alkali metal exchanged zeolites, the volume occupied by the 22 ions located within the supercage, calculated from the ionic radius of the cations, was then subtracted from the free volume to calculate the actual supercage free volume. Table 4.5 summarizes the results of these calculations (see Supporting Information for details of these calculations). It is clear from this table that the free volume in the supercage changes significantly with the identity of the co-cation and in opposite manners for alkali metal- and alkaline earth-exchanged zeolites. A plot of the dimerization activity per Ni versus the calculated supercage free is presented in Figure 4.6. A positive correlation between increasing supercage free volume and the rate of propene dimerization is noted, although there is a clear difference between the alkali metal- and alkaline earth-exchanged zeolites. This difference is likely due to secondary electronic effects arising from the presence of alkali metal cations located within the zeolite supercage and in close proximity to the active Ni2+ sites. 4.4.3 Dimer Isomer Distribution Further evidence for the influence of supercage free volume is given in Figure 4.7, which shows that the percentage of branched hexene increases with increasing supercage free volume. It is also evident that alkaline earth-exchanged zeolites produce more branched dimers than the alkali metal-exchanged zeolites at the same dimerization rate. This result is also reasonable since alkali metal-exchanged zeolites have alkali metal cations occupying space within the supercage, as discussed earlier, and these cations would further limit the space available for the oligomerization reaction to occur within the supercage. The influence of supercage free volume on the propene dimerization product selectivity for different Ni-M-X zeolites can be understood by considering the mechanism by which dimerization might occur. Figure 4.8 shows the possible pathways for the formation of primary propene dimerization products and is based on schemes previously proposed for propene oligomerization catalyzed by homogeneous Ni complexes [6, 22]. In this scheme, the Ni2+-alkyl species within the supercage reacts with additional propene present within the zeolite and forms a carbon-carbon bond between the propene and the alkyl ligand in the rate-determining step. The adsorbed dimer produced in this manner can then either continue to grow through further oligomerization or chain-transfer a hydride to another propene molecule, as previously suggested to occur
69
during ethene oligomerization [23], thereby completing the catalytic cycle and producing the observed dimer product. It is noted that all of the hexene isomers presented in Figure 4.8 are experimentally observed as products during propene dimerization (Table 4.4). The other four products listed in Table 4.4, cis/trans-3-hexene, 2-methyl-2-pentene, and cis-3-methyl-2-pentene, are therefore secondary reaction products. Close examination of the steady-state reaction pathway shows where differences in dimer branching can arise. As shown in Figure 4.8, propene can adsorb onto the Ni2+ cation either via the terminal (1’) or internal (2’) carbon producing two unique Ni2+-alkyl species. Each of these species can then react with additional propene via two pathways giving rise to three possible structural isomers of hexene. For example, if the 1’-Ni2+-alkyl species forms a carbon-carbon bond with the terminal carbon (1’) of a propene molecule, the resulting hexene product will be linear. Similarly, reaction of the 2’-Ni2+-alkyl species with the internal carbon (2’) of a propene molecule gives rise to a butene backbone with two methyl branches (di-branched). The mono-branched dimer can be produced from either the 1’- or 2’-Ni2+-alkyl complexes reacting with the internal (2’) or terminal (1’) carbon of the propene molecule, respectively. Since the Ni sites are not active for oligomer cracking, i.e. carbon-carbon bond cleavage, the differences in dimer branching must come exclusively from adsorption of the propene to the Ni2+ cation. Comparison of linear hexenes to di-branched hexenes therefore allows for the relative populations of the 1’- and 2’-Ni2+-alkyl species to be probed. This is shown in Figure 4.9 as a function of the supercage free volume for all of the Ni-M-X catalysts. The observed ratio of linear to di-branched hexenes ranges from 15 for Ni-K-X to 5 for Ni-Sr-X suggesting that the concentration of propene adsorbed through the terminal carbon (1’) is always larger than that for propene adsorbed through the internal carbon (2’) regardless of the catalyst. It is also noted that for both alkali metal- and alkaline earth-exchanged zeolites, increasing the free volume within the supercage decreases the ratio of linear to di-branched products. This is likely due to the larger open space in the zeolite supercage for the catalysts with the highest reaction rate, as discussed above, allowing for more room for the 2’-Ni2+-species to form. Also shown in Figure 4.9 is a large difference between the alkali metal-exchanged zeolites and alkaline earth-exchanged zeolites, with significantly higher ratios of linear to di-branched dimers being produced in the alkali metal-exchanged zeolites. This observation is also consistent with changes in the open space of the zeolite supercage, since the alkali metal cations residing in the supercage occupy space that would otherwise be available for the catalytic site. Since linear 1’-Ni2+-alkyl species would be more easily accommodated when in the presence of nearby alkali metal cations, adsorption of propene through the terminal carbon (1’) would be favored relative to the internal carbon (2’) leading to more linear products relative to di-branched products, consistent with what is observed. After carbon-carbon bond formation, the Ni2+-dimer species must desorb to produce the observed dimer product. This reaction requires the transfer of a hydride from the alkyl group to a nearby olefin molecule and governs the location of the double bond in the final product. As shown in Table 4.4 and Figure 4.4, the different Ni-M-X catalysts all exhibit approximately the same percentage of internal and terminal double bonds in the dimer product. This suggests that the chain transfer step is not affected by the identity of the co-cation, and therefore, by the space available within the zeolite supercage.
70
4.4.4 Apparent Activation Energies and Pre-Exponential Factors As shown in Table 4.3, the nature of the co-cation influences both the apparent pre-exponential factor and the apparent activation energy for dimer and trimer formation. Figure 4.10 shows that the apparent activation energy for both the alkali metal- and alkaline earth-exchanged zeolites decreases with increasing supercage free volume, suggesting that increased availability of space within the supercage facilitates stabilization of the transition state for dimerization and, hence, lowers the activation energy. Consistent with this reasoning, it is noted that the transition state for trimerization, which requires even more space than that for dimerization, always has a larger activation energy than that for dimerization.
As shown in Figure 4.11, a relationship between the pre-exponential factor and apparent activation energy was also observed and can be interpreted using transition state theory. The rate coefficient for the rate-limiting step in the dimerization of propene can be written as
⎟⎟⎠
⎞⎜⎜⎝
⎛ Δ−⎟⎟⎠
⎞⎜⎜⎝
⎛ Δ=⎟⎠
⎞⎜⎝
⎛ −=RTH
RS
hTk
RTEkk BA
‡‡
0 expexpexp (1)
where ΔS‡ is the entropy of activation and ΔH‡ is the enthalpy of activation. The entropy of activation must be negative, since dimerization involves the formation of a transition state between a Ni-alkyl complex and a coordinated molecule of propene (see Figure 4.8). To a good approximation the enthalpy of activation is equal to the activation energy. Therefore, an increase in the logarithm of the pre-exponential factor with increasing activation energy implies a less negative entropy of activation (i.e., the formation of a looser transition state). Such an effect could be expected to occur most strongly for alkali metal co-cations since increasing the cation size would increase the presence of larger alkali metal cations near the active site and could therefore destabilize the dimerization transition state. This effect could also account for the observed higher activation energy for dimerization as the size of the alkali metal cation increases. Changing the size of the alkaline earth cations should also affect both the entropy and enthalpy of activation since this changes the supercage free volume, but would be much smaller than that for alkali metal-exchanged zeolites as the cations are not present in the zeolite supercage, consistent with what is seen in Figure 4.11. 4.5 Conclusions A series of Ni-M-X cation exchanged zeolites were synthesized and investigated as catalysts for propene oligomerization. Under the conditions examined, the primary products were linear and branched hexenes (90%), with only a small amount of nonene isomers (10%) observed as the other product. Both the catalyst activity and the fraction of branched versus linear hexenes were found to depend on the identity of the non-catalytic, charge compensating cation. For alkali metal-exchanged X, the activity for propene dimerization increased in the order Ni-K-X < Ni-Na-X < Ni-Li-X as did the fraction of branched hexenes formed. By contrast, for alkaline earth-exchanged X, the activity for dimerization and degree of dimer branching both increased in the order Ni-Mg-X < Ni-Ca-X < Ni-Sr-X. Changing the identity of the co-cation changes the free volume within the zeolite supercages and it is proposed that this change accounts for the observed
71
differences in oligomerization activity. In alkaline earth-exchanged zeolites, the co-cations are located inside the hexagonal prisms and sodalite cages of the zeolite, which means that the increase in supercage free volume is due solely to the expansion of the lattice in the presence of large cations. In the case of alkali metal-exchanged X, some cations are located within the zeolite supercage causing the supercage free volume to decrease with increasing cation size and therefore leading to a decrease in catalyst activity for larger cations. The activation energy and pre-exponential factor for hexene dimerization were found to increase with decreasing supercage free volume. The observation of a linear correlation between the logarithm of the pre-exponential factor and the activation energy is particularly pronounced for alkali metal-exchanged Ni-M-X catalysts and is attributed to the effects of supercage free volume on both rate parameters. Since the decrease in free volume is caused in this case by the presence of alkali metal cations in the supercages, it is hypothesized that an increasing size of these cations have a destabilizing effect on the transition state for hexene dimerization which results in both an increase in the magnitude of the activation entropy and enthalpy. The observed changes in the supercage free volume for different co-cations was also found to explain the differences in dimer branching since the formation of branched hexene isomers requires a larger space than that required to form linear hexene molecules. This suggests that the amount of space within the zeolite supercage can be used to tune both the activity and isomer distribution of oligomers produced during propene oligomerization in Ni-M-X catalysts. 4.6 Supplemental Information 4.6.1 X-ray Diffraction Data for Ni-M-X Catalysts Figure 4.12 shows the XRD diffractograms for the Ni-Li-X, Ni-Na-X, Ni-K-X, Ni-Mg-X, Ni-Ca-X, and Ni-Sr-X catalysts with approximately 0.6 wt% Ni after calcination. The peaks in each diffractogram are consistent with the faujasite structure indicating preservation of the zeolite after synthesis. 4.6.2 Calculation of Supercage Free Volume in Ni-M-X Zeolites
From ref. [21], the largest included sphere that fits inside the crystallographic faujasite structure is in the supercage and has a diameter of 11.18 Å. Since the corresponding unit cell size was not provided, the sample with the smallest lattice constant in this study, Ni-Mg-X, was chosen to best represent the crystallographic structure and was therefore used as the basis for the following calculations.
The unit cell of faujasite is cubic and has an edge length of a, the lattice parameter reported in Table 4.2 for each Ni-M-X catalyst. Each unit cell contains four supercages with one in the center of the cell and one quarter of a supercage on each edge. This means that the diagonal of the unit cell bisects the centers of the supercages and is proportional to four supercage radii. Using the Pythagorean theorem, this means that the radius of the supercage, r, can be related to the unit cell length, a, through the following relationship:
r ! 24a (2)
72
Taking the Ni-Mg-X sample as the basis with the largest included sphere diameter provided above, the proportionality constant in Eqn. 2 was determined to be 0.646. The supercage radius was then calculated for each Ni-M-X catalyst using Eqn. 2, the proportionality constant, and the lattice constant determined from XRD and listed in Table 4.2. As mentioned in Section 4.4.2, 22 co-cations per unit cell reside in the supercages of the zeolite for alkali metal-exchanged zeolites. The volume of these co-cations, 5.5 per supercage on average, was calculated assuming spherical ions and using the six-coordinated ionic radii for Li+, Na+, and K+ [24]. This volume was then subtracted from the free volume calculated using Eqn. 2 to get the net free volume for the alkali metal-exchanged zeolites.
73
Table 4.1 Elemental analyses of the Ni-M-X zeolites used in this study. Elemental Analysis [wt%]
Sample Si Al Na Ni M Si/Al (cations)/Ala % Na Exchangeb Ni/Al Ni-Li-X 17.4 13.6 1.92 0.708 2.60 1.2 0.96 74% 0.024 Ni-Na-X 20.1 15.7 13.6 0.550 - 1.2 1.0 - 0.016 Ni-K-X 19.6 14.5 1.12 0.580 17.5 1.3 0.96 83% 0.018
a Calculated assuming that every positive charge from the exchanged cations can charge compensate an exchange site ((M+ + 2M2+ + 2Ni2+)/Al). b Determined as the amount of Na+ replaced by the exchanged cation, M. Table 4.2 Surface area and micropore volume determined from BET N2 adsorption and the unit cell lattice constant determined from XRD for all Ni-M-X zeolites.
Figure 4.1 Propene dimerization activity as a function of time on stream for Ni-M-X catalysts with a) alkali metal and b) alkaline earth co-cations at 453 K and 5 bar propene pressure. a)
b)
0 200 400 600 800 1000 1200 14000
30
60
90
TOS [min]
Ni-Li-X Ni-Na-X Ni-K-X
per
Ni [
h-1]
Rat
e of
C= 6 F
orm
atio
n
0 50 100 150 200 250 300 350 4000
30
60
90
120
150
TOS [min]
Ni-Mg-X Ni-Ca-X Ni-Sr-X
per
Ni [
h-1]
Rat
e of
C= 6 F
orm
atio
n
75
Figure 4.2 Steady-state propene dimerization activity for Ni-M-X catalysts at 453 K and 5 bar propene pressure.
Table 4.3 Apparent activation energies and pre-exponential rate coefficients for propene dimerization and trimerization of the Ni-M-X catalysts at steady state.
Dimerization Trimerization Sample k0 [(mol C6
=) bar-1 s-1] EA [kJ mol-1] k0 [(mol C9=) bar-1 s-1] EA [kJ mol-1]
Ni-Li-X 6.2 x 101 38 1.0 x 10² 55 Ni-Na-X 1.7 x 10² 43 1.4 x 101 54 Ni-K-X 3.0 x 10⁴ 68 1.2 x 10⁶ 103
Ni-Mg-X 1.8 x 10² 46 1.6 x 10² 62 Ni-Ca-X 1.9 x 10² 45 8.3 x 101 58 Ni-Sr-X 1.8 x 10² 42 4.9 x 101 54
Ni-Li-X Ni-Na-X Ni-K-X Ni-Mg-X Ni-Ca-X Ni-Sr-X0
10
20
30
40
50
per
Ni [
h-1]
Rat
e of
C= 6 F
orm
atio
n
76
Table 4.4 Distribution of hexene isomers formed over Ni-M-X catalysts under steady-state conditions at 453 K and 5 bar propene. Product Ni-Li-X Ni-Na-X Ni-K-X Ni-Mg-X Ni-Ca-X Ni-Sr-X 1-hexene 2.5 4.0 5.7 2.7 2.4 1.8 cis-2-hexene 10.3 13.9 16.9 11.1 9.1 7.1 trans-2-hexene 21.2 23.2 22.1 18.6 18.0 14.9 cis-3-hexene 2.4 3.2 4.4 2.1 1.9 1.4 trans-3-hexene 8.8 9.1 10.3 6.7 6.5 5.3 2-methyl-1-pentene 7.5 6.6 8.5 5.9 7.0 6.8 2-methyl-2-pentene 23.8 19.9 16.3 18.5 22.5 22.7 cis-3-methyl-2-pentene 0.6 0.0 0.0 1.1 1.1 1.4 4-methyl-1-pentene 2.9 3.6 4.0 5.8 5.2 6.6 cis-4-methyl-2-pentene 0.7 0.5 0.8 0.9 1.0 1.2 trans-4-methyl-2-pentene 10.4 10.3 6.5 14.3 13.8 17.6 2,3-dimethyl-1-butene 4.2 4.5 3.8 6.7 5.6 6.4 Figure 4.3 Percentage of linear and branched dimers produced at steady state for each Ni-M-X catalyst at 453 K and 5 bar propene pressure.
Ni-Li-X Ni-Na-X Ni-K-X Ni-Mg-X Ni-Ca-X Ni-Sr-X0
10
20
30
40
50
60
70 Linear Branched
% C
6= Pro
duct
77
Figure 4.4 Ratio of terminal to internal double bonds in the dimer product for each Ni-M-X catalyst at 453 K and 5 bar propene pressure.
Figure 4.5 Diagram showing the structure of the faujasite framework and the three general locations that exchanged cations can occupy – hexagonal prisms, sodalite cages, and the supercage.
Ni-Li-X Ni-Na-X Ni-K-X Ni-Mg-X Ni-Ca-X Ni-Sr-X0
5
10
15
20
25
%
Ter
min
al C
= 6 O
lefin
s
!!
!!
sodalite cage
hexagonal prism
supercage
78
Table 4.5 Crystallographic supercage volume, supercage volume occupied by co-cations, and net supercage free volume for each Ni-M-X catalyst calculated using the largest included sphere diameter from ref. [21] and the expansion of the unit cell measured from XRD.
Figure 4.6 Steady-state dimer formation rate at 453 K and 5 bar propene pressure as a function of the free volume per zeolite supercage for both alkali metal- and alkaline earth-exchanged Ni-M-X catalysts.
660 680 700 720 740 760 780 8000
10
20
30
40
50
60
Sr
Ca
MgK
Na
Free Volume per Supercage [Å3]
M+
M2+
per
Ni [
h-1]
Rat
e of
C= 6 F
orm
atio
n Li
79
Figure 4.7 Percentage of dimers with at least one branch versus the free volume per zeolite supercage at 453 K and 5 bar propene pressure for the alkali metal- and alkaline earth-exchanged Ni-M-X catalysts.
660 680 700 720 740 760 780 80030
40
50
60
70
80
SrCa
Mg
K
Na
Free Volume per Supercage [Å3]
M+
M2+
% o
f Bra
nche
d C
= 6
Li
80
Figure 4.8 Pathways illustrating how dimers with different degrees of branching can be formed as primary products based on the initial adsorption of propene via the 1’ or 2’ carbon onto the Ni site.
2’
Ni Ni
1’
1’ Adsorption 2’ Adsorption
1’-1’ 1’-2’ 2’-1’ 2’-2’
linear mono-branched di-branched
(cis/trans) (cis/trans)
81
Figure 4.9 Ratio of di-branched to linear dimers as a function of the supercage free volume for alkali metal- and alkaline earth-exchanged zeolites at 453 K and 5 bar propene pressure.
Figure 4.10 Activation energy for propene dimerization for each Ni-M-X catalyst as a function of the supercage free volume.
660 680 700 720 740 760 780 8000
3
6
9
12
15
18
SrCa
Mg
K
Na
Free Volume per Supercage [Å3]
M+
M2+Li
near
/ D
ibra
nche
d C
= 6
Li
660 680 700 720 740 760 780 80035
40
45
50
55
60
65
70
SrCaMg
K
Na
Free Volume per Supercage [Å3]
M+
M2+
E A(d
imer
) [kJ
mol
-1]
Li
82
Figure 4.11 The log of the apparent pre-exponential factor plotted against the apparent dimerization activation energy for Ni-M-X catalysts indicating a relationship between enthalpy and entropy of activation during the rate-determining step of propene dimerization for alkali metal-exchanged zeolites.
35 40 45 50 55 60 65 70101
102
103
104
105
M+
M2+
Linear Fit of M+
EA(dimer) [kJ mol-1]
k 0(di
mer
) [ba
r-1 s
-1]
83
Figure 4.12 XRD diffractograms of the Ni-M-X zeolites after synthesis.
5 10 15 20 25 30 35
Angle (2θ) [degrees]
Inte
nsity
[A.U
.]Ni-Li-X
5 10 15 20 25 30 35
Angle (2θ) [degrees]
Inte
nsity
[A.U
.]
Ni-Na-X
5 10 15 20 25 30 35
Angle (2θ) [degrees]
Inte
nsity
[A.U
.]
Ni-K-X
5 10 15 20 25 30 35
Angle (2θ) [degrees]
Inte
nsity
[A.U
.]Ni-Mg-X
5 10 15 20 25 30 35
Angle (2θ) [degrees]
Inte
nsity
[A.U
.]
Ni-Ca-X
5 10 15 20 25 30 35
Angle (2θ) [degrees]
Inte
nsity
[A.U
.]
Ni-Sr-X
84
References: [1] C.T. O’Connor, M. Kojima, Catal. Today 6 (1990) 329-349. [2] M. Sanati, C. Hörnell, S. G. Järås, in: J.J. Spivey (Ed.), Catalysis, The Royal Society of Chemistry, Cambridge, 1999, p. 236-287. [3] A. Corma, S. Iborra, in: E.G. Derouane (Ed.), Catalysts for Fine Chemical Synthesis, vol. 4, J. Wiley & Sons Ltd., UK, 2006, p. 125-132. [4] W. E. Garwood, in: G.D. Stucky, F.G. Dwyer (Eds.), ACS Symposium Series 218, American Chemical Society, Washington DC, 1983, p. 383-396. [5] I.E. Maxwell, Adv. Catal. 31 (1982) 1-76. [6] J. Skupińska, Chem. Rev. 91 (1991) 613-648. [7] J. Heveling, A. Van der Beek, M. De Pender, Appl. Catal. 42 (1988) 325-336. [8] J. Heveling, C.P. Nicolaides, M.S. Scurrell, Appl. Catal. A-Gen. 173 (1998) 1-9. [9] A.N. Mlinar, G.B. Baur, G.G. Bong, A. Getsoian, A.T. Bell, J. Catal. 296 (2012) 156-164. [10] B. Nkosi, F.T.T. Ng, G.L. Rempel, Appl. Catal. A-Gen. 158 (1997) 225-241. [11] H.W. Langmi, D. Book, A. Walton, S.R. Johnson, M.M. Al-Mamouri, J.D. Speight, P.P. Edwards, I.R. Harris, P.A. Anderson, J. Alloy Compd. 404-406 (2005) 637-642. [12] P. Gallezot, B. Imelik, J. Phys. Chem. 77 (1973) 652-656. [13] E. Dooryhee, C.R.A. Catlow, J.W. Couves, P.J. Maddox, J.M. Thomas, G.N. Greaves, A.T. Steel, R.P. Townsend, J. Phys. Chem. 95 (1991) 4514-4521. [14] J.F. Groust, C. Pommier, L. Stievano, F. Villain, C. Giorgetti, F. Baudelet, P. Massiani, Catal. Lett. 102 (2005) 257-260. [15] H. Guesmi, P. Massiani, Catal. Today 177 (2011) 25-30. [16] M. Suzuki, K. Tsutsumi, H. Takahashi, Y. Saito, Zeolites 9 (1989) 98-103. [17] J.S. Feeley, W.M.H. Sachtler, Catal. Lett. 9 (1991) 377-386. [18] T. Frising, P. Leflaive, Micropor. Mesopor. Mater. 114 (2008) 27-63. [19] R. T. Sanderson, J. Am. Chem. Soc. 105 (1983) 2259-2261. [20] R. T. Sanderson, J. Chem. Educ. 65 (1988) 112-118. [21] M.D. Foster, I. Rivin, M.M. J. Treacy, O. Delgado Friedrichs, Micropor. Mesopor. Mater. 90 (2006) 32-38. [22] S.A. Svejda, M. Brookhart, Organometallics 18 (1999) 65-74. [23] L. Fan, A. Krzywicki, A. Somogyvari, T. Ziegler, Inorg. Chem. 35 (1996) 4003-4006. [24] J.E. Huheey, E.A. Keiter, R.L. Keiter, Inorganic Chemistry: Principles of Structure and Reactivity, HarperCollins, New York, 1993, p. 115.
85
Chapter 5
Propene Oligomerization using Alkali Metal- and Nickel-Exchanged Mesoporous Aluminosilicate Catalysts
Abstract A series of alkali metal- and nickel- exchanged Al-MCM-41 materials were synthesized via aqueous ion exchange and examined as catalysts for gas-phase propene oligomerization at 453 K and near ambient pressures. All catalysts were active for propene oligomerization and produced oligomers with > 98% selectivity but the activity was found to decrease with time on stream for all catalysts. The highest activities per Ni2+ cation were observed when the cations were highly dispersed in the catalyst by either lowering the Ni loading at a fixed MCM-41 Si/Al ratio or by decreasing the concentration of exchangeable sites within the material by increasing the MCM-41 Si/Al ratio at a fixed Ni loading. The identity of the alkali metal cation had no significant effect on the catalytic activity or degree of dimer branching, except for the sample containing Cs+ cations, where the decreased pore volume resulted in a lower catalyst activity and slightly more linear dimer products. Comparison of Ni-MCM-41 prepared with and without Na+ cations showed that a higher yield of oligomers could be achieved when Na+ cations are present and is attributed to partial removal of strong Brønsted acid sites from the sample. When compared under the same conditions, Ni-Na-MCM-41 was found to be over twice as active as smaller-pored Ni-Na-X zeolites, in good agreement with recent work conducted with Ni-X zeolites and demonstrating that the activity of Ni2+ cations increases with the increasing free volume near the site. This effect of free volume on the activity of Ni2+ cations was further established by comparing the activities of Ni-Na-X, Ni-Na-MCM-41, Ni-Na-MCM-48, and Ni-Na-SBA-15 with respect to pore size. 5.1 Introduction The oligomerization of low molecular weight (C2-C4) olefins to produce higher molecular weight oligomers suitable as lubricants, detergents, and liquid fuels can be catalyzed by Brønsted acidic zeolites and nickel-containing heterogeneous catalysts [1-3]. Of particular note are nickel aluminosilicates, which exhibit particularly high selectivity to oligomers [4-7]. While the activity of these catalysts has been attributed to isolated Ni2+ cations, little is known about how the support and other cations present in the catalysts affect the activity of Ni2+ cations, weight distribution of oligomers, and distribution of stereoisomers at a given molecular weight. Towards developing such an understanding, we have recently shown that changing the alkali metal or alkaline earth co-cation, M, in Ni-M-X zeolites has a large effect on the catalyst activity and dimer isomer distribution for propene oligomerization [8]. These effects are ascribed to the presence of alkali metal and alkaline earth cations altering the free volume around a Ni cation within a supercage, with increased catalytic activity and dimer branching observed for catalysts with larger supercage free volume. This conclusion suggests that even higher
86
oligomerization rates might be achieved by introducing Ni cations into a larger-pored support, such as mesoporous aluminosilicates. Ni-containing MCM-41 materials were first reported to be active catalysts for ethene dimerization over 15 years ago [9]; however, it is only recently that the reactivity and properties of these materials have been studied in more detail. Studies for ethene oligomerization conducted using Ni-exchanged Al-MCM-41 in a slurry reactor [10-11] have shown that such catalysts are stable and have a high selectivity to oligomers. It was proposed that the ethene oligomerization activity in these studies arises from the presence of both Brønsted acidic and exchanged Ni sites. By contrast, a more recent study has demonstrated that siliceous Ni-exchanged MCM-41 is active for ethene oligomerization, suggesting that Brønsted acid sites are not required and that the activity is instead caused solely by three-coordinated Ni2+ cations [12]. The latter finding is consistent with our own studies of propene oligomerization over Ni-Na-X zeolites [13], which demonstrated that catalytic activity is due solely to isolated Ni2+ sites. This more recent work suggests that Brønsted acid sites are not required to produce an active oligomerization catalyst and that poisoning these sites in Ni-MCM-41 with alkali metal cations, in a manner similar to Ni-M-X zeolites, could lead to more active olefin oligomerization catalysts with increased product tunability. To examine this proposition, a series of alkali metal- and nickel-exchanged Al-MCM-41 materials were synthesized and explored as gas-phase propene oligomerization catalysts. Exchange of alkali metal and nickel cations into the MCM-41 material resulted in catalysts that were both active and selective for propene oligomerization and produced oligomers in a higher yield than the catalyst without alkali metal cations. The dispersion of the Ni2+ cations within the catalyst, controlled by either varying the nickel loading or density of exchangeable Al sites, influenced the catalyst activity with the highest rate per Ni site being achieved at the lowest catalyst Ni density. The identity of the non-catalytic alkali metal did not alter the catalytic activity or selectivity greatly, with the exception of Cs+, where a decrease in activity was observed. Comparing the propene oligomerization activity of Ni-Na-MCM-41 to that of Ni-Na-X revealed that the larger-pored mesoporous materials are more active than smaller-pored zeolites under the same reaction conditions. Examination of other Ni-exchanged MCM-41, MCM-48, and SBA-15 materials further highlights this correlation between space and catalytic activity with the highest activity per Ni site being observed for the largest-pored sample, SBA-15. 5.2 Methods
5.2.1 Catalyst Preparation Al-MCM-41 was synthesized via a procedure similar to that used to produce vanadium-substituted MCM-41 [14], except that aluminum nitrate was substituted in place of vanadyl sulfate. In all syntheses, the molar ratio was 0.33 NaOH (EMD, >99.0%) : 0.5 C16TABr (Acros, >99%) : 1 SiO2 (tetraethyl orthosilicate, Sigma-Aldrich, 98%) : x Al(NO3)3 (Alfa Aesar, 98.0-102%, nonahydrate) : 108 H2O (Millipore filtered), where x was varied in the range 0.023-0.10 to produce Al-MCM-41 materials with Si/Al molar ratios of 10-40. The synthesis mixture was refluxed for 48 h in a round-bottomed flask equipped with a water-cooled condenser and a Teflon-coated stir bar. The resulting
87
Al-MCM-41 was filtered, rinsed with Millipore purified water and ethanol, and allowed to dry before being calcined in a vertical tube furnace at 823 K for 24 h in flowing air. Following calcination, alkali metal cations were exchanged into the Al-MCM-41 materials by mixing 2.5 g of Al-MCM-41 with 100 mL of 1M LiNO3 (Sigma, >99.0%), NaNO3 (Sigma-Aldrich, >99.0%), KNO3 (Mallinckrodt Baker), or CsNO3 (Sigma-Aldrich, 99%) prepared using Millipore-filtered water. The mixture was stirred in a round-bottomed flask for 6 h at ambient temperature before it was filtered and rinsed with Millipore water to remove residual nitrates. The resulting cation exchanged Al-MCM-41 material was then placed in a vacuum oven overnight to remove excess water and stored in a gas tight amber bottle until further use. Nickel was introduced into Al-MCM-41 by ion-exchanging 1 g of Al-MCM-41 with 50 mL of 5 mM Ni(NO3)2 (Sigma-Aldrich, 99.999%, hexahydrate) solution. The exchange was performed in the same apparatus as that described above with the mixture being stirred at room temperature for 6 h before being filtered and rinsed with Millipore water. The resulting Ni-MCM-41 was then placed in a quartz boat in a horizontal quartz tube furnace where it was heated to 773 K at 2 K min-1 in air (Praxair, zero-grade) flowing at 100 cm3 min-1 and held at 773 K for 3 h to remove water and nitrate groups still left in the catalyst. Following this procedure, the sample was removed from the furnace, stored in a gas-tight vial, and placed in a desiccator to limit the readsorption of atmospheric moisture. Additional Al-MCM-41 materials with various pore sizes were synthesized by varying the aliphatic tail length of the surfactant template from C12 to C18 and following the procedure described above. Al-MCM-48 and Al-SBA-15 were synthesized by modifying previously published procedures for the formation of siliceous MCM-48 [15] and SBA-15 [16] structures so as to incorporate aluminum nitrate into the synthesis gel. Full details of these syntheses procedures are provided in the Supplemental Information. 5.2.2 Catalyst Characterization The Si, Al, Ni, and alkali metal (M) content of the catalysts was determined by ICP-OES elemental analyses performed by Galbraith Laboratories (Knoxville, TN). Catalyst surface areas, pore volumes, and average pore sizes were measured by N2 (Praxair, 99.999%) adsorption carried out in a Micromeritics Gemini VII BET instrument. Samples were outgassed overnight at 393 K under vacuum to remove residual water prior to measuring BET isotherms. Low angle XRD diffractograms were collected using a Bruker Advance D8 powder X-ray diffractometer over the range of 2θ = 1.25–10°. Temperature-programmed reduction (TPR) experiments were performed using a Micromeritics AutoChem II 2920 chemisorption instrument with 50 mL min-1 of 10% H2 diluted in Ar (Praxair, certified standard) and heating the catalyst to 1073 at 10 K min-1. The baseline of the TPR spectrum of Ni-Na-MCM-41 was adjusted using the TPR spectrum of Na-MCM-41. 5.2.3 Measurement of Reaction Rates
The catalytic activity of Ni-MCM-41 was performed in a 0.5 inch outer-diameter, stainless steel reactor [8]. The reactor was loaded with 0.050 g of the Ni-MCM-41 diluted with 0.450 g Silicycle silica (average pore diameter = 150 Å; surface area = 300 m2 g-1) to minimize pressure drop and channeling through the catalyst bed. Each catalyst was
88
calcined in situ at 773 K for 3 h (2 K min-1 ramp rate) in 1 bar air flowing at 100 cm3 min-
1 to remove any adsorbed water prior to the start of each experiment. The reactor was then flushed with 100 cm3 min-1 of helium (Praxair, 99.999%) for 5 min before introducing 30 cm3 min-1 of propene (Praxair, 99.9%) and increasing the pressure to reaction conditions. Reaction products were analyzed using an Agilent 7890A gas chromatograph equipped with two in-line gas-sampling valves, two columns, and two flame ionization detectors. The first 30 m HP-Plot Q column was used to separate products based on carbon number alone, while the second 100 m detailed hydrocarbon analysis (DHA) column (Wasson-ECE) was used with the Envantage Dragon DHA software package to identify individual dimer isomers.
5.3 Results and Discussion 5.3.1 Catalyst Characterization The BET surface areas, BJH (Barrett-Joyner-Halenda) pore volumes, and average pore sizes for the unexchanged H-Al-MCM-41 material as well as for all of the Ni-M-MCM-41 materials, where M is the alkali metal co-cation, are presented in Table 5.1. The as-synthesized H-Al-MCM-41 has a surface area of 1151 cm3 g-1 and an average pore diameter of 24.7 Å, consistent with the formation of MCM-41 using the synthesis procedure described above [14]. Confirmation of the successful synthesis of Al-MCM-41 was obtained from low-angle XRD diffractograms, which exhibited the 100 and 110 peaks characteristic of MCM-41 [14] (see Supplemental Information). Table 5.1 also shows that the pore size is maintained after ion exchange with the alkali metal and nickel cations, although the pore volume decreases slightly after the aqueous exchanges. The observed decrease in pore volume is consistent with what has been reported previously for MCM-41 treated in water [17] and is attributed to partial structure collapse of the mesoporous network. The identity of the alkali metal cation did not affect the pore size or the pore volume of the MCM-41 except for the sample containing Cs+ cations, which had a smaller pore volume than the other materials. The low pore volume of this sample could be due to either the larger Cs+ cations taking up more space in the pores of the MCM-41 or to further structural collapse upon exchange of cesium into MCM-41 than was observed for other alkali metal cations. The content of Ni and alkali metal cations (M) are listed in Table 5.1 for each of the Ni-M-MCM-41 (Si/Al = 20) samples. The data demonstrate that Ni exchange does not lead to a complete loss of M from the sample and that, with the exception of Cs+, the identity of the alkali metal cation does not affect the final Ni loading. The temperature-programmed reduction spectrum of Ni-Na-MCM-41 after calcination (see Supplemental Information) exhibits only one high-temperature peak at approximately 1050 K. This observation is consistent with Ni2+ cations being present as charge compensating cations, as shown in Figure 5.1, and is in accordance with previous observations for Ni-exchanged zeolites [13,18] and Ni-exchanged MCM-41 [10]. The absence of a peak in the range of 623-715 K, corresponding to the reduction of bulk NiO [8,10,18], indicates that all of the Ni cations in Ni-Na-MCM-41 are present as isolated Ni2+ cations in the as-prepared material. The effect of Ni(NO3)2 concentration in the exchange solution on the loading of Ni in Ni-Na-MCM-41 (Si/Al = 20) is shown in Figure 5.2. The data demonstrate that the
89
Ni loading can be controlled by varying the concentration of Ni(NO3)2 in the exchange solution; however, above a Ni(NO3)2 concentration of 5 mM, the loading of Ni did not change significantly. The maximum Ni loading that could be achieved through the aqueous ion exchange was determined to be approximately 1.15 wt%. The Si/Al ratio of the Ni-Na-MCM-41 was examined by synthesizing a series of MCM-41 samples with nominal Si/Al ratios between 10 and 40. The actual Si/Al ratio and Ni loading after Ni exchange are presented in Table 5.2 for each sample. Good agreement between the nominal and actual Si/Al ratios is observed, indicating that changing the aluminum content in the synthesis gel can change the Al content in the final material. Table 5.2 also shows that there is only a weak correlation between Ni loading and Si/Al ratio. In fact, the Ni loadings of these materials are similar over the range Si/Al = 10-20 with only the sample containing the least number of exchangeable Al sites, Si/Al = 40, having a lower Ni loading. The properties of Ni-Na-MCM-41 prepared with various surfactants and those of Ni-Na-MCM-48 and Ni-Na-SBA-15 are presented in Table 5.3. Changing the length of the aliphatic tail in the template produced Ni-Al-MCM-41 samples with a range of pore sizes and surface areas, consistent with previous reports [14]. MCM-48 was prepared using the C16TABr template and formation of this structure was confirmed by the appearance of the characteristic 211 and 200 peaks in the low-angle XRD diffractogram [15] (see Supplemental Information). After exchange with the Na+ and Ni2+ cations, the Ni-Na-MCM-48 was found to have a slightly smaller pore size and surface area than the Ni-Na-MCM-41 produced with the same surfactant; however, a surface area of 913 m2 g-
1 and pore size of 20.5 Å still suggest retention of the MCM-48 structure. Al-substituted SBA-15 was found to have a pore size of 57.7 Å and a BJH pore volume of 0.830 cm3 g-1 after synthesis from the synthesis gel, consistent with the formation of the SBA-15 structure [16]. After Na+ and Ni2+ cation exchange, the pore size of the structure remained unchanged at 57.4 Å but the pore volume decreased to 0.678 cm3 g-1, similar to what was observed for MCM-41 after aqueous ion exchange. The resulting Ni-Na-SBA-15 was found to have a lower Ni loading than the MCM materials, likely due to the small number of sites available for Ni exchange caused by the low content of Al in the material (0.05 wt%). 5.3.2 Effects of Ni Loading and Si/Al Ratio The effect of Ni loading on the activity of Ni-Na-MCM-41 (Si/Al = 20) for propene oligomerization was measured at 453 K and 1 bar propene pressure. The results of these experiments are shown in Figure 5.3. In agreement with the previous observations for ethene oligomerization [12], the propene oligomerization activity per Ni cation was found to increase with decreasing Ni loading. It is also noted that all of the catalysts deactivated with time on stream and attempts at stabilizing the catalysts by increasing the temperature to 493 K for the first 120 min time on stream, shown to work for propene oligomerization in Ni-Na-X zeolites [13], did not lead to catalyst stabilization. A possible cause for deactivation could be the relatively high yield of oligomers heavier than the dimer (discussed in Section 5.3.4) that cannot easily desorb from the catalyst and hence block active sites. This suggests that the increased catalyst activity at low Ni loadings may be caused by an increased stability of Ni sites, as long oligomers cannot block as many active sites if they are well dispersed. It is also noted
90
that while Ni-Na-MCM-41 loses activity with time on stream when used for gas-phase oligomerization, work with similar catalysts used for ethene oligomerization conducted in a slurry reactor show stable activity [10-11]. Therefore, it is conceivable that steady-state oligomerization of propene might be attainable when used in a liquid phase such as that in a slurry reactor. Higher dispersion of Ni within the support could also be achieved by increasing the Si/Al ratio, and thereby decreasing the volume density of exchangeable sites. Figure 5.4 shows this effect for a series of Ni-Na-MCM-41 materials with Si/Al ratios ranging from 10 to 40. In agreement with ethene oligomerization performed in a batch reactor [10], an increase in Si/Al ratio was found to increase the catalyst activity for propene oligomerization per Ni site. All of the catalysts deactivated with time on stream, as was the case when varying the catalyst Ni loading; however, catalysts with more dispersed exchange sites were determined to remain the most active with time on stream. This again implies that an increase in catalyst activity per Ni site can be achieved by increasing the distance between Ni sites within the catalyst. Figure 5.5 further demonstrates this point. Here the rate of propene oligomerization measured after 375 min of time on stream is plotted against the average distance between Ni sites for Ni-Na-MCM-41 catalysts with various Ni loadings and Si/Al ratios. A strong correlation is observed between the average distance between Ni2+ cations in the support and the activity per Ni2+ cation indicating that dispersion of the active sites within MCM-41 has a significant effect on the specific activity of the Ni. Furthermore, the close agreement between the two sets of data indicate that the specific activity of Ni can be increased in a similar manner either by decreasing the Ni loading for a given Si/Al ratio or by increasing the Si/Al ratio of MCM-41 for a given Ni loading. 5.3.3 Role of the Alkali Metal Cations As recently reported for propene oligomerization with alkali metal- and alkaline earth-exchanged Ni-X zeolites [8], the identity of the non-catalytic co-cation can affect both the catalyst activity and degree of dimer branching. To determine if the identity of the co-cation affects the activity and product selectivity in Ni-MCM-41 catalysts as well, a series of alkali metal-exchanged Ni-MCM-41 (Si/Al = 20) materials was synthesized and examined for propene oligomerization. The results collected at 453 K and 1 bar propene pressure are shown in Figure 5.6. It is clear that all of the catalysts are active and >98.5% selective towards the formation of propene oligomers. In general, it was observed that the identity of the cation did not greatly alter the catalytic activity, with the exception of the sample containing Cs+, which was found to be the least active catalyst. The low activity of the Ni-Cs-MCM-41 is likely due to the decreased pore space in this catalyst (see Table 5.1), a point that is discussed further in Section 5.3.1. Comparison of the activity of Ni-Na-MCM-41 to the material without alkali metal cations present shows that exchange of alkali metal cations into the catalyst increases the selectivity towards propene oligomers at higher conversions and leads to increased activity at longer time on stream (see Supplemental Information). The increased selectivity towards oligomers is consistent with at least partial exchange of strong Brønsted acid sites by alkali metal cations, since Brønsted acid protons have been shown to be active for secondary reactions, such as oligomer cracking [1-3]. The observed increase in activity of Ni-Na-MCM-41 relative to Ni-H-MCM-41 suggests that Ni sites deactivate more slowly than
91
Brønsted acid sites, as previously suggested for Ni-H-MCM-41 [10]. The removal of some Brønsted acid sites by alkali metal cation exchange could, therefore, lead to increased catalyst stability and cause an overall increase in catalyst activity at longer time on stream, consistent with what is observed experimentally. As was previously reported for alkali metal- and alkaline earth-exchanged Ni-X zeolites, the identity of the non-catalytic co-cation can also be used to tune the degree of dimer branching by varying the amount of space around the Ni site [8]. Figure 5.7 shows that the degree of dimer branching is nearly the same for Ni-M-MCM-41 (Si/Al = 20) when M = Li, Na, or K, but decreases slightly when M = Cs. Since the pore volume is smallest for Ni-Cs-MCM-41, the observed trend is consistent with that found for Ni-M-X zeolites, for which it was found that a decrease in the space around the Ni site led to more linear products. This indicates that the amount of space around the active site can still influence the degree of oligomer branching in large pore aluminosilicate structures such as MCM-41 (pore diameter = 23 Å), although the effect is much less pronounced than it is in smaller-pored zeolites (supercage diameter = 11 Å). 5.3.4 Comparison of Ni-Na-MCM-41 to other Heterogeneous Ni Catalysts Figure 5.8 compares the propene oligomerization activity of Ni-Na-MCM-41 (Si/Al = 20) to that for Ni-exchanged Na-X (Si/Al = 1.2) [13]. The Ni loading for both catalysts is 0.6 wt% and the reaction conditions are identical at 453 K and 5 bar propene pressure. Figure 5.8 shows that Ni-Na-MCM-41 is more active per Ni site than the Ni-Na-X zeolite. As was shown recently for alkali metal- and alkaline earth-exchanged Ni-X zeolites [8], increasing the amount of space around the Ni site in the zeolite supercage leads to an increased propene oligomerization rate. Since MCM-41 has a much larger pore size than zeolite X, 24 Å as compared to 11 Å in the zeolite supercage, the propene oligomerization activity per Ni site should be larger in the MCM-41, in good agreement with the results shown in Figure 5.8. Also observed in Figure 5.8, the time on stream activity of the Ni-Na-MCM-41 material is significantly different than that for the Ni-Na-X zeolite. The absence of the activation period in the Ni-Na-MCM-41 catalyst is expected as it was previously shown that this regime was due to migration of Ni2+ cations from inaccessible hexagonal prisms of the zeolite to the supercages [13]. As the MCM-41 structure does not have positions outside of the pore where the Ni2+ cations can reside, migration of the Ni2+ cations is not necessary to activate the catalyst and therefore the activation period observed for the zeolite should not be observed for MCM-41. After the zeolite activation regime, both the Ni-Na-X and Ni-Na-MCM-41 catalysts deactivate; however, the Ni-Na-X material stabilizes after long times on stream [13]. Heating the Ni-Na-X catalyst to 493 K for the first 120 min of time on stream was found to increase the rates of catalyst activation and deactivation eventually leading to stable catalyst activities when cooled back to 453 K. As mentioned in Section 5.3.2, attempts using the same procedure for Ni-Na-MCM-41 did not lead to stabilization of the catalytic activity. This is likely due to differences in the deactivation mechanisms between the two catalysts. In the zeolite, the activity decreased hyperbolically with time on stream suggesting a two-site deactivation mechanism [13,19]. It was proposed that the deactivation pathway involved two nearby sites complexing together, leading to deactivation of both sites, and leaving only those sites that were well isolated to be active and stable. For the Ni-Na-MCM-41, the activity
92
decreases exponentially with time on stream suggesting a different, one-site deactivation pathway. In this case, the deactivation is likely caused by the relatively high yield of longer oligomers, such as trimers, which constitute up to 14% of the total products produced with MCM-41 catalysts as compared to only 6% for the zeolite. These higher molecular weight oligomers would require higher temperatures to desorb and could coke up the catalyst and block active sites once they are formed. This effect is not as prevalent in the Ni-Na-X zeolite since the activation energy for trimer formation was determined to be larger than that for dimer formation, suggesting that the sterics of the framework may make it more energetically unfavorable to form long oligomers [13]. With an increase in the pore size, however, the steric effects of the support would be diminished, minimizing this effect, and leading to both a higher oligomerization activity as well as an increased catalyst deactivation due to the increased rate of long oligomer growth in the Ni-MCM-41 materials. Although the oligomerization activity did increase with increasing pore size, the degree of dimer branching did not change from 49% when changing from Ni-Na-X to the larger-pored Ni-Na-MCM-41 catalyst. This result is unexpected as increasing the free space in Ni-X zeolites using different alkali metal or alkaline earth co-cations was determined to increase both the activity and degree of dimer branching [8]. We note that Ni-Na-MCM-41, which provides more space around the active site than Ni-Na-X, does not produce dimers with a higher degree of branching than those produced for Ni-Na-X, suggesting that the degree of dimer branching may be controlled by more than just spatial constraints. As seen in Figure 5.7 and discussed in Section 5.3.3, the identity of the co-cation in the Ni-M-MCM-41 material has only a small effect on the degree of dimer branching, but not nearly as much as it does in Ni-M-X zeolites. Since the alkali metal cations are further apart on average in the more open-pored MCM-41 than in the zeolite, this difference in the degree of dimer branching between the two catalysts may suggest that the non-catalytic co-cations need to be in close proximity to the active sites in order to influence the degree of dimer branching. Thus, it is possible the alkali metal cations provide both a steric and an electronic effect on the degree of dimer branching. As previously reported for ethene oligomerization using Ni-Al-MCM-41 catalysts in the liquid phase [10], increasing the pore size of the support beyond 24 Å can lead to further increases in catalytic activity. Therefore, a series of aluminosilicate supports with various pore sizes and topologies were synthesized and ion-exchanged with Na+ and Ni2+ cations to determine if the activity could be further increased for gas-phase propene oligomerization. Figure 5.9 shows the propene oligomerization activity of each of these materials after 400 min of time on stream plotted as a function of the average support pore size. All catalysts exhibited greater than 99% selectivity to oligomers, which were comprised of 49% branched dimers, 21% of which had terminal double bonds. As shown in Figure 5.9, there is a strong relationship between the catalytic activity and the pore size of the support, with the Ni-Na-SBA-15 exhibiting the highest catalyst activity. It is also noted that the dimensionality of the pore system does not influence the catalytic activity significantly as the similarly pore sized three-dimensional MCM-48 and one-dimensional MCM-41 catalysts have similar activities. The curve drawn through the data in Figure 5.9 also shows that the effect of increasing pore size diminishes as the size of the pores becomes large. This suggests that the space around the Ni2+ active site in smaller-pored structures, such as zeolites, would have the largest effect on catalyst activity, consistent
93
with what has been observed for Ni-M-X catalysts [8]. Taken together, Figure 5.9 suggests that the space around the Ni2+ site is the predominant factor governing catalyst activity and indicates that this parameter could be used to tune the activity of future Ni-based oligomerization catalysts. 5.4 Conclusions A series of alkali metal-exchanged Ni-MCM-41 materials were examined as catalysts for propene oligomerization at 453 K and near ambient pressures. All catalysts were found to be active and selective for oligomerization and exhibited an increased oligomer yield relative to the catalyst without alkali metal cations present. Variations in the Ni loading and Si/Al ratio indicate that a high dispersion of sites within the catalyst leads to the highest catalyst activity per site. At a constant Si/Al ratio and similar Ni loading, the identity of the non-catalytic cation was found to have a small effect on the catalyst activity and oligomer selectivity at 1 bar. The only exception was for Ni-Cs-MCM-41, for which the smaller pore volume led to a decrease in catalyst activity. Comparing the propene oligomerization activity per Ni site of the Ni-Na-MCM-41 material to that of the Ni-exchanged Na-X zeolite shows that the MCM-41-based catalyst is more active under identical reaction conditions. Since MCM-41 has larger pores than the zeolite, this suggests that the increased space around the active Ni2+ sites leads to an increase in activity, consistent with what has been reported for propene oligomerization in alkali metal- and alkaline earth-exchanged Ni-X zeolites. This conclusion is further supported by the data shown in Figure 5.9, which shows a systematic increase in propene oligomerization activity per Ni2+ cation with increasing size of the pores in the support and independent of the pore connectivity. 5.5 Supplemental Information 5.5.1 Synthesis of Additional Ni-Exchanged Mesoporous Aluminosilicates Ni-Na-MCM-41 catalysts with different pore sizes were synthesized using the same procedure and molar ratios provided in the manuscript except for the substitution of C12TABr (Sigma, 99%) and C18TABr (TCI, >98.0%) for the C16TABr surfactant during the Al-MCM-41 synthesis. This resulted in two additional MCM-41 materials with pore sizes, determined from nitrogen adsorption, of 20.3 Å and 25.8 Å, respectively. Ni-Na-MCM-48 was synthesized using a similar procedure to that reported for the synthesis of siliceous MCM-48 [10]. The MCM-48 was synthesized in the same apparatus described in the manuscript with the aluminum nitrate solution added drop-wise to the gel after the addition of the tetraethyl orthosilicate (TEOS). The resulting gel, with molar composition of 7 NH4OH (Fisher, 30 wt%, aqueous) : 0.5 C16TABr : 1 SiO2 : 0.05 Al(NO3)3 : 250 H2O : 24 C2H5OH, was stirred at room temperature for 24 h then filtered and dried overnight. The powder was then suspended in a 60 mL solution comprised of 3 drops of concentrated HCl dissolved in ethanol and stirred at room temperature for 6 h to extract some of the surfactant from the material. The resulting material was calcined and then exchanged with NaNO3 and Ni(NO3)3 solutions for 1 h each before being calcined one more time to produce the Ni-Na-MCM-48 catalyst.
94
Ni-Na-SBA-15 was synthesized by modifying a procedure previously reported for the synthesis of siliceous SBA-15 [11]. During the synthesis, the HCl (Macron) concentration was decreased from 2 M to 0.2 M to decrease the rate of tetraethyl orthosilicate condensation around the P123 (Aldrich, MW = 5800) template. This allowed for a solution of Al(NO3)3 to be added drop-wise after the addition of TEOS. This gel, with a molar composition of 0.46 HCl : 0.016 P123 : 1 TEOS : 0.05 Al(NO3)3 : 190 H2O, was then allowed to mix in the apparatus described in the manuscript for 24 h at 343 K before being heated to reflux and reacted for an additional 24 h. The resulting Al-SBA-15 sample was filtered, dried, and then stirred in 60 mL ethanol at 333 K for 4 h to extract some of the P123 template from the material. The washed SBA-15 solid was then calcined and exchanged with NaNO3 and Ni(NO3)2 in the same manner reported for the MCM materials to produce the Ni-Na-SBA-15 catalyst. 5.5.2 X-ray Diffraction Measurements of MCM-41 and MCM-48 Figure 5.10 shows the low angle XRD diffractograms for the Al-MCM-41 and Al-MCM-48 structures after condensation from the synthesis gel and the subsequent calcination. The presence of the 100 and 110 reflection peaks and the 211 and 200 peaks for MCM-41 and MCM-48, respectively, confirm the formation of the desired structures before aqueous cation exchange. 5.5.3 Temperature-programmed Reduction of Ni-Na-MCM-41 Figure 5.11 shows the temperature-programmed reduction profile of the Ni-Na-MCM-41 (Si/Al = 20) sample. The high temperature peak at 1050 K is consistent with Ni2+ cations exchanged within the material [6,8,11], whereas the lack of a lower temperature peak around 623-715 K suggests the absence of bulk NiO in the sample [5,6,11]. 5.5.4 Activity and Selectivity Comparison of Ni-H-MCM-41 and Ni-Na-MCM-41 Figure 5.12 shows the comparison in catalyst activity and oligomer selectivity for the Ni-H-MCM-41 and Ni-Na-MCM-41 catalysts at 453 K and 5 bar propene pressure. As shown in Figure 5.12a, poisoning at least some of the protons in the catalyst with Na+ cations does not change the initial activity significantly but increases the activity at longer time on stream. Comparison of the oligomer selectivity over the same time span shows that the catalyst containing Na+ cations is always more selective than the catalyst without sodium exchange, shown in Figure 5.12b. Taken together, the yield of oligomers over the first 400 min of time on stream is always higher for the Na+ cation exchanged catalyst and suggests that removal of at least some of the protons remaining on sites unexchanged with Ni2+ cations is beneficial to the catalyst activity and oligomer selectivity.
95
Table 5.1 Elemental analysis, BET surface area, BJH pore volume, and average pore size for the parent H-MCM-41 material and each Ni-M-MCM-41 (Si/Al = 20) catalyst. Elemental Analysis [wt%] Sample Ni M Surface Area [m2 g-1] Pore Volume [cm3 g-1] Pore Size [Å] H-MCM-41 - - 1151 0.654 24.7 Ni-Li-MCM-41 1.04 0.01 1015 0.614 23.0 Ni-Na-MCM-41 0.96 0.10 1000 0.624 23.7 Ni-K-MCM-41 0.94 0.36 1011 0.647 23.4 Ni-Cs-MCM-41 0.57 2.43 821 0.519 24.5
Figure 5.1 Illustration showing the nature of an exchanged Ni2+ cation in the Ni-MCM-41 material after calcination in air at 773 K and before exposure to propene.
Ni2+
O O
Si Al
O
96
Figure 5.2 Ni loading in Ni-Na-MCM-41 (Si/Al = 20) as a function of the Ni(NO3)2 exchange concentration.
Table 5.2 Nominal and actual Si/Al ratio of MCM-41 when varying the aluminum content in the synthesis gel as well as the Ni loading in the corresponding Ni-Na-MCM-41 materials.
Nominal Si/Al Actual Si/Al Ni [wt%] 10 12 1.07 15 16 0.81 20 19 0.96 40 37 0.74
0 5 10 15 200.0
0.2
0.4
0.6
0.8
1.0
1.2
Ni(NO3)2 Concentration [mM]
Ni L
oadi
ng [w
t%]
97
Table 5.3 Ni loadings, BET surface areas, BJH pore volumes, and average pore sizes for Ni-Na-MCM-41, Ni-Na-MCM-48, and Ni-Na-SBA-15 materials synthesized with different pore sizes.
Figure 5.3 Time on stream activity of Ni-Na-MCM-41 (Si/Al = 20) for propene oligomerization as a function of the catalyst Ni loading. T = 453 K, P = 1 bar propene, F = 30 cm3 min-1 propene (STP).
0 50 100 150 200 250 300 350 4000
1
2
3
4
5
6
7
8
per N
i [m
in-1]
0.30 wt% Ni 0.96 wt% Ni 1.10 wt% Ni 1.13 wt% Ni
TOS [min]
C= 3 C
onsu
mpt
ion
Rat
e
98
Figure 5.4 Effect of Si/Al ratio in Ni-Na-MCM-41 on the propene oligomerization time on stream activity at 453 K, 1 bar propene pressure, and 30 cm3 min-1 propene flow rate (STP). Ni loading = 1.07, 0.81, 0.96, and 0.74 wt% for Si/Al = 10-40 respectively.
Figure 5.5 Propene oligomerization activity at approximately 375 min of time on stream (T = 453 K, P(C3
=) = 1 bar, F(C3=) = 30 cm3 min-1 at STP) as functions of Ni surface
density and average distance between Ni2+ cations within Ni-Na-MCM-41 for nickel loadings spanning 0.3-1.13 wt% Ni and Si/Al ratios spanning 10-40.
0 50 100 150 200 250 300 350 4000
1
2
3
4
5
6
7
8
per N
i [m
in-1]
Si/Al = 10 Si/Al = 15 Si/Al = 20 Si/Al = 40
TOS [min]
C= 3 C
onsu
mpt
ion
Rat
e
0.00 0.03 0.06 0.09 0.120
1
2
3
4
5
6
2.5 3.0 3.5 4.0 4.5 5.0 5.5 6.0
Ni loading Si/Al Ratio
per N
i [m
in-1]
Ni Density [Ni (nm2)-1]
C= 3 C
onsu
mpt
ion
Rat
e
Average Ni-Ni Distance [nm]
99
Figure 5.6 a) Rate of propene consumption per total Ni and b) oligomer selectivity as a function of time on stream for all Ni-M-MCM-41 (Si/Al = 20). T = 453 K, P = 1 bar, F = 30 cm3 min-1 propene (STP). a)
b)
0 50 100 150 200 250 300 350 4000
1
2
3
4
5
6
per N
i [m
in-1]
Li Na K Cs
TOS [min]
C= 3 C
onsu
mpt
ion
Rat
e
0 50 100 150 200 250 300 350 40097
98
99
100
Li Na K Cs
TOS [min]
C= 3n
See
lctiv
ity [%
]
100
Figure 5.7 Degree of branching in the dimer product as a function of the non-catalytic co-cation, M, for Ni-M-MCM-41 catalysts at 453 K, 1 bar propene pressure, 30 cm3 min-1 propene (STP), and approximately 150 min time on stream.
Figure 5.8 Comparison of time on stream propene oligomerization activity of Ni-Na-MCM-41 (Si/Al = 20) and 0.6 wt% Ni-exchanged Na-X zeolite, from ref. [13], at 453 K, 5 bar propene pressure, and 30 cm3 min-1 propene at STP.
Li Na K Cs45
46
47
48
49
50
Dim
er B
ranc
hing
[%]
0 50 100 150 200 250 300 350 4000
2
4
6
8
10
per N
i [m
in-1]
Ni-Na-X Ni-Na-MCM-41
TOS [min]
C= 3 C
onsu
mpt
ion
Rat
e
101
Figure 5.9 Relationship between the pore size of the support and the catalytic activity of Ni-Na-X, Ni-Na-MCM-41, Ni-Na-MCM-48, and Ni-Na-SBA-15 catalysts after approximately 400 min of time on stream. T = 453 K, P = 1 bar propene pressure, F = 30 cm3 min-1 propene (STP) for all catalysts.
Figure 5.10 Low-angle diffractograms of the Al-MCM-41 (Si/Al = 20) and Al-MCM-48 materials after synthesis.
0 10 20 30 40 50 600
1
2
3
4
5
per N
i [m
in-1]
Ni-Na-X Ni-Na-MCM-41 Ni-Na-MCM-48 Ni-Na-SBA-15
Average Pore Size [Å]
C= 3 C
onsu
mpt
ion
Rat
e
1 2 3 4 5 6 7 8 9 10
200
211
100 MCM-41 MCM-48
In
tens
ity [A
.U.]
Angle (2θ) [degrees]
110
102
Figure 5.11 Temperature-programmed reduction of the Ni-Na-MCM-41, Si/Al = 20, sample over the temperature range 500-1073 K.
500 600 700 800 900 1000 1100
Temperature [K]
TPR
Sig
nal [
A.U
.]
103
Figure 5.12 a) Propene conversion and b) oligomer selectivity as a function of time on stream for the Ni-Na-MCM-41 and Ni-H-MCM-41 catalysts at 453 K and 5 bar propene pressure. a)
b)
0 50 100 150 200 250 300 350 4000
1
2
3
4
5
6
7 Ni-H-MCM-41 Ni-Na-MCM-41
TOS [min]
C= 3 C
onve
rsio
n [%
]
0 50 100 150 200 250 300 350 40070
75
80
85
90
95
100
Ni-H-MCM-41 Ni-Na-MCM-41
TOS [min]
C= 3n
Sel
ectiv
ity [%
]
104
References: [1] C.T. O’Connor, M. Kojima, Catal. Today 6 (1990) 329-349. [2] M. Sanati, C. Hörnell, S. G. Järås, in: J.J. Spivey (Ed.), Catalysis, The Royal Society of Chemistry, Cambridge, 1999, p. 236-287. [3] A. Corma, S. Iborra, in: E.G. Derouane (Ed.), Catalysts for Fine Chemical Synthesis, vol. 4, J. Wiley & Sons Ltd., UK, 2006, p. 125-132. [4] G. Wendt, E. Fritsch, D. Deininger, R. Schöllner, React. Kinet. Catal. Lett. 16 (1981) 137-141. [5] J. Heveling, A. Van der Beek, M. De Pender, Appl. Catal. 42 (1988) 325-336. [6] D. Kiessling, G.F. Froment, Appl. Catal. 71 (1991) 123-138. [7] J. Heveling, C.P. Nicolaides, M.S. Scurrell, Appl. Catal. A-Gen. 173 (1998) 1-9. [8] A.N. Mlinar, O.C. Ho, G.G. Bong, A.T. Bell, ChemCatChem DOI: 10.1002/cctc.201300232. [9] M. Hartmann, A. Pöppl, L. Kevan, J. Phys. Chem. 100 (1996) 9906-9910. [10] V. Hulea, F. Fajula, J. Catal. 225 (2004) 213-222. [11] M. Lallemand, A. Finiels, F. Fajula, V. Hulea, Chem. Eng. J. 172 (2011) 1078-1082. [12] M. Tanaka, A. Itadani, Y. Kuroda, M. Iwamoto, J. Phys. Chem. C 116 (2012) 5664-5672. [13] A.N. Mlinar, G.B. Baur, G.G. Bong, A. Getsoian, A.T. Bell, J. Catal. 296 (2012) 156-164. [14] S. Shylesh, A.P. Singh, J. Catal. 233 (2005) 359-371. [15] P.P. Samuel, S. Shylesh, A.P. Singh, J. Mol. Catal. A-Chem. 266 (2007) 11-20. [16] S. Shylesh, A.P. Singh, J. Catal. 244 (2006) 52-64. [17] S. Shylesh, P.P. Samuel, A.P. Singh, Microp. Mesop. Mater. 100 (2007) 250-258. [18] A.J. Maia, B. Louis, Y.L. Lam, M.M. Pereira, J. Catal. 269 (2010) 103-109. [19] J.B. Butt, E.E. Petersen, Activation, Deactivation, and Poisoning of Catalysts, Academic Press, Inc., San Diego, 1988, p. 34.