+ All Categories
Home > Documents > Understanding therapy resistance in glioblastoma using ...

Understanding therapy resistance in glioblastoma using ...

Date post: 31-Mar-2022
Category:
Upload: others
View: 2 times
Download: 0 times
Share this document with a friend
157
Understanding therapy resistance in glioblastoma using proteomics approach By JACINTH RAJENDRA LIFE09201204011 TATA MEMORIAL CENTRE MUMBAI A thesis submitted to the Board of Studies in Life Sciences in partial fulfillment of requirements for the Degree of DOCTOR OF PHILOSOPHY of HOMI BHABHA NATIONAL INSTITUTE January 2019
Transcript

Understanding therapy resistance in glioblastoma

using proteomics approach

By

JACINTH RAJENDRA

LIFE09201204011

TATA MEMORIAL CENTRE

MUMBAI

A thesis submitted to the

Board of Studies in Life Sciences in partial fulfillment of requirements for the Degree of

DOCTOR OF PHILOSOPHY

of

HOMI BHABHA NATIONAL INSTITUTE

January 2019

STATEMENT BY AUTHOR

This dissertation has been submitted in partial fulfilment of requirements for an advanced

degree at Homi Bhabha National Institute (HBNI) and is deposited in the Library to be made

available to borrowers under rules of the HBNI.

Brief quotations from this dissertation are allowable without special permission, provided that

accurate acknowledgement of source is made. Requests for permission for extended quotation

from or reproduction of this manuscript in whole or in part may be granted by the Competent

Authority of HBNI when in his or her judgment the proposed use of the material is in the

interests of scholarship. In all other instances, however, permission must be obtained from the

author.

Navi Mumbai, Jacinth Rajendra

Date: 21.1.2019

DECLARATION

I, hereby declare that the investigation presented in the thesis has been carried out by me. This

work is original and has not been submitted earlier as a whole or in part for a degree / diploma

at this or any other Institution / University.

Navi Mumbai,

Jacinth Rajendra

Date: 21.1.2019

List of Publications arising from the thesis

Journal

1. Enhanced proteasomal activity is essential for long term survival and recurrence

of innately radiation resistant residual glioblastoma cells. Jacinth Rajendra,

Keshava K. Datta, Sheikh Burhan Ud Din Farooqee, Rahul Thorat, Kiran Kumar,

Nilesh Gardi, Ekjot Kaur, Jyothi Nair, Sameer Salunkhe, Ketaki Patkar, Sanket Desai,

Jayant Sastri Goda, Aliasgar Moiyadi, Amit Dutt, Prasanna Venkatraman, Harsha

Gowda and Shilpee Dutt. Oncotarget. 2018 Jun 12; 9(45): 27667–27681.

Chapters in books and lectures notes : N/A

Conferences

Platform presentation

1. Indian Association of Cancer Research (IACR) – April 2016 held in New Delhi,

India on April 2016 for the abstract entitled: Differential proteomic analysis reveals

role of a novel serine threonine kinase DCLK3 and 14-3-3 zeta in innately radiation

resistant and relapse cells of Glioblastoma. Jacinth Rajendra, Keshava Datta, Raja

Reddy, Nilesh Gardi, Ekjot Kaur, Ketaki Patkar, Aliasgar, Kakoli Bose, Amit Dutt,

Harsha Gowda, Shilpee Dutt

2. Indian society for neurooncology conference ( ISNOCON) - April 2018 held at

AIIMS, New Delhi from 5th April to 8th April 2018 for the abstract entitled : Enhanced

proteasome activity is essential for long term survival and recurrence of innately

radiation resistant residual glioblastoma cells

3. INDO – US Proteogenomics conference 2018 held at ACTREC, TMC, Mumbai from

7th Dec – 11th Dec 2018 for the abstract entitled : Integrin independent recruitment of

paxillin identifies it as a novel drug target in recurrent GBM. Jacinth Rajendra, Jyothi

Nair, Anagha Acharekar, Ekjot Kaur, Shilpee Dutt. Awarded 1st Prize

Poster Presentation

1. International Proteomics Symposium Conference held at IIT Bombay on December

2014 for the abstract entitled: Differential Proteome reveals major role of metabolic

pathways in conferring radio resistance to recurrent Glioblastoma. Rajendra J, Datta

Keshava, Gardi N, Patkar K, Dutt A, Gowda H, Dutt S

2. Tata Memorial Centre 75th Platinum Jubilee Celebrations held in Mumbai on February

2016 for the abstract entitled as: Differential proteomic analysis reveals role of a novel

serine threonine kinase DCLK3 and 14-3-3 zeta in innately radiation resistant and

relapse cells of Glioblastoma.

Jacinth Rajendra, Keshava Datta, Raja Reddy, Nilesh Gardi, Ekjot Kaur, Ketaki

Patkar, Aliasgar, Kakoli Bose, Amit Dutt, Harsha Gowda, Shilpee Dutt

3. International Conference on Enzymology held at ACTREC, TMC , Mumbai on January

2017 for the abstract entitled : Identification of a novel serine threonine kinase DCLK3

and immunoproteasome subunit PA28α: Potential therapeutic targets for innately

radiation resistant glioblastoma cells

Jacinth Rajendra, Keshava Datta, Sheikh Burhan Ud Din Farooqee, Raja Reddy,

Nilesh Gardi, Ekjot Kaur, Ketaki Patkar, Aliasgar Moiyad, Prasanna Venkataraman,

Kakoli Bose, Amit Dutt, Harsha Gowda, Shilpee Dutt.*

4. Annual Meeting of American Association for Cancer Research” held at Washington,

DC from April 1st – April 5th 2017 for the abstract entitled: Identification of proteasome

pathway and a novel serine threonine kinase DCLK3: Potential therapeutic targets for

innately radiation resistant glioblastoma cells.

Others

1. Radiation-induced homotypic cell fusions of innately resistant glioblastoma cells

mediate their sustained survival and recurrence. Kaur E, Rajendra J, Jadhav S,

Shridhar E, Goda JS, Moiyadi A, Dutt S.Carcinogenesis. 2015 Jun; 36(6):685-95

2. Unique spectral markers discern recurrent Glioblastoma cells from heterogeneous

parent population. Ekjot Kaur, Aditi Sahu, Arti R. Hole, Jacinth Rajendra, Rohan

Chaubal, Nilesh Gardi, Amit Dutt, Aliasgar Moiyadi, C. Murali Krishna & Shilpee Dutt Scientific Reports volume6, Article number: 26538 (2016)

Navi Mumbai,

Jacinth RajendraDate: 21.1.2019

Dedicated to my loving mother

Late Mrs. Jasmine Rajendra

Acknowledgments

I take this opportunity to express my heartfelt gratitude and thankfulness to all those who have

walked along with me through this challenging journey and motivated me to overcome the

odds.

Firstly, I would like to thank my mentor Dr. Shilpee Dutt for giving me the opportunity to

pursue my Ph.D. under her guidance. Her mentorship has molded me to think beyond barriers

in research. I am grateful to her for motivating me as a scientist and a mentor. Her constant

support, persuasion, and encouragement through all my experiences during these six years has

helped me grow as a research scientist.

I extend my earnest gratefulness to Dr. Rajiv Sarin (Ex-Director, ACTREC) and Dr. S.V.

Chiplunkar (Director, ACTREC) for providing the infrastructure of ACTREC and other

eminent facilities which helped me pursue my research interest successfully. I would also like

to thank ACTREC funds for the fellowship, Homi Bhabha National Institute (HBNI) and Tata

Memorial Centre (TMC) for providing me with the financial assistance to present my work at

an international platform.

I also express thanks to my doctoral committee members: Dr. Sorab Dalal (Chairperson,

ACTREC), Dr. Dibyendu Bhattacharya (ACTREC), Dr. Prasanna Venkatraman (ACTREC),

Dr. Harsha Gowda (Institute of Bioinformatics, Bangalore) and my ex-chairperson Dr. Rita

Mulherkar for their critical and valuable insights.

I want to further acknowledge Dr.Prasanna Venkatraman and Dr. Harsha Gowda who were

also my collaborators in this study. I want to thank Dr. Prasanna for helping me with her

expertise and resources for a part of my thesis work related to proteasome biology. I also want

to thank Dr. Harsha Gowda for providing me the platform to perform all my proteomic

experiments.

A special word of appreciation to Dr. Amit Dutt for his immense support and encouragement

both professionally and personally. I want to especially thank him for his valuable suggestions

and honest opinions in my study. It has been a privilege to seek guidance and knowledge from

a well-known scientist who has also been recognized globally for his significant contribution

to medical sciences in India.

I thank my clinical collaborators: Dr. Aliasgar Moiyadi (for providing the GBM samples for

this study, Dr. Jayant Sastri Goda for his support and guidance during the radiation experiments

performed on the orthotopic GBM mouse model. I also want to sincerely thank Dr. Rahul

Thorat (ACTREC) for his immense patience, support, encouragement while helping me with

orthotopic injections during the in vivo experiments.

The growth of a budding researcher also largely depends on the lab environment which is

maintained by the members who work as a team. So, I take this opportunity to thank my seniors:

Ekjot Kaur, Priya Puri & Gauri Patade who were part of the initial years of my Ph.D. I thank

them for their warmth and patient cooperation with which they helped me start my Ph.D. I

especially thank Ekjot Kaur and Priya Puri who were not only accommodating seniors but they

were also my companions who supported me both professionally and personally. I also thank

Priti Parikh for sharing a great bond of friendship with me during her tenure in our lab. A

special thanks to Smita Ma’am and Ganesh Sir for their diligent assistance during the course

of my Ph.D.

I also want to acknowledge my peers – Sameer Salunkhe, Jyothi Nair, Anagha Acharekar, and

Saket Vatsa Mishra for maintaining a very warm and dynamic environment in the lab. Their

genuine love, respect, support and fun-loving attitude played a vital role in boosting my

confidence and motivation to accomplish my goal. I also want to thank all the trainees who

worked with me to assist me during my study – Louella, Tejal, Samreen, Puloma, Samadri,

Gargi & Elton. A special thanks to Burhan, Keshava Datta and Kiran Kumar who worked with

me in collaboration for a part of my study.

I extend my thanks to the members of our extended lab family: The former and present Dutt

Lab Members –Pawan Upadhayay, Prajish Iyer, Rohan Chaubal, Nilesh Gardi, Pratik

Chandrani, Mukul Godbole, Manoj Sir, Hemant Dhamne, Vidya, Sanket Desai, Asim Joshi,

Bhaskar and Neelima for their professional and friendly support.

I’d like to also thank my batch mates - Bhushan Thakur, Sameer Salunkhe, Prajish Iyer, Pratik

Chaudhari, Bhavik Jain, Gopal, Arunabha, Saujanya & Mukul for being a source of

encouragement and relaxation through delightful gatherings and outings.

This journey wouldn’t have been possible without the love and care from my close friends,

family members, and spiritual mentors. I want to especially thank my lovely friends outside

my lab and ACTREC - Bhushan Thakur, Joel Christie, Shalini Dimri, Apoorva Bhope & Kunal

Onkar, Aakanksha Sharma, Swathi Maddali, Rachita Murali, Dr.Preeti Gupta, Vandana Bhalla,

Edward James, Angelin James & Ebi Suganya who never hesitated to be my listening ear in

times of difficulties. Their love and companionship helped me cope up during hard times.

Our roots define our being in this world which stems from our family. My family has been my

pillar of strength during the entire tenure of my Ph.D. I want to especially thank and

acknowledge my father Mr. D. Rajendra who not only supported me with his unconditional

love for me but he also backed me up with his ceaseless prayers which have brought me this

far. I want to thank him for patiently enduring my absence even through his ailing moments so

that I could focus on my Ph.D. and complete it. Words won’t be enough to express my gratitude

towards my elder sister Janet Rajendra who stood beside me through all the odds and tarried

along with me through these years. I thank her for being my motivator and the source of

emotional strength. She has been more than just a sister to me. I thank her for inspiring me to

dream beyond my limits and encouraging me at every step of my Ph.D. journey. I would also

like to thank my brother in law – Mr. Sunil Chetti for his love, support and timely advice when

I needed it the most. I also thank the elders of my family who supported me with their love and

prayers – Josephine Ebenezer, Dr. Helen Roberts & Hepzibah Angela.

I would also like to thank my spiritual mentors – James Ebenezer, Eunice Anita, Renuka

Samuel & T.D Samuel. I want to especially thank them for being a source of encouragement

and for helping me keep my perspectives in place during tough times of my Ph.D.

Last but not the least I thank the Lord Almighty for giving me the wisdom, strength, and grace

to bring this to completion. All glory, honor, and praise be to the God who enables and to the

God who sustains with his unending love and grace.

Jacinth Rajendra

Table of contents

SYNOPSIS ................................................................................................................................ 1

SYNOPSIS OF PH. D. THESIS.............................................................................................. 2

1 INTRODUCTION AND REVIEW OF LITERATURE ............................................. 16

1.1 Glioblastoma ................................................................................................................. 17 1.2 Standard of care ............................................................................................................ 20 1.3 Prognosis ....................................................................................................................... 21 1.4 Recurrence and therapy resistance ................................................................................ 22 1.5 Proteomics and Cancer ................................................................................................. 24 1.6 Mass spectrometry-based quantitative proteomics in cancer ........................................ 25 1.7 Isobaric tagged relative and absolute quantification (iTRAQ) ..................................... 27 1.8 Differential proteomic studies in glioblastoma ............................................................. 28 1.9 Rationale ....................................................................................................................... 31

2 MATERIAL AND METHODS ..................................................................................... 33

2.1 Cell Culture and Patient samples .................................................................................. 34 2.2 Drug Treatment ............................................................................................................. 35 2.3 Radiation treatment ....................................................................................................... 35 2.4 Trypan blue assay ......................................................................................................... 35 2.5 Clonogenic survival assay............................................................................................. 35 2.6 RNA extraction, cDNA synthesis, and qPCR ............................................................... 36 2.7 Protein Extraction ......................................................................................................... 36 2.8 iTRAQ labeling ............................................................................................................. 36 2.9 SCX FRACTIONATION ............................................................................................. 37 2.10 LC-MS/MS analysis...................................................................................................... 37 2.11 Protein identification and quantitation .......................................................................... 38 2.12 Bioinformatics Analysis................................................................................................ 38 2.13 Western Blot analysis ................................................................................................... 39 2.14 MTT cytotoxicity assay ................................................................................................ 39 2.15 Luciferase based NFkB promoter activity .................................................................... 39 2.16 Proteasome activity assay ............................................................................................. 40 2.17 Orthotopic xenograft mouse experiments ..................................................................... 40 2.18 Radiation and drug treatment of orthotopic GBM mouse model. ................................ 41 2.19 Bioluminescence imaging of orthotopic tumor xenografts ........................................... 41 2.20 Bacterial purification of GST-tagged 14-3-3 ζ ............................................................. 41 2.21 GST pull-down assay using GST tagged 14-3-3 ζ as bait ............................................ 42 2.22 Statistical methods ........................................................................................................ 42

3 CHARACTERIZATION OF THE RADIATION RESISTANT AND THE

RELAPSE POPULATION. .................................................................................................. 43

3.1 Introduction ................................................................................................................. 44

3.2 Results .......................................................................................................................... 48 3.2.1 Survival response of Relapse cells to a lethal dose of radiation ............................... 48 3.2.2 Relapse glioblastoma cells demonstrate enhanced malignant properties.................. 50 3.2.3 Presence of MNGCs post radiation and chemotherapy in glioblastoma ................... 52 3.2.4 Presence of MNGCs in other cancers. ...................................................................... 54

3.3 Discussion..................................................................................................................... 57

4 DIFFERENTIAL PROTEOMIC ANALYSIS OF PARENT, RADIATION

RESISTANT AND RELAPSE POPULATION USING QUANTITATIVE

PROTEOMIC ........................................................................................................................ 60

4.1 Identification and functional validation of pathways deregulated in RR and R

cells 61 4.1.1 Introduction ............................................................................................................... 61 4.1.2 Results ....................................................................................................................... 65 4.1.3 Discussion ................................................................................................................. 87

4.2 Identification and functional validation of candidate protein 14-3-3 zeta in RR

cells 90 4.2.1 Introduction ............................................................................................................... 90 4.2.2 Results ....................................................................................................................... 95 4.2.3 Discussion ............................................................................................................... 101

5 SUMMARY AND CONCLUSION ............................................................................. 104

5.1 Summary .................................................................................................................... 105

5.2 Conclusion ................................................................................................................. 108

6 REFERENCES ............................................................................................................. 110

7 APPENDIX.................................................................................................................... 121

8 PUBLICATIONS .......................................................................................................... 124

List of figures

Figure 1 Age-adjusted and age-specific incidence rates for glioblastoma at diagnosis and

gender, CBTRUS statistical report: NPCR and SEER, 2006–2010. ....................................... 17

Figure 2 Distribution of glioblastoma in different regions of the brain. .................................. 18

Figure 3 MRI of the brain Image courtesy of George Jallo, MD ............................................ 19

Figure 4 Common alterations involved in glioblastoma. Image adopted from (1) .................. 24

Figure 5 Schematic representation of proteomic analysis using mass spectrometry (4) ......... 25

Figure 6 Different types of quantitative proteomic techniques. .............................................. 27

Figure 7 Chemical structures for iTRAQ................................................................................. 28

Figure 8 Formation of MNGCs. Image adopted from (1) ...................................................... 44

Figure 9 Schema showing the multi-step in-vitro radiation model recapitulating the

progression of GBM and demonstrating the non-proliferative phase (76) .............................. 47

Figure 10 Cellular model to capture the inaccessible residual cells. ....................................... 48

Figure 11 Radiation response of relapse (R1) cells to second round of lethal dose of radiation

.................................................................................................................................................. 49

Figure 12 Radioresistance of R1 and R2 compared to P ......................................................... 50

Figure 13 Wound healing assay for parent and relapse cells ................................................... 50

Figure 14 Boyden chamber assay for comparing the invasion of Relapse cells as compared to

Parent ....................................................................................................................................... 51

Figure 15 Schematic representation of the experiment to examine the presence of MNGCs in

response to standard therapy .................................................................................................... 52

Figure 16 monitoring the presence of MNGCs in response to therapy. .................................. 53

Figure 17 Clonogenic survival curves of different cancer cell lines. ...................................... 54

Figure 18 Growth kinetics of cell lines post radiation ............................................................. 55

Figure 19 Morphological changes in response to radiation. .................................................... 56

Figure 20 Presence of MNGCs in other cancer. ...................................................................... 56

Figure 21 Different types of proteasomes ................................................................................ 63

Figure 22 Nf-kB an indirect target of proteasomes (2) ............................................................ 64

Figure 23 In vitro radiation resistant model ............................................................................. 66

Figure 24 A schematic representation of the proteomics workflow. ....................................... 67

Figure 25 Proteomic analysis of the parent (P), radiation resistant (RR), relapse(R) ............. 68

Figure 26 Unsupervised clustering of differential proteins. .................................................... 69

Figure 27 Pathway analysis of the cluster 2 and cluster 3 ....................................................... 70

Figure 28 Deregulated pathways in the radiation resistant and relapse population ................. 72

Figure 29. Validation of proteomics data ................................................................................ 73

Figure 30 Proteasome activity and expression of beta catalytic subunits in RR cells. B ........ 75

Figure 30 Proteasome activity and expression of beta catalytic subunits in RR cells. .....Error!

Bookmark not defined.

Figure 31. Dose determination of bortezomib in SF268.......... Error! Bookmark not defined.

Figure 32. Effect of proteasome inhibition on proteasome activity in vitro in RR cells ..Error!

Bookmark not defined.

Figure 33 Effect of proteasome inhibition on cell viability of RR cells in vitro. .............Error!

Bookmark not defined.

Figure 34 Western blot for protein expression of activated NfκB (phosphorylated p65) in the

P (Parent) and RR (Radiation resistant) cells .......................................................................... 81

Figure 35 Heat map representation of gene expression values of NFkB target genes.Figure 34

Western blot for protein expression of activated NfκB (phosphorylated p65) in the P (Parent)

and RR (Radiation resistant) cells............................................................................................ 81

Figure 35 Heat map representation of gene expression values of NFkB target genes. ........... 82

Figure 36 Luciferase based reporter assay for the transcriptional activity of NFkB ............... 83

Figure 37 Tumorigenic potential of RR cells compared to P .................................................. 84

Figure 38 Tumorigenic potential of BTZ pretreated P and RR cells ....................................... 85

Figure 39 Schematic representation for studying the effect of intraperitoneal injections of

bortezomib along with radiation treatment of mice intracranially injected with parent GBM

cells. ......................................................................................................................................... 86

Figure 40 Effect of proteasome inhibition on the tumorigenic potential of the cells in vivo .. 87

Figure 41 Proposed model for the study .................................................................................. 90

Figure 42 Structure of 14-3-3 .................................................................................................. 91

Figure 43 14-3-3 pathways to maintain normal cellular homeostasis. .................................... 92

Figure 44 Overexpression of 14-3-3 zeta in different cancers. ................................................ 93

Figure 45 Expression of 14-3-3 ζ in TCGA patient samples dataset. ...................................... 95

Figure 46 Expression of 14-3-3 zeta. ....................................................................................... 96

Figure 47 Identification of ζ interacting partners using GST pull down assay. ....................... 97

Figure 48 Mitochondrial function of RR compared to R. ...................................................... 100

Figure 49 Mitochondrial morphology of P and RR cells. ..................................................... 101

List of tables

Table 1 List of proteasome subunits differentially expressed in all biological replicates. ...... 74

Table 2 Downregulated proteasome target proteins ................................................................ 78

Table 3 List of interacting proteins identified in RR cells. ...................................................... 97

Table 4 List of interacting proteins functionally classified ..................................................... 99

Synopsis

SYNOPSIS

2

Homi Bhabha National Institute

SYNOPSIS OF Ph. D. THESIS

SYNOPSIS

Introduction

Glioblastoma are the most aggressive and malignant form of brain tumor associated with poor prognosis

and refractory to the first line of treatment adopted: surgery and chemo-radiation. It accounts for about

3.5% of all the malignant tumors, 15 % of all malignant primary brain tumors and 50% of all gliomas.

Despite undertaking the multimodal therapy the median survival for these patients is not more than 12

– 15 months and recurrence is inevitable.(2, 3) Recurrence in GBM is one of the major contributing

factors of high morbidity and mortality of GBM. This is attributed to a subpopulation of cells that

survive initial therapies and cause tumour re-growth (4, 5). However, targeting residual resistant cells

of glioma is challenging since they are invisible in MRIs post initial treatment and they are inaccessible

from the patient biopsies for biological studies (6, 7). Extensive research is being done to identify

effective therapeutic targets for this lethal tumor but effective development of therapeutics that can

interfere specifically with the function of these residual resistant cells largely remains unmet due to lack

1. Name of the Student: JACINTH RAJENDRA

2. Name of the Constituent Institution: TMC-ACTREC

3. Enrolment No. : LIFE09201204011

4. Title of the Thesis: Understanding therapy resistance in Glioblastoma using proteomics

approach

5. Board of Studies: Life Sciences

1.1.1

SYNOPSIS

3

of identification of differential molecular events that make this subpopulation of residual resistant cells

different from the bulk tumor cells. (8-13)

We have previously reported development of a cellular model of radiation resistance using GBM cell

lines and primary cultures from patient samples, which recapitulate the clinical scenario of resistance

and enable us to capture residual radiation resistant (14) cells (15) and understand their molecular

mechanism of survival.

Rationale

There are numerous studies in glioblastoma looking at the differential gene expression in therapy

resistant glioma cells.(5, 16-18) But gene expression not always correlate with the protein expression

and the identification of any therapeutically relevant pathway from these studies still remains as elusive

as before. Proteomics directly addresses the functional effectors of cellular and disease processes.(19,

20) Till date majority of proteomics studies in glioblastoma have focused on identification of

differential proteins amongst different on GBM cell lines, patient samples or within the same tumour to

investigate the heterogeneity of glioblastoma, mechanism of chemoresistance and identification of

diagnostic biomarkers. (21-32) Since proteins are the effector molecules for almost all the cellular

pathways therefore here we want to analyze the proteome of the radio-resistant and relapse cells. Thus,

this study is based on the hypothesis that the glioblastoma radio-resistant residual cells undergo a change

in their protein repertoire which promotes their survival and leads to relapse. Identification of

differential proteins in the radiation resistant residual cells and relapse cells will provide invaluable

insights into the cellular pathways of resistant cells and will help in the identification of therapeutically

relevant drug targets to eliminate resistant cells.

Basis of the project- This study will be done using an in vitro radiation resistant model that has

previously been established in our lab (15) from Glioblastoma cell lines U87MG and SF268 and primary

cultures from patient samples. The radiation resistant cells were obtained by subjecting the glioma grade

IV cells (U87MG, SF268 and two primary patient samples) to lethal dose of radiation (at which ~10%

SYNOPSIS

4

population survive) determined using clonogenic survival assay. It was observed that in all the cell

cultures, a small population of cells (~10% or less) that we call “Radiation resistant” escape apoptosis

and survive. These surviving cells exhibit a transient non-proliferative, multinucleated and giant cell

phenotype for a period of 1 week or less and then resume their growth similar to their parent population

to form “Relapse population”.

Accordingly, by identifying the differential proteins in radiation resistant we should be able to

understand the molecular mechanism used by these cells to overcome therapy induced stress and

apoptosis. Hence in this study a quantitative proteomics approach has been adopted identify the

functional role of differentially expressed proteins in influencing radiation surviving mechanism in

Glioblastoma.

Aim of my thesis project is to understand the molecular pathways influencing therapy surviving

glioblastoma cells using a proteomic approach.

The Specific Objectives are:

1. Characterization of the radiation resistant and the relapse population.

2. Identification of the differential proteome in radioresistant Glioblastoma cell line: SF268 using

quantitative proteomic approaches and protein identification by Mass Spectrometry.

3. Pathway analysis and functional validation of differentially identified proteins

Objective 1 - Characterization of the radiation resistant and the relapse population.

Following aspects of the radiation resistant and relapse will be studied: -

1. Does the relapse population have more aggressive nature compared to the parent population?

2. Are radiation resistant with a multinucleated and giant phenotype radiation specific phenotype or

they are formed in combination with chemotherapy?

3. Are multinucleated and giant cells formed in other cancers post radiation

SYNOPSIS

5

Work Plan

1. To analyze whether this multinucleated and giant phenotype of the radiation resistant is radiation

specific, U87MG cells will be monitored by cell counting and microscopic observation under 4

conditions: a) Daily dose of 2Gy radiation b) Daily dose of 2Gy + Temozolomide (TMZ) (25µM)

c) Daily dose of 25µM TMZ d) Lethal dose of radiation – 8Gy. The fractionated dose of radiation

and temozolomide will be administered until < 10% cells are left behind post treatment.

2. Further, to assess the aggressive behavior of relapse cells, the parent and relapse cells of GBM cell

lines and patient samples will be compared for their invasive and migrating phenotype using the

matrigel based boyden chamber assay and wound healing assay.

Work Done

1.1 Multinucleated and Giant cells (MNGCs) are not radiation specific but are also formed upon

Temozolomide treatment (alone and with radiation).

A fractionated dose of total 26Gy and 25µM was administered until less than 10% cells survived. It was

observed that the cells that received only 26Gy radiation or daily dose of only 25µM remained in a non-

proliferative phase for 31days and 41days, respectively. However, the cells that were given both IR and

TMZ did not survive. The presence of Multinucleated and Giant cells (MNGCs) were quantified at

regular intervals in all conditions. It was found that the percentage of MNGCs in the cells that were

administered only 2Gy IR and 2Gy IR + TMZ were more compared to untreated and only TMZ

treatment. This showed that MNGCs are indeed formed in response to radiation and chemotherapy

treatment and are involved in Tumor relapse.

1.2 Multinucleated and Giant cells (MNGCs) are not GBM specific and formed in other cancers.

4 different cancerous cell lines were studied, one colorectal cell line HT29, one lung cancer cell line

H1975, and two breast cancer cell line- MCF7 and T47D and their lethal dose were determined by

Clonogenic survival assay. All 4 cell lines were subjected to a lethal dose of radiation and monitored

SYNOPSIS

6

for the presence of non-proliferative multinucleated and giant cells. HT29 T47D and MCF7 remained

in a non-proliferative phase and then followed by relapse. The lung cancer cell line H1975 did not form

relapse cells. Instead, the cells after the radiation with lethal does completely attained senescence at 6th

day and no further traces of proliferation was seen. The RR cells formed from each of the cell line

displayed presence of multinucleated and giant cells along with increased expression of pro-survival

genes and SASPs.

1.2 Relapse cells are more migrating and invasive than the parent cells

The matrigel based invasion assay and wound healing assay for migration was performed in Parent

and Relapse population of SF268, U87MG and 3 Patient Samples. The Relapse population of the 2

GBM cell lines and one patient sample showed a significant increase in the invasion and migrating

potential as compared to the Relapse population.

1.3 Relapse cells display similar response to radiation as the Parent

Relapse population of SF268 and U87MG was subjected to its respective lethal dose of radiation i.e.

6.5Gy and 8Gy, respectively and monitored the growth of the cells by trypan blue counting every

alternate day. Cells remained in a non-proliferative phase for just 4 – 5 days as in the case when the

untreated cells were subjected to the same dose of radiation. However, after a period of 4-5 days the

cells resumed growth to form the second relapse population. This suggests that just as the parent

exhibited the presence of a subpopulation of cells that had the ability to escape radiation, similarly, the

relapse population also displayed the presence of radiation resistant cells. Additionally, a clonogenic

survival assay revealed similar radiosensitivity of the two relapse populations as compared to the parent.

SYNOPSIS

7

Objective 2 - Identification of the differential proteome in radioresistant Glioblastoma cell line:

SF268 using quantitative proteomic approaches and protein identification by Mass Spectrometry.

We will use the three populations: Parent, Radiation resistant and Relapse Population from the two

Glioblastoma cell line SF268. The differentially expressed proteins will be determined across the three

populations using Isobaric tag for relative and absolute quantitation (iTRAQ) which is a MS-based

approach for the relative quantification of proteins, relying on the derivatization of primary amino

groups in intact proteins using isobaric tag for relative and absolute quantitation. Due to the isobaric

mass design of the iTRAQ reagents, differentially labeled proteins do not differ in mass; accordingly,

their corresponding proteolytic peptides appear as single peaks in MS scans. The isotope-encoded

reporter ions that can only be observed in MS/MS spectra allow for calculating the relative abundance

(ratio) of the peptide(s) identified by this spectrum. The candidate differentially expressed proteins will

be further confirmed by western blot in another GBM cell line (U87MG) and other patient samples.

Work Done

Quantitative proteomic analysis of radio resistant (RR) and relapse (R) cells

Three populations: Parent(P), Radiation Resistant (RR) and Relapse(R) Population from the

Glioblastoma cell line SF268 was used for performing differential proteomic analysis using Isobaric

tag for relative and absolute quantitation (iTRAQ).

824 proteins were found to be differentially expressed in radiation escapers as compared to parent cells

out of which 431 proteins were downregulated (Fold change <0.7) and 393 proteins were up-regulated

(Fold Change >1.5). 874 proteins were differentially expressed in relapse population as compared to

parent cells of SF268 out of which 523 proteins were downregulated (<0.7) and 351 proteins were up-

regulated (>1.5). (Fig 2.A).1392 proteins were differentially regulated in Relapse vs Radiation Resistant

out of which 747 proteins were upregulated (>1.5) and 645 were downregulated (<0.7).

SYNOPSIS

8

The iTRAQ data was validated by western blot of few candidate proteins such as EGFR, HRAS, and

YBX3. The expression of these proteins was correlated with the expression pattern in the iTRAQ data

set.

Similarly, the iTRAQ analysis of the three SF268 populations: Parent, Radiation Resistant and Relapse

population was performed in five biological independent experiments.

Objective 3 - Pathway analysis of differentially expressed proteins and functional validation of

the identified proteins in the primary patient samples.

Work Plan

The list of differentially expressed proteins identified will be analyzed for their collaborative role in

any cellular signaling pathway by performing pathway analysis using KEGG database and Molecular

Signature Database. The expression of proteins found in the relevant pathways will be validated using

western blot in the three populations of cell lines: U87, SF268 and Patient Samples. Proteins from the

statistically significant pathway will be studied for its functional role in the formation of radiation

resistant cells and relapse. To understand the functional role of a pathway, the protein expression will

be inhibited either by shRNA /siRNA mediated knockdown or a pharmacological inhibitor. Following

the inhibition of the proteins we will check the involvement of candidate proteins in therapy resistance

by subjecting the cells to different doses of radiation and analyzing the clonogenic potential of these

cells compared to sensitive and untreated resistant cells to check the reversal of resistant phenotype of

these cells.

Work Done

3.1 Unsupervised clustering of proteomics data identifies protein clusters uniquely differential in

each population

In order to determine the pattern of expression of proteins and the commonality in the function of

proteins as the cell progresses from Parent, Radiation Resistant to Relapse phase Unsupervised

hierarchal clustering was performed using gene expression data sets from the three comparisons ( R vs

SYNOPSIS

9

RR , R vs P and RR vs P). This segregated the data set into five clusters depending on the pattern of

differential expression across the three populations. 134 proteins were found to be dowregulated in the

radiation escapers and relapse as compared to the parent cells (C1). 783 proteins were majorly

upregulated in Relapse population but were showed downregulation / similar expression in radiation

escapers as compared to the parent (C2). 641 proteins were upregulated in the RE population as

compared to the other two population (C3). The expression of 165 proteins remains at a basal level in

the P and RR population however their expression goes down in the relapse cells (C4) and 70 proteins

show an increase in expression in the Radiation Escapers and Relapse population as compared to the P

cells (C5). The major two clusters that were further analysed were cluster 2 and 3 which comprised of

maximum genes.

3.2 Pathway analysis reveals deregulation of proteasome and protein turnover machinery

proteins in RR population and deregulation of focal adhesion pathway in relapse cells

Gene ontology and enrichment analysis of the entire differential proteins found in the RR compared to

the parent cells, revealed 24 pathways enriched with upregulated and downregulated proteins. Of these,

8 pathways were enriched with upregulated proteins and 16 pathways were enriched with

downregulated proteins. However, proteasome pathway was the most deregulated pathway based on

the associated genes filter (k/K ratio). Proteomic analysis from three biological replicates also revealed

significant deregulation of proteasome pathway in the RR population.

Correlating the phenotype of increased migration and invasive capacity of Relapse cells, the proteomic

analysis revealed upregulation of genes involved in focal adhesion – ITGB5, ICAM1, VASP, FN1,

PPR12A, and FLNB. These genes were screened in the relapse cells of U87MG and three patient

samples at mRNA level by real time PCR. ITGB5 was the only gene found to be upregulated at the

transcript and protein level in the relapse cells of cell lines and patient samples.

FUNCTION VALIDATION

Functional validation of proteasome pathway was further carried out to understand the survival

mechanism of RR cells.

SYNOPSIS

10

3.3 RR cells display enhanced proteasome activity and survival dependency on proteasome

activity in vitro and in vivo

In order to confirm the increase in proteasome pathway in the RR population, Proteasome activity assay

was performed in the RR population of SF268, U87 and 2 Patient Samples. The RR population of both

the cell lines and Patient samples showed increased proteasome activity. To study the effect of

proteasome inhibition on radioresistance in vitro the Parent and RR population were treated with

different doses of Bortezomib – 0.1nM, 1nM and 10nM and checked for proteasome activity inhibition

and cell viability. It was found that RR population was more sensitive to proteasome inhibition at 10nM

conc. The RR population also exhibited increased radiosensitivity in the presence of the proteasome

inhibitor when subjected to different doses of radiation.

The subtle effect of bortezomib seen in vitro after 72 hrs. post treatment is significantly enhanced in

reducing tumorigenicity of the treated cells in vivo, suggesting a slow and prolonged effect of

proteasome inhibition on the survival of the cells. A significant effect of proteasome inhibition was

observed on the overall survival of mice which were injected with pre-treated RR-BTZ cells along with

an increased % of tumour free mice when BTZ was administered intraperitoneally along with radiation.

3.4 Proteasomes indirectly regulate RR cell survival via the NFkB activation

Furthermore, the levels of activated NFkB was checked by western blot in the P and RR cells of cell

lines and patient samples. The RR cells displayed increased levels of activated NFkB in both the cell

lines and PS1. Furthermore, the transcript levels of 9 NFkB target genes (TNF-α, IL6, IkB-a, IFN-γ,

ICAM1, COX2, NOD4, p16, SOD2) were screened in RR cells of the cell lines and patient sample by

real-time PCR. At least 6 genes out of the 9 in SF268, U87 and PS1 harbour increased expression of

phospho-NFkB suggesting the presence of a transcriptionally active NFkB in RR cells. To directly

assess the NFkB transcriptional activity in the RR cells of U87, we monitored the relative promoter

activity of the luciferase based NFkB reporter constructs in the P and RR cells. The RR cells showed

a significant increase (20 fold) in NFkB transcriptional activity as compared to the parent population

(P). Importantly, administration of the proteasome inhibitor (Bortezomib) in the P and RR cells

SYNOPSIS

11

diminished this activity by 1.5 and 3.0-fold demonstrating the dependency of NFkB activity on the

proteasome activity. A synergistic inhibitory effect was observed in the presence of IkB-alpha construct

and bortezomib in the P and RR cells. However, the RR cells displayed a much higher reduction as

compared to the P cells

CONCLUSION AND DISCUSSION

The aim of this study was to identify the processes deregulated in the innately radiation resistant residual

(RR) population as we have previously shown that these are the cells responsible for relapse in

glioblastoma. iTRAQ based quantitative proteomic analysis on the parent (P), innately radiation

resistant residual (RR) and relapse (R) population revealed significantly deregulation of the proteasome

pathway in the RR cells. Contrary to other reports, the RR cells displayed enhanced expression and

activity of proteasome subunits, which triggered NFkB signalling. Pharmacological inhibition of

proteasome activity led to impeded NFkB transcriptional activity, radio-sensitization of RR cells in

vitro, and significantly reduced capacity of RR cells to form orthotopic tumours in vivo. We demonstrate

that combination of proteasome inhibitor with radio-therapy abolish the inaccessible residual resistant

cells thereby preventing GBM recurrence. However, the exact mechanism downstream to higher

proteasome expression and NFkB activity in the RR cells needs to be further explored. Nonetheless,

this study establishes that proteasomes aid the survival of the innate radiation resistant population via

NFkB pathway and hence can be valuable targets for precluding relapse in glioblastoma. Apart from

the identification of biological processes governing the survival of RR cells, proteomic revealed

deregulation of focal adhesion proteins in the Relapse cells as a candidate gene that can be explored

further. This correlated with the enhanced invasion and migrating properties demonstrated by the

relapse cells inspite of having a similar response to the lethal dose of radiation as compared to the parent

cells. Further, the multinucleated and giant cells (MNGCs) formed in RR cells are not specific to

radiation in Glioblastoma but are formed in response to chemotherapy and in other cancers too. To

summarize, this study has revealed new insights on the radiation resistant residual cells and relapse cells

that can be further explored for a deeper knowledge of radioresistance and recurrence in glioblastoma.

SYNOPSIS

12

References

1. Stupp R1 MW, van den Bent MJ, Weller M, Fisher B, Taphoorn MJ, Belanger K,

Brandes AA, Marosi C, Bogdahn U, Curschmann J, Janzer RC, Ludwin SK, Gorlia T, Allgeier

A, Lacombe D, Cairncross JG, Eisenhauer E, Mirimanoff RO. Radiotherapy plus concomitant

and adjuvant temozolomide for glioblastoma. N Engl J Med. 2005 March 10;352:9.

2. Stupp R1 HM, Mason WP, van den Bent MJ, Taphoorn MJ, Janzer RC, Ludwin SK,

Allgeier A, Fisher B, Belanger K, Hau P, Brandes AA, Gijtenbeek J, Marosi C, Vecht CJ,

Mokhtari K, Wesseling P, Villa S, Eisenhauer E, Gorlia T, Weller M, Lacombe D, Cairncross

JG, Mirimanoff RO. Effects of radiotherapy with concomitant and adjuvant temozolomide

versus radiotherapy alone on survival in glioblastoma in a randomised phase III study: 5-year

analysis of the EORTC-NCIC trial. 2009;10.

3. Glas M, Rath BH, Simon M, Reinartz R, Schramme A, Trageser D, et al. Residual

tumor cells are unique cellular targets in glioblastoma. Annals of neurology. 2010

Aug;68(2):264-9. PubMed PMID: 20695020. Pubmed Central PMCID: 4445859.

4. Kelley K, Knisely J, Symons M, Ruggieri R. Radioresistance of Brain Tumors.

Cancers. 2016 Mar 30;8(4). PubMed PMID: 27043632. Pubmed Central PMCID: 4846851.

5. Weller M, Cloughesy T, Perry JR, Wick W. Standards of care for treatment of recurrent

glioblastoma--are we there yet? Neuro-oncology. 2013 Jan;15(1):4-27. PubMed PMID:

23136223. Pubmed Central PMCID: 3534423.

6. Roy S, Lahiri D, Maji T, Biswas J. Recurrent Glioblastoma: Where we stand. South

Asian journal of cancer. 2015 Oct-Dec;4(4):163-73. PubMed PMID: 26981507. Pubmed

Central PMCID: 4772393.

7. Reardon DA. Therapeutic Advances in the Treatment of Glioblastoma: Rationale and

Potential Role of Targeted Agents. The Oncologist. 2006;11(2):152-64.

8. Zhang X. Glioblastoma multiforme: Molecular characterization and current treatment

strategy (Review). Experimental and Therapeutic Medicine. 2011.

9. Weller M, Cloughesy T, Perry JR, Wick W. Standards of care for treatment of recurrent

glioblastoma--are we there yet? Neuro-Oncology. 2012;15(1):4-27.

10. Mangum R. Glioma Stem Cells and their Therapy Resistance. Journal of

Carcinogenesis & Mutagenesis. 2012;01(S1).

11. Kanu OO, Mehta A, Di C, Lin N, Bortoff K, Bigner DD, et al. Glioblastoma

multiforme: a review of therapeutic targets. Expert Opin Ther Targets. 2009 Jun;13(6):701-18.

PubMed PMID: 19409033. Epub 2009/05/05. eng.

12. Wurth R, Barbieri F, Florio T. New Molecules and Old Drugs as Emerging Approaches

to Selectively Target Human Glioblastoma Cancer Stem Cells. Biomed Res Int.

2014;2014:126586. PubMed PMID: 24527434. Pubmed Central PMCID: 3909978.

13. Roger Stupp MD, Warren P. Mason, M.D., Martin J. van den Bent, M.D.,, Michael

Weller MD, Barbara Fisher, M.D., Martin J.B. Taphoorn, M.D.,, Karl Belanger MD, Alba A.

Brandes, M.D., Christine Marosi, M.D.,, Ulrich Bogdahn MD, Jürgen Curschmann, M.D.,

Robert C. Janzer, M.D.,, Samuel K. Ludwin MD, Thierry Gorlia, M.Sc., Anouk Allgeier,

Ph.D.,, Denis Lacombe MD, J. Gregory Cairncross, M.D., Elizabeth Eisenhauer, M.D.,, et al.

Radiotherapy plus Concomitant and Adjuvant Temozolomide for Glioblastoma. The new

england journal of medicine. 2005.

14. Kaur E, Rajendra J, Jadhav S, Shridhar E, Goda JS, Moiyadi A, et al. Radiation-induced

homotypic cell fusions of innately resistant glioblastoma cells mediate their sustained survival

and recurrence. Carcinogenesis. 2015 Jun;36(6):685-95. PubMed PMID: 25863126.

15. Zhang X, Zhang W, Cao WD, Cheng G, Zhang YQ. Glioblastoma multiforme:

Molecular characterization and current treatment strategy (Review). Exp Ther Med. 2012

SYNOPSIS

13

Jan;3(1):9-14. PubMed PMID: 22969836. Pubmed Central PMCID: 3438851. Epub

2012/09/13. Eng.

16. Kumar DM, Patil V, Ramachandran B, Nila MV, Dharmalingam K, Somasundaram K.

Temozolomide-modulated glioma proteome: role of interleukin-1 receptor-associated kinase-

4 (IRAK4) in chemosensitivity. Proteomics. 2013 Jul;13(14):2113-24. PubMed PMID:

23595970.

17. ZHANG AWaG. Differential gene expression analysis in glioblastoma cells

and normal human brain cells based on GEO database. ONCOLOGY LETTERS. 2017 07

September;14.

18. Mann APM. Proteomics to study genes and genomes. NATURE. 2000;405 |.

19. Picotti P, Bodenmiller B, Aebersold R. Proteomics meets the scientific method. Nature

methods. 2013 Jan;10(1):24-7. PubMed PMID: 23269373.

20. . !!! INVALID CITATION !!!

21. Khwaja FW, Reed MS, Olson JJ, Schmotzer BJ, Gillespie GY, Guha A, et al. Proteomic

identification of biomarkers in the cerebrospinal fluid (CSF) of astrocytoma patients. Journal

of proteome research. 2007 Feb;6(2):559-70. PubMed PMID: 17269713. Pubmed Central

PMCID: 2566942.

22. Vogel TW, Zhuang Z, Li J, Okamoto H, Furuta M, Lee YS, et al. Proteins and protein

pattern differences between glioma cell lines and glioblastoma multiforme. Clinical cancer

research : an official journal of the American Association for Cancer Research. 2005 May

15;11(10):3624-32. PubMed PMID: 15897557.

23. de Aquino PF, Carvalho PC, Nogueira FC, da Fonseca CO, de Souza Silva JC, Carvalho

Mda G, et al. A Time-Based and Intratumoral Proteomic Assessment of a Recurrent

Glioblastoma Multiforme. Frontiers in oncology. 2016;6:183. PubMed PMID: 27597932.

Pubmed Central PMCID: 4992702.

24. Zhang P, Guo Z, Zhang Y, Gao Z, Ji N, Wang D, et al. A preliminary quantitative

proteomic analysis of glioblastoma pseudoprogression. Proteome science. 2015;13:12.

PubMed PMID: 25866482. Pubmed Central PMCID: 4393599.

25. Hudler P, Kocevar N, Komel R. Proteomic approaches in biomarker discovery: new

perspectives in cancer diagnostics. TheScientificWorldJournal. 2014;2014:260348. PubMed

PMID: 24550697. Pubmed Central PMCID: 3914447.

26. Kalinina J, Peng J, Ritchie JC, Van Meir EG. Proteomics of gliomas: initial biomarker

discovery and evolution of technology. Neuro-oncology. 2011 Sep;13(9):926-42. PubMed

PMID: 21852429. Pubmed Central PMCID: 3158015.

27. Collet B, Guitton N, Saikali S, Avril T, Pineau C, Hamlat A, et al. Differential analysis

of glioblastoma multiforme proteome by a 2D-DIGE approach. Proteome science.

2011;9(1):16. PubMed PMID: 21470419. Pubmed Central PMCID: 3083325.

28. Niclou SP, Fack F, Rajcevic U. Glioma proteomics: status and perspectives. Journal of

proteomics. 2010 Sep 10;73(10):1823-38. PubMed PMID: 20332038.

29. Thaker NG, Zhang F, McDonald PR, Shun TY, Lewen MD, Pollack IF, et al.

Identification of survival genes in human glioblastoma cells by small interfering RNA

screening. Molecular pharmacology. 2009 Dec;76(6):1246-55. PubMed PMID: 19783622.

Pubmed Central PMCID: 2784725.

30. Hill JJ, Moreno MJ, Lam JC, Haqqani AS, Kelly JF. Identification of secreted proteins

regulated by cAMP in glioblastoma cells using glycopeptide capture and label-free

quantification. Proteomics. 2009 Feb;9(3):535-49. PubMed PMID: 19137551.

31. Furuta M, Weil RJ, Vortmeyer AO, Huang S, Lei J, Huang TN, et al. Protein patterns

and proteins that identify subtypes of glioblastoma multiforme. Oncogene. 2004 Sep

2;23(40):6806-14. PubMed PMID: 15286718.

SYNOPSIS

14

Publications in Refereed Journal:

a. Published: Jacinth Rajendra, Keshava K. Datta, Sheikh Burhan Ud Din Farooqee, Rahul

Thorat, Kiran Kumar, Nilesh Gardi, Ekjot Kaur, Jyothi Nair, Sameer Salunkhe, Ketaki Patkar,

Sanket Desai, Jayant Sastri Goda, Aliasgar Moiyadi, Amit Dutt, Prasanna Venkataraman,

Harsha Gowda, Shilpee Dutt. Enhanced proteasomal activity is essential for long term

survival and recurrence of innately radiation resistant residual glioblastoma cells.

Oncotarget Accepted : 26 April 2018

b. Accepted: N/A

c. Communicated: N/A

Other Publications:

• Kaur E1, Rajendra J1, Jadhav S1, Shridhar E1, Goda JS1, Moiyadi A1, Dutt

S2.Radiation-induced homotypic cell fusions of innately resistant glioblastoma

cells mediate their sustained survival and recurrence. Carcinogenesis. 2015

Jun;36(6):685-95

• Ekjot Kaur1, Aditi Sahu2, Arti R. Hole2, Jacinth Rajendra1, Rohan Chaubal3, Nilesh

Gardi3,Amit Dutt3, Aliasgar Moiyadi4, C. Murali Krishna2 & Shilpee Dutt1 Unique

spectral markers discern recurrent Glioblastoma cells from heterogeneous parent

population Scientific Reports | 6:26538 | DOI: 10.1038/srep26538

a. Book/Book Chapter : N/A

b. Conference/Symposium

Oral Presentation at Indian Association Of Cancer Research ( IACR ) – April 2016

held in New Delhi , India on April 2016 for the abstract entitled: Differential

proteomic analysis reveals role of a novel serine threonine kinase DCLK3 and 14-3-3

zeta in innately radiation resistant and relapse cells of Glioblastoma.

Oral Presentation at ISNOCON 2018 held at AIIMS, New Delhi from 5th April to

8th April 2018 for the abstract entitled : Enhanced proteasomal activity is essential for

long term survival and recurrence of innately radiation resistant residual glioblastoma

cells

Poster Presentation at International Proteomics Symposium Conference held at

IIT Bombay on December 2015 for the abstract entitled : Differential Proteome

reveals major role of metabolic pathways in conferring radioresistance to recurrent

Glioblastoma.

Poster Presentation at Tata Memorial Centre 75th Platinum Jubilee Celebrations

held in Mumbai on February 2016 for the abstract entitled as : Differential proteomic

analysis reveals role of a novel serine threonine kinase DCLK3 and 14-3-3 zeta in

innately radiation resistant and relapse cells of Glioblastoma.

Poster Presentation at International Conference on Enzymology held at ACTREC,

TMC , Mumbai on January 2017 for the abstract entitled : Identification of a novel

serine threonine kinase DCLK3 and immunoproteasome subunit PA28α: Potential

therapeutic targets for innately radiation resistant glioblastoma cells

SYNOPSIS

15

16

1 Introduction and Review of literature

INTRODUCTION AND REVIEW OF LITERATURE

17

This chapter introduces the clinical aspects of the most lethal form of brain tumor –

Glioblastoma along with the challenges involved in treating this disease. This chapter also

discusses the molecular characteristics of glioblastoma reported till date to understand therapy

resistance of this tumor.

1.1 Glioblastoma

Glioblastoma is a highly aggressive diffuse glioma of astrocytic lineage. It is termed as Grade

IV Glioma according to WHO classification. It accounts for about 3.5% of all the malignant

tumors, 16 % of all malignant primary brain tumors and 50-60% of all gliomas (33-36). The

average age-adjusted incidence rate of this tumor is 3.2 per 100,000 population (37, 38).

X-axis, age groups; Y-axis, incidence rates. Rates are per 100,000 and age-adjusted to the 2000 US standard

population. NPCR, CDC’s National Program of Cancer Registries; SEER, NCI’s Surveillance, Epidemiology,

and End Results program. (36)

Figure 1 illustrates the incidence rates for glioblastoma as per age and gender. Primary

glioblastoma is most prevalent in older patients with a median age of 64 at diagnosis and its

incidence increases in patients of age group 75 – 84 years. The incidence is 1.6 times higher in

Figure 1 Age-adjusted and age-specific incidence rates for glioblastoma at diagnosis and gender,

CBTRUS statistical report: NPCR and SEER, 2006–2010.

INTRODUCTION AND REVIEW OF LITERATURE

18

males compared to females and 2.0 times higher in Caucasians compared to Africans and Afro-

Americans, with lower incidence in Asians and American Indians (39). In India, the incidence

rates of glioma varies from 5.8% in Mumbai, 6.7% in Bangalore, 3.5% in Chennai, 5.6% in

Dibrugarh, and 28.2% in Trivandrum among males and 6.3% in Mumbai, 5.6% in Bangalore,

7.5% in Chennai, 0% in Dibrugarh, and 21.8% in Trivandrum among females as per the by

Indian Council for Medical Research 2009 report. The demographic data from Tata Memorial

Hospital based on 1-year prospective study conducted on 656 patients also revealed increased

proportion of high-grade gliomas 151 cases (59.5%) amongst the total CNS tumors registered

(39, 40).

It is a case of high-grade astrocytic neoplasm characterized by the presence of either

microvascular proliferation and/or tumor necrosis. A highly invasive tumor which infiltrates to

the normal surrounding brain parenchyma but remains confined to the central nervous system

(41). It can arise in any lobe of the brain and even the brain stem and cerebellum, but more

commonly occur in the frontal and temporal lobes (42). A recent study by Tyler et al,

demonstrated that the localization of glioblastoma in the brain varies according to the molecular

subtype of glioblastoma. The neural and mesenchymal glioblastoma formed tumors farthest in

the cerebrum whereas the classical and proneural type localized in the temporal and frontal

lobe as represented in figure 2 (43).

Axial (row) and sagittal (second row) of statistically significant clusters (p < 0.05) by subtype.

Figure 2 Distribution of glioblastoma in different regions of the brain.

INTRODUCTION AND REVIEW OF LITERATURE

19

However, the etiology of this tumor remains elusive. Radiation exposure is the few known risk

factors associated with glioblastoma (39). Gliomas also develop in patients who have

undergone radiation therapy for any other cancer type (44). Electromagnetic fields,

formaldehyde, and nonionizing radiation from cell phones are still speculated causes of

glioblastoma (45). Patients with hereditary syndromes such as Cowden, Turcot, Li-Fraumeni,

Neurofibromatosis type 1 and type 2, Tuberous Sclerosis, and familial Schwannomatosis have

also been associated with increased risk of glioma. The clinical presentation of patients with

newly diagnosed glioblastoma varies greatly with the tumor size, localization and the

anatomical features of the brain (46, 47). These patients display symptoms of increased

intracranial pressure, including a headache and focal or progressive neurologic deficits,

vomiting, nausea, and seizures.

The regular diagnostic techniques include computed tomography (CT)

or magnetic resonance imaging (MRI) scan. On MRI, the tumor

appears as an irregularly shaped mass with a dense ring of

enhancement and hypointense center of necrosis due to the

enhancement with gadolinium contrast (42). Figure 3 is a T1-weighted

axial gadolinium-enhanced magnetic resonance image demonstrates

an enhancing tumor of the right frontal lobe.

Advanced techniques like diffusion-weighted imaging (DWI), perfusion-weighted imaging

(perfusion MR) and MR spectroscopy have enabled a better understanding of the

pathophysiology of GB tumors and its differentiation from other brain tumor-mimics like

infarction (39).

Figure 3 MRI of the brain Image courtesy of George

Jallo, MD

INTRODUCTION AND REVIEW OF LITERATURE

20

1.2 Standard of care

The standard mode of therapy includes maximal safe surgical resection, followed by concurrent

radiation therapy along with an oral DNA alkylating chemotherapy agent, temozolomide

(TMZ) (Temodar®), and then adjuvant chemotherapy with TMZ (48). Following surgery,

radiation therapy using three-dimensional conformal beam or intensity-modulated RT is now

the standard of care. A total dose of 60Gy is administered as 1.8-2 Gy fractions five days per

week for six weeks. Simultaneously, TMZ is given at a dose of 75 mg/m2 daily for six weeks

until radiation therapy is completed. This is based on the randomized phase 3 study conducted

by Stupp et al that reported the increase in median survival to 15 months vs 12 months with

radiotherapy and temozolomide vs radiotherapy alone, respectively (hazard ratio, 0.63; P <

.001) (2, 3). Post one-month TMZ is restarted at 150 mg/m2 daily for five days for a month

and then the dose is escalated to 200 mg/m2 for five consecutive days per month for the

remainder of therapy. This TMZ cycle is continued till 6-18 months (44, 49). In spite of

undergoing the standard mode of treatment, the tumor recurs in 90% of cases within 6 – 12

months. Apart from conventional therapies, various modifications have been done in the area

of surgical resection and chemotherapy. Complete surgical resection of these tumors is a

challenge due to its infiltration to eloquent areas of the brain such as speech, motor function,

and the senses. To improve the extent of surgical resection, technologies such as image-guided

surgery using 5-ALA, intra-operative MRI, or (diffusion tensor imaging) DTI neuronavigation

are being adopted (50, 51). However, the cost and the need for specialized equipment,

operators, and surgery suites limit the usage of such novel technologies. Bevacizumab or

Avastin, a humanized vascular endothelial growth factor (VEGF) monoclonal antibody

targeting blood vessel formation (VEGF-A target) was a new drug approved in 2009 for

recurrent GBM (52). Although, preliminary results of large randomized trials have

demonstrated improvement in the progression-free survival (PFS) it did not result in increased

INTRODUCTION AND REVIEW OF LITERATURE

21

overall survival (OS) (53). In October 2015 FDA approved the administration of Optune®, the

device delivering tumor-treating fields (TTFields), along with TMZ for adults with newly

diagnosed supratentorial GBM, following surgery and standard-of-care treatment. Optune plus

TMZ demonstrated superior PFS of 7.1 months versus 4 months with TMZ alone, as well as

superior OS of 20.5 months versus 15.6 months with TMZ alone (54). Interstitial brachytherapy

using iodine-125 (I-125) has been employed as an adjuvant treatment for smaller brain tumors

and has indicated an improvement in median survival for few highly selected patients (49).

Despite undergoing multimodal therapy, the median survival of the GB patients is not more

than 12 – 15 months and recurrence is inevitable in >90% cases. Only about 10% of the patients

survive till 5 years post therapy contributed by the high resistant nature of these tumor cells

(7).

1.3 Prognosis

The clinical outcome of GB patients is mostly associated with poor prognosis. Long-term

survivors of glioblastoma with a survival of > 2 yrs. are very rare since medium survival is not

more than 12 – 15 months. The five-year survival rate is not more than 10% for such patients.

Clinical predictors for survival in GB are tumor size, its anatomical location, Karnofsky

Performance Score (KPS), recursive partition analysis (RPA), histopathological and

radiological features namely MIB-1 labeling index, contrast enhancing tumors, amount of

tumor necrosis on preoperative MRI, peritumoral edema and perfusion parameters (55).

Current molecular prognosis markers include IDH1/2 (isocitrate dehydrogenase 1/2) mutations

and MGMT (O6-methylguanine-DNA methyltransferase) promoter methylation which are

associated with good prognosis and better response to temozolomide in GB patients (47).

The molecular classification of GBM into four subgroups: classical, mesenchymal, proneural

and neural by Verhaak et al based on 840 gene signatures have provided deeper insights into

INTRODUCTION AND REVIEW OF LITERATURE

22

the pathogenesis of this tumor (56). These classes differ in their genomic and transcript

alterations along with the clinical outcomes. While the classical subgroup shows amplification

of mutant EGFR variant III and loss of PTEN; the mesenchymal subtype exhibits NF1

mutations, loss of TP53 and CDKN2A and is associated with poor prognosis. Constituting of a

younger group of patients, the proneural subgroup distinctly shows enrichment of IDH1/2,

TP53 mutations in along with amplification of PDGFRA, CDK6, CDK4, and MET and show a

higher survival rate. Lastly, the neural subtype displays molecular signatures similar to that of

neurons but does not show unique distinguishing alterations compared to other subtypes.

Furthermore, Noushmehr et al using ‘The Cancer Genome Atlas’ (TCGA) dataset identified a

distinct subtype of GBM tumors referred to as a glioma CpG island methylator phenotype (G-

CIMP), displaying hyper-methylation at multiple loci (57). These G-CIMP samples had

distinct molecular and clinical features, harboring IDH1 mutation at high frequency. The

molecular profiling of GBM tumors has thus, further strengthened the understanding of its

underlying biology. However, the existing knowledge of the tumour has not successfully been

able to improve the clinical outcome of the patients.

1.4 Recurrence and therapy resistance

Recurrence is one of the key factors for poor prognosis in glioblastoma patients and remains a

challenge in clinics. The relapsed tumors formed are confined to the margins of the primary

site of the tumor in most cases with no invasion to other parts other than the brain (7). This

pattern of recurrence has been attributed to the presence of highly infiltrative neoplastic cells

in the inaccessible regions of the brain and an aberrant vasculature comprised

hyperproliferative, leaky and unorganized blood vessels. Leading to an incomplete surgical

resection of the primary tumor followed by radiation therapy along with chemotherapy, thus

this multimodal therapy has proved to be the only palliative and not curative with recurrence

being unavoidable. The other major reason for recurrence has been accredited to the presence

INTRODUCTION AND REVIEW OF LITERATURE

23

of both intrinsic and acquired resistant tumor cells which give rise to more aggressive recurrent

tumors. Various studies have been carried out and are still being done to unravel the

mechanisms of radio and chemoresistance. Chemo-resistance to the oral alkylating drug,

temozolomide has been associated with the epigenetic silencing of the MGMT gene (O-6-

methylguanine-DNA methyltransferase). It is a DNA repair enzyme that removes alkyl groups

from the O-6 position of guanine. Its inactivation (due to promoter methylation) renders glioma

cells more sensitive to chemotherapy but the tumors possessing unmethylated MGMT gene are

more resistant to chemotherapy. Interestingly, patients harboring unmethylated MGMT

demonstrate long-term survival, thus suggesting the involvement of other contributing factors

in the therapy response. Several other factors are reported to contribute to therapy resistance

such as genetic alterations, signaling pathways, microRNAs, hypoxia, the brain

microenvironment, and glioma stem cells (GSCs). Over-expression of proteins like Epidermal

growth factor receptor/variant VIII (EGFR/EGFRVIII), Platelet Derived Growth Factor

Receptor (PDGFR), Phosphatidylinositide 3-kinase (PI3K), and Signal Transducer and

Activator of Transcription (STAT3), Survivin, BIRC3 and altered metabolic proteins have also

been reported in these resistant GBM cells (58, 59) .

Moreover, tumor suppressor genes such as p53, p21, p16, and PTEN are commonly mutated in

GBMs while cell cycle regulators CDK4 and MDM2 are amplified in approximately 13% of

the tumors, pointing towards an important role these proteins might play in inducing genetic

instability in these cells (60, 61). These genetic alterations are majorly responsible for the

deregulation of signalling pathways involved in GBM like, growth factor tyrosine kinase

receptor (TKR) triggered pathways, the Ras sarcoma (Ras) pathway, phosphatidylinositol 3-

kinase (PI3K)/phosphatase and tensin homolog (PTEN)/AKT, retinoblastoma (RB)/cyclin-

dependent kinase (CDK) N2A-p16INK4a, and the TP53/mouse double minute 2

(MDM2)/MDM 4/CDKN2A-p14ARF pathways as represented in figure 4 (62). Furthermore,

INTRODUCTION AND REVIEW OF LITERATURE

24

there are various signaling pathways such as the Notch, Wnt/β catenin and Hedgehog pathway

that are known to promote resistance by aiding the highly tumorigenic cancer-initiating or

glioma stem cells (GSC) to survive and repopulate the entire tumor post-therapy (63-66).

Additionally, the ATM/Chk2/p53 pathway endorses glioma radioresistance by activating the

DNA damage repair pathway and inducing cell cycle arrest (67, 68).

1.5 Proteomics and Cancer

Cancer is an evolving disease driven by many complex biological processes. Although there

has been an enormous development in the treatment strategies against this deadly disease, yet

this disease remains to be completely surmounted. Its unconquered ability to ace over every

therapeutic intervention is one of the major reasons for cancer recurrence and therapy resistance

today. This disease is not just a consequence of genomic instability but also an amalgamation

of deregulated cellular responses as a result of altered protein function. Thus, a comprehensive

Figure 4 Common alterations involved in glioblastoma. Image adopted from (1)

INTRODUCTION AND REVIEW OF LITERATURE

25

understanding of the biological processes governing cancer progression requires an extensive

knowledge of proteins, which are the ultimate effector molecules of cellular functions (69, 70).

Proteomics, according to Kiernan is defined as “the use of quantitative protein-level

measurements of gene expression to characterize biological processes (e.g., Disease processes

and drug effects) and decipher the mechanisms of gene expression control ”(71). The field of

proteomics is broadly categorized into three main areas: (1) protein micro-characterization for

large-scale identification of proteins and their post-translational modifications; (2) ‘differential

display’ proteomics for comparison of protein levels with potential application in a wide range

of diseases; and (3) studies of protein-protein interactions using techniques such as mass

spectrometry or the yeast two-hybrid system. Since proteomics focuses on the gene products,

which are the active agents in cells, it directly contributes to drug development as almost all

drugs are directed against proteins. In cancer, proteomics has empowered scientists to monitor

alterations in the protein expression both qualitatively and quantitatively. The ability to decode

protein signatures in cancer using proteomics is valuable for more effective diagnosis,

prognosis, and response to therapy (26, 72) .

1.6 Mass spectrometry-based quantitative proteomics in cancer

In order to decode protein signatures involved in an oncogenic transformation of a normal cell,

it is essential to decipher the change in the protein repertoire as the cell transforms.

Hence, a comprehensive tool such as quantitative proteomics enables us to gain insights into

the differential proteome of a cancerous cell compared to a non- transformed cell (73, 74). Over

Figure 5 Schematic representation of proteomic analysis using mass spectrometry (4)

INTRODUCTION AND REVIEW OF LITERATURE

26

the last two decades, mass spectrometry (MS)-based methods have become essential tools to

understand the molecular mechanism of a diseased condition. MS-based proteomics is

categorized as top-down proteomics and bottom-up proteomics. Top-down proteomics

includes measurement of an intact protein. Bottom-down proteomics involves measuring the

peptides as the substitutes for the protein of interest (figure 5). In bottom-up proteomics, the

protein extract is digested into short peptides using trypsin and separated by liquid

chromatography, either directly or after biochemical fractionation. The eluted peptides from

the chromatography column are subjected to electrospray ionization and are directly sprayed

into the mass spectrometer. There are two levels of MS measurement which occurs in tandem.

First, a mass analyzer measures the mass-to-charge ratio (m/z) of peptide molecular ions (MS1)

followed by detection of m/z values of fragment ions resulting from the fragmentation of

specific peptide (75, 76).

The peptides present in the sample are identified by the specific fragment ion pattern of each

peptide ion, together with its m/z value. The peptide sequences identified are then mapped to

proteins, and the signal intensities of either peptides or fragment ions are used to estimate

relative changes in abundance across samples.

Quantitative proteomic techniques can be gel based or non- gel based. Gel-based approach

includes Two-Dimensional electrophoresis (2DE) or Difference gel electrophoresis (DIGE)

which uses fluorescence-based labeling of the proteins prior to separation. However, both these

approaches are less reproducible and less sensitive (77). Thus, to combat technical variability

at various stages of sample handling and during measurements, non-gel-based techniques have

been developed for an extensive and accurate quantification of proteins. The notion –gel-based

tools vary according to the time point of the proteomics workflow at which the quantification

strategy is incorporated. Below in figure 6 is an illustrative representation of the different types

of labeled and label-free quantitative proteomic techniques.

INTRODUCTION AND REVIEW OF LITERATURE

27

Figure 6 Different types of quantitative proteomic techniques.

These approaches can be classified as isotope- labeled and label-free MS. Isotope-labeling

methods are categorized by introduction of stable isotope tags to proteins via chemical

reactions using isotope-coded affinity tags (ICAT) and isobaric tag for relative and absolute

quantification (iTRAQ), enzymatic labeling, for example using 18O water for trypsin digestion,

or via metabolic labeling (stable isotope labeling of amino acids in cell culture – SILAC).

1.7 Isobaric tagged relative and absolute quantification (iTRAQ)

This quantitative proteomic technique first developed by Ross et al is based on the

derivatization of primary amino groups in intact proteins using the isobaric tag for relative and

absolute quantitation (iTRAQ). The iTRAQ reagents are isobaric labels (figure 7) due to which

differentially labeled proteins do not differ in mass; accordingly, their corresponding

proteolytic peptides appear as single peaks in MS scans (78). The quantitative information is

provided by isotope-encoded reporter ions that can only be observed in MS/MS spectra, which

can be analyzed by the fragmentation behavior of ESI and MALDI ions of peptides generated

from iTRAQ-labelled proteins using a TOF/TOF and/or a QTOF instrument

INTRODUCTION AND REVIEW OF LITERATURE

28

A B

.

(A) 4-plex and (B) 8-plex isobaric Balancer + reporter ions add up to 145 Da in 4-plex and 304 Da in 8-plex

experiments. In 8-plex, reporter mass of 120 is not present as it will give erroneous quantitation since

phenylalanine ammonium ion is also observed at a mass of 120 Da (c) iTRAQ workflow

This technique allows simultaneous labeling and quantitation of four or eight samples

in contrast to ICAT and SILAC. Since multiple samples are combined in one run, the

instrument time for analyses can be reduced, and variations between different LC/MS

runs does not hamper the results. Comparative studies for different isotope labels

including differential gel electrophoresis (DIGE), ICAT, and iTRAQ showed that

iTRAQ is more sensitive than ICAT (79).

1.8 Differential proteomic studies in glioblastoma

More than 100 papers appear in PubMed where researchers have used proteomic tools to

identify proteins involved in different aspect of glioblastoma. However, most of these

proteomic studies are to identify differential protein patterns among different cell lines or

between cell lines and patient samples. Initial studies performed in glioblastoma employed

two-dimensional gel electrophoresis (2D GE) approach to identify the proteins specifically or

Figure 7 Chemical structures for iTRAQ

INTRODUCTION AND REVIEW OF LITERATURE

29

differentially expressed in the high-grade gliomas. Furuta et al in 2004 adopted this technique

to identify the protein differences amongst de novo primary glioblastoma tissues and secondary

glioblastoma tissues. This study was performed in a total of 13 with 6 primary and 7 secondary

glioblastoma tissues. Only 11 uniquely expressed proteins in any one the GBM tissues were

sequenced and identified. These included Tenascin-X precursor, Unnamed protein, Enolase 1,

Centrosome-associated protein 350, Epidermal growth factor receptor, EGFR, ERCC6,

DUOX2, HNRPA3, WNT-11 protein precursor, Cadherin-related tumor suppressor homolog

precursor, ADAMTS-19 (80). In 2005, Vogel et al implemented this technique to report the

differences in protein expression amongst GBM cell lines as compared to primary glioblastoma

tissues (23). Two-dimensional gel electrophoresis (2-DE) and cleavable Isotope-Coded

Affinity Tag (cICAT) was also used by a group (81) to compare the cerebrospinal fluid (CSF)

proteome in order to identify the tumor and grade specific biomarkers in patients suffering

from histologically different grade brain tumors. Although 2D GE aided in the identification

of differential proteins, however, the number of proteins identified and the identification of low

abundant proteins such as receptors and signaling remained a challenge. The incorporation of

isotope coated labels and label-free quantification techniques enabled identification of proteins

which differed in abundance between two or three samples. In 2009, Rajcevic et al applied

iTRAQ based quantitative proteomics technique to reveal increased metabolic activity and

cellular cross-talk in angiogenic compared with invasive glioblastoma phenotype (82).

Multidimensional Protein Identification Technology (MudPIT) was exploited to investigate

resistance of glioblastoma to a naturally occurring terpene with chemotherapeutic properties

known as perillyl alcohol (POH) in A172 cell line (83). Quantitative proteomic Isotope-Coded

Protein Label (ICPL) analysis by Emmanuelle Com et al revealed alteration of several

functional processes in the glioblastoma when they investigated protein expression between

the four regions of GB on clinically relevant biopsies from 5 patients (84). Ravindra Varma

INTRODUCTION AND REVIEW OF LITERATURE

30

Polisetty et al performed iTRAQ analysis on membrane-enriched fractions of GBM tissues and

identified deregulation of calcium signaling and other protein groups of regulatory functions.

Kumar DM et al have identified temozolomide mediated alterations in glioma proteome (17,

85) . In order to identify a plasma-based biomarker in glioma patient, Gautam P et al have

reported the serum proteome from glioblastoma patients (86). Quantitative proteomics has also

been used to identify molecular signatures and develop predictive markers of pseudo-

progression (PsPD) by Zhang et al, 2015. In this study, only three PsPD and three GBM patients

were used for comparison. 530 proteins with significant fold changes were identified which

belonged to the protein synthesis network and the cellular growth and proliferation network

(25). In 2016, Rebecca S. Lescarbeau et al conducted a quantitative phosphoproteomic analysis

on a genetically engineered murine proneural glioblastoma model to quantitate

phosphotyrosine-mediated signaling using mass spectrometry. They interestingly identified

phosphorylation of CDK1 pY15, associated with the G2 arrest as the most differentially

phosphorylated site, with a 14-fold increase in phosphorylation in the tumors. The use of Wee1

kinase inhibitor - the kinase responsible for CDK1 Y15 phosphorylation against these tumors

revealed Wee1 kinase to be a potential therapeutic target in glioblastoma. Quantitative

proteomics is also being employed to study intra-tumor heterogeneity in glioblastoma (87, 88).

The progress in the identification of differential proteins associated with glioblastoma

progression, prognosis, heterogeneity and diagnostic values has been considerably significant

using the advanced proteomic technologies. However, there is also a substantial need to exploit

these technologies to understand the biology of radio-resistance and recurrence in

glioblastoma. In this study, we applied iTRAQ based technology to decipher the differential

proteins governing the survival of residual resistant cells and promoting relapse.

INTRODUCTION AND REVIEW OF LITERATURE

31

1.9 Rationale

There are numerous studies in glioblastoma looking at the differential gene expression in

therapy-resistant glioma cells (5, 16-18). But gene expression not always correlate with the

protein expression and the identification of any therapeutically relevant pathway from these

studies still remains as elusive as before. Proteomics directly addresses the functional effectors

of cellular and disease processes (19, 20). Till date majority of proteomics studies in

glioblastoma have focused on identification of differential proteins amongst different GBM

cell lines, patient samples or within a same tumor to investigate the heterogeneity of

glioblastoma, mechanism of chemoresistance and identification of diagnostic biomarkers (23,

25-32, 81, 88). Our aim was to understand the mechanisms of radiation resistance and

recurrence in GBM. Since proteins are the effector molecules for almost all the cellular

pathways therefore here we want to analyze the proteome of the radio-resistant and relapse

cells. Thus, this study is based on the hypothesis that the glioblastoma radio-resistant

residual cells undergo a change in their protein repertoire which promotes their survival and

leads to relapse. Identification of differential proteins in the radiation resistant residual cells

and relapse cells will provide invaluable insights into the cellular pathways of resistant cells

and will help in the identification of therapeutically relevant drug targets to eliminate resistant

cells.

This study was done using an in vitro radiation resistant model that has previously been

established in our lab (15) from glioblastoma cell lines U87MG and SF268 and primary

cultures of naive patient samples. The residual cells inaccessible from patient biopsies were

obtained from the cellular model of resistance we developed. Radiation resistant cells were

obtained by subjecting the glioma grade IV cells (U87MG, SF268, and two primary patient

samples) to a lethal dose of radiation (at which ~10% population survive) determined using

clonogenic survival assay. It was observed that in all the cell cultures, a small population of

INTRODUCTION AND REVIEW OF LITERATURE

32

cells (~10% or less) that we call “Radiation Resistant (RR)” escape apoptosis and survive.

These surviving cells exhibit a transient non-proliferative, multinucleated and giant cell

phenotype for a period of 1 week or more and then resume their growth similar to their parent

population to form “Relapse population (R)”. This system allowed us to collect parent, RR and

R cells for functional studies. The aim of my thesis project is to understand the molecular

pathways influencing therapy surviving glioblastoma cells using a proteomic approach.

The Specific Objectives are:

4. Characterization of the radiation resistant and the relapse population.

5. Differential proteomic analysis of parent, radiation resistant and relapse population using

quantitative proteomics

33

2 Material and methods

MATERIAL AND METHODS

34

2.1 Cell Culture and Patient samples

GBM grade IV cell lines U87MG and SF268 were obtained from ATCC. Breast cancer cell

lines MCF7 and T47D, colorectal cancer cell line HT29 and lung cancer cell line H1975 were

kind gifts from Dr. Amit Dutt (ACTREC). These cell lines were authenticated in the laboratory

by short tandem repeat profiling based on eight markers in. The cell lines were maintained in

DMEM containing 10% (v/v) FBS, penicillin (200 U/ml), streptomycin (100 μg/ml) and

incubated at 37°C in a humidified incubator with an atmosphere of 50 mL/L CO2.

The project was approved by the institutional review board and informed consent in the

language understood by the patients was also taken prior to tumour collection. Tissue was

collected after surgery from 20 patients with confirmed glioblastoma. Fresh tissue samples

were collected in DMEM containing 400U/ml of pencillin, 200 μg/ml of streptomycin. Single

cell suspension was made using Brain Tumor Dissociation Kit (P) (catalogue number 130-095-

942) as per the kit instructions. The tissues were first washed with PBS to remove blood vessels

and necrotic tissue from the tumour samples and then transferred the tissue into C-tube

containing pre-heated 3890µl of buffer X, 50µl of enzyme N and 20µl of enzyme A. The tissues

were then subjected for mechanical disruption using gentle MACS dissociator program

h_tumor_02, followed by 15 minutes incubation at 37 °C under slow, continuous rotation.

Further, the C tubes containing the samples were run on the gentleMACS Program h_tumor_03

and incubated for 10 minutes at 37 °C under slow, continuous rotation. In the final step, samples

were run on gentleMACS Program m_brain_01 and the pellet was collected after centrifuging

briefly and was seeded in DMEM: F12 media containing 15% (v/v) FBS, 1% of antibiotic

cocktail containing fungizone and incubated at 37°C in a humidified incubator with an

atmosphere of 5% CO2.

MATERIAL AND METHODS

35

2.2 Drug Treatment

20 mg capsule of temozolomide (Temonat from NATCO Company) was dissolved in DMSO

according to manufacturer’s guidelines. Cells were treated with the drug at 25µM concentration

daily for three weeks.

2.3 Radiation treatment

The cells growing in 10% FBS containing media were washed with 1X PBS. The cells were

incubated with 0.05% FBS containing DMEM for 72hrs. After 72hrs, cells were replaced by

10% FBS containing median and were irradiated using 60Co γ-rays at the respective lethal

dose. The fractionated dose of 2Gy was administered for 13 days over a span of two weeks.

2.4 Trypan blue assay

10µl of cell suspension was diluted in 1:1 ratio with 0.4% Trypan Blue solution. Non-viable

cells were blue and viable cells remained unstained. Cells were counted under the microscope

in four 1 x 1 mm squares of one chamber and the average number of cells per square was

determined.

2.5 Clonogenic survival assay

To determine the survival fraction at 2 Gy (SF2) as well as a lethal dose of radiation for all the

cell lines, a clonogenic assay was carried out in a 60mm dish using 1000-3000 cells as per the

plating efficiency of the glioma cultures. The colonies (>35 cells) were fixed with pre-chilled

methanol: acetic acid (3:1), stained with 0.5% crystal violet and counted after 10-15 days of

radiation. SF2 values and the lethal dose was calculated from the radiation-survival curve using

SPSS software version 21®.

MATERIAL AND METHODS

36

2.6 RNA extraction, cDNA synthesis, and qPCR

Total RNA was extracted by TRIZOL Reagent (Invitrogen) according to the manufacturer's

protocol. cDNA was synthesized using the SuperScript III First-Strand kit (Invitrogen) as per

the manual instructions. qPCR was carried out using Roche Light Cycler Master Mix using

Light Cycler 480 real-time PCR system. GAPDH was used as an internal control. Relative

changes of mRNA amounts were calculated using the ΔΔCt method. A list of all primers used

for real-time PCR is provided in Annexure I.

2.7 Protein Extraction

10 million cells of the Parent (P), Radiation Resistant (RR) and Relapse (R) cells were grown under

normal growth conditions. The media was aspirated and the cells were washed thrice with cold 1 X PBS

after which the cells were scraped and pelleted down. The cell pellet was suspended in 150µl of 0.5%

SDS Solution and sonicated with 10 pulses each for 10secs. The sonicated cells were centrifuged at

4000RPM for 15mins at 4ºC and the supernatant was used for the proteomic analysis. The protein

concentration was determined using bicinchoninic acid assay and equal amounts of protein from the 3

conditions were taken for further analysis.

2.8 iTRAQ labeling

Protein extracts from the untreated, radiation resistant and relapse cells were digested with trypsin and

the peptides were labeled with iTRAQ reagents according to the manufacturer’s instructions (iTRAQ

Reagents Multiplex kit; Applied Biosystems/MDS Sciex, Foster City, CA). Briefly, 80 µg of protein

from each sample was reduced, alkylated and digested with sequencing grade trypsin; (Promega,

Madison, WI, USA). Peptides from P, RR and R were labeled with iTRAQ reagents containing 114,

115 and 116 reporter ions, respectively. The three labeled samples were pooled, vacuum-dried and

subjected to fractionation by strong cation exchange (SCX) chromatography.

MATERIAL AND METHODS

37

2.9 SCX FRACTIONATION

The pooled sample after iTRAQ labelling was resuspended in 1 ml of buffer A [10 mM

KH2PO4, 25% (v/v) acetonitrile (ACN), pH 2.9] and separated on a SCX column (Zorbax 300-

SCX, 5 µm, 2.1 mm ID × 50 mm, Agilent Technologies, Santa Clara, CA, USA) at a flow rate

of 700 µl/min with a 40 min gradient [5 min, 0-5% buffer B (buffer A + 350 mM KCl); 5 min,

5-10%; 5 min, 10-23%; 5 min, 23-50%; 10 min, 50-100%; 10 min, 100% B]. One minute

fractions were collected, vacuum-dried and desalted using a C18 cartridge (Pierce, Rockford,

USA) as per the manufacturer’s instructions. After desalting, consecutive fractions were pooled

to obtain a total of thirteen fractions for LC-MS/MS analysis.

2.10 LC-MS/MS analysis

Nanoflow electrospray ionization tandem mass spectrometric analysis of peptide samples was

carried out using LTQ-Orbitrap Velos (Thermo Scientific, Bremen, Germany) interfaced with

Agilent’s 1200 Series nanoflow LC system. The chromatographic capillary columns used were

packed with Magic C18 AQ (particle size 5 μm, pore size 100Å; Michrom Bioresources,

Auburn, CA, USA) reversed phase material in 100% ACN at a pressure of 1000 psi. The

peptide sample from each SCX fraction was enriched using a trap column (75 μm × 2 cm) at a

flow rate of 3 μl/min and separated on an analytical column (75 μm × 10 cm) at a flow rate of

350 ml/min. The peptides were eluted using a linear gradient of 7-30% ACN over 65 min. The

mass spectrometric analysis was carried out in a data dependent manner with full scans

acquired using the Orbitrap mass analyzer at a mass resolution of 60,000 at 400 m/z. For each

MS cycle, twenty most intense precursor ions from a survey scan were selected for MS/MS

and fragmentation detected at a mass resolution of 15,000 at m/z 400. The fragmentation was

carried out using higher-energy collision dissociation (HCD) as the activation method with

40% normalized collision energy. The ions selected for fragmentation were excluded for 30

sec. The automatic gain control for full FT-MS was set to 1 million ions and for FT MS/MS

MATERIAL AND METHODS

38

was set to 0.1 million ions with a maximum time of accumulation of 500 ms, respectively. For

accurate mass measurements, the lock mass option was enabled.

2.11 Protein identification and quantitation

The MS data were analyzed using Proteome Discoverer (Thermo Fisher Scientific, Version

1.4). The workflow consisted of a spectrum selector and a reporter ion quantifier. MS/MS

search was carried out using SEQUEST and MASCOT search algorithms against the NCBI

RefSeq database (release 52 40) containing 31,811 proteins. Search parameters included

trypsin as the enzyme with 1 missed cleavage allowed; oxidation of methionine was set as a

dynamic modification while alkylation at cysteine and iTRAQ modification at N-terminus of

the peptide and lysine were set as static modifications. Precursor and fragment mass tolerance

were set to 20 ppm and 0.1. Da, respectively. False Discovery Rate (FDR) was calculated by

searching the proteomic data against a decoy protein database. Only those Peptide Spectrum

Matches (PSMs) that qualified a 1% FDR threshold were considered for further analysis.

Unique peptide(s) for each protein identified was used to determine relative protein

quantitation based on the relative intensities of reporter ions released during MS/MS

fragmentation of peptides.

2.12 Bioinformatics Analysis

Heat Map representation for the differential genes on the basis of their relative peptide

intensities was constructed using MeV software (v 4.9.0). Unsupervised Hierarchical clustering

of the genes was done using Pearson Correlation method. Functional annotation and Gene

enrichment pathway analysis were done using Cytoscape (v 3.5.1) ClueGo (v 1.8) and CluPedia

(v 1.0) plugin with default parameters. KEGG and REACTOME pathway databases were used

for reference.

MATERIAL AND METHODS

39

2.13 Western Blot analysis

Cells were lysed using EBC lysis buffer (120 mM NaCl, 50 mM Tris-Cl (pH 8.0), 0.5% (v/v)

Nonidet P-40, 50 μg/ml PMSF and protease, phosphatase inhibitor cocktail for 45 minutes on

ice. The supernatant was collected and 40ug of protein was used for immunoblotting using

anti-YBX3 (rabbit; 1:1000; Pierce), anti-PSMB4 (rabbit; 1:1000; Pierce), and anti-PSMD10

(rabbit; 1:1000; Pierce), anti-YWHAZ (rabbit; 1:1000; Pierce), anti-YWHAG (Mouse; 1:6000;

Pierce), anti-YHWAS (rabbit; 1:1000; Pierce), Actin (Sigma; 1:4000 dilutions), was used as a

loading control. Immune-reactive proteins were visualized using an enhanced

chemiluminescence (ECL) reagent (Pierce).

2.14 MTT cytotoxicity assay

5000 cells/well were seeded in 96 well plates for overnight. Bortezomib (Bortenat 2mg; Natco

Company) was added at different concentration i.e. 0.1nM, 1nM, 10nM and 100nM. After

72hrs 10 μL of MTT reagent (5mg/ml in PBS, Himedia TC191-1G) was added to each well

and incubated for 4h. Crystals were dissolved using freshly prepared acidified isopropanol

containing 10% triton X-100. Optical density was measured at 570nM by

(SPECTROstarNANOstar spectrophotometer)

2.15 Luciferase based NFkB promoter activity

To measure NFkB promoter activity, cells were transiently transfected with NFkB‐pGL4-luc2

and pGL4-hrl (5:1 ratio) or NFkB‐pGL4-luc2 with pTRIPZ IkB-α and fold change

(treated/untreated) was calculated as a ratio of firefly luciferase/ renilla luciferase (FL/RL)

activity. The constructs were kind gifts from Dr. Prasanna Venkatraman, ACTREC. FL and

RL activities were measured using Dual luciferase assay system (Promega) and the readings

were recorded in a Berthold luminometer for period of 1 sec. All experiments were done in

triplicate. Values represent mean ± SEM. ***p<0.0005 (t-test, n = 3)

MATERIAL AND METHODS

40

2.16 Proteasome activity assay

0.1 million cells were pelleted, washed twice with 1X PBS and resuspended in ATP buffer

containing 50 mM Tris (pH 7.5), 5 mM MgCl2, 1mMATP, 10% glycerol and protease inhibitor

cocktail (Sigma). Cell suspensions were ultra-sonicated for four cycles of 5 s each (with 1 s

break after each 2 s) at 30 kHz on ice. Proteasome activity was measured using 50µM Suc-

LLVY-7-amino-4-methyl coumarin substrate and fluorescence readings were taken at

excitation 355 nm/emission 460 nm.

2.17 Orthotopic xenograft mouse experiments

All animal experiments were licensed through the Laboratory Animal Facility of ACTREC,

TMC. Protocols were reviewed by the Institutional Animal Ethics Committee (IAEC).

NUDE/SCID mice (6–8 weeks old) bred and maintained in an isolated facility within a specific

pathogen-free environment were used for this study. 1*105 pLenti6-luc2 U87MG cells stably

expressing luciferase were intracranially injected for generating the orthotopic GBM model

and for studying the tumorigenicity of pre-treated Parent and RR cells. 2.5 *105 pLenti6-luc2

U87MG stably expressing luciferase were intracranially injected for studying the effect of

proteasome inhibitor along with radiation. In order to perform an intracranial injection, the

cells were suspended in 5µl 1X PBS prior to injection and kept on ice until injected. Prior to

injecting the cells intracranially, the mice were anesthetized using an injection mix of Ketamine

(120mg/kg)/Xylazine (mg/kg)/Saline and the mice were placed on the stereotaxic for

stereotactic surgery. A 10 mm to 15 mm long incision was made on top of the skull. A small

hole was drilled using a sterile 26-gauge sharp needle at 1 mm posterior to bregma and 2 mm

lateral to coronal suture and 2.5 mm depth. The 5µl cell suspension was then loaded onto the

Hamilton syringe and injected at a rate of 1 μl per minute for a total of 6-8 minutes. The tumors

were allowed to grow and animals were sacrificed using CO2 at the onset of disease symptoms,

such as weight and activity loss, and the brains were removed.

MATERIAL AND METHODS

41

2.18 Radiation and drug treatment of orthotopic GBM mouse model.

The mice were divided into four groups post 7 – 10 days of intracranial injection: Vehicle

control, bortezomib (Bortenat 2mg, NATCO Company), Radiated group, Radiation and BTZ

group. Radiation was delivered to the whole brain of anesthetized mice, immobilized in a

plastic chamber using 60Co γ-rays. A total dose of 14Gy was administered over a period of 7

days. 0.5mg/Kg of bortezomib was administered intraperitoneally twice in a week for 2 weeks.

2.19 Bioluminescence imaging of orthotopic tumor xenografts

Mice were anesthetized with Ketamine/Xylazine and were administered luciferin (D-Luciferin

potassium salt, 150 mg/kg, Calliper Life Sciences) via intraperitoneal injection. The images

were acquired 10-12 minutes post-injection. The time chosen was based on the

pharmacokinetics of luciferin which defines that maximum luminescence emission and greatest

sensitivity of detection will be obtained when cell luminescence is detected after 10-15 mins

of injection of luciferin. The selected imaging time was maintained as constant among all the

animals to be imaged. Regions of interest encompassing the intracranial area of the signal were

defined using Living Image software, and the total photons/s/sr/cm2 (photons per second per

steradian per square cm) was recorded.

2.20 Bacterial purification of GST-tagged 14-3-3 ζ

The plasmid pGEX-4T encoding glutathione S-transferase (GST)-tagged-14-3-3 ζ protein, was

a kind gift from Dr. Sorab Dalal. This plasmid was transformed using BL21 competent cells.

The transformed culture was inoculated in 10 ml Luria broth - ampicillin containing medium

and incubated overnight at 37° C shaking condition. Next day the start culture was inoculated

in 100ml Luria broth - ampicillin containing medium and incubated until an OD600 nm of 0.4–

0.6 was reached. Bacteria were then grown in the presence of 0.1 mM of IPTG for 3 hrs. For

protein purification, bacteria were collected by centrifugation and lysed with 1% Triton X –

100. The lysate was incubated with Glutathione sepharose beads (50% slurry) for 1 hr. in cold.

MATERIAL AND METHODS

42

The beads were spun down and washed thrice with NET-N buffer (20mM Tris-HCl pH 8,

100mM NaCl, EDTA pH 8, 0.5% NP-40). The beads were resuspended in NTE-N buffer at

stored at 4°C.

2.21 GST pull-down assay using GST tagged 14-3-3 ζ as bait

10 – 20 million cells were harvested and lysed using RBC lysis buffer (120 mM NaCl, 50 mM

Tris-Cl (pH 8.0), 0.5% (v/v) Nonidet P-40, 50 μg/ml PMSF and protease, phosphatase inhibitor

cocktail for 45 minutes on ice. The supernatant was collected and 500µg of lysate was

incubated with 30 µl of GST tagged 14-3-3 ζ in the NET buffer for 1 – 2hrs in cold conditions

on a rotator. The supernatant has collected the beads were washed with NET –N buffer 6-7

times. The beads were then boiled for 5 mins in the 2X lamilli buffer and loaded on an SDS

PAGE gel. The gel was silver stained and the proteins bands were in-gel digested for protein

identification by mass spectrometry.

2.22 Statistical methods

All data are represented as means ± standard error means (SEMs). The two-tailed Student’s t-

test was applied for statistical analysis. The Kaplan-Meier curve was plotted to generate the

survival curves and to estimate the median survival values. Differences between survival

curves were compared using a log-rank test.

43

3 Characterization of the radiation

resistant and the relapse population.

CHARACTERIZATION OF THE RADIATION RESISTANT AND RELAPSE POPULATION

44

3.1 Introduction

The tumor is a heterogeneous population with different cells designated to perform diverse

functions for tumor growth and maintenance. During therapy, tumor cells undergo several

kinds of cellular stress and adopt alternative measures to combat the toxic conditions

detrimental for their survival. Cancer stem cells (CSCs), or tumor-initiating cells have largely

been reported to govern therapy resistance and recurrence in various cancers (89-93). Various

studies in glioblastoma and breast cancer report that CSCs possess innate resistance

mechanisms against radiation- and chemotherapy-induced cancer cell death, enabling them to

survive and initiate tumor recurrence (94-98). Several molecular mechanisms have been

proposed to be adopted by CSCs, including amplified checkpoint activation and DNA damage

repair as well as increased Wnt/β-catenin and Notch signaling (64, 99-101).

Another class of cells which are mostly overlooked in cancer studies are multinucleated and

giant cells (MNGCs). MNGCs are one of the commonly present in granulomas that develop

during various inflammatory reactions.

Figure 8 Formation of MNGCs. Image adopted from (1)

CHARACTERIZATION OF THE RADIATION RESISTANT AND RELAPSE POPULATION

45

They are known to originate from the fusion of monocytes or macrophages (figure 8), but the

exact mechanism of their genesis remains unclear (102). In cancer, MNGCs have been

frequently observed in human cancer tissues and cell lines, mostly associated with late stages

of the tumor (103). Failure of cytokinesis and endoreduplication has been shown to contribute

to the formation of MNGCs that eventually generate polyploidy cells. Cell fusion is another

mechanism reported to generate multinucleated cells during development. But in the context

of cancer, such events are rare and have been implicated only in the virally induced

transformation of the normal cells, enhancing the propensity to cause chromosomal instability

and eventually resulting in aneuploidy (104). Some of the studies also report the multinucleated

cells formation as a result of radiation, though these cells so reported eventually underwent cell

death by mitotic catastrophe (105). The pre-existing MNGCs in tumors are thought to be

responsible for increased resistance to therapies, however, the precise functional role of these

cells in cancer is still not known (106). In several studies where the MNGC formation was

observed after radiotherapy were overlooked. In fact, many authors equate multinucleation

with cell death. Although a component of MNGCs that develop after therapeutic exposures is

eliminated through apoptosis or other modes of cell death, compelling evidence reported in the

past decade has demonstrated that the surviving MNGCs can contribute to cancer relapse by

first entering a state of dormancy and ultimately giving rise to progeny with stem cell-like

properties. MNGCs can give rise to tumor-repopulating cells through different mechanisms,

including nuclear budding or burst similar to simple organisms like fungi . The contribution of

MNGCs to cancer recurrence following therapeutic exposures has been well documented for

ovarian, breast and colon cancers. According to Weihua et al, a single MNGC is sufficient to

produce a metastatic tumor comprised mainly of mononuclear cells (107). An extensive study

from our lab also reports the presence of a heterogenous subpopulation of radio-resistant cells

which are innately resistant to the lethal dose of radiation (15). These cells after the exposure

CHARACTERIZATION OF THE RADIATION RESISTANT AND RELAPSE POPULATION

46

to a lethal dose of gamma radiation are arrested at the G2/M phase of the cell cycle to become

non-proliferative and undergo DNA damage repair. They remain in a non-proliferative phase

for a limited time and then resume growth to form the relapse cells. The non-proliferative RR

cells were found to be enriched with MNGCs which remain reversibly senescent without

undergoing apoptosis until they start to divide and form the relapse population. The observation

of reversible senescent phenotype is further confirmed by enhanced expression in SASPs

(Senescent associated secretory proteins) such as GM-CSF, SCF IL-6 and IL-8. Concomitantly,

these MNGC enriched RR cells showed enhanced expression of enhanced expression of anti-

apoptotic genes BIRC3 and Bcl-xL along with higher expression of pAKT – a well-known

protein known to promote survival and resistance in glioblastoma. There is also a significant

increase in the mRNA levels of p21 in the S, G2/M phase arrested resistant population along

with higher levels of Cdk1 phosphorylated at the inhibitory site Tyr15 in the radiation resistant

cells contributing to the arrest at the G2 phase of the cell cycle. pCdk1 (Y15) gets activated by

Wee 1 kinase, a negative regulator of mitosis, therefore we hypothesized that an inhibitor to

this protein would induce RR to undergo premature mitosis (108). Indeed, the RRs treated with

the Wee 1 kinase inhibitor underwent apoptosis by day 5 of the treatment. Figure 9 is an

illustrative representation of our previous findings based on which this present study has been

performed.

CHARACTERIZATION OF THE RADIATION RESISTANT AND RELAPSE POPULATION

47

Figure 9 Schema showing the multi-step in-vitro radiation model recapitulating the progression of GBM

and demonstrating the non-proliferative phase (76)

In this thesis, I wanted to see if the MNGCs were still formed when the glioblastoma cells are given

combination treatment which is given in clinical settings (2Gy fractions over a span of 2 weeks) and

chemotherapeutic drug TMZ at a clinically applied dosage. Further, this phenotype was also explored

in other cancers to determine whether the therapy induced MNGCs formation is GBM specific or

pertains to other cancer types too. Also, since recurrence is an inevitable phenomenon in GBM and is

attributed to the highly infiltrative nature of this tumor type, this study also includes the investigation

of the aggressive nature of the relapse cells in terms of their radiation response and invasion and

migration properties.

CHARACTERIZATION OF THE RADIATION RESISTANT AND RELAPSE POPULATION

48

3.2 Results

3.2.1 Survival response of Relapse cells to a lethal dose of radiation

Initial experiments performed on GBM cell lines SF268 and U87MG in the laboratory showed

that when cells were subjected to a lethal dose of radiation few cells survived & remained in a

non-proliferative phase for a week. After a week this residual resistant (RR) cells start dividing

to form “Relapse cells” which grow in a similar manner to parent cells (figure 10 A&B).

The graph represents the growth kinetics of (A) SF268, U87MG and (B) Two Patient Samples post lethal dose

of radiation

In this study, the relapse cells were subjected to another round of lethal dose of radiation and

the radiation response of the cells were observed to assess their radio-resistant property. It was

observed that the same dose of radiation (8Gy) that could kill more than 90% of the parent

population had less significant effect in terms of cell death on the relapse population. The cell

A

B

Figure 10 Cellular model to capture the inaccessible residual cells.

CHARACTERIZATION OF THE RADIATION RESISTANT AND RELAPSE POPULATION

49

viability decreased to only 80% from initial 100% (as observed at day 10) in U87MG and 50%

in SF268 (as observed on day 8). Suggesting that relapse population had acquired properties of

resistance. The viability of these cells remained unaltered for 7-10 days in U87MG and 4-5

days in SF268. After the transient non-proliferative phase, they resumed growth to form the

second relapse (R2) population, similar to the first relapse (R1) (Figure 11 A&B).

(A) Growth kinetics of U87MG P and R1 cells post radiation. (B) Growth kinetics of SF268 P and R 1 post

radiation, respectively.

To examine their long-term clonogenic potential of relapse (R1 and R2), a clonogenic assay

was performed on the P, R1 & R2 of U87MG and SF268. The D0 (dose at which 37% of cells

survive upon radiation treatment) of the R2 was found to be 6.27 and 6.07 Gy whereas in R1 it

was found to be 6.09 and 5.9 Gy as compared to the parent population of U87MG, SF268,

A

B

SF268 R1

U87MG R1

Figure 11 Radiation response of relapse (R1) cells to second round of lethal dose of radiation

CHARACTERIZATION OF THE RADIATION RESISTANT AND RELAPSE POPULATION

50

respectively which was 5.78 and 5.77 Gy (figure 12 A & B). These data demonstrate an

increase in the D0 dose from Parent to R1 to an R2 population which reflects that every time

glioma cells are exposed to radiation the cells that survive acquire higher resistance than parent

cells.

(A& B) Clonogenic survival curve of Parent (P), 1st Relapse (R1) and 2nd Relapse (R2) in U87MG and SF268,

respectively

3.2.2 Relapse glioblastoma cells demonstrate enhanced malignant properties

Recurrent glioblastoma tumors in clinics are more aggressive and infiltrate to the deeper region

of the brain which makes therapeutic intervention a challenge. Hence, we wanted to assess

B

B

A

A

U 8 7 M G

D o s e (G y )

% C

ell

Su

rv

iva

l

0 2 4 6 8 1 0

0

1 0

2 0

3 0

4 0

5 0

6 0

7 0

8 0

9 0

1 0 0 P ( D 0 = 5 .7 8 )

R 1 (D 0 = 6 .0 5 )

R 2 (D 0 = 6 .2 7 )

S F 2 6 8

D o s e (G y )

% C

ell

Su

rv

iva

l

0 2 4 6 8 1 0

0

1 0

2 0

3 0

4 0

5 0

6 0

7 0

8 0

9 0

1 0 0P ( D 0 = 5 .7 7 )

R 1 (D 0 = 5 .9 )

R 2 (D 0 = 6 .0 7 )

C e ll l in e s

% W

ou

nd

Clo

su

re

U 8 7 M G S F 2 6 8

0

2 0

4 0

6 0

8 0

P a re n t

R e la pse

*

**

P a t ie n t S a m p le s

% W

ou

nd

Clo

su

re

P S 1 P S 2 P S 3

0

2 0

4 0

6 0

8 0

1 0 0

1 2 0

P a re n t

R e la pse

** **

**

Figure 12 Radioresistance of R1 and R2 compared to P

Figure 13 Wound healing assay for parent and relapse cells

CHARACTERIZATION OF THE RADIATION RESISTANT AND RELAPSE POPULATION

51

(A & B) Representative images and graphical representation of wound healing assay in the parent and relapse

cells of cell lines ( U87MG, SF268) and patient samples ( PS1, PS2 & PS3), respectively.

The migrating and invasive properties of the relapse cells formed in our in vitro radio-resistant

model. For this, the relapse cells derived from cell lines (U87MG and SF268) as well as short-

term cultures of 3 patient samples (PS1, PS2, and PS3) were taken. The migration potential

was monitored by wound healing assay and it was found that relapse cells demonstrated a

significant increase in migration in both cell lines and the three patient samples (figure 13 A &

B). Furthermore, the invasive property of relapse cells was assessed by matrigel matrix

invasion assay. The relapse cells of the cell lines demonstrated an increase in their invasion

potential. However, the relapse cells of the patient samples showed similar invasion

potential as compared to the parent (figure 14 A & B). Together, these data show that indeed

the recurrent tumor cells acquire higher resistance and migration potential compared to the

primary tumor.

.

(A & B) Representative images and graphical representation of Matrigel matrix invasion assay in the parent and

relapse cells of cell lines (U87MG, SF268) and patient samples (PS1, PS2 & PS3), respectively.

A

B

P a t ie n t S a m p le s

Nu

mb

er o

f c

ell

s i

nv

ad

ed

P S 1 P S 2 P S 3

0

5 0 0

1 0 0 0

1 5 0 0

2 0 0 0

P a re n t

R e la pse

Figure 14 Boyden chamber assay for comparing the invasion of Relapse cells as compared to Parent

CHARACTERIZATION OF THE RADIATION RESISTANT AND RELAPSE POPULATION

52

3.2.3 Presence of MNGCs post radiation and chemotherapy in glioblastoma

Our previously published study demonstrated the presence of MNGCs after the glioblastoma

cells were exposed to a lethal dose of radiation. However, in clinics, the patients are

administered a total radiation dose of 60 Gy over a span of 4-5 weeks in fractionated doses of

2Gy along with the chemotherapeutic drug temozolomide at 75mg/Kg body weight daily until

the radiation therapy is given. We wanted to examine whether the MNGCs are formed even at

a clinical dosage of radiation and chemotherapy.

For this the U87MG cells were given the following treatment conditions: i) Untreated ii) Daily

dose of fractionated dose of radiation (2Gy) until the less than 10 % cells were remaining. iii)

A daily dose of temozolomide (25 µM – plasma concentration of temozolomide in the body)

as illustrated in figure 15.

This experiment was performed to observe and quantitate the presence of therapy escapers

similar to radiation escapers in presence of temozolomide (TMZ) and fractionated dose of

radiation.

Figure 15 Schematic representation of the experiment to examine the presence of MNGCs in response

to standard therapy

CHARACTERIZATION OF THE RADIATION RESISTANT AND RELAPSE POPULATION

53

It was observed that the radiated cells underwent a drastic reduction in their cell viability after

administration of 26Gy of radiation at day 15 (figure 16 A).

(A) Growth kinetics of U87MG cells treated with a total of 26Gy radiation in 2Gy fractions for 13 days and daily

administration of 25µM TMZ for 2 weeks. (B) Graphical representation of the % of Multinucleated, Giant cells

and mononucleated cells present while the cells were treated. (C) Representative morphological images of

U87MG cells in three different conditions on different days.

These cells remained in a non-proliferative phase for 17 days and resumed their growth to form

relapse population. Similar to our previous results, the % of giant cells and multinucleated cells

was > 50% in the non-proliferative cells until day 35 after which it gradually reduced as the

cells resumed to grow back severely and further reduced to < 20% at day 59 (figure 16 B).

Additionally, the cells that were treated with TMZ also showed a similar response. These cells

C

C

A

A

A

B

B

0 4 8 1 1 1 5 1 8 2 2 2 8 3 2 3 8 4 9 5 9

0 .0 0

0 .0 5

0 .1 0

0 .1 5

0 .2 0

0 .5

1 .0

1 .5

U n tre a ted

2 6 G y IR

2 5 M TM Z

D a y

Nu

mb

er o

f c

ell

s

(*1

0^

6)

1 5 8 1 2 1 5 4 9 5 9 1 5 8 1 2 1 5 4 9 5 9 1 5 8 1 2 1 5 4 9 5 9

0

5 0

1 0 0

1 5 0

M u ltin u c le a te d c e lls G ia n t C e lls

U n tre a te d 2 5 M T M Z 2 6 G y IR

M o n o n u c le a te d

U 8 7 M G

% D

iffe

re

nt

Ce

ll M

orp

ho

log

y

Figure 16 monitoring the presence of MNGCs in response to therapy.

CHARACTERIZATION OF THE RADIATION RESISTANT AND RELAPSE POPULATION

54

also started showing a significant reduction in cell number at day 15 and remained in a non-

proliferative phase for about 20 days until the cells resumed their growth. More than 60% of

non-proliferative cells were enriched with multinucleated and giant cells which diminished as

the cells relapsed (figure 16 A, B & C). Thus, we conclude that MNGCs are formed in response

to radiation and chemotherapy as well when administered in the clinical dosage.

3.2.4 Presence of MNGCs in other cancers.

Since MNGCs proved to be a vital component of the RR cells formed in glioblastoma, we

expanded our study to other cancers. The lethal dose of radiation for 2 breast cancer cell lines

(MCF7, T47D), colorectal cancer (HT29) and lung cancer (H1975) was determined using the

clonogenic survival assay. The lethal dose of radiation was found to be 5.73 Gy, 6.99 Gy, 4.46

Gy and 4.24 Gy for MCF7, T47D, HT29, and H1975, respectively (figure 17 A, B, C, D).

These cell lines were then subjected to their respective lethal dose of radiation and monitored

for cell viability and presence of MNGCs. Interestingly, it was observed that except for H1975,

the other three cell lines exhibited the presence of non-proliferative cells (RR cells) following

A B

C D

MCF7

0 2 4 6 8 100

20

40

60

80

100 LD10 - 5.73Gy

Dose of radiation(Gy)

% S

urv

iva

l

T47D

0 2 4 6 8 100

20

40

60

80

100 LD10 - 6.99Gy

Dose of radiation(Gy)

% S

urv

iva

l

MCF7

0 2 4 6 8 100

20

40

60

80

100 LD10 - 5.73Gy

Dose of radiation(Gy)

% S

urv

iva

l

T47D

0 2 4 6 8 100

20

40

60

80

100 LD10 - 6.99Gy

Dose of radiation(Gy)

% S

urv

iva

l

Figure 17 Clonogenic survival curves of different cancer cell lines.

CHARACTERIZATION OF THE RADIATION RESISTANT AND RELAPSE POPULATION

55

radiation exposure. However, the time interval of the RR cells in the non-proliferative phase

varied. MCF7 RR cells remained in an undivided state for almost 8-10 days, whereas T47D

RR and HT29 RR cells where transiently non-proliferative only for 3-4 days (Figure 18 A, B,

C & D).

Although the time period of the non-proliferative phase varied in these cell lines, in all 3 cases,

the RR cells recommenced their growth to form the relapse cells. The RR cells of all the three

cell lines were found to be enriched with MNGCs. (Figure 19 A, B, & C).

Figure 18 Growth kinetics of cell lines post radiation

T 4 7 D

0 1 3 5 7 1 0

0 .0

0 .1

0 .2

0 .3 R a d ia te d

P a re n t

D a y

Nu

mb

er o

f c

ell

s (*1

0^

6)

M C F 7

0 1 3 6 8 1 0 1 2 1 4 1 6 1 8 2 0 2 2

0 .0

0 .1

0 .2

0 .3 P a re n t

R a d ia te d

D a y

Nu

mb

er o

f c

ell

s (

*1

0^

6)

H T 2 9

0 1 3 5 7 9

0 .0 0

0 .0 5

0 .1 0

0 .1 5

0 .2 0P a re n t

R a d ia te d

D a y

Nu

mb

er o

f c

ell

s (

10

*6

)

H 1 9 7 5

0 2 4 6 8

0 .0 0

0 .0 5

0 .1 0

0 .1 5

0 .2 0P a re n t

R a d ia te d

D a y

Nu

mb

er o

f c

ell

s (

10

*6

)

A B

C D

CHARACTERIZATION OF THE RADIATION RESISTANT AND RELAPSE POPULATION

56

These RR cells also displayed increased expression of survival genes (SURVIVIN, BCLXL,

BIRC3) and SASPs (IL-6, GM-CSF) along with p21 (figure 20).

mRNA expression of survival, SASPs in the RR cells of T47D, MCF7 & HT29 as compared to the parent's cells

SU

RV

IVIN

BC

LX

L

BIR

C 3

IL6

GM

- C

SF

P 2

1

SU

RV

IVIN

BC

LX

L

BIR

C 3

IL6

GM

- C

SF

P 2

1

SU

RV

IVIN

BC

LX

L

BIR

C 3

IL6

GM

- C

SF

P 2

1

0 .0

0 .5

1 .0

1 .5

2 .0

1 0

2 0

3 0

4 0

5 0

Fo

ld C

ha

ng

e

T 47D R R M C F 7 R R H T 29 R R

Figure 19 Morphological changes in response to radiation.

Figure 20 Presence of MNGCs in other cancer.

CHARACTERIZATION OF THE RADIATION RESISTANT AND RELAPSE POPULATION

57

Taken together the data presented in this chapter demonstrate that the relapse cells are more

aggressive in terms of their invasive and migrating properties compared to their parent cells.

However, their survival response to radiation does not change significantly even after repeated

exposure to lethal of radiation. Furthermore, the data shows that the presence of non-

proliferative cells enriched with MNGCs is not a glioma-specific phenomenon or a radiation

specific phenomenon. This phenotype was observed in the presence of clinically relevant dose

of radiation and chemotherapy in GBM cell lines and in other cancers also.

3.3 Discussion

Glioblastoma comprises of > 60% of malignant gliomas due to its highly infiltrative nature and

the ability of the cells to disperse. For this reason, recurrence in glioblastoma is an inevitable

phenomenon owing to its aggressive nature and therapy resistance. The underlying cause for

failure in the treatment of recurrent tumors is the lack of complete understanding of its biology.

Therefore, it is necessary to conduct studies focussed on understanding the molecular

differences between the primary and recurrent tumors. The lack of recurrent tissues available

for biological studies is the foremost limiting factor for the small cohort. However, the scarcity

in recurrent tissues due to inaccessibility of recurrent tumors for surgical resection, low tumor

content and high necrotic tissue and insufficient paired samples of the primary and recurrent

tumor makes it very difficult to understand the progression of glioblastoma from primary to

recurrence. Thus, it is imperative essential to have resistance and recurrent model systems to

be able to get insights into the biology of glioblastoma progression for a better understanding

of glioblastoma progression.

Our in vitro radiation-resistant model empowers us to carry out studies on the relapse cells of

GB cell lines (U87MG, SF268) as well as short-term cultures of patient samples, which are

expanded from a subpopulation of innately radio-resistant cells after their respective parent

CHARACTERIZATION OF THE RADIATION RESISTANT AND RELAPSE POPULATION

58

cells were exposed to a lethal dose of radiation. The relapse cells were found to be

morphologically similar to their respective parent cells although they were formed after a

transient non-proliferative phase of the MNGC enriched RR cells. Upon exposing the relapse

cells to the second round of lethal dose of radiation, it was observed that the relapse cells

showed a similar pattern of response to radiation as in the case of parent cells. Correspondingly,

the R1 cells also exhibited the presence of a subpopulation of cells which survived radiation

and remained in a non-proliferative phase for 5-7 days and resumed growth to form R2. The

clonogenic survival assay revealed a no significant increase in radio-resistance as the cells

progressed from P to R1 to R2. In this study, the aggressive nature of relapse cells was assessed.

We first evaluated the radiation response of relapse cells as compared to parent cells. For which

the relapse cells of U87MG and SF268 were subjected with the second round of lethal dose of

radiation. However, R1 cells showed a significant increase in their migrating and invasive

potential as compared to the P. This data clearly indicates that the radiation therapy on recurrent

tumors is ineffective. This incompetence of radiation therapy on recurrent tumors is due to the

increased invasiveness of these tumors which makes them inaccessible for therapy along with

the obstinate presence of pre-existing innate radio-resistant cells. These findings are consistent

with the reports which have demonstrated radiation-induced invasiveness in glioblastoma. The

results of this study in the relapse population provide a new in vitro platform which can be exploited in

vivo to explore and dive deeper into the biology of innately radio-resistant and relapse cells.

Besides, we also determined whether the presence of MNGCs was the consequence of the sudden shock

of a high dose of radiation or it is therapy induced. We observed that daily administration of radiation

and temozolomide in vitro conditions also showed the presence of therapy resistant cells. The resistant

cells formed after daily administration of TMZ and IR took a longer time to relapse compared to the

radiation resistant cells formed after subjecting to a single round of lethal dose. The increased time span

in the non-proliferative phase could be due to the prolonged exposure of cells to therapy which

augmented cellular stress. Thus, the cells required an extended interval to combat stress and maintain

CHARACTERIZATION OF THE RADIATION RESISTANT AND RELAPSE POPULATION

59

their oncogenic properties to relapse. Additionally, we also show that this phenomenon is not restricted

to glioblastoma. In the study of different cancerous cell lines such as breast cancer (MCF7,

T47D), colorectal cancer (HT29 and lung cancer (H1975) we show that in a heterogeneous

mixture of cancerous cells, there exists a subpopulation of cells (RR cells) which is innately

resistant to a lethal dose of radiation. Except in H1975, which is radio-sensitive and was taken

as a negative control for the study, these RR cells, irrespective of the cancer type, display the

presence of MNGCs which remain non-proliferative for a stipulated period of time and then

resume growth. The time interval between the non-proliferative phase and the percentage of

MNGCs in the RR cells varied amongst the different cell lines. MCF7 (p53 wild-type)

exhibited a lengthier non-proliferative phase than T47D and HT29 which are p53 mutated cell

lines. p53 functions as a transcription factor involved in cell-cycle control, DNA repair,

apoptosis and cellular stress responses. However, besides inducing cell growth arrest and

apoptosis, p53 activation also modulates cellular senescence and organismal aging. The

increased expression of SASPs (IL-6, GM-CSF) indicates that the non-proliferating RR cells

enter senescence post radiation exposure. The different time period of reversible senescent

phase in the RR cells of the three cell types could be attributed to the difference in their p53

status. Thus, the formation of MNGCs is an adaptive nature of cancer cells to overcome therapy

induced stress and we also showed in another studies from our lab that indeed the percentage of giant

cells in the residual resistant population independently correlate with a poor patient survival (109). A

detailed study of the molecular mechanism involved in their genesis would provide deeper insights into

battle therapy resistance in cancer.

60

4 Differential proteomic analysis of

parent, radiation resistant and relapse

population using quantitative

proteomic

DIFFERENTIAL PROTEOMIC ANALYSIS OF PARENT, RADIATION RESISTANT, AND RELAPSE

POPULATION USING QUANTITATIVE PROTEOMIC

61

This chapter includes the description of the differential proteomic analysis using iTRAQ

technology in Parent, RR and R cells of SF268 in at least 3 biologically independent

experiments. The dataset obtained was analyzed for relevant biological functions using two

approaches: a) Pathway-based approach b) Candidate based approach. Thus this chapter is

divided into two sections. The first section describes the identification and validation of the

proteasome pathway as an essential part in the survival of RR cells. The second section is the

identification and functional role of 14-3-3 zeta in glioblastoma and the RR cells of GBM.

4.1 Identification and functional validation of pathways deregulated in RR and R cells

4.1.1 Introduction

Glioblastoma is a heterogeneous tumor comprising of highly neovascular and infiltrating tumor

cells. The complexity of this fatal disease is attributed to the multifaceted biological processes

governing its progression. Despite the multimodal therapy adopted, recurrence is inevitable in

Glioblastoma patients. The irrepressible recurrent tumors are reported to arise from a

subpopulation of residual cells which are otherwise not visible in the MRIs post initial

treatments. These residual cells are reported to be unique entities which are potential targets to

combat therapy resistance. However, targeting residual resistant cells of glioma is challenging

since they are inaccessible from the patient biopsies for biological studies (26)

A paradigm shift in the treatment modality for this tumor type requires a widespread

understanding of the key molecular players and biological processes involved in enabling the

residual cells to resist therapy and initiate relapse. Quantitative proteomics using iTRAQ based

technology empowers us to explore the entire proteome which are the final effectors of a

molecular process that gets altered as the cells transform from normal to cancerous type and

later into an aggressive tumor (78). Isobaric tag for relative and absolute quantitation (iTRAQ)

is an MS-based approach for the relative quantification of proteins, relying on the derivatization

DIFFERENTIAL PROTEOMIC ANALYSIS OF PARENT, RADIATION RESISTANT, AND RELAPSE

POPULATION USING QUANTITATIVE PROTEOMIC

62

of primary amino groups in intact proteins using the isobaric tag for relative and absolute

quantitation. Due to the isobaric mass design of the iTRAQ reagents, differentially labeled

proteins do not differ in mass; accordingly, their corresponding proteolytic peptides appear as

single peaks in MS scans. The isotope-encoded reporter ions that can only be observed in

MS/MS spectra allow for calculating the relative abundance (ratio) of the peptide(s) identified

by this spectrum (78).

Many proteomics studies have been performed to explore different aspects of glioblastoma.

However, the majority of proteomics studies in glioblastoma have focused on identification of

differential proteins amongst different GBM cell lines, patient samples or within a same tumor

to investigate the heterogeneity of glioblastoma, mechanism of chemoresistance and

identification of diagnostic biomarkers (23, 86, 110). But, none of these studies could identify

the survival mechanism of innately resistant cells due to their unavailability. This study

identifies the proteomic signature of residual resistant and the relapse cells of glioblastoma

from captured form the cellular model as described in chapter 1 of this thesis.

.

DIFFERENTIAL PROTEOMIC ANALYSIS OF PARENT, RADIATION RESISTANT, AND RELAPSE

POPULATION USING QUANTITATIVE PROTEOMIC

63

The proteasome is a multimeric proteinase, abundant in all eukaryotic cells and controls

degradation of intracellular proteins in a specific manner. This large 2MDa multisubunit

complex functions by the association of 20S proteasomes to a variety of regulator complexes

like a 19S regulator, PA28ab, PA28g, PA200, EMC29, PI31 as shown in figure 21. As a result,

there are various types of proteasomes such as 26S proteasome (19Sreg - 20Sprot), 30S

proteasome (19Sreg - 20Sprot - 19Sreg), hybrid proteasome (19Sreg - 20Sprot -PA28), PA28-

proteasome (PA28 - 20Sprot - PA28) complexes and others (111).

26S Proteasome is known as the classical proteasome plays a vital role in maintaining cellular

protein homeostasis by degrading many proteins, and regulating many cellular processes. It

controls expression of short-lived cell cycle and cell death regulators and transcription factors,

such as cyclin A, B and E, p21 and p27, p53, cJun, cFos, and nuclear factor κB (NF-κB) (112).

Amongst these, NF-κB is a family of transcription factors that can form different heterodimers

or homodimers with any of these 5 subunits: p50 (NF-κB1, p105), p52 (NF-κB2, p100), p65

(RelA), RelB, and c-Rel. Under normal conditions, NF-κB dimers are present in the cytoplasm

bound to inhibitor-κB (IκB) proteins (113).

Figure 21 Different types of proteasomes

DIFFERENTIAL PROTEOMIC ANALYSIS OF PARENT, RADIATION RESISTANT, AND RELAPSE

POPULATION USING QUANTITATIVE PROTEOMIC

64

The proteasome mediated degradation of phosphorylated form of IκB results in the activation

and translocation of NF-kB to the nucleus where it binds to its target genes and regulates

transcription. The tumor cells are more dependent on proteasomes to get rid of misfolded and

damaged proteins due to their genomic instability and rapid proliferation. Thereby, preventing

cellular stress and apoptosis. Also, there are some reports which show that the overexpression

of proteasomal subunit proteins is involved in elevated levels of proteasome activity. Hence,

proteasomes are well-known targets in cancer therapy. In the context of radio-resistance,

proteasome activity has been found to be reduced in radio resistant cells (114-119).

In this chapter, we show that innately radio-resistant GBM cells harbor increased expression

of proteasomal subunits, enhanced proteasome activity and increased levels of proteasome

substrate p-NFkB and a concordant increase of NFkB target genes. We demonstrate

pharmacological inhibition of proteasomal activity reduces NFkB transcriptional activity and

Figure 22 Nf-kB an indirect target of proteasomes (2)

DIFFERENTIAL PROTEOMIC ANALYSIS OF PARENT, RADIATION RESISTANT, AND RELAPSE

POPULATION USING QUANTITATIVE PROTEOMIC

65

radiosensitizes RR cells. Furthermore, the absence of proteasome activity in RR cells also

significantly decreases their ability to form tumors in vivo.

Together, our proteomics data has delineated proteasomal pathway as one of the plausible

targetable mechanisms that significantly contribute to the survival of innate radiation residual

cells via the NFkB signaling cascade.

4.1.2 Results

4.1.2.1 Recapitulating the clinical scenario using innate radiation resistant (RR) and

Relapse (R) cells from an in vitro radiation resistant model

To capture and understand the survival mechanisms of residual resistant cells of GBM, that are

diagnostically undetectable post-treatment, we generated in vitro radiation resistant model

derived from cell lines and patient samples (21) (Figure 23 A). Using the same protocol, in

this study first the glioblastoma cell lines (SF268 and U87MG) and two short-term primary

cultures of patient samples (PS1 and PS2) were subjected to their respective lethal dose of

radiation (6.5Gy, 8Gy, 6Gy, 6.5Gy) as determined previously using clonogenic assay (21).

Post-treatment initially the cells proliferate, but after 4-5 days post-treatment more than 90%

cells died leaving behind a small population (< 10%) surviving cells. These cells are the

innately radiation resistant residual cells (RR) which remain viable but non-proliferative for

approximately 7-10 days and acquire Multinucleated Giant (MNGCs) phenotype. However,

instead of undergoing mitotic catastrophe, RR cells resume growth to form the relapse (R)

population. Figure 23 B shows graphs for SF268 and PS1 growth pattern of RR cells. The

parent (P), innately radiation resistant (RR) and relapse (R) cells obtained from SF268 were

then subjected to quantitative proteomic analysis. The three populations obtained from

U87MG, PS1, and PS2 were used for validation and functional studies.

DIFFERENTIAL PROTEOMIC ANALYSIS OF PARENT, RADIATION RESISTANT, AND RELAPSE

POPULATION USING QUANTITATIVE PROTEOMIC

66

(A) The illustration depicts the clinical scenario in patient’s pre and post-treatment in which post-surgery there

is a significant regression or complete abolishment of the tumor observed. However, in > 90% cases tumor recurs.

This clinical scenario was recapitulated in an in vitro model. The images represent the SF268 Parent, innate

Radiation Resistant (RR) enriched with multinucleated giant cells (MNGCs) and Relapse (R) population. (B) The

graph represents the growth kinetics of SF268 and Patient Sample post lethal dose of radiation.

4.1.2.2 Quantitative proteomic analysis of radioresistant (RR) and relapse (R) cell

iTRAQ based quantitative proteomic analysis was performed on the parent, RR and R cell

population of SF268. Figure 24 illustrates the proteomics workflow. Equal amounts of protein

from the Parent, RR and R populations was digested with trypsin and their tryptic peptides

were labeled with 114, 115 and 116 isobaric reagents respectively for differential protein

expression analysis. The iTRAQ-labelled peptide samples were pooled, fractionated and

analyzed by LC-MS/MS. The data obtained were searched against National Centre for

P a tie n t S a m p le

0 4 6 8 1 1 1 3 1 5 1 9 2 2 2 5 2 7

0 .0 0

0 .0 5

0 .1 0

0 .1 5

0 .2 0P a re n t

R a d ia te d

R a d ia t io n

R e s is ta n t

R e la p s e

N u m b e r o f d a y s

Nu

mb

er

of

ce

lls

(*1

0^

6)

Figure 23 In vitro radiation resistant model

DIFFERENTIAL PROTEOMIC ANALYSIS OF PARENT, RADIATION RESISTANT, AND RELAPSE

POPULATION USING QUANTITATIVE PROTEOMIC

67

Biotechnology Information RefSeq database (version 52 40) using Protein Discoverer (version

1.4) using MASCOT and SEQUEST.

Compared to parent cells 824 proteins were found to be differentially expressed in RR cells

compared to parent cells out of which 393 proteins were up-regulated (fold change >1.5) and

431 proteins were downregulated (fold change <0.7) while 874 proteins were differentially

expressed in relapse population of which 352 proteins were up-regulated (>1.5) and 522

proteins were downregulated (<0.7). 1,392 proteins were differentially regulated in R vs. RR

out of which 747 proteins were upregulated (>1.5) and 645 were downregulated (<0.7) in the

R population (Figure 25 A). iTRAQ data was validated by analyzing the expression levels of

HRAS, EGFR, YBX3 (Figure 25 B). Relative peptide intensity values of the three proteins

from mass spectrometry showed concurrent expression with the western blot data

(Figure 25 C).

Figure 24 A schematic representation of the proteomics workflow.

DIFFERENTIAL PROTEOMIC ANALYSIS OF PARENT, RADIATION RESISTANT, AND RELAPSE

POPULATION USING QUANTITATIVE PROTEOMIC

68

(A)Graphical representation of the number of differential proteins identified in the RR and R w.r.t P and R w.r.t

RR by the proteomic analysis. Results in each bar graph are the composite data from three independent

experiments performed in triplicate (mean ± SEM). (B) Western blots showing the expression of HRas, EGFR,

YBX3 in Parent (P), Radiation Resistant (RR) and Relapse (R) population of SF268 cell line. β–actin was used as

loading control. (C) Bar plot of the relative peptide intensity values of the mentioned proteins in RR/P and R/P as

determined by iTRAQ.

4.1.2.3 Unsupervised clustering of proteomics data identifies protein clusters uniquely

differential in each population.

Since a cell’s phenotype is an outcome of a collective network of biological processes, it was

hypothesized that proteins showing similar expression pattern will participate in similar

biological processes. Therefore, we first identified the proteins showing co-expression, for

which unique master differential gene list was compiled the at least one of the three binary

comparisons (RR Vs. P, R Vs. P, R Vs. RR) which comprise of 1773 genes. Unsupervised

C

B #

Dif

fere

nti

al

Pro

tein

s

R /R R R R /P R /P

0

2 0 0

4 0 0

6 0 0

8 0 0U p ( > 1 .5 )

D o w n ( < 0 .7 )

6 4 5

7 4 7

3 9 34 3 1

3 5 2

5 2 2

R e p lic a te 1

H R AS E G F R YB X3

0 .0

0 .5

1 .0

1 .5

2 .0

iT R A Q re la t iv e p e p tid e in te n s ity

G e n e N a m e s

Pe

pti

de

in

ten

sit

y

(RR

/P)

A

Figure 25 Proteomic analysis of the parent (P), radiation resistant (RR), relapse(R)

DIFFERENTIAL PROTEOMIC ANALYSIS OF PARENT, RADIATION RESISTANT, AND RELAPSE

POPULATION USING QUANTITATIVE PROTEOMIC

69

clustering was performed for these genes based on their respective relative protein abundance

values as represented in a heat map. The expression pattern of each cluster is illustrated as a

line plot (Figure 26).

Heat map representation of unsupervised hierarchical clustering of the proteins based on their relative peptide

intensities in R w.r.t RR, RR w.r.t P and R w.r.t P. Red- Upregulation > 1.5, Green- Down

Analysis segregated the data set into five clusters (C1-C5) out of which two major clusters,

cluster 2 and cluster 3 represented proteins that were exclusively enriched with uniquely

downregulated and upregulated proteins in the RR population, respectively. Cluster 2

represents 783 proteins and Cluster 3 represents 641 proteins. Clusters 1, 4 and 5 comprised of

proteins that showed a similar expression pattern in RR and R cells. 134 proteins were found

to be downregulated in the RR and R as compared to the parent cells (cluster 1). The expression

of 165 proteins remains at a basal level in the P and RR population however their expression

Figure 26 Unsupervised clustering of differential proteins.

DIFFERENTIAL PROTEOMIC ANALYSIS OF PARENT, RADIATION RESISTANT, AND RELAPSE

POPULATION USING QUANTITATIVE PROTEOMIC

70

declines in the R cells (cluster 4) and 70 proteins show an escalation in expression in the RR

and R as compared to the P cells (cluster 5). Since we were interested to know how the RR

cells survive, we focused on the proteins classified in cluster 2 and cluster 3 which comprised

of proteins uniquely downregulated and upregulated in the RR cells, respectively.

4.1.2.4 Pathway analysis reveals deregulation of proteasome and protein turnover

machinery proteins in RR population and focal adhesion pathway in relapse

population

To analyze the molecular pathway that might be involved in the survival and radiation

resistance mechanisms of RR cell, pathway enrichment analysis of the deregulated proteins in

(A) Pathway analysis of the Genes in cluster 2 and cluster was collapsed into pathways using ClueGo and

CluePedia plugin of Cytoscape with KEGG and REACTOME pathway databases. Each colored circle represents

a pathway enriched with upregulated and downregulated protein in the RR cells but non-differential in the R cells.

E. (B) Venn diagram for the overlap of pathways between cluster 2 and cluster 3

A B

Figure 27 Pathway analysis of the cluster 2 and cluster 3

DIFFERENTIAL PROTEOMIC ANALYSIS OF PARENT, RADIATION RESISTANT, AND RELAPSE

POPULATION USING QUANTITATIVE PROTEOMIC

71

RR population compared to parent population in cluster 2 and cluster 3 was done using KEGG

and REACTOME database (Figure 27 A). In total 42 pathways were deregulated in cluster 2,

33 pathways were deregulated in cluster 3. Interestingly, 11 pathways were commonly

deregulated in both cluster 2 and 3 (Figure 27 B). These pathways included glutathione

metabolism, ribosome biogenesis in eukaryotes, RNA transport, spliceosome, and proteasome,

protein processing in endoplasmic reticulum, regulation of actin cytoskeleton, non-alcoholic

fatty liver disease (NAFLD), Alzheimer’s disease, Huntington’s disease and Epstein - Barr

virus infection. Additionally, gene ontology and enrichment analysis of the entire differential

proteins found in the RR compared to the parent cells revealed 24 pathways enriched with

upregulated (red circle) and downregulated proteins (green circle). Of these, 8 pathways were

enriched with upregulated proteins and 16 pathways were enriched with downregulated

proteins (Figure 28 A). Out of the 8 pathways that were enriched with upregulated proteins, 5

statistically significant (Term p-value < 0.05) pathways included Proteasome (8 proteins),

Ubiquitin mediated proteolysis (10 proteins), Protein processing in Endoplasmic Reticulum

(18 proteins), RNA Transport (17 proteins), oocyte meiosis (9 proteins). However, proteasome

pathway was the most deregulated pathway based on the associated genes filter (k/K ratio) as

shown in figure 28 B.

DIFFERENTIAL PROTEOMIC ANALYSIS OF PARENT, RADIATION RESISTANT, AND RELAPSE

POPULATION USING QUANTITATIVE PROTEOMIC

72

A) Pathway analysis of deregulated genes in Radiation Resistant (RR) vs. Parent (P) Genes deregulated in RR

w.r.t P were collapsed into pathways using ClueGo and CluePedia plugin of Cytoscape with KEGG and

REACTOME pathway databases. The color gradient shows the number of genes of each group associated with

the pathway. Equal proportions of the two clusters are represented in white. (B) KEGG pathways enriched with

upregulated proteins according to their k/K ratio. k – Number of genes identified from the pathway, K – Total

number of genes curated in the KEGG database for a pathway. (C)Pathway analysis of deregulated proteins in

all the biological replicates.

A B

C

Figure 28 Deregulated pathways in the radiation resistant and relapse population

S ig n if ic a n tly e n r ic h e d

p a th w a y s in R R

k /K

0 5 1 0 1 5 2 0 2 5

O o c y te m e io s is

R N A tra n s p o r t

P ro te in p ro c e s s in g in e n d o p la s m ic re tic u lu m

U b iq u itin m e d ia te d p ro te o lys is

P ro te a s o m e

DIFFERENTIAL PROTEOMIC ANALYSIS OF PARENT, RADIATION RESISTANT, AND RELAPSE

POPULATION USING QUANTITATIVE PROTEOMIC

73

Proteomic analysis from three biological replicates also revealed significant deregulation of the

proteasome pathway in the RR population (Figure 28 C). Proteasome subunits differential in

all the four biological replicates has been represented in Table 1. Three subunits PSME1,

PSMA7, and PSMB4 were used for validation by western blot (Figure 29 A, B & C). The data

sets of all the replicates have been deposited to the ProteomeXchangeConsortium (http:

//proteomecentral. proteomexchange.org) via the PRIDE partner repository.

(A) Western blot showing the expression of PSME1, PSMA7 and PSMB4 parent (P), Radiation Resistant (RR)

and Relapse (R) cells of SF268. β-actin was used as loading control. (B) Band intensity plot for the proteins

validated by western blot using IMAGE J software. (C) Shows the relative peptide intensity values of the three

proteins from iTRAQ analysis

4.1.2.5 RR cells display enhanced proteasome activity and survival dependency on

proteasome activity in vitro

Since the RR population exhibited increased protein expression of proteasome subunits, we

sought to observe if the expression correlated with proteasome activity. Therefore, proteasome

activity was analyzed in the parent and RR cells of SF268, U87MG, PS1 and PS2 using

florigenic substrate Suc-LLVY-Amc. Indeed the RR population of SF268, U87MG, PS1, and

PS2 showed 22.18%, 35.60%, 20.63% and 71.63 % increase respectively in the proteasome

activity compared to the parent cells (Figure 30 A). Among the 9 subunits overexpressed in the

RR, 3 subunits are part of the 19S regulatory subunit – PSMC1, PSMD2, PSMD7;3 subunits

Figure 29. Validation of proteomics data

A B

B lo t In te n s ity p lo t

G e n e N a m e s

Inte

ns

ity

Va

lue

s

P S M E 1 P S M A7 P S M B 4

0

1

2

3

4

P S M E 1 P S M A7 P S M B 4

0 .0

0 .5

1 .0

1 .5

2 .0

2 .5

iT R A Q re la t iv e p e p tid e in te n s ity

G e n e N a m e s

Pe

pti

de

in

ten

sit

y

(RR

/P)

C

DIFFERENTIAL PROTEOMIC ANALYSIS OF PARENT, RADIATION RESISTANT, AND RELAPSE

POPULATION USING QUANTITATIVE PROTEOMIC

74

of the 20S core particle – PSMA1, PSMA7, PSMB4 and 1 subunits of the 11S regulatory

subunits – PSME1.

Table 1 List of proteasome subunits differentially expressed in all biological replicates.

Table 2 List of proteasome subunits differentially expressed in all biological replicates.

DIFFERENTIAL PROTEOMIC ANALYSIS OF PARENT, RADIATION RESISTANT, AND RELAPSE

POPULATION USING QUANTITATIVE PROTEOMIC

75

(A)Data represents the chymotrypsin like proteasome activity measured using Succ-LLVY AMC florigenic

substrate in the P and RR population of SF268, U87MG, PS1 and PS2. (B) The graph depicts the RPL19

normalised mRNA levels of classical and Immunoproteasome proteasome beta catalytic subunits respectively in

the RR population of SF268, U87MG, PS1, and PS2 compared to the parent population

Most of the subunits belong to the classical proteasome. Hence the transcript levels of beta

catalytic subunits: PSMB6 (β1- caspase like activity), PSMB7 (β2 – trypsin like activity) and

PSMB5 (β5 – chymotrypsin like activity), were checked. PSMB6 transcript levels were

elevated in the RR population of all the samples, PSMB7 and PSMB5 were elevated in at least

one cell line and one patient sample. Proteomics data also identified a regulatory subunit of

immunoproteasome (PSME1). Therefore, the mRNA levels of its catalytic subunits PSMB9,

PSMB8 and PSMB10 were also determined (Figure 30 B). However, the transcript levels of

A

A

B

F

i

g

u

r

e

3

0

P

r

o

t

e

a

s

o

m

e

a

c

ti

v

it

y

a

n

d

e

x

p

r

e

s

si

o

n

o

f

Figure 30 Proteasome activity and expression of beta catalytic subunits in RR cells.

DIFFERENTIAL PROTEOMIC ANALYSIS OF PARENT, RADIATION RESISTANT, AND RELAPSE

POPULATION USING QUANTITATIVE PROTEOMIC

76

the three subunits were not significantly high in any of the samples. Since the RR population

exhibited increased proteasome activity we wanted to analyze if the survival of RR cells was

dependent on the proteasome activity. For this, we used bortezomib (BTZ), a pharmacological

inhibitor of proteasome routinely used in the treatment of multiple myeloma. First, we

determined the concentration of bortezomib at which proteasome activity was maximally

inhibited with minimal cellular toxicity. For this proteasome activity of SF268 was assessed

after 12 h. treatment of bortezomib at different concentrations (0.01nM to 1000nM). As seen

from figure 31 A & B, 10nM of bortezomib was the minimum concentration at which

significant inhibition of proteasome activity was observed and there was no significant cell

death in RR as compared to the parent.

A & B) Proteasome activity inhibition and % cell viability at different concentrations of proteasome inhibitor –

Bortezomib in SF268. (B) The graph shows the percentage of cells of SF268 and PS1 surviving at different

doses of γ radiation with and without 10nM bortezomib in a clonogenic assay

Once the non-toxic concentration of bortezomib on parent cells was determined, we wanted to

see if the inhibition of proteasome sensitizes the glioma cells to radiation. SF268 and PS1 cells

were treated for 12 hrs. with 10nM bortezomib and their % cell survival was recorded at

different doses of radiation. As shown in figure 32 A, bortezomib treatment significantly

A

F

i

g

u

r

e

3

1

.

D

o

s

e

d

e

t

e

r

m

i

n

a

ti

o

n

o

f

b

o

r

t

B

B

Figure 31 Dose determination of bortezomib in SF268

DIFFERENTIAL PROTEOMIC ANALYSIS OF PARENT, RADIATION RESISTANT, AND RELAPSE

POPULATION USING QUANTITATIVE PROTEOMIC

77

reduced the D0 dose of radiation from 5.07 Gy to 3.12 Gy and 4.4 Gy to 1.08 Gy for SF268

and PS1 respectively, showing that proteasome inhibition radiosensitizes glioma cells.

(A) The graph shows the percentage of cells of SF268 and PS1 surviving at different doses of γ radiation with

and without 10nM bortezomib in a clonogenic assay. (B) The bar graph shows proteasome activity in parent

and RR cells of SF268 and U87 at different concentrations of the bortezomib as mentioned.

We then wanted to analyze the effect of bortezomib on RR population that has higher

proteasome activity. For this, the parent and RR population of SF268 and U87 were treated

with 0.1nM, 1nM and 10nM concentrations of bortezomib for 12 hrs. Following the treatment,

cells were monitored for proteasome activity. Both parent and RR cells showed a gradual

decrease in the activity of proteasomes with increasing concentration of the drug (Figure 32

B). However, 72 hours post drug treatment RR cells were significantly (8% SF268, 10% U87

and 23% PS1) more sensitive to proteasome inhibition compared to the parent population. PS2

A

A

B

F

i

g

u

r

e

3

2

.

E

f

f

e

c

t

o

f

p

r

o

t

e

a

s

o

m

e

i

n

h

i

b

it

i

Figure 32 Effect of proteasome inhibition on proteasome activity in vitro in RR cells

DIFFERENTIAL PROTEOMIC ANALYSIS OF PARENT, RADIATION RESISTANT, AND RELAPSE

POPULATION USING QUANTITATIVE PROTEOMIC

78

showed similar % reduction in viability as compared to the parent population at 10nM (Figure

33 A, B, C & D).

Bar graph represents the percentage of viable cells (at 72hrs) as assessed by MTT assay at different

concentrations of bortezomib in (A) SF268, (B) U87MG, (C) PS1 & (D) PS2. Cells were treated with bortezomib

for 12 hrs. Results in each bar graph are the composite data from three independent experiments performed in

triplicate (mean ± SEM); ***P = 0.001)

We further wanted to determine if the proteasome targets were down-regulated in the RR

population due to degradation via ubiquitin-mediated proteasome pathway. Down-regulated

proteins were analyzed for the presence of annotated ubiquitin binding lysine residues. These

proteins were downloaded from the Uniprot database (120) and parsed using in-house python

scripts to determine the presence of curated ubiquitin binding sites. Of the 431 proteins, 14

proteins were found to harbor lysine residues which can undergo ubiquitin modification (Table

2).

A

A

Table 3 Downregulated proteasome target proteinsFigure 34 Effect of proteasome inhibition on cell

viability of RR cells in vitro.

B

B

C

F

i

g

u

r

e

3

3

E

f

f

e

c

t

o

f

p

r

o

t

e

a

s

o

m

e

i

n

h

i

b

it

i

o

n

o

n

D

D

Figure 33 Effect of proteasome inhibition on cell viability of RR cells in vitro.

DIFFERENTIAL PROTEOMIC ANALYSIS OF PARENT, RADIATION RESISTANT, AND RELAPSE

POPULATION USING QUANTITATIVE PROTEOMIC

79

GeneName Protein Name Relative Peptide

Intensities in RR

Ub Position

Glycyl

lysine

isopeptide

References

APP Amyloid beta A4 protein 0.191 763

HIST1H1B

Histone H1.5 (Histone H1a) (Histone H1b)

(Histone H1s-3) 0.475 17

HIST1H1B

Histone H1.5 (Histone H1a) (Histone H1b)

(Histone H1s-3) 0.475 219

HIST1H4A Histone H4 0.477 13

HIST1H4A Histone H4 0.477 92

KDM1A

lysine-specific histone demethylase 1A

isoform b

0.478

503

Han X et al, Mol Cell.

2014 Aug

PEF1

peflin 0.508

137

McGourty CA et al, Cell.

2016 Oct

PPIA

peptidyl-prolyl cis-trans isomerase A 0.570

28

Visvikis O et al, FEBS J.

2008 Jan

RAC1

ras-related C3 botulinum toxin substrate 1

isoform Rac1

0.581

147

RAN GTP-binding nuclear protein Ran 0.601 71

RBBP7 histone-binding protein RBBP7 isoform 2 0.602 4

RBBP7 histone-binding protein RBBP7 isoform 2 0.605 159

RPL10 60S ribosomal protein L10 isoform a 0.605 188

RPS10

40S ribosomal protein S10 0.619

138

Sundaramoorthy E et al,

Mol Cell. 2017 Feb 16

DIFFERENTIAL PROTEOMIC ANALYSIS OF PARENT, RADIATION RESISTANT, AND RELAPSE

POPULATION USING QUANTITATIVE PROTEOMIC

80

RPS10

40S ribosomal protein S10 0.626

139

Sundaramoorthy E et al,

Mol Cell. 2017 Feb 16

TCEA1

transcription elongation factor A protein 1

isoform 1

0.626

55

TDRKH

tudor and KH domain-containing protein

isoform a

0.672

65

Cunningham et al, Nature

Cell Biology 2015

TDRKH

tudor and KH domain-containing protein

isoform a

0.672

76

Cunningham et al, Nature

Cell Biology 2015

TDRKH

tudor and KH domain-containing protein

isoform a

0.672

110

Cunningham et al, Nature

Cell Biology 2015

TDRKH

tudor and KH domain-containing protein

isoform a

0.672

112

Cunningham et al, Nature

Cell Biology 2015

TDRKH

tudor and KH domain-containing protein

isoform a

0.672

152

Cunningham et al, Nature

Cell Biology 2015

TDRKH

tudor and KH domain-containing protein

isoform a

0.672

175

Cunningham et al, Nature

Cell Biology 2015

TDRKH tudor and KH domain-containing protein

isoform a

0.672 181 Cunningham et al, Nature

Cell Biology 2015

TDRKH

tudor and KH domain-containing protein

isoform a

0.672

187

Cunningham et al, Nature

Cell Biology 2015

TDRKH

tudor and KH domain-containing protein

isoform a

0.672

193

Cunningham et al, Nature

Cell Biology 2015

TDRKH

tudor and KH domain-containing protein

isoform a

0.672

256

Cunningham et al, Nature

Cell Biology 2015

TDRKH

tudor and KH domain-containing protein

isoform a

0.672

267

Cunningham et al, Nature

Cell Biology 2015

TDRKH

tudor and KH domain-containing protein

isoform a

0.672

479

Cunningham et al, Nature

Cell Biology 2015

DIFFERENTIAL PROTEOMIC ANALYSIS OF PARENT, RADIATION RESISTANT, AND RELAPSE

POPULATION USING QUANTITATIVE PROTEOMIC

81

TDRKH

tudor and KH domain-containing protein

isoform a

0.672

510

Cunningham et al, Nature

Cell Biology 2015

TDRKH tudor and KH domain-containing protein

isoform a

0.672 529 Cunningham et al, Nature

Cell Biology 2015

UBE2T

ubiquitin-conjugating enzyme E2 T 0.685

91

Alpi AF1 et al, Mol Cell.

2008 Dec 26

UBE2T

ubiquitin-conjugating enzyme E2 T 0.685

182

Alpi AF1 et al, Mol Cell.

2008 Dec 26

List of downregulated proteins with ubiquitin binding lysine residues.

4.1.2.6 Proteasomes indirectly regulate RR cell survival via the NF-kB activation

One of the well-known substrates of the 26S proteasome is IκB-α which upon degradation leads

to the activation of the transcription factor NF-kB. An increased proteasome activity should

modulate the levels of activated NFkB in the RR population. Therefore, we checked for the

levels of activated NFkB by western blot in the P and RR cells of cell lines and patient samples.

Indeed, the RR cells displayed increased levels of activated NFkB in both the cell lines and

PS1 (Figure 34 A & B).

(A) Cell line: SF268 and U87MG (B) Patient samples: PS1 and PS2 Total (T) total- p65 levels were used as

loading controls

A

F

i

g

u

r

e

3

5

W

e

s

t

e

r

n

b

l

o

t

B

Figure 36

Figure 37 Heat map representation of gene expression values of NFkB target genes.Figure 38 Western blot for protein expression of activated NfκB (phosphorylated p65) in the P (Parent) and

RR (Radiation resistant) cells

Table 2 Downregulated proteasome target proteins

Table 4 Downregulated proteasome target proteins

Figure 34 Western blot for protein expression of activated NfκB (phosphorylated p65) in the P (Parent) and

RR (Radiation resistant) cells

DIFFERENTIAL PROTEOMIC ANALYSIS OF PARENT, RADIATION RESISTANT, AND RELAPSE

POPULATION USING QUANTITATIVE PROTEOMIC

82

Furthermore, the transcript levels of 9 NFkB target genes (TNF-α, IL6, IkB-a, IFN-γ, ICAM1,

COX2, NOD4, p16, SOD2) were screened in RR cells of the cell lines and patient sample by

real-time PCR. A heat map representation of the 9 genes depicts upregulation of at least 6

genes out of the 9 in SF268, U87, and PS1 which also harbor increased expression of phospho-

NFkB suggesting the presence of a transcriptionally active NFkB in RR cells (Figure 35).

The mRNA levels were assessed by qPCR in the RR population of SF268, U87, PS1, and PS2 compared to the

parent population. GAPDH was used as internal control. Results are the composite data from three independent

experiments performed in triplicate (mean ± SEM); *P = 0.05, **P = 0.01 and ***P = 0.001

To directly assess the NFkB transcriptional activity in the RR cells of U87, we monitored the

relative promoter activity of the luciferase-based NFkB reporter constructs in the P and RR

cells. The RR cells showed a significant increase (20 fold) in NFkB transcriptional activity as

compared to the parent population (P). Importantly, administration of the proteasome inhibitor

(Bortezomib) in the P and RR cells diminished this activity by 1.5 and 3.0 fold demonstrating

the dependency of NFkB activity on the proteasome activity. A synergistic inhibitory effect

was observed in the presence of IkB-alpha construct and bortezomib in the P and RR cells.

However, the RR cells displayed a much higher reduction as compared to the P cells (Figure

36)

Figure 35 Heat map representation of gene expression values of NFkB target genes.

DIFFERENTIAL PROTEOMIC ANALYSIS OF PARENT, RADIATION RESISTANT, AND RELAPSE

POPULATION USING QUANTITATIVE PROTEOMIC

83

The NFkB firefly luciferase construct was transfected into (P) Parent and (RR) radioresistant cells then treated

with bortezomib as indicated. As a control Con, A control plasmid was transfected with Renilla luciferase

construct. The pTRIPZ IkB-alpha construct was used as NFkB suppressor. Luciferase values subsequent to

normalization were plotted

4.1.2.7 Inhibition of Proteasome activity inhibits tumor formation and in vivo

We have shown that radiation resistant residual (RR) cells formed in our in vitro radiation

resistant model systems retain their tumorigenic potential and re-grow to give rise to the

recurrent tumor. We first wanted to analyze if the RR cells are capable of forming a tumour in

vivo as well. For this pLenti6-luc2 U87MG cells (121) stably expressing luciferase were treated

with the lethal dose of radiation 8Gy and RR cells were collected. The parent and RR cells

were then stereotactically injected in the brain of 6-8 weeks old NOD/SCID mice. Tumor

growth was monitored using bioluminescence imaging. As seen from figure 36 A & B RR cells

were able to give rise to tumors and had greater tumorigenic potential as compared to the parent

cells.

Figure 36 Luciferase based reporter assay for the transcriptional activity of NFkB

Figure 39 Tumorigenic potential of RR cells compared to P Figure 40 Luciferase

based reporter assay for the transcriptional activity of NFkB

Re

lati

ve

pro

mo

ter

ac

tiv

ity

(FL

/RL

)

P R R P R R P R R

0

2

4

6

8

1 0

1 5

2 0

2 5

3 0 -B o r te z o m ib + B o rte z o m ib

C o n tro l N F kBN F k B +

Ik B -

N F k B tra n s c r ip tio n a l a c tiv ity

******

***

***

***

DIFFERENTIAL PROTEOMIC ANALYSIS OF PARENT, RADIATION RESISTANT, AND RELAPSE

POPULATION USING QUANTITATIVE PROTEOMIC

84

A B

(A) Representative bioluminescence images after orthotopic injection of U87MG-Luciferase labeled Parent (P)

and Radiation Resistant (RR) cells. (B) The graph represents bioluminescence intensity plotted as total flux at

different days post-injection.

We then evaluated the effect of proteasome inhibition on the tumorigenicity of the parent and

RR cells. Since U87MG cells showed higher proteasome activity than the SF268 (Figure 30

A), hence they also required a higher concentration of bortezomib (50nM) for reducing the

viability of their RR. Therefore for in vivo studies U87MG parent and RR cells were treated

with 50nM bortezomib for 12hrs prior to injection. Tumor formation was monitored by

bioluminescence. As expected at day 14 post-injection parent and RR cells treated with vehicle

control or bortezomib showed almost similar growth, however, by day 33 while the parent cells

treated with bortezomib had formed large tumors, the RR cells treated with bortezomib showed

significantly reduced bioluminescence intensity (Figure 37 A). Presence of tumor cells was

seen with Haematoxylin and Eosin staining in the brain slices of all the treatment groups of

mice except for the brain tissue of mice treated injected with RR cells + bortezomib (Figure 37

B)

Figure 37 Tumorigenic potential of RR cells compared to P

Figure 41 Tumorigenic potential of RR cells compared to P

DIFFERENTIAL PROTEOMIC ANALYSIS OF PARENT, RADIATION RESISTANT, AND RELAPSE

POPULATION USING QUANTITATIVE PROTEOMIC

85

(A) Bioluminescent images after orthotopic injection of U87MG-Luciferase labeled Parent (P) and Radiation

Resistant (RR) cells treated with Vehicle Control (VC) and bortezomib. (B) Hematoxylin and eosin (H&E) staining

of mice brain slices. Brain slices of the brain tissue from mice injected with Parent Vehicle control, RR Vehicle

Control, Parent + Bortezomib, RR + Bortezomib cells were formalin fixed and paraffin embedded. Sections

stained with H&E show regions infiltrated with tumor cells. All photomicrographs are shown with the same

magnification. Bar = 100 μm. (C) The graph represents bioluminescence intensity at different days post injection

of mice injected with P and RR cells pre-treated with bortezomib as compared to P and RR cells treated with

vehicle control. ‘n’ represents a number of mice per group. (D) Kaplan Meier Curve for the overall survival of

the mice in the pretreated study.

As represented in figure 37C, the mice injected with bortezomib treated RR cells showed a

significant decline in bioluminescence as compared to the group injected with bortezomib

treated P cells. Also, the overall survival of this group (RR-BTZ) was significantly higher than

A

A

B

B

C

F

i

g

u

r

e

4

2

T

u

m

o

ri

g

e

n

i

c

p

o

t

e

n

ti

a

Figure 38 Tumorigenic potential of BTZ pretreated P and RR cells

Figure 43 Tumorigenic potential of BTZ pretreated P and RR cells

C

C

D

]

D

]

D a y s

To

ta

l F

lux

(p

/se

c/c

m2

/sr)

0 1 0 2 0 3 0 4 0

1 0 4

1 0 5

1 0 6

1 0 7

1 0 8

P V C (n = 8 )

R R V C (n = 9 )

P + B T Z (n = 7 )

R R + B T Z (n = 9 )

P = 0 .0 0 6 5

O v e r a ll S u r v iv a l

D a y s

Pe

rc

en

t s

urv

iva

l

0 2 0 4 0 6 0 8 0

0

5 0

1 0 0 P -V C (n = 8 )

P -B T Z (n = 7 )

R R -V C (n = 9 )

R R -B T Z (n = 9 )

P = 0 .0 0 3

DIFFERENTIAL PROTEOMIC ANALYSIS OF PARENT, RADIATION RESISTANT, AND RELAPSE

POPULATION USING QUANTITATIVE PROTEOMIC

86

that of the other three groups as shown in figure 4.16 D. Median survival of each group are as

follows : P- VC – 36 days, P – BTZ – 38 days, RR – VC – 30 days, RR – BTZ – 58 days.

Further, we did an intracranial injection of parental cells followed by radio therapy

(fractionated dose of 14Gy) followed by intraperitoneal injection of bortezomib (0.5mg/Kg

twice in a week for two weeks) as depicted in figure 39.

Figure 39 Schematic representation for studying the effect of intraperitoneal injections of bortezomib

along with radiation treatment of mice intracranially injected with parent GBM cells.

IR – Radiation; BTZ – Bortezomib

Representative bioluminescence images from each group are shown in figure 40 A. The results

show a significant reduction in bioluminescence of animals treated with radiation along with

BTZ as compared to the radiation alone group (Figure 40 B). The disease-free survival of mice

was significantly higher in the group treated with radiation and BTZ as compared to the

radiated alone group (Figure 40 C).

DIFFERENTIAL PROTEOMIC ANALYSIS OF PARENT, RADIATION RESISTANT, AND RELAPSE

POPULATION USING QUANTITATIVE PROTEOMIC

87

(A) Representative bioluminescence images of tumor formation in the mice treated with IR and BTZ compared to

the mice which were administered with Vehicle Control (VC), only BTZ and only IR.(B)Graphical representation

of bioluminescence intensity recorded for mice treated with IR and BTZ compared to the mice which were

administered only saline as Vehicle Control (VC), only BTZ, only IR (C) Kaplein Meier Curve for % tumor-free

animals in the radiation and intraperitoneally administered BTZ study.

4.1.3 Discussion

Radioresistance and recurrence is currently an inevitable consequence in the field of

glioblastoma. Until now, the mechanisms of radioresistance in glioblastoma have been

explored in vitro and in vivo settings either immediately post radiation or after generation of

repeated doses of radiation (acquired resistance) but not in the residual radiation-resistant cells.

However, in this study, we focused on the processes deregulated in the innately radiation

resistant residual (RR) population as we have previously shown that these are the cells

responsible for relapse in glioblastoma (9). We performed iTRAQ based quantitative proteomic

A

]

A

]

B

]

B

]

C

F

i

g

u

r

e

4

4

E

f

f

e

c

t

o

f

p

r

o

t

e

a

s

o

m

e

i

n

h

i

b

it

i

o

n

o

n

t

D a y s

To

tal

Flu

x (

p/s

/ c

m2

/sr)

0 1 0 2 0 3 0

1 0 4

1 0 5

1 0 6

1 0 7

1 0 8

V C (n = 7 )

B T Z (n = 8 )

IR (n = 1 0 )

IR + B T Z (n = 1 0 )

P = 0 .0 0 3

D a y s

% D

ise

as

e f

re

e s

urv

iva

l

0 1 0 2 0 3 0

0

5 0

1 0 0IR (n = 1 0 )

IR + B T Z (n = 1 0 )

P = 0 .0 5 4

Figure 40 Effect of proteasome inhibition on the tumorigenic potential of the cells in vivo

DIFFERENTIAL PROTEOMIC ANALYSIS OF PARENT, RADIATION RESISTANT, AND RELAPSE

POPULATION USING QUANTITATIVE PROTEOMIC

88

analysis on the parent (P), innately radiation resistant residual (RR) and relapse (R) population.

Amongst the many pathways, we found the proteasome pathway to be most significantly

deregulated in the RR cells.

Proteasomes are well-known targets in cancer therapy owing to their role in maintaining

homeostasis of proteins involved in cell cycle, signaling pathways regulating cell survival and

apoptosis (122-125). Cancer cells harbor enhanced proteasome activity compared to their

normal counterparts but the exact reason for this surge is still unknown. It is speculated that

this escalation in proteasome activity is to cope with a crisis such as mutational events and

chromosomal instabilities. Although proteasomes are identified as direct targets of radiation,

their inhibition is short lived and thus the need for drugs targeting their enzymatic activity (111,

126, 127). Lower proteasome activity is shown to be a marker for a tumour initiating cells and

stem cells (128). Proteasomes are also found to be downregulated in radio-resistant cells of

breast cancer and prostate cancer established in vitro (126, 129, 130). Contrary to these reports,

we observed an enhanced expression and activity of proteasomes in the innate radio-resistant

residual cells of glioblastoma. Subsequently, we also identified 14 out of 431 downregulated

proteins that harbor ubiquitin binding lysine residues. These proteins in the RR cells, we predict

to be either ubiquitin adapters or direct targets of the ubiquitin-mediated proteasome

machinery. This reduced number of proteins with ubiquitin binding attributes to the fact that

proteasomes degrade a significant cellular portion by an ubiquitin-independent manner also

which is still incompletely understood (112).

Bortezomib binds to the catalytic subunit of the 26S proteasome and preferentially inhibits the

β5/chymotrypsin like activity of the proteasome. It is currently being used in the treatment of

multiple myeloma (111, 131, 132). In GBM, it has been reported to sensitize the parent GBM

cells to temozolomide and radiation treatment but after immediate exposure to the drug and

radiation. However, in our study we show that the residual resistant cells that are formed after

DIFFERENTIAL PROTEOMIC ANALYSIS OF PARENT, RADIATION RESISTANT, AND RELAPSE

POPULATION USING QUANTITATIVE PROTEOMIC

89

a period of 5-7 days post radiation are more sensitive to proteasome inhibition compared to the

parent cells, although, there is a differential response to proteasome inhibition amongst the cell

lines (SF268, U87MG) and patient samples (PS1 & PS2) as depicted in Figure 5C. This could

be due to the heterogeneity of GBM tumors. The subtle effect of bortezomib seen in vitro after

72hrs post-treatment is significantly enhanced in reducing tumorigenicity of the treated cells

in vivo, suggesting a slow and prolonged effect of proteasome inhibition on the survival of the

cells. Even though proteasome inhibition alone reduced cell viability of the parent cells in vitro

but it did not effect the tumor burden in vivo. The difference in response in vitro and in vivo

could be attributed to the in vivo microenvironment which is known to plays a major role in

modulating the behaviour of tumor cells and efficacy of cancer drugs. A significant effect of

proteasome inhibition was observed on the overall survival of mice which were injected with

pre-treated RR-BTZ cells along with an increased % of tumour free mice when BTZ was

administered intraperitoneally along with radiation as shown in figure 40 B & C. The increased

levels of activated NFkB and its transcriptional activity in the RR cells correlate with previous

reports where NFkB has been shown to promote radioresistance in glioblastoma and other

cancers. It has been reported to trigger pro-survival and anti-apoptotic signals by transcriptional

activation of over 200 genes including the pro-inflammatory cytokines, cell-cell adhesion

molecules. We have observed cytokines such as TNF-α, IFN-γ, IL-6 and antioxidant genes

such as COX2 levels increased in the RR. Its activation can occur via IkB-α degradation

(Classical pathway) or the by TNF-α (alternative pathway) (113, 133, 134). However, the exact

mechanism downstream to higher proteasome expression and NFkB activity in the RR cells

needs to be further explored. Nonetheless, this study as illustrated in figure 41, establishes that

DIFFERENTIAL PROTEOMIC ANALYSIS OF PARENT, RADIATION RESISTANT, AND RELAPSE

POPULATION USING QUANTITATIVE PROTEOMIC

90

proteasomes aid the survival of the innate radiation resistant population via a NFkB pathway

and hence can be valuable targets for precluding relapse in glioblastoma.

4.2 Identification and functional validation of candidate protein 14-3-3 zeta in RR

cells

4.2.1 Introduction

4.2.1.1 14-3-3 family

14-3-3 zeta belongs to the 14-3-3 family of proteins. 14-3-3 proteins are a class of highly

conserved and ubiquitously expressed proteins. (135) These proteins are small acidic proteins

with its molecular weight ranging from 27-30 kDa. These proteins are abundantly found in the

brain but are also localized in all tissues including testes, liver, and heart. In terms of a

eukaryotic cell, these proteins are largely found in the cytoplasmic compartment. However,

they have also been spotted in the plasma membrane and intracellular organelles like the

nucleus and the Golgi apparatus (136).

This family of proteins was identified by Moore and Perez in 1967 during the classification of

brain proteins. These proteins were termed as ‘14-3-3’ based on the fraction number on DEAE-

cellulose chromatography and their migration position in starch gel electrophoresis. The name

26S proteasome subunits and

IR

Parent

Residual Resistant RR)

cells

Relapse

Survival of RR cells

Cell death

X

X

Bortezomib

Figure 41 Proposed model for the study

DIFFERENTIAL PROTEOMIC ANALYSIS OF PARENT, RADIATION RESISTANT, AND RELAPSE

POPULATION USING QUANTITATIVE PROTEOMIC

91

14-3-3 was derived from the combination of its fraction number on DEAE-cellulose

chromatography and its migration position in the subsequent starch–gel electrophoresis

(137). In mammals, seven isoforms of 14-3-3 proteins (β, γ, ε, ζ, η, σ, and τ) have been found

with each isoform encoded by a different gene and each having a unique mode of development

and regulation of functions (138, 139). All the isoforms have a similar structure comprising of

a dimerization region and a target binding region.

14-3-3 proteins exist as dimers, and each monomer in the dimer is composed of nine anti-

parallel alpha helices with the dimer interface at the N-terminus.

The highly conserved residues reside in the concave inner surface of the grove and the variable

residues are present in the N- terminal loop. The helices α C, α E, α G, and α I form a conserved

peptide-binding groove (140, 141). They function through binding to phosphorylated serine/

threonine motifs, RSXpSXP (motif 1) and RXY/FXXpSXP (motif 2), where pS represents

phosphoserine and X any amino acid, on their target proteins. (142, 143). 14-3-3 proteins are

primarily phosphorylation-dependent for its regulation and phosphorylation is a key event in

signaling pathways. Therefore, 14-3-3 interactions are largely regulated by the kinases and

phosphatases that modulate the phosphorylation state of the target protein. Thus, they function

Figure 42 Structure of 14-3-3

Figure 46 14-3-3 pathways to

maintain normal cellular

homeostasis.Figure 47

Structure of 14-3-3

DIFFERENTIAL PROTEOMIC ANALYSIS OF PARENT, RADIATION RESISTANT, AND RELAPSE

POPULATION USING QUANTITATIVE PROTEOMIC

92

as adaptor proteins which play an essential role in regulating a large number of general and

specialized signaling pathways.

These proteins bind to a variety of targets around the subcellular compartments which include

the transcription factors, tumor suppressors, biosynthetic enzymes, cytoskeletal proteins and

this diversity enables us to investigate and emerge with new mechanisms and roles of these

proteins (144). They regulate their target proteins by inducing a conformational change in the

protein, affecting protein activity or stability, facilitating protein complex formation, or altering

protein subcellular localization.

Since they are key regulators of cellular proliferation, differentiation, senescence, and

apoptosis, hence they serve as potential targets in cancer therapy. Among the seven isoforms,

14-3-3sigma is stated as a tumor suppressor gene, while the other isoforms have been

associated as an oncogene. 14-3-3 zeta amidst the six isoforms has been reported to be a

prognostic marker and a potential therapeutic target.

Figure 43 14-3-3 pathways to maintain normal cellular homeostasis.

(Image Courtesy – Expert Opin Ther Targets, 2010)

Figure 48 Overexpression of 14-3-3 zeta in different cancers.Figure 49 14-

3-3 pathways to maintain normal cellular homeostasis.

(Image Courtesy – Expert Opin Ther Targets, 2010)

DIFFERENTIAL PROTEOMIC ANALYSIS OF PARENT, RADIATION RESISTANT, AND RELAPSE

POPULATION USING QUANTITATIVE PROTEOMIC

93

4.2.1.2 Role of 14-3-3 ζ in cancer:

14-3-3 zeta plays a pivotal role in regulating multiple signaling pathways in cancer

development, progression, and therapy resistance. It is overexpressed in various cancers and

has been associated with poor prognosis, particularly in breast, lung and head and neck cancer.

14-3-3 ζ is overexpressed in more than 40% of advanced breast cancer cases. It has been

reported to promote metastasis in breast cancer by inhibiting RhoGDIα. Consequently, JiaXu

et al showed that ζ can switch the role of TGF β from a tumor suppressor to a metastasis

promoter by changing the partners of SMAD from p53 to Gli2. In head and neck squamous

cell carcinoma (HNSCC), overexpression of 14-3-3 zeta and 14-3-3 sigma has been related to

a high rate of recurrence. It has been shown to interact with Bad, p65 subunit of NF-κB and β-

Figure 44 Overexpression of 14-3-3 zeta in different cancers.

Figure 50 Overexpression of 14-3-3 zeta in different cancers.

DIFFERENTIAL PROTEOMIC ANALYSIS OF PARENT, RADIATION RESISTANT, AND RELAPSE

POPULATION USING QUANTITATIVE PROTEOMIC

94

catenin which facilitates cell proliferation, apoptosis, and adhesion in head and neck cancer. In

another report by Macha, M. A et al it has been reported as a molecular target in guggulsterone

induced apoptosis in head and neck cancer cells. In TSCC, overexpression of 14-3-3 zeta was

associated with lymph node metastasis and poor prognosis through immunohistochemical

studies. Silencing of 14-3-3 zeta reduced cell proliferation and migration of TSCC cells. In

pancreatic cancers, overexpression of 14-3-3 zeta was found to be more in pancreatic

adenocarcinoma (PCA) than in chronic pancreatitis (CP) which is one of the major risk factors

of pancreatic cancer. These reports collectively show that 14-3-3 zeta acts as pro-survival

signaling protein and hence serves as a potential target in cancer therapy. It is seen to be

upregulated in many cancer and remains one of the principal reasons for poor prognosis of

patients (145-149).

4.2.1.3 14-3-3 Zeta in Glioblastoma, Therapy Resistance, and Recurrence

In glioblastoma, according to the TCGA dataset, ζ is altered at mRNA and protein level in only

2.9% of cases. But, there was no significant correlation between overall survival and disease-

free survival in these cases.

A

B

B

]

B

B

]

C

B

]

F

i

g

u

r

e

5

1

E

x

p

r

e

s

s

DIFFERENTIAL PROTEOMIC ANALYSIS OF PARENT, RADIATION RESISTANT, AND RELAPSE

POPULATION USING QUANTITATIVE PROTEOMIC

95

(A) Illustrative representation of mRNA and protein expression using cBioportal. (B) & (C) represent the

overall survival and disease-free survival of patients overexpressing 14-3-3 ζ.

However, Yang et al in 2011 showed that 14-3-3 zeta positive expression is a prognosis

indicator in patients with glioblastoma. Patients who were treated with surgery, radiation, and

chemotherapy showed a positive 14-3-3 zeta expression in an immunohistochemical study. The

14-3-3 zeta also correlated with a short interval to tumor recurrence than the patients showing

14-3-3 zeta negative expression (150). This group later demonstrated in another study that 14-

3-3 zeta positive cells show a higher cell viability, stronger invasion and a high therapy

resistance with TMZ (151).

However, its role in promoting glioblastoma progression and radiation resistance has not been

reported. In this study, we focused on exploring the functional role of 14-3-3 zeta in

glioblastoma progression by identifying the binding partners of 14-3-3 zeta.

4.2.2 Results

4.2.2.1 Quantitative proteomic analysis revealed increased expression of 14-3-3 zeta in

RR cells

While searching for candidate proteins amongst the differential proteins for further functional

studies from our proteomic analysis, we analyzed all the 5 biological replicates for which

proteomics was done. 14-3-3 zeta was found to be significantly upregulated (>1.5) in the RR

cells of at least 4 of the biologically independent experiments of proteomic analysis (figure 46

A). The expression of 14-3-3 zeta was further confirmed by western blot in the P and RR cells

of cell lines and patient samples (figure 46 B). 14-3-3 zeta was found to upregulated in RR

cells of U87MG, SF268, PS1, and PS2. Thus, 14-3-3 zeta was considered to further understand

its role in GBM progression and radio-resistance.

Figure 45 Expression of 14-3-3 ζ in TCGA patient samples dataset.

Figure 52 Expression of 14-3-3 ζ in TCGA patient samples dataset.

DIFFERENTIAL PROTEOMIC ANALYSIS OF PARENT, RADIATION RESISTANT, AND RELAPSE

POPULATION USING QUANTITATIVE PROTEOMIC

96

A) 14-3-3 zeta relative peptide intensity values in SF268 RR in 5 biologically independent experiments of

proteomic analysis. B) Western blot of 14-3-3 zeta in P (parent) and RR (Radio-resistant) cells of cell lines (SF268

and U87MG) and two patient samples (PS1, PS2). Beta-actin was used as loading control.

4.2.2.2 Identification of interacting partners of 14-3-3 ζ

Since 14-3-3 zeta belongs to the protein family which serves as adapter proteins by protein-

protein interactions. We thus initiated an exploratory study to identify the interacting partners

of 14-3-3 zeta in the RR cells. For this, GST tagged 14-3-3 zeta was expressed and purified

from a bacterial system using pGEX 4T 14-3-3 ζ vector. The purity and identity of the protein

were confirmed by mass spectrometry (Figure 47 A).

Figure 46 Expression of 14-3-3 zeta.

Figure 54 Expression of 14-3-3 zeta.

1 4 -3 -3 z e ta p r o te in e x p re s s io n

in S F 2 6 8 R R

Re

lati

ve

Pe

pti

de

In

ten

sit

y

Re

pli

ca

te 1

Re

pli

ca

te 2

Re

pli

ca

te 3

Re

pli

ca

te 4

Re

pli

ca

te 5

0 .0

0 .5

1 .0

1 .5

2 .0

A

F

i

g

u

r

e

5

3

E

x

p

r

e

s

s

i

o

n

o

f

1

4

-

3

-

3

z

e

t

a

. A

B

B

DIFFERENTIAL PROTEOMIC ANALYSIS OF PARENT, RADIATION RESISTANT, AND RELAPSE

POPULATION USING QUANTITATIVE PROTEOMIC

97

A

(A) Bacterial purification of GST tagged 14-3-3 ζ protein using pGEX 4T vector. The purified protein was

confirmed for its purity and identity by extracting the protein from a Coomassie-stained gel and by mass

spectrometry. (B) Silver-stained gel images of pull-down eluate for SF268 RR and U87MG RR using GST tagged

14-3-3 ζ (GST –z) and GST alone along with whole cell lysate as the input (In). (C) Venn diagram representing

the common interacting proteins of 14-3-3 ζ identified in SF268 RR and U87MG RR. The third circle represents

the known interacting partners of 14-3-3 ζ.

This purified protein was then incubated with whole cell lysates of SF268 RR and U87 RR

cells and GST pull-down assay was performed. The empty pGEX 4T vector was used as a

control. The eluted proteins were resolved on an SDS PAGE, silver stained, in-gel trypsin

digested and run through LC-MS-MS for protein identification (Figure 47 B).

After performing at least 3 biologically independent experiments, 27 proteins were found to

interact with 14-3-3 zeta in SF268 RR cells and 38 proteins were found to interact in U87MG

B

F

i

g

u

r

e

5

5

I

d

e

n

ti

fi

c

a

ti

o

n

o

f

ζ

i

n

t

e

r

a

c

ti

n

g

p

a

rt

n

e

r

s

C

C

Figure 47 Identification of ζ interacting partners using GST pull down assay.

Table 5 List of interacting proteins identified in RR cellsFigure 56 Identification of ζ

interacting partners using GST pull down assay.

DIFFERENTIAL PROTEOMIC ANALYSIS OF PARENT, RADIATION RESISTANT, AND RELAPSE

POPULATION USING QUANTITATIVE PROTEOMIC

98

RR cells. According to the bio grid database, 14-3-3 zeta is known to interact with

approximately 330 proteins. Thus, a gene set overlap was done to identify common interactors

of ζ between SF268 and U87MG and to identify how many among the overlapping proteins

were already known interactors (figure 47 C). In total, 15 proteins were common interacting

proteins present in both SF268 and U87MG, of which 10 were novel binding partners and 5

proteins were known interacting partners of 14-3-3 zeta. The table below enlists all the 15

proteins that were identified. Interestingly, 12 out of the 15 proteins were also identified in our

differential proteomic analysis as represented in table 3. 5. Among these 15 proteins are the

proteins involved in glycolysis, TCA cycle, and ATP synthesis – GAPDH, MDH, ATP5A,

PGK1, and ENO1. 2 proteins, catalase, and peroxiredoxin are known to aid the cells in

overcoming oxidative stress (152). Annexin A2 and Serpin B12 are proteins involved in

regulating cellular apoptosis as enlisted in table 4. Collectively, 14-3-3 zeta was found to

interact with proteins involved in modulating metabolism, apoptosis and oxidative stress in the

RR cells. Further functional experiments need to be performed to confirm and support this data

set.

DIFFERENTIAL PROTEOMIC ANALYSIS OF PARENT, RADIATION RESISTANT, AND RELAPSE

POPULATION USING QUANTITATIVE PROTEOMIC

99

Table 3 List of interacting proteins identified in RR cells

Table 6 List of interacting proteins functionally classifiedTable 7 List of interacting

proteins identified in RR cells

Table 4 List of interacting proteins functionally classified

DIFFERENTIAL PROTEOMIC ANALYSIS OF PARENT, RADIATION RESISTANT, AND RELAPSE

POPULATION USING QUANTITATIVE PROTEOMIC

100

4.2.2.3 Metabolic changes in the RR cells

Since 14-3-3 ζ showed plausible interactions with metabolic enzymes and antioxidants, the

mitochondrial function of the RR cells was evaluated using the Seahorse XF Cell Mito Stress

Test which measures oxygen consumption rate (OCR) of cells (figure 48 A). Sequential

compound injections measure basal respiration, ATP production, proton leak, maximal

respiration, spare respiratory capacity, and non-mitochondrial respiration rates. The RR cells

showed an increase in proton leak compared to the parent cells and the non-mitochondrial

respiration rate in SF268 RR cells was significantly higher as shown in figure 48 B & C.

A) Schematic presentation of the Mito stress assay performed on the SF268 RR cells. (B) Graphical

representation of the proton leak and non-mitochondrial oxygen consumption

B

A

P RR

C

P RR

Figure 48 Mitochondrial function of RR compared to R.

DIFFERENTIAL PROTEOMIC ANALYSIS OF PARENT, RADIATION RESISTANT, AND RELAPSE

POPULATION USING QUANTITATIVE PROTEOMIC

101

The increased proton leak in the RR cells demonstrates higher extracellular acidification rate.

Additionally, electron microscopy revealed that the mitochondria of RR cells were

significantly more in number and were elongated in morphology compared to the parent cells

which harbor circular morphology (figure 49 A, B & C).

(A Electron microscopy images of P and RR cells of SF268 and U87MG. (B) Graphical representation of

the number of mitochondria in P and RR cells. (C) Graphical representation of length of mitochondria

In conclusion, the findings in this study suggest a metabolic rewiring taking place in the RR

cells. However, these outcomes need to be further confirmed by the 14-3-3 zeta knockdown

cells to verify the role of 14-3-3 zeta in metabolic reprogramming of RR cells.

4.2.3 Discussion

14-3-3 proteins are well-known cancer therapeutic targets owing to their central role in

regulating various cellular processes such as proliferation, apoptosis, signal transduction,

migration, and invasion. In glioblastoma, various studies have reported a strong association

Figure 49 Mitochondrial morphology of P and RR cells.

DIFFERENTIAL PROTEOMIC ANALYSIS OF PARENT, RADIATION RESISTANT, AND RELAPSE

POPULATION USING QUANTITATIVE PROTEOMIC

102

between 14-3-3 overexpression and glioma progression and therapy resistance. Also in our

analysis, we found 14-3-zeta to be significantly upregulated in residual resistant cells that have

an enhanced ability to survive and form relapse. Among the seven isoforms, 14-3-3 zeta was

the only isoform found to be upregulated in the RR cells of all biologically independent

proteomic analysis. The expression was confirmed by western blot in the RR cells of cell lines

as well as primary cultures from the patient samples. Thus, excluding the fact that our findings

could be just a cell line effect.

14-3-3 ζ is known to function in an interdependent manner via dynamic interactions with

various proteins to regulate numerous cellular processes. Its diverse nature to dynamically

interact with various proteins points towards a network of proteins influencing radio-resistance

and relapse. Hence, to understand what processes it could be modulating we first chose to

identify the interacting partners of 14-3-3 zeta in the RR cells. For this, a GST pull-down assay

was performed with a purified form of GST tagged 14-3-3 ζ protein extract to identify

interacting partners of 14-3-3 zeta in the RR cells of SF268 and U87MG. Amongst the proteins

identified by mass spectrometry, 5 of the proteins were enzymes involved in metabolism such

as Glycolysis (GAPDH, PGK1. ENO1), TCA cycle (MDH), ATP synthesis (ATP5A). The

identification of these metabolic enzymes as 14-3-3ζ interacting proteins along with

antioxidants such as CAT and PRDX1 indicates that 14-3-3ζ might be helping the RR cells to

combat stress and survive. 14-3-3ζ has been reported to defend cells from numerous stresses,

including chemotherapy-induced death, anoikis, and growth factor deprivation (153-155)

S.E. Meek,et al in a seminal study in 2004 (156) using mammalian 14-3-3ζ as bait confirmed

its interaction with metabolic enzymes such as pyruvate kinase M(PK), ATP-

synthase(AS), glyceraldehyde-3-phosphate dehydrogenase (GAPDH), fatty acid

synthase(FAS) and the bifunctional enzyme 6-phosphofructo-2-kinase/fructose-2,6-

bisphosphatase (PFK-2). Concurrently, an independent experiment done in our lab to measure

DIFFERENTIAL PROTEOMIC ANALYSIS OF PARENT, RADIATION RESISTANT, AND RELAPSE

POPULATION USING QUANTITATIVE PROTEOMIC

103

the mitochondrial respiration rate of our RR cells revealed increased proton leak suggesting an

increased extracellular acidification rate. We also observed the difference in the mitochondrial

morphology in the RR cells compared to the parent cells in electron microscopy. The 14-3-3

proteins have been shown to regulate cellular metabolism (157). Furthermore, in a recent report

is shown to regulate mitochondrial respiratory reserve in platelets regulating their bioenergy

(158). In another study quantitative proteomic analysis of mitochondria from sensitive and

resistant ovarian cancer cells have identified 14-3-3- zeta to be differentially present in the

mitochondria of resistant cells (159). Taken together, these findings strongly suggest a

plausible role of 14-3-3 zeta in regulating the metabolic processes in the RR cells which may

confer resistance and recurrence. However, to support and confirm this hypothesis rigorous

functional experiments need to be conducted. Nevertheless, the findings of this study have

provided a new aspect of 14-3-3 ζ in glioblastoma which can be further explored.

104

5 Summary and Conclusion

SUMMARY AND CONCLUSION

105

5.1 Summary

Therapy resistance and recurrence in glioblastoma are inescapable conditions for a newly

diagnosed glioblastoma patient. This is currently an escalating phenomenon in glioblastoma

due to our inability to target residual radiation resistant (RR) cells which are invisible and

inaccessible post initial treatment. We, therefore, recapitulated the clinical scenario of

resistance in a cellular model developed from fresh primary GBM patient samples and cell

lines. The model allowed us to capture 1) Parent cells 2) innately Radiation Resistant cells –

less than 10% of the parent population and 3) Relapse (R) cells. A previously published study

from our lab, Kaur E et al demonstrated that these RR cells were reversibly senescent for a

short interval and enriched with MNGCs after exposure to a lethal dose of radiation. After

being in a non-proliferative phase these RR cells resumed growth to form mononucleated

relapse cells. The work done in this thesis stems from these findings to gain insight into the

molecular mechanism of therapy resistance in glioblastoma using a proteomics approach.

Following aspects were examined and recorded:

1. The aggressive nature of the relapse cells was tested on two cell lines (U87MG, SF268)

by first monitoring the radiation response of the relapse cells by subjecting them to the

second round of lethal dose of radiation. It was observed that the relapse cells responded

in a similar manner as the parent cells. They also exhibited the presence of non-

proliferative cells which remained undivided for about a week and grew back to form

the second relapse population. The D0 dose of the Parent, R1, R2 cells shows an

increasing trend. The relapse cells were found to be significantly more migrating as

compared to the parent cells in both cell lines and patient samples. The relapse cells

were also more invading than the parent cells in the cell lines. However, in patient

samples, the relapse cells were equally invasive than their respective parent

SUMMARY AND CONCLUSION

106

counterparts. This could be attributed to heterogeneity of the tumor tissues and

differential response of recurrent tumors to radiation.

2. The MNGCs found to be enriched in the RR cells were formed even when the

glioblastoma cells were administered with a repeated exposure of radiation in 2Gy

fractions and a daily dose of TMZ at the plasma concentration (25 µM). We observed

that MNGCs and the transient non-proliferative phase is not just a consequence of a

sudden exposure to high dose of radiation but they are formed even at a dose which is

standardly used in the clinics. Thus, reflecting the phenomenon of a transient tumor

dormancy before an aggressive relapse due to the presence of innately radio-resistant

cells which are characterized by MNGCs.

3. The presence of MNGCs and the transient non-proliferative phase post-IR was not just

restricted to glioblastoma. It was found to occur in breast cancer as well as colorectal

cancer where these cells also displayed a similar response to a lethal dose of radiation.

The RR cells formed in different cancer cell lines also exhibited increased expression of

survival genes and SASPs.

4. A differential proteomic analysis using iTRAQ technology was performed on the parent,

RR and R cells of SF268. Unsupervised clustering of the proteomics data identified

protein clusters uniquely differential in each population. The RR cells harbored

maximum genes to be uniquely differential as compared to P and R cells.

5. The RR cells showed a significant deregulation of the proteasome pathway in the three

biologically independent proteomic analysis. The increased expression of the

proteasome pathway was further confirmed by western blot analysis of proteasome

subunits PSME1, PSMA7, and PSMB4. Along with increased expression, the RR cells

also harbored enhanced proteasome activity in cell lines as well as patient samples.

SUMMARY AND CONCLUSION

107

6. Pharmacological inhibition of proteasome activity using the well-known FDA approved

proteasome inhibitor – Bortezomib rendered the RR cells sensitive to radiation. A dose-

dependent reduction in proteasome activity was observed in both P and RR cells.

However, the cell viability of RR cells reduced more drastically as compared to the P

cells after administration of the proteasome inhibitor in vitro.

7. The RR cells showed increased levels of activated phospho-p65 protein, a bona fide

target of proteasomes as well as a significant increase (20 fold) in NFkB transcriptional

activity as compared to the parent population (P) was also seen. Concurrently, at least 6

out of the 9 target genes of phospho-NFkB showed significantly increased expression in

SF268, U87, and PS1

8. Administration of the proteasome inhibitor (Bortezomib) in the P and RR cells

diminished this activity of NF-kB by 1.5 and 3.0-fold confirming the dependency of

NFkB activity on the proteasome activity also suggesting an important role of NFKB in

the survival of RR cells.

9. Most importantly, the therapeutic potential of using proteasomal inhibitors was

established using an in vivo orthotopic GBM model. Firstly, the survival dependency of

RR cells on proteasome function in vivo was demonstrated by orthotopically injecting

BTZ pre-treated RR cells. These cells showed reduced tumorigenicity as compared to

the group injected with BTZ pre-treated P cells along with a significant increase in their

overall survival. Secondly, mice that developed GBM by intracranial injections of GBM

cell line were administered a clinically relevant fractionated dose of radiation along with

the intraperitoneal injection of BTZ. BTZ treated mice showed a significant increase in

their disease-free survival along with reduced tumorigenicity as compared to the control

group.

SUMMARY AND CONCLUSION

108

10. Apart from identifying proteasome pathway as a potential target for residual cells, the

candidate-based approach revealed increased expression of 14-3-3 ζ in the RR cells

compared to the P cells of GBM cell lines as well as patient samples. This protein

regulates various cellular processes through dynamic interactions with its interacting

partner. Hence in this study, GST fused ζ was used as bait for identifying the interacting

partners of ζ in SF268 RR and U87MG RR population through GST pull-down assay

followed by mass spectrometry. The data revealed plausible interactions with metabolic

enzymes such as those involved in glycolysis, TCA cycle, ATP synthesis and

antioxidants, cytoskeleton proteins. Since RR cells also show increased ATP production

and the difference in their mitochondrial morphology, hence 14-3-3 zeta may have a role

to play in the metabolic rewiring of the RR cells.

5.2 Conclusion

The aim of this study was to identify the processes deregulated in the innately radiation resistant residual

(RR) population as we have previously shown that these are the cells responsible for relapse in

glioblastoma. iTRAQ based quantitative proteomic analysis on the parent (P), innately radiation

resistant residual (RR) and relapse (R) population revealed significantly deregulation of the proteasome

pathway in the RR cells. Contrary to other reports, the RR cells displayed enhanced expression and

activity of proteasome subunits, which triggered NFkB signaling. Pharmacological inhibition of

proteasome activity led to impeded NFkB transcriptional activity, radio-sensitization of RR cells in

vitro, and significantly reduced capacity to form orthotopic tumors in vivo. We demonstrate that a

combination of proteasome inhibitor with radio-therapy abolish the inaccessible residual resistant cells

thereby preventing GBM recurrence. However, the exact mechanism downstream to higher proteasome

expression and NF-kB activity in the RR cells needs to be further explored. Nonetheless, this study

establishes that proteasomes aid the survival of the innate radiation resistant population via a NFkB

pathway and hence can be valuable targets for precluding relapse in glioblastoma. Apart from the

SUMMARY AND CONCLUSION

109

identification of biological processes governing the survival of RR cells, proteomic data revealed 14-3-

3-zeta.overexpression of 14-3-3 zeta in the RR cells. In the quest to identify the broader functions of ζ

via its interacting partners we found that it binds to metabolic enzymes, antioxidants, cytoskeletal

proteins and apoptosis regulators. Since we also observe increased ECAR in the RR cells and changes

in their mitochondrial morphology, it indicates that ζ might be curbing the metabolic processes in the

RR cells to confer resistance and relapse. However, these findings need to be supported with more

intricate results. To summarize, this study has revealed new insights into the radiation resistant residual

cells and relapse cells that can be further explored for a deeper knowledge of radio resistance and

recurrence in glioblastoma.

110

6 References

REFERENCES

111

1. Bleeker FE, Molenaar RJ, Leenstra S. Recent advances in the molecular understanding

of glioblastoma. Journal of neuro-oncology. 2012 May;108(1):11-27. PubMed PMID:

22270850. Pubmed Central PMCID: 3337398.

2. Stupp R1 MW, van den Bent MJ, Weller M, Fisher B, Taphoorn MJ, Belanger K,

Brandes AA, Marosi C, Bogdahn U, Curschmann J, Janzer RC, Ludwin SK, Gorlia T, Allgeier

A, Lacombe D, Cairncross JG, Eisenhauer E, Mirimanoff RO. Radiotherapy plus concomitant

and adjuvant temozolomide for glioblastoma. N Engl J Med. 2005 March 10;352:9.

3. Stupp R1 HM, Mason WP, van den Bent MJ, Taphoorn MJ, Janzer RC, Ludwin SK,

Allgeier A, Fisher B, Belanger K, Hau P, Brandes AA, Gijtenbeek J, Marosi C, Vecht CJ,

Mokhtari K, Wesseling P, Villa S, Eisenhauer E, Gorlia T, Weller M, Lacombe D, Cairncross

JG, Mirimanoff RO. Effects of radiotherapy with concomitant and adjuvant temozolomide

versus radiotherapy alone on survival in glioblastoma in a randomised phase III study: 5-year

analysis of the EORTC-NCIC trial. 2009;10.

4. Glas M, Rath BH, Simon M, Reinartz R, Schramme A, Trageser D, et al. Residual

tumor cells are unique cellular targets in glioblastoma. Annals of neurology. 2010

Aug;68(2):264-9. PubMed PMID: 20695020. Pubmed Central PMCID: 4445859.

5. Kelley K, Knisely J, Symons M, Ruggieri R. Radioresistance of Brain Tumors.

Cancers. 2016 Mar 30;8(4). PubMed PMID: 27043632. Pubmed Central PMCID: 4846851.

6. Weller M, Cloughesy T, Perry JR, Wick W. Standards of care for treatment of recurrent

glioblastoma--are we there yet? Neuro-oncology. 2013 Jan;15(1):4-27. PubMed PMID:

23136223. Pubmed Central PMCID: 3534423.

7. Roy S, Lahiri D, Maji T, Biswas J. Recurrent Glioblastoma: Where we stand. South

Asian journal of cancer. 2015 Oct-Dec;4(4):163-73. PubMed PMID: 26981507. Pubmed

Central PMCID: 4772393.

8. Reardon DA. Therapeutic Advances in the Treatment of Glioblastoma: Rationale and

Potential Role of Targeted Agents. The Oncologist. 2006;11(2):152-64.

9. Zhang X. Glioblastoma multiforme: Molecular characterization and current treatment

strategy (Review). Experimental and Therapeutic Medicine. 2011.

10. Weller M, Cloughesy T, Perry JR, Wick W. Standards of care for treatment of recurrent

glioblastoma--are we there yet? Neuro-Oncology. 2012;15(1):4-27.

11. Mangum R. Glioma Stem Cells and their Therapy Resistance. Journal of

Carcinogenesis & Mutagenesis. 2012;01(S1).

12. Kanu OO, Mehta A, Di C, Lin N, Bortoff K, Bigner DD, et al. Glioblastoma

multiforme: a review of therapeutic targets. Expert Opin Ther Targets. 2009 Jun;13(6):701-18.

PubMed PMID: 19409033. Epub 2009/05/05. eng.

13. Wurth R, Barbieri F, Florio T. New Molecules and Old Drugs as Emerging Approaches

to Selectively Target Human Glioblastoma Cancer Stem Cells. Biomed Res Int.

2014;2014:126586. PubMed PMID: 24527434. Pubmed Central PMCID: 3909978.

14. Roger Stupp MD, Warren P. Mason, M.D., Martin J. van den Bent, M.D.,, Michael

Weller MD, Barbara Fisher, M.D., Martin J.B. Taphoorn, M.D.,, Karl Belanger MD, Alba A.

Brandes, M.D., Christine Marosi, M.D.,, Ulrich Bogdahn MD, Jürgen Curschmann, M.D.,

Robert C. Janzer, M.D.,, Samuel K. Ludwin MD, Thierry Gorlia, M.Sc., Anouk Allgeier,

Ph.D.,, Denis Lacombe MD, J. Gregory Cairncross, M.D., Elizabeth Eisenhauer, M.D.,, et al.

Radiotherapy plus Concomitant and Adjuvant Temozolomide for Glioblastoma. The new

england journal of medicine. 2005.

15. Kaur E, Rajendra J, Jadhav S, Shridhar E, Goda JS, Moiyadi A, et al. Radiation-induced

homotypic cell fusions of innately resistant glioblastoma cells mediate their sustained survival

and recurrence. Carcinogenesis. 2015 Jun;36(6):685-95. PubMed PMID: 25863126.

16. Zhang X, Zhang W, Cao WD, Cheng G, Zhang YQ. Glioblastoma multiforme:

Molecular characterization and current treatment strategy (Review). Experimental and

REFERENCES

112

therapeutic medicine. 2012 Jan;3(1):9-14. PubMed PMID: 22969836. Pubmed Central

PMCID: 3438851.

17. Kumar DM, Patil V, Ramachandran B, Nila MV, Dharmalingam K, Somasundaram K.

Temozolomide-modulated glioma proteome: role of interleukin-1 receptor-associated kinase-

4 (IRAK4) in chemosensitivity. Proteomics. 2013 Jul;13(14):2113-24. PubMed PMID:

23595970.

18. ZHANG AWaG. Differential gene expression analysis in glioblastoma cells

and normal human brain cells based on GEO database. ONCOLOGY LETTERS. 2017 07

September;14.

19. Mann APM. Proteomics to study genes and genomes. NATURE. 2000;405 |.

20. Picotti P, Bodenmiller B, Aebersold R. Proteomics meets the scientific method. Nature

methods. 2013 Jan;10(1):24-7. PubMed PMID: 23269373.

21. . !!! INVALID CITATION !!!

22. Khwaja FW, Reed MS, Olson JJ, Schmotzer BJ, Gillespie GY, Guha A, et al. Proteomic

identification of biomarkers in the cerebrospinal fluid (CSF) of astrocytoma patients. J

Proteome Res. 2007 Feb;6(2):559-70. PubMed PMID: 17269713. Pubmed Central PMCID:

2566942.

23. Vogel TW, Zhuang Z, Li J, Okamoto H, Furuta M, Lee YS, et al. Proteins and protein

pattern differences between glioma cell lines and glioblastoma multiforme. Clinical cancer

research : an official journal of the American Association for Cancer Research. 2005 May

15;11(10):3624-32. PubMed PMID: 15897557.

24. de Aquino PF, Carvalho PC, Nogueira FC, da Fonseca CO, de Souza Silva JC, Carvalho

Mda G, et al. A Time-Based and Intratumoral Proteomic Assessment of a Recurrent

Glioblastoma Multiforme. Frontiers in oncology. 2016;6:183. PubMed PMID: 27597932.

Pubmed Central PMCID: 4992702.

25. Zhang P, Guo Z, Zhang Y, Gao Z, Ji N, Wang D, et al. A preliminary quantitative

proteomic analysis of glioblastoma pseudoprogression. Proteome science. 2015;13:12.

PubMed PMID: 25866482. Pubmed Central PMCID: 4393599.

26. Hudler P, Kocevar N, Komel R. Proteomic approaches in biomarker discovery: new

perspectives in cancer diagnostics. TheScientificWorldJournal. 2014;2014:260348. PubMed

PMID: 24550697. Pubmed Central PMCID: 3914447.

27. Kalinina J, Peng J, Ritchie JC, Van Meir EG. Proteomics of gliomas: initial biomarker

discovery and evolution of technology. Neuro-oncology. 2011 Sep;13(9):926-42. PubMed

PMID: 21852429. Pubmed Central PMCID: 3158015.

28. Collet B, Guitton N, Saikali S, Avril T, Pineau C, Hamlat A, et al. Differential analysis

of glioblastoma multiforme proteome by a 2D-DIGE approach. Proteome science.

2011;9(1):16. PubMed PMID: 21470419. Pubmed Central PMCID: 3083325.

29. Niclou SP, Fack F, Rajcevic U. Glioma proteomics: status and perspectives. J

Proteomics. 2010 Sep 10;73(10):1823-38. PubMed PMID: 20332038.

30. Thaker NG, Zhang F, McDonald PR, Shun TY, Lewen MD, Pollack IF, et al.

Identification of survival genes in human glioblastoma cells by small interfering RNA

screening. Molecular pharmacology. 2009 Dec;76(6):1246-55. PubMed PMID: 19783622.

Pubmed Central PMCID: 2784725.

31. Hill JJ, Moreno MJ, Lam JC, Haqqani AS, Kelly JF. Identification of secreted proteins

regulated by cAMP in glioblastoma cells using glycopeptide capture and label-free

quantification. Proteomics. 2009 Feb;9(3):535-49. PubMed PMID: 19137551.

32. Furuta M, Weil RJ, Vortmeyer AO, Huang S, Lei J, Huang TN, et al. Protein patterns

and proteins that identify subtypes of glioblastoma multiforme. Oncogene. 2004 Sep

2;23(40):6806-14. PubMed PMID: 15286718.

REFERENCES

113

33. Smith JS JR. Genetic alterations in adult diffuse glioma: occurrence, significance, and

prognostic implications. Front Biosci. 2000 Jan 1;5:D213-31.

34. Ohgaki HaK, P. Population-based studies on incidence, survival rates, and genetic

alterations in astrocytic and oligodendroglial gliomas. J Neuropathol Exp Neurol 2005 (64):

479–89.

35. Society AC. Cancer Facts and Figures 2010. Atlanta American Cancer Society. 2010.

36. Thakkar J DT, Horbinski C, Ostrom QT, Lightner DD, Barnholtz-Sloan JS, et al. .

Epidemiologic and molecular prognostic review of glioblastoma. Cancer Epidemiol

Biomarkers Rev. 2014;23((10)):1985–96.

37. Morgan LL. The epidemiology of glioma in adults: a “state of the science” review.

Neuro Oncol. 2015 Apr;17(4):623–4.

38. Ostrom QT GH, Fulop J, Liu M, Blanda R, Kromer C, Wolinsky Y, Kruchko C,

Barnholtz-Sloan JS. CBTRUS Statistical Report: Primary Brain and Central Nervous System

Tumors Diagnosed in the United States in 2008-2012. Neuro Oncol 2015 Oct;17

39. Ellor SV P-YT, Avgeropoulos NG. Glioblastoma: background, standard treatment

paradigms, and supportive care considerations.

. J Law Med Ethics. 2014 42(2):171-82.

40. Munshi A JR. Therapy for glioma: Indian perspective. . Indian J Cancer 2009;46:127-

31.

41. Wen PYaK, S. Malignant gliomas in adults. N Engl J Med 2008;359:492–507.

42. Blissitt PA AAoNN. Clinical practice guideline series update: care of the adult patient

with a brain tumor. J Neurosci Nurs 2014 Dec;46(6):367-8.

43. Tyler C. Steed Merk JMT, Amanda R. Smith, Kunal Patel, Bob S. Carter, Valya

Ramakrishnan, Anders M. Dale,, Lionel M. L. Chow, Alexander and Clark C. Chen.

Differential localization of glioblastoma subtype: implications on glioblastoma pathogenesis.

Oncotarget. 2016 April 01, 2016.

44. Johnson DR FS, Giannini C, Kaufmann TJ, Raghunathan A, Theodosopoulos PV,

Clarke JL. . Case-based review: Newly diagnosed glioblastoma. . Neuro-Oncology Practice.

2015;2:106–21.

45. Alifieris C TD. Glioblastoma multiforme: Pathogenesis and treatment. Pharmacol Ther

2015 Aug 152.

46. A. L. Imaging in glioblastoma multiforme. . 2015

47. Young RM JA, Davis G, Sherman JH. Current trends in the surgical management and

treatment of adult glioblastoma. Ann Transl Med 2015 Jun;3(9).

48. Network NCC. Clinical Practice Guidelines in Oncology: Central nervous system

cancers 2015

49. Barani IJ LD. Radiation therapy of glioblastoma. Cancer Treat Res 2015;163:49-73.

50. Zhao S WJ, Wang C, Liu H, Dong X, Shi C, Shi C, Liu Y, Teng L, Han D, Chen X,

Yang G, Wang L, Shen C, Li H. Intraoperative fluorescence-guided resection of high-grade

malignant gliomas using 5-aminolevulinic acid-induced porphyrins: a systematic review and

meta-analysis of prospective studies. PLoS One 2013;8(5).

51. Barone DG LT, Hart MG, Cochrane. Image guided surgery for the resection of brain

tumours. Database Syst Rev. 2014 Jan 28; (1).

52. Cohen MH SY, Keegan P, Pazdur R. FDA drug approval summary: bevacizumab

(Avastin) as treatment of recurrent glioblastoma multiforme. Oncologist 2009

Nov;14(11):1131-8.

53. Taal W OH, Walenkamp AM, Dubbink HJ, Beerepoot LV, Hanse MC, Buter J,

Honkoop AH, Boerman D, de Vos FY, Dinjens WN, Enting RH, Taphoorn MJ, van den

Berkmortel FW, Jansen RL, Brandsma D, Bromberg JE, van Heuvel I, Vernhout RM, van der

REFERENCES

114

Holt B, van den Bent MJ. Single-agent bevacizumab or lomustine versus a combination of

bevacizumab plus lomustine in patients with recurrent glioblastoma (BELOB trial): a

randomised controlled phase 2 trial. Lancet Oncol 2014 15(9):943-53.

54. Stupp R TS, Kanner AA, Kesari S, Steinberg DM, Toms SA, Taylor LP, Lieberman F,

Silvani A, Fink KL, Barnett GH, Zhu JJ, Henson JW, Engelhard HH, Chen TC, Tran DD,

Sroubek J, Tran ND, Hottinger AF, Landolfi J, Desai R, Caroli M, Kew Y, Honnorat J, Idbaih

A, Kirson ED, Weinberg U, Palti Y, Hegi ME, Ram Z. Maintenance Therapy With Tumor-

Treating Fields Plus Temozolomide vs Temozolomide Alone for Glioblastoma: A Randomized

Clinical Trial. JAMA 2015 Dec 15.

55. Mohammad Sami Walid M, PhD. Prognostic Factors for Long-Term Survival after

Glioblastoma. The Permanente Journal. 2008;12(4).

56. Verhaak RG, Hoadley KA, Purdom E, Wang V, Qi Y, Wilkerson MD, et al. Integrated

genomic analysis identifies clinically relevant subtypes of glioblastoma characterized by

abnormalities in PDGFRA, IDH1, EGFR, and NF1. Cancer cell. 2010 Jan 19;17(1):98-110.

PubMed PMID: 20129251. Pubmed Central PMCID: 2818769.

57. Houtan Noushmehr DJW, Kristin Diefes,Heidi S. Phillips, Kanan Pujara, Benjamin P.

Berman,Fei Pan,Christopher E. Pelloski, Erik P. Sulman,Krishna P. Bhat, Roel G.W. Verhaak,

Katherine A. Hoadley, D. Neil Hayes, Charles M. Perou, Heather K. Schmidt, Li Ding, Richard

K. Wilson, David Van Den Berg, Hui Shen,Henrik Bengtsson, Pierre Neuvial, Leslie M. Cope,

Jonathan Buckley, James G. Herman, Stephen B. Baylin, Peter W. Laird, Kenneth Aldape,and

The Cancer Genome Atlas Research Network. Identification of a CpG Island Methylator

Phenotype that Defines a Distinct Subgroup of Glioma. Cancer Cell. 2010 17(5):510–22. Epub

May 18.

58. Chakravarti A, et al.,. Survivin enhances radiation resistance in primary human

glioblastoma cells via caspase-independent mechanisms. . Oncogene, . 2004;23(45):7494-506.

59. Chakravarti A, et al., 15. The epidermal growth factor receptor pathway mediates

resistance to sequential administration of radiation and chemotherapy in primary human

glioblastoma cells in a RAS-dependent manner. Cancer Res, . 2002. ;62(15).

60. Ichimura K, et al., . Molecular pathogenesis of astrocytic tumours. . J Neurooncology.

2004; 70(2):137-60.

61. Chen J, R.M. McKay, and L.F. Parada, . Malignant glioma: lessons from genomics,

mouse models, and stem cells. Cell. 2012;149(1):36-47.

62. Ines Crespo ALV, María Gonzalez-Tablas, María del Carmen Patino, Alvaro Otero,

María Celeste Lopes, Catarina de Oliveira, Patricia Domingues, Alberto Orfao, Maria Dolores

Tabernero. Molecular and Genomic Alterations in Glioblastoma Multiforme. The American

Journal of Pathology. 2015;185(7):1820–33.

63. Bar E. E. CA, Lin A., et al. Cyclopamine-mediated Hedgehog pathway inhibition

depletes stem-like cancer cells in glioblastoma. . Stem Cells. 2007;25(10):2524-33.

64. Clement V SP, Tribolet Nd, et al. . HEDGEHOG-GLI1 signaling regulates human

glioma growth, cancer stem cell self-renewal, and tumorigenicity. . Curr Biol. 2007;17.

65. Jialiang Wang TPW, Justin D. Latha, Anita B. Hjelmeland, Xiao-Fan Wang, Rebekah

R. White, Jeremy N. Rich, and Bruce A. Sullenger. Notch Promotes Radioresistance of Glioma

Stem Cells. Stem Cells 2010;28(1):17-28.

66. Yu JB1 JH, Zhan RY1. Aberrant Notch signaling in glioblastoma stem cells contributes

to tumor recurrence and invasion. Mol Med Rep. 2016;14(2):1263-8.

67. Massimo Squatrito CWB, Karim Helmy, Jason T. Huse, John H. Petrini, and Eric C.

Holland. Loss of ATM/Chk2/p53 pathway components accelerates tumor development and

contributes to radiation resistance in gliomas. Cancer Cell. 2010;18(6).

REFERENCES

115

68. Wei Zhou MS, Guang-Hui Li, Yong-Zhong Wu, Ying Wang, Fu Jin, Yun-Yun Zhang,

Li Yang, Dong-Lin Wang. Activation of the phosphorylation of ATM contributes to

radioresistance of glioma stem cells. Oncology Reports. 2013;30:1793-801.

69. B. Pradet-Balade FB, H. Beug, E. W. Müllner, and J. A. Garcia-Sanz. Translation

control: bridging the gap between genomics and proteomics? Trends in Biochemical Sciences.

2001;26(4):225-9.

70. Lage H. Proteomics in cancer cell research: an analysis of therapy resistance.

Pathology, research and practice. 2004;200(2):105-17. PubMed PMID: 15237919.

71. UA K. Biomarker rediscovery in diagnostics. Expert Opin Med Diagn

2008;2(12):1391-400.

72. Basavaradhya Sahukar Shruthi PV, 1 and Selvamani2. Proteomics: A new perspective

for cancer. Adv Biomed Res 2016;5(67).

73. E. Boja TH, R. Rivers et al. Evolution of clinical proteomics and its role in medicine.

Journal of Proteome Research. 2011;10(1):66-84.

74. Kuster MBaB. Quantitative mass spectrometry in proteomics. Analytical and

Bioanalytical Chemistry. 2012;404(4):937-8.

75. Aebersold RM. M. Mass spectrometry-based proteomics. Nature. 2003;422:198-207.

76. Bantscheff M, Schirle, M., Sweetman, G., Rick, J. & Küster, B. . Quantitative mass

spectrometry in proteomics: a critical review. Anal Bioanal Chem. 2007;389:1017-31.

77. Albar LMaJP. Differential proteomics: An overview of gel and non gel based

approaches. BRIEFINGS IN FUNCTIONAL GENOMICS AND PROTEOMICS.

2004;3(3):220-39.

78. Wiese S1 RK, Meyer HE, Warscheid B. Protein labeling by iTRAQ: a new tool for

quantitative mass spectrometry in proteome research. Proteomics 2007;7(3):340-50.

79. W. W. Wu GW, S. J. Baek, and R. F. Shen,. Comparative study of three proteomic

quantitative methods, DIGE, cICAT, and iTRAQ, using 2D gel- or LC-MALDI TOF/TOF.

Journal of Proteome Research. 2006;5(3):651-8.

80. Furuta M WR, Vortmeyer AO, Huang S, Lei J, Huang TN, Lee YS, Bhowmick DA,

Lubensky IA, Oldfield EH, Zhuang Z. . Protein patterns and proteins that identify subtypes of

glioblastoma multiforme. . Oncogene. 2004;23:6806-14.

81. Khwaja FW1 RM, Olson JJ, Schmotzer BJ, Gillespie GY, Guha A, Groves MD, Kesari

S, Pohl J, Van Meir EG. Proteomic identification of biomarkers in the cerebrospinal fluid (CSF)

of astrocytoma patients. Journal of proteome research. 2007;6(2):559-70.

82. Uros Rajcevic‡ KP, Jaco C. Knol¶, Maarten Loos,,Se´ bastien Bougnaud, Oleg

Klychnikov,KaWan L, Thang V. Pham, Jian Wang, Hrvoje Miletic, Zhao Peng, Rolf Bjerkvig,

Connie R. Jimenez, and Simone P. Niclou. iTRAQ-based Proteomics Profiling Reveals

Increased Metabolic Activity and Cellular Cross-talk in Angiogenic Compared with Invasive

Glioblastoma Phenotype. Molecular & Cellular Proteomics 811. 2009.

83. de Saldanha da Gama Fischer J1 CCP, da Fonseca CO, Liao L, Degrave WM, da Gloria

da Costa Carvalho M, Yates JR, Domont GB. Chemo-resistant protein expression pattern of

glioblastoma cells (A172) to perillyl alcohol. Journal of Proteome Research. 2011;10(1):153-

60.

84. Emmanuelle Com AC, Mélanie Lagarrigue, Sophie Michalak, Philippe Menei, Charles

Pineau. Quantitative proteomic Isotope-Coded Protein Label (ICPL) analysis reveals alteration

of several functional processes in the glioblastoma. Journal of Proteomics. 2012; 75(13):3898-

913.

85. Polisetty RV, Gautam P, Sharma R, Harsha HC, Nair SC, Gupta MK, et al. LC-MS/MS

analysis of differentially expressed glioblastoma membrane proteome reveals altered calcium

signaling and other protein groups of regulatory functions. Molecular & cellular proteomics :

REFERENCES

116

MCP. 2012 Jun;11(6):M111 013565. PubMed PMID: 22219345. Pubmed Central PMCID:

3433906.

86. Poonam Gautam. SCN, Manoj Kumar Gupta, Rakesh Sharma, Ravindra Varma

Polisetty, Megha S. Uppin, Challa Sundaram, Aneel K. Puligopu, Praveen Ankathi, Aniruddh

K. Purohit, Giriraj R. Chandak, H. C. Harsha, Ravi Sirdeshmukh. Proteins with Altered Levels

in Plasma from Glioblastoma Patients as Revealed by iTRAQ-Based Quantitative Proteomic

Analysis. PLoS One. 2012 August 22;7 (9).

87. Lescarbeau RS, Lei L, Bakken KK, Sims PA, Sarkaria JN, Canoll P, et al. Quantitative

Phosphoproteomics Reveals Wee1 Kinase as a Therapeutic Target in a Model of Proneural

Glioblastoma. Molecular Cancer Therapeutics. 2016;15(6):1332-43.

88. Aquino PF, Carvalho, P. C., Nogueira, F. C., da Fonseca, C. O. et al. A Time-Based

and Intratumoral Proteomic Assessment of a Recurrent Glioblastoma Multiforme. Frontiers in

oncology. 2016;6:183. PubMed PMID: 27597932. Pubmed Central PMCID: 4992702.

89. Rajaraman R et. al. Stem cells, senescence, neosis and self-renewal in cancer. Cancer

Cell Int 2006.

90. Lathia J.D. VM, Rao M.S., Rich J.N. . Seeing is believing: Are cancer stem cells the

loch ness monster of tumor biology? . Stem Cell Rev. 2011;7:227–37.

91. Dittmar T, Nagler C, Niggemann B, Zanker KS. The dark side of stem cells: triggering

cancer progression by cell fusion. Current molecular medicine. 2013 Jun;13(5):735-50.

PubMed PMID: 23642055.

92. Rycaj K. TDG. Cell-of-origin of cancer versus cancer stem cells: Assays and

interpretations. Cancer Res,. 2015:4003–11.

93. Adorno-Cruz V. KG, Liu X., Doherty M., Junk D.J., Guan D., Hubert C., Venere M.,

Mulkearns-Hubert E., Sinyuk M., et al. Cancer stem cells: Targeting the roots of cancer, seeds

of metastasis, and sources of therapy resistance. . Cancer Res,. 2015;75:924–9.

94. al. GRe. Isolation and characterization of tumorigenic, stem-like neural precursors from

human glioblastoma. . Cancer Res,. 2004;64:7011-21.

95. al. FCMe. Human breast cancer cell lines contain stem-like cells that self-renew, give

rise to phenotypically diverse progeny and survive chemotherapy. . Breast Cancer Res.

2008;10.

96. al. CJe. A restricted cell population propagates glioblastoma growth after

chemotherapy. . Nature. 2012;488:522 - 6.

97. al. EPe. The role of cancer stem cells in breast cancer initiation and progression:

potential cancer stem cell-directed therapies. Oncologist 2012;17:1394-401.

98. Nowak MJFHA. Glioblastoma stem-like cells: at the root of tumor recurrence and a

therapeutic target Carcinogenesis. 2015;36(2):177-85.

99. Bao S WQ, McLendon RE, et al. . Glioma stem cells promote radioresistance by

preferential activation of the DNA damage response. . Nature. 2006;444:756-60.

100. Peter Wend JDH, Ulrike Ziebold, Walter Birchmeier. Wnt signaling in stem and cancer

stem cells. Seminars in Cell & Developmental Biology. October 2010;21(8):855-63.

101. al. TNe. Targeting cancer stem cells by inhibiting Wnt, Notch, and Hedgehog pathways.

. Nat Rev Clin Oncol. 2011;8:97-106.

102. Johannes Möst LS, Gertraud Mayr, Annette Gasser, Alessandra Sarti and Manfred P.

Dierich. Formation of Multinucleated Giant Cells In Vitro Is Dependent on the Stage of

Monocyte to Macrophage Maturation. Blood. 1997;89:662-71.

103. Kawano H KT, Sato K , Goya T , Arikawa S , Wakisaka S Immunohistochemical

study of giant cell in glioblastoma. Clinical Neuropathology. 1995;14:118-23.

104. Hosaka Mea. Giant cell formation through fusion of cells derived from a human giant

cell tumor of tendon sheath. G J Orthop Sci. 2004;9:581-4.

REFERENCES

117

105. Eom YWet a. Two distinct modes of cell death induced by doxorubicin: apoptosis and

cell death through mitotic catastrophe accompanied by senescence-like phenotype. Oncogene.

2005;24:4765-77.

106. Barok Met a, R46. Trastuzumab-DM1 causes tumour growth inhibition by mitotic

catastrophe in trastuzumab-resistant breast cancer cells in vivo. . Breast Cancer Res,. 2011;13.

107. Weihua Zet a. Formation of solid tumors by a single multinucleated cancer cell. Cancer.

2011;117:4092-9.

108. Hirai H, Arai T, Okada M, Nishibata T, Kobayashi M, Sakai N, et al. MK-1775, a small

molecule Wee1 inhibitor, enhances anti-tumor efficacy of various DNA-damaging agents,

including 5-fluorouracil. Cancer biology & therapy. 2010 Apr 1;9(7):514-22. PubMed PMID:

20107315.

109. Kaur E, Goda, J.S., Ghorai, A. et al. . Cell Oncol. 2018.

110. Suk K. Proteomic analysis of chemoresistance in glioblastoma. Current

Neuropharmacology. 2012 (10):72-9.

111. McBride WH, Iwamoto KS, Syljuasen R, Pervan M, Pajonk F. The role of the

ubiquitin/proteasome system in cellular responses to radiation. Oncogene. 2003 Sep

01;22(37):5755-73. PubMed PMID: 12947384.

112. Baugh JM, Viktorova EG, Pilipenko EV. Proteasomes can degrade a significant

proportion of cellular proteins independent of ubiquitination. Journal of molecular biology.

2009 Feb 27;386(3):814-27. PubMed PMID: 19162040. Pubmed Central PMCID: 2649715.

113. Pahl HL. Activators and target genes of Rel/NF-kB transcription factors. Oncogene.

1999;18.

114. Songrong Ren MJS, Iuri D Louro, Peggy McKie-Bell et al. The p44S10 locus, encoding

a subunit of the proteasome regulatory particle, is amplified during progression of cutaneous

malignant melanoma. Oncogene. 2000;19:1419-27.

115. Chen L MK. Increased proteasome activity, ubiquitin-conjugating enzymes, and

eEF1A translation factor detected in breast cancer tissue. Cancer Research. 2005;1(65):5599-

606.

116. Rho JH QS, Wang JY, Roehrl MH. Proteomic expression analysis of surgical human

colorectal cancer tissues: up-regulation of PSB7, PRDX1, and SRP9 and hypoxic adaptation

in cancer. Journal of Proteome Research. 2008;7(7):2959-72.

117. A Arlt IB, C Schafmayer, J Tepel, S Sebens Müerköster et al. Increased proteasome

subunit protein expression and proteasome activity in colon cancer relate to an enhanced

activation of nuclear factor E2-related factor 2 (Nrf2). Oncogene. 2009;28:3983–96.

118. Della Donna LC, Pajonk F. Radioresistance of prostate cancer cells with low

proteasome activity. The Prostate. 2012;1(72):868-74.

119. Smith L1 QO, Watson MB, Beavis AW, Potts D, Welham KJ, Garimella V, Lind MJ,

Drew PJ, Cawkwell L. Proteomic identification of putative biomarkers of radiotherapy

resistance: a possible role for the 26S proteasome? Neoplasia 2009;11(11):1194-207.

120. The UniProt C. UniProt: the universal protein knowledgebase. Nucleic acids research.

2017 Jan 04;45(D1):D158-D69. PubMed PMID: 27899622. Pubmed Central PMCID:

5210571.

121. Monika A. Jarzabek PCH, Kai O. Skaftnesmo, Emmet McCormack, Patrick Dicker,

Jochen H.M. Prehn, Rolf Bjerkvig, and Annette T. Byrne. In Vivo Bioluminescence Imaging

Validation of a Human Biopsy–Derived Orthotopic Mouse Model of Glioblastoma

Multiforme. Molecular Imaging. 2013 May 12.

122. Burger AM, Seth AK. The ubiquitin-mediated protein degradation pathway in cancer:

therapeutic implications. European journal of cancer. 2004 Oct;40(15):2217-29. PubMed

PMID: 15454246.

REFERENCES

118

123. Pajonk F, van Ophoven A, Weissenberger C, McBride WH. The proteasome inhibitor

MG-132 sensitizes PC-3 prostate cancer cells to ionizing radiation by a DNA-PK-independent

mechanism. BMC Cancer. 2005 Jul 07;5:76. PubMed PMID: 16001975. Pubmed Central

PMCID: 1177933.

124. Qureshi N, Morrison DC, Reis J. Proteasome protease mediated regulation of cytokine

induction and inflammation. Biochimica et biophysica acta. 2012 Nov;1823(11):2087-93.

PubMed PMID: 22728331. Pubmed Central PMCID: 3465503.

125. Livneh I, Cohen-Kaplan V, Cohen-Rosenzweig C, Avni N, Ciechanover A. The life

cycle of the 26S proteasome: from birth, through regulation and function, and onto its death.

Cell research. 2016 Aug;26(8):869-85. PubMed PMID: 27444871. Pubmed Central PMCID:

4973335.

126. Pervan M IK, McBride WH. Proteasome Structures Affected by Ionizing Radiation.

Molecular Cancer Research. 2005.

127. Pajonk Fea. Ionizing radiation affects 26s proteasome function and associated

molecular responses, even at low doses. Radiotherapy and Oncology. 2001.

128. Tamari K, Hayashi K, Ishii H, Kano Y, Konno M, Kawamoto K, et al. Identification of

chemoradiation-resistant osteosarcoma stem cells using an imaging system for proteasome

activity. International journal of oncology. 2014 Dec;45(6):2349-54. PubMed PMID:

25269626.

129. Della Donna L, Lagadec C, Pajonk F. Radioresistance of prostate cancer cells with low

proteasome activity. Prostate. 2012 Jun 01;72(8):868-74. PubMed PMID: 21932424. Pubmed

Central PMCID: 3396561.

130. Smith L QO, Watson MB, Beavis AW, Potts D, Welham KJ, Garimella V, Lind MJ,

Drew PJ, Cawkwell L. Proteomic Identification of Putative Biomarkers of Radiotherapy

Resistance: A Possible Role for the 26S Proteasome? Neoplasia. 2009.

131. Crawford LJ, Walker B, Irvine AE. Proteasome inhibitors in cancer therapy. Journal of

cell communication and signaling. 2011 Jun;5(2):101-10. PubMed PMID: 21484190. Pubmed

Central PMCID: 3088792.

132. Teicher BA, Tomaszewski JE. Proteasome inhibitors. Biochemical pharmacology.

2015 Jul 01;96(1):1-9. PubMed PMID: 25935605.

133. Ahmed KM, Li JJ. NF-kappa B-mediated adaptive resistance to ionizing radiation. Free

radical biology & medicine. 2008 Jan 01;44(1):1-13. PubMed PMID: 17967430. Pubmed

Central PMCID: 2266095.

134. Cahill KE, Morshed RA, Yamini B. Nuclear factor-kappaB in glioblastoma: insights

into regulators and targeted therapy. Neuro-oncology. 2016 Mar;18(3):329-39. PubMed PMID:

26534766. Pubmed Central PMCID: 4767244.

135. A A. 14-3-3 proteins: a historic overview. Semin Cancer Biol. 2006 Jun;16(3):162-72.

136. Boston PF, Jackson, P., & Thompson, R. J. . Human 14‐3‐3 Protein:

Radioimmunoassay, Tissue Distribution, and Cerebrospinal Fluid Levels in Patients with

Neurological Disorders. . Journal of neurochemistry. 1982;38(1475-1482).

137. Moore BW PV. In: Physiological and biochemical aspects of nervous integration.

Carlson F, editor Englewood Cliffs, New Jersey: Prentice-Hall. 1967:343–59.

138. Chaudhri M SM, Aitken A Mammalian and yeast 14-3-3 isoforms form distinct patterns

of dimers in vivo. Biochem Biophys Res Commun. 2003 (300:):679–85.

139. Jones DH LS, Aitken A. Isoforms of 14-3-3 protein can form homo- and heterodimers

in vivo and in vitro: implications for function as adapter proteins. FEBS Lett 1995;368(1):55-

8.

140. A.K. Gardino ea. Structural determinants of 14-3-3 binding specificities and regulation

of subcellular localization of 14-3-3-ligand complexes: a comparison of the X-ray crystal

structures of all human 14-3-3 isoforms. Semin Cancer Biol. 2006;16:173-82.

REFERENCES

119

141. Xiaowen Yang ea. Structural basis for protein–protein interactions in the 14-3-3 protein

family. PNAS. 2006 November 14;103(46):17237-42.

142. Muslin AJ, Tanner, J. W., Allen, P. M., and Shaw, A. S. . Interaction of 14-3-3 with

signaling proteins is mediated by the recognition of phosphoserine. . Cell 1996;84(889-897).

143. Yaffe MB RK, Volinia S, Caron PR, Aitken A, Leffers H, Gamblin SJ, Smerdon SJ,

Cantley LC. The structural basis for 14-3-3:phosphopeptide binding specificity. Cell. 1997 Dec

26;91(7):961-71.

144. Dougherty MK, & Morrison, D. K. Unlocking the code of 14-3-3. Journal of cell

science. 2004;117(10):1875-84.

145. Matta A, DeSouza, L. V., Shukla, N. K., Gupta, S. D., Ralhan, R., & Siu, K. M. .

Prognostic Significance of Head-and-Neck Cancer Biomarkers Previously Discovered and

Identified Using iTRAQ-Labeling and Multidimensional Liquid Chromatography− Tandem

Mass Spectrometry. . Journal of proteome research. 2008;7(5):2078-87.

146. Lin M, Morrison, C. D., Jones, S., Mohamed, N., Bacher, J., & Plass, C. . Copy number

gain and oncogenic activity of YWHAZ/14‐3‐3ζ in head and neck squamous cell carcinoma. .

International journal of cancer. 2009;125(3):603-11.

147. Macha MA, Matta, A., Chauhan, S. S., Siu, K. M., & Ralhan, R. 14-3-3 zeta is a

molecular target in guggulsterone induced apoptosis in head and neck cancer cells. . BMC

cancer. 2010;10(1).

148. Klemm C, Dommisch, H., Göke, F., Kreppel, M., Jepsen, S., Rolf, F., & Standop, J.

Expression profiles for 14-3-3 zeta and CCL20 in pancreatic cancer and chronic pancreatitis. .

Pathology-Research and Practice. 2014;210(6):335-41.

149. Jin LM, Han, X. H., Jie, Y. Q., & Meng, S. S. 14-3-3ζ silencing retards tongue

squamous cell carcinoma progression by inhibiting cell survival and migration. . Cancer gene

therapy. 2016;23(7).

150. Yang X, Cao, W., Zhou, J., Zhang, W., Zhang, X., Lin, W., & Wang, B. 14-3-3zeta

positive expression is associated with a poor prognosis in patients with glioblastoma.

Neurosurgery. 2011;68(4):932-9385.

151. Cao W. 14-3-3zeta positive cells show more tumorigenic characters in human

glioblastoma. Turk Neurosurg,. 2016;26(6):813-7.

152. Péricles Arruda MLF, SouzabGecioni et al. A study of the relative importance of the

peroxiredoxin-, catalase-, and glutathione-dependent systems in neural peroxide metabolism.

Free Radical Biology and Medicine. 2011;51(1):69-77.

153. Vajira K. Weerasekara aDJP, a David G. Broadbent,a Jeffrey B. Mortenson,a Andrew

D. Mathis,a Gideon N. Logan,a, John T. Prince aDMT, b J. Will Thompson,c Joshua L.

Andersena. Metabolic-Stress-Induced Rearrangement of the 14-3-3 Interactome Promotes

Autophagy via a ULK1- and AMPK-Regulated 14-3-3 Interaction with Phosphorylated Atg9.

Molecular and Cellular Biology 2014;24:4379 – 88.

154. Zenggang Li JZ, Yuhong Du, Hae Ryoun Park, Shi-Yong Sun, Leon Bernal-Mizrachi,

Alastair Aitken, Fadlo R. Khuri, and Haian Fu. Down-regulation of 14-3-3ζ suppresses

anchorage-independent growth of lung cancer cells through anoikis activation. PNAS

2008;105:162-7.

155. Jing Lu HG, Warapen Treekitkarnmongkol, Ping Li, Jian Zhang, Bin Shi, Chen Ling,

Xiaoyan Zhou, Tongzhen Chen, Paul J. Chiao, Xinhua Feng, Victoria L. Seewaldt, William J.

Muller, Aysegul Sahin, Mien-Chie Hung,and Dihua Yu. 14-3-3ζ Cooperates with ErbB2 to

Promote Progression of Ductal Carcinoma in Situ to Invasive Breast Cancer by Inducing

Epithelial-Mesenchymal Transition. Cancer Cell. 2009;16(3):195-207.

156. Sarah E. M. Meek WSLaHP-W. Comprehensive Proteomic Analysis of Interphase and

Mitotic 14-3-3-binding Proteins. Journal of biochemistry. 2004.

REFERENCES

120

157. Rune Kleppea AM, Stein Ove Døskeland, Jan Haavik. The 14-3-3 proteins in regulation

of cellular metabolism. Seminars in Cell & Developmental Biology. 2011;22(7):713-9.

158. Simone M. Schoenwaelder RD, Susan L. Cranmer, Hayley S. Ramshaw et al. 14-3-3ζ

regulates the mitochondrial respiratory reserve linked to platelet phosphatidylserine exposure

and procoagulant function. Nature communications. 2016;7.

159. Ming Chen HH, Haojie He, Wantao Ying, Xin Liu, Zhiqin Dai, Jie Yin, Ning Mao,

Xiaohong Qian and Lingya Pan. Quantitative proteomic analysis of mitochondriafrom human

ovarian cancer cells and theirpaclitaxel-resistant sublines. Cancer Science. 2015 106:1075-108.

121

7 Appendix

APPENDIX

122

Appendix I

Gene Name Sequence

SURVIVIN FORWARD TCCACTGCCCCACTGAGAAC

REVERSE TGGCTCCCAGCCTTCCA

BCL-XL FORWARD GATCCCCATGGCAGCAGTAAAGCAAG

REVERSE CCCCATCCCGGAAGAGTTCATTCACT

BIRC3 FORWARD TATGTGGGTAACAGTGATGA

REVERSE GAAACCACTTGGCATGTTGA

P21 FORWARD GACACCACTGGAGGGTGACT

REVERSE ACAGGTCCACATGGTCTTCC

RHOC FORWARD AAGGATCAGTTTCCGGAGGT

REVERSE TAGTCTTCCTGCCCTGCTGT

RAC1 FORWARD AACCAATGCATTTCCTGGAG

REVERSE TCCCATAAGCCCAGATTCAC

CDC42 FORWARD ACGACCGCTGAGTTATCCAC

REVERSE CCCAACAAGCAAGAAAGGAG

VASP FORWARD GAAAACCCCCAAGGATGAAT

REVERSE GTTCTTCTCCCAGGGTCTCC

FLNB FORWARD CTGAGAGCCCACTCCAGTTC

REVERSE GGTGAAGGTGGCAGTTTTGT

RhoA FORWARD AAGGACCAGTTCCCAGAGGT

REVERSE GCTTTCCATCCACCTCGATA

FN1 FORWARD TGGCCAGTCCTACAACCAGT

REVERSE CGGGAATCTTCTCTGTCAGC

PPP1R12A FORWARD GTTCCTACGGCAGTGACCAT

REVERSE GATCTGCGTCTCTCCCTGAC

ITGB5 FORWARD TGCCTTGCTTGGAGAGAAAT

REVERSE AATCTCCACCGTTGTTCCAG

PSMB5 FORWARD TCATGGATCGGGGCTATTCC

REVERSE GGTAGAGGTTGACTGCACCT

PSMB6 FORWARD TATCATGGCCGTGCAGTTTG

REVERSE AGGTGTCAGCTTGTCAGTCA

PSMB7 FORWARD CTGGCATCTTCAACGACCTG

REVERSE ACTGTGTATGGGCGGAGAAA

PSMB8 FORWARD ACGTGGATGAACATGGGACT

REVERSE ATAGCCACTGTCCATGACCC

PSMB9 FORWARD TTCACCACAGACGCTATTGC

REVERSE ACACCGGCAGCTGTAATAGT

PSMB10 FORWARD CAAGAGCTGCGAGAAGATCC

REVERSE AACGCGTGTAGCTCCATCTT

IKB-α FORWARD CATCGTGGAGCTTTTGGTGTC

REVERSE AGCCCCACACTTCAACAGGAG

APPENDIX

123

COX 2 FORWARD TCCCTGAGCATCTACGGTTTG

REVERSE GTCTGGAACAACTGCTCATCAC

NOX 4 FORWARD GCAGAGTTTACCCAGCACAA

REVERSE CAAAGCCAAGTCTGTGGAAA

P 16 FORWARD GAGCAGCATGGAGCCTTC

REVERSE CATCATGACCTGGATCGG

SOD 2 FORWARD ACCGAGGAGAAGTACCAGGA

REVERSE CTTCAGTGCAGGCTGAAGAG

124

8 Publications

Oncotarget27667www.oncotarget.com

Enhanced proteasomal activity is essential for long term survival and recurrence of innately radiation resistant residual glioblastoma cells

Jacinth Rajendra1,7, Keshava K. Datta2, Sheikh Burhan Ud Din Farooqee3,7, Rahul Thorat5, Kiran Kumar2, Nilesh Gardi4, Ekjot Kaur1,7, Jyothi Nair1,7, Sameer Salunkhe1,7, Ketaki Patkar1, Sanket Desai4,7, Jayant Sastri Goda8, Aliasgar Moiyadi6, Amit Dutt4,7, Prasanna Venkatraman3,7, Harsha Gowda2 and Shilpee Dutt1,7

1Shilpee Dutt Laboratory, Tata Memorial Centre, Advanced Centre for Treatment, Research and Education in Cancer (ACTREC), Kharghar, Navi Mumbai, India

2Institute of Bioinformatics, International Technology Park, Bangalore, India3Advanced Centre for Treatment, Research and Education in Cancer (ACTREC), Tata Memorial Centre (TMC), Kharghar, Navi Mumbai, India

4Integrated Genomics Laboratory, Advanced Centre for Treatment, Research and Education in Cancer, Tata Memorial Centre, Navi Mumbai, Maharashtra, India

5Laboratory Animal Facility, Advanced Centre for Treatment, Research and Education in Cancer (ACTREC), Tata Memorial Centre (TMC), Kharghar, Navi Mumbai, India

6Department of neurosurgery Tata Memorial Centre, Advanced Centre for Treatment, Research and Education in Cancer, Navi Mumbai, India

7Homi Bhabha National Institute, Training School Complex, Anushakti Nagar, Mumbai, India8Department of Radiation Oncology, Tata Memorial Centre, Advanced Centre for Treatment, Research and Education in Cancer, Navi Mumbai, India

Correspondence to: Shilpee Dutt, email: [email protected]

Keywords: glioblastoma; radio-resistant cells; recurrence; proteomic analysis; proteasomes

Received: August 28, 2017 Accepted: April 25, 2018 Published: June 12, 2018Copyright: Rajendra et al. This is an open-access article distributed under the terms of the Creative Commons Attribution License 3.0 (CC BY 3.0), which permits unrestricted use, distribution, and reproduction in any medium, provided the original author and source are credited.

ABSTRACT

Therapy resistance and recurrence in Glioblastoma is due to the presence of residual radiation resistant cells. However, because of their inaccessibility from patient biopsies, the molecular mechanisms driving their survival remain unexplored. Residual Radiation Resistant (RR) and Relapse (R) cells were captured using cellular radiation resistant model generated from patient derived primary cultures and cell lines. iTRAQ based quantitative proteomics was performed to identify pathways unique to RR cells followed by in vitro and in vivo experiments showing their role in radio-resistance. 2720 proteins were identified across Parent (P), RR and R population with 824 and 874 differential proteins in RR and R cells. Unsupervised clustering showed proteasome pathway as the most significantly deregulated pathway in RR cells. Concordantly, the RR cells displayed enhanced expression and activity of proteasome subunits, which triggered NFkB signalling. Pharmacological inhibition of proteasome activity led to impeded NFkB transcriptional activity, radio-sensitization of RR cells in vitro, and significantly reduced capacity to form orthotopic tumours in vivo. We demonstrate that combination of proteasome inhibitor with radio-therapy abolish the inaccessible residual resistant cells thereby preventing GBM recurrence. Furthermore, we identified first proteomic signature of RR cells that can be exploited for GBM therapeutics.

www.oncotarget.com Oncotarget, 2018, Vol. 9, (No. 45), pp: 27667-27681

Research Paper

Oncotarget27668www.oncotarget.com

INTRODUCTION

Glioblastoma is the most common and lethal primary brain tumour. Despite the multimodal therapy, tumour recurrence is major challenge in glioblastoma with patient survival less than 6 months post recurrence [1–4]. Recurrence in GBM is attributed to a subpopulation of cells that survive initial therapies and cause tumour re-growth [5, 6]. However, targeting residual resistant cells of glioma is challenging since they are invisible in MRIs post initial treatment and they are inaccessible from the patient biopsies for biological studies [7, 8]. We have previously reported development of a cellular model of radiation resistance using primary cultures from patient samples, which recapitulate the clinical scenario of resistance and enable us to capture residual radiation resistant (RR) cells [9] and understand their molecular mechanism of survival.

Since proteins are the ultimate biological effectors of the cells, in this study we have analyzed the total proteome of residual resistant cells of glioma [10–13]. Till date majority of proteomics studies in glioblastoma have focused on identification of differential proteins amongst different GBM cell lines, patient samples or within the same tumour to investigate the heterogeneity of glioblastoma, mechanism of chemoresistance and identification of diagnostic biomarkers [14–26]. However, none of these studies could identify survival mechanism of innately resistant cells due to their unavailability. This is the first report to identify the proteomic signature of residual resistant and the relapse cells of glioblastoma from cellular model. Data revealed a unique proteomic signature of RR and R cells with utmost clustering of deregulated genes uniquely in the RR cells. Contrary to previous reports which have shown a decrease in proteasome activity in radio resistant cells [27, 28], our data reveals that innately radio resistant GBM cells harbour increased expression of proteasomal subunits, enhanced proteasome activity and increased levels of proteasome substrate p-NFkB and concordant increase of NFkB target genes. We demonstrate pharmacological inhibition of proteasomal activity reduces NFkB transcriptional activity and radio sensitizes RR cells. Furthermore absence of proteasome activity in RR cells also significantly decreases their ability to form tumours in vivo. Together, our proteomics data has delineated proteasomal pathway as one of the plausible targetable mechanisms that significantly contribute to the survival of innate radiation residual cells via the NFkB signalling cascade.

RESULTS

Capturing innate radiation resistant (RR) and Relapse (R) cells from in vitro radiation resistant model

To capture and understand the survival mechanisms of residual resistant cells of GBM, that

are diagnostically undetectable post treatment, we generated in vitro radiation resistant model derived from cell lines and patient samples [9] (Figure 1A). Using the same protocol, in this study first the glioblastoma cell lines (SF268 and U87MG) and two short term primary cultures of patient samples (PS1 and PS2) were subjected to their respective lethal dose of radiation (6.5 Gy, 8 Gy, 6 Gy, 6.5 Gy) as determined previously using clonogenic assay [9]. Post treatment initially the cells proliferate, but after 4–5 days post treatment more than 90% cells died leaving behind a small population (<10%) surviving cells. These cells are the innately radiation resistant residual cells (RR) which remain viable but non-proliferative for approximately 7–10 days and acquire Multinucleated Giant (MNGCs) phenotype. However, instead of undergoing mitotic catastrophe, RR cells resume growth to form the relapse (R) population. Figure 1B shows graphs for SF268 and PS1 growth pattern of RR cells. The parent (P), innately radiation resistant (RR) and relapse (R) cells obtained from SF268 were then subjected to quantitative proteomic analysis. The three populations obtained from U87MG, PS1 and PS2 were used for validation and functional studies.

Quantitative proteomic analysis radio resistant (RR) and relapse (R) cells

iTRAQ based quantitative proteomic analysis was performed on parent, RR and R cell population of SF268. Figure 1C illustrates the proteomics workflow. Equal amounts of protein from the Parent, RR and R populations was digested with trypsin and their tryptic peptides were labelled with 114, 115 and 116 isobaric reagents respectively for differential protein expression analysis. The iTRAQ-labelled peptide samples were pooled, fractionated and analyzed by LC-MS/MS. The data obtained was searched against National Centre for Biotechnology Information RefSeq database (version 52 40) using Protein Discoverer (version 1.4) using MASCOT and SEQUEST. Compared to parent cells 824 proteins were found to be differentially expressed in RR cells compared to parent cells out of which 393 proteins were up-regulated (fold change >1.5) and 431 proteins were downregulated (fold change <0.7) while 874 proteins were differentially expressed in relapse population of which 352 proteins were up-regulated (>1.5) and 522 proteins were downregulated (<0.7). 1,392 proteins were differentially regulated in R vs. RR out of which 747 proteins were upregulated (>1.5) and 645 were downregulated (<0.7) in the R population (Figure 1D). iTRAQ data was validated by analysing the expression levels of HRAS, EGFR, YBX3 (Figure 2A). Relative peptide intensity values of the three proteins from mass spectrometry showed concurrent expression with the western blot data (Figure 2B).

Oncotarget27669www.oncotarget.com

Unsupervised clustering of proteomics data identifies protein clusters uniquely differential in each population

Since a cell’s phenotype is an outcome of a collective network of biological processes, it was hypothesized that proteins showing similar expression pattern will participate in similar biological processes. Therefore, we first identified the proteins showing co-expression, for which unique master differential gene list was compiled the at least one of the three binary comparison (RR Vs. P, R Vs. P, R Vs. RR) which comprise of 1773 genes. Unsupervised clustering was performed for these genes based on their respective relative protein abundance values as represented in a heat map. The expression pattern of each cluster is illustrated as a line plot (Figure 2C). Analysis segregated the data set into five clusters (C1-C5) out

of which two major clusters, cluster 2 and cluster 3 represented proteins that were exclusively enriched with uniquely downregulated and upregulated proteins in the RR population, respectively. Cluster 2 represents 783 proteins and Cluster 3 represents 641 proteins. Clusters 1, 4 and 5 comprised of proteins that showed similar expression pattern in RR and R cells. 134 proteins were found to be downregulated in the RR and R as compared to the parent cells (cluster 1). The expression of 165 proteins remains at a basal level in the P and RR population however their expression declines in the R cells (cluster 4) and 70 proteins show an escalation in expression in the RR and R as compared to the P cells (cluster 5). Since we were interested to know how the RR cells survive, we focused on the proteins classified in cluster 2 and cluster 3 which comprised of proteins uniquely downregulated and upregulated in the RR cells, respectively.

Figure 1: In vitro radiation resistant model. (A) The illustration depicts the clinical scenario in patient’s pre and post treatment in which post-surgery there is a significant regression or complete abolishment of the tumor observed. However, in >90% cases tumor recurs. This clinical scenario was recapitulated in an in vitro model. The images represent the SF268 Parent, innate Radiation Resistant (RR) enriched with multinucleated giant cells (MNGCs) and Relapse (R) population. (B) Graph represents the growth kinetics of SF268 and Patient Sample post lethal dose of radiation. (C) A schematic representation of the proteomics workflow. (D) Graphical representation of the number of differential proteins identified in the RR and R w.r.t P and R w.r.t RR by the proteomic analysis. Results in each bar graph are the composite data from three independent experiments performed in triplicate (mean ± SEM)

Oncotarget27670www.oncotarget.com

Pathway analysis reveals deregulation of proteasome and protein turnover machinery proteins in RR population

To analyze the molecular pathway that might be involved in the survival and radiation resistance mechanisms of RR cell, pathway enrichment analysis of the deregulated proteins in RR population compared to parent population in cluster 2 and cluster 3 was done using KEGG and REACTOME database (Figure 2D). In total 42 pathways were deregulated in cluster 2, 33 pathways were deregulated in cluster 3. Interestingly, 11 pathways were commonly deregulated in both cluster 2 and 3 (Figure 2E). These pathways included glutathione metabolism, ribosome biogenesis in eukaryotes, RNA transport, spliceosome, and proteasome, protein processing in endoplasmic reticulum, regulation of actin cytoskeleton, non-alcoholic fatty liver disease (NAFLD), Alzheimer’s disease, Huntington’s disease and Epstein - Barr virus infection. Additionally, gene ontology and enrichment analysis of the entire differential proteins found in the RR compared to the parent cells, revealed 24 pathways enriched with upregulated (red circle) and downregulated proteins (green circle). Of these, 8 pathways were enriched with upregulated proteins and 16 pathways were enriched with downregulated proteins (Figure 3A). Out of the 8 pathways that were enriched with upregulated proteins, 5 statistically significant (Term P value < 0.05) pathways included Proteasome (8 proteins), Ubiquitin mediated proteolysis (10 proteins), Protein processing in Endoplasmic Reticulum (18 proteins), RNA Transport (17 proteins), oocyte meiosis (9 proteins). However, proteasome pathway was the most deregulated pathway based on the associated genes filter (k/K ratio). Proteomic analysis from three biological replicates also revealed significant deregulation of proteasome pathway in the RR population (Supplementary Figure 2 and Figure 3B). The data sets of all the replicates have been deposited to the ProteomeXchangeConsortium (http://proteomecentral.proteomexchange.org) via the PRIDE partner repository. The internal ID of submission is: px-submission #265394. A ProteomeXchange accession number will be generated after it has been loaded into the database. Proteasome subunits differential in all the four biological replicates have been represented in Table 1. Three subunits PSME1, PSMA7 and PSMB4 were used for validation by western blot (Figure 3C–3E).

RR cells display enhanced proteasome activity and survival dependency on proteasome activity in vitro

Since the RR population exhibited increased protein expression of proteasome subunits, we sought to observe if the expression correlated with proteasome activity. Therefore, proteasome activity was analysed

in the parent and RR cells of SF268, U87MG, PS1 and PS2 using florigenic substrate Suc-LLVY-Amc. Indeed the RR population of SF268, U87MG, PS1 and PS2 showed 22.18%, 35.60%, 20.63% and 71.63 % increase respectively in the proteasome activity compared to the parent cells (Figure 4A). Among the 9 subunits overexpressed in the RR, 3 subunits are part of the 19S regulatory subunit–PSMC1, PSMD2, PSMD7;3 subunits of the 20 S core particle–PSMA1, PSMA7, PSMB4 and 1 subunits of the 11 S regulatory subunits–PSME1. Most of the subunits belong to the classical proteasome. Hence the transcript levels of beta catalytic subunits: PSMB6 (β1- caspase like activity), PSMB7 (β2-trypsin-like activity) and PSMB5 (β5-chymotrypsin-like activity), were checked. PSMB6 transcript levels were elevated in the RR population of all the samples, PSMB7 and PSMB5 were elevated in at least one cell line and one patient sample. Proteomics data also identified a regulatory subunit of immunoproteasome (PSME1). Therefore, the mRNA levels of its catalytic subunits PSMB9, PSMB8 and PSMB10 were also determined (Figure 4B). However, the transcript levels of the three subunits were not significantly high in any of the samples.

Since the RR population exhibited increased proteasome activity we wanted to analyze if the survival of RR cells was dependent on the proteasome activity. For this we used bortezomib (BTZ), a pharmacological inhibitor of proteasome routinely used in the treatment of multiple myeloma. First we determined the concentration of bortezomib at which proteasome activity was maximally inhibited with minimal cellular toxicity. For this proteasome activity of SF268 was assessed after 12 h. treatment of bortezomib at different concentrations (0.01 nM to 1000 nM). As seen from Figure 4C, 10 nM of bortezomib was the minimum concentration at which significant inhibition of proteasome activity was observed and there was no significant cell death in RR as compared to parent. Once the non-toxic concentration of bortezomib on parent cells was determined, we wanted to see if the inhibition of proteasome sensitizes the glioma cells to radiation. SF268 and PS1 cells were treated for 12 hrs with 10 nM bortezomib and their % cell survival was recorded at different doses of radiation. As shown in Figure 4D, bortezomib treatment significantly reduced the D0 dose of radiation from 5.07 Gy to 3.12 Gy and 4.4 Gy to 1.08 Gy for SF268 and PS1 respectively, showing that proteasome inhibition radio sensitizes glioma cells. We then wanted to analyse the effect of bortezomib on RR population that have higher proteasome activity. For this the parent and RR population of SF268 and U87 were treated with 0.1 nM, 1 nM and 10 nM concentrations of bortezomib for 12 hrs. Following the treatment cells were monitored for proteasome activity. Both, parent and RR cells showed a gradual decrease in the activity of proteasomes with increasing concentration of the drug (Figure 5A and 5B). However, 72 hours post drug treatment RR cells were

Oncotarget27671www.oncotarget.com

significantly (8% SF268, 10% U87 and 23% PS1) more sensitive to proteasome inhibition compared to the parent population. PS2 showed similar % reduction in viability as compared to the parent population at 10 nM (Figure 5C).

Proteasomes indirectly regulate RR cell survival via the NFkB activation

We further wanted to determine if the proteasome targets were down-regulated in the RR population due to degradation via ubiquitin mediated proteasome pathway. Down regulated proteins were analysed for presence of annotated ubiquitin binding lysine residues. These proteins were downloaded from Uniprot database [29] and parsed using in-house python scripts to determine presence of curated ubiquitin binding sites. Of the 431 proteins, 14 proteins were found to harbour lysine residues which can undergo ubiquitin modification (Supplementary Figure 1). One of the well-known substrates of the 26 S proteasome

is IκB-α which upon degradation leads to the activation of the transcription factor NFkB. An increased proteasome activity should modulate the levels of activated NFkB in the RR population. Therefore, we checked for the levels of activated NFkB by western blot in the P and RR cells of cell lines and patient samples. Indeed, the RR cells displayed increased levels of activated NFkB in both the cell lines and PS1 (Figure 5D). Furthermore, the transcript levels of 9 NFkB target genes (TNF-α, IL6, IkB-a, IFN-γ, ICAM1, COX2, NOD4, p16, SOD2) were screened in RR cells of the cell lines and patient sample by real-time PCR. A heat map representation of the 9 genes depicts upregulation of at least 6 genes out of the 9 in SF268, U87 and PS1 which also harbour increased expression of phospho-NFkB suggesting the presence of a transcriptionally active NFkB in RR cells (Figure 5E). To directly assess the NFkB transcriptional activity in the RR cells of U87, we monitored the relative promoter activity of the luciferase based NFkB reporter constructs in the P and RR cells. The

Figure 2: Proteomic analysis of the parent, radiation resistant and relapse population. (A) Western blots showing the expression of HRas, EGFR, YBX3 in Parent (P), Radiation Resistant (RR) and Relapse (R) population of SF268 cell line. β-actin was used as loading control. (B) Bar plot of the relative peptide intensity values of the mentioned proteins in RR/P and R/P as determined by iTRAQ. (C) Heat map representation of unsupervised hierarchical clustering of the proteins based on their relative peptide intensities in R w.r.t RR, RR w.r.t P and R w.r.t P. Red- Up-regulation >1.5, Green- Down-regulation <0.5. Heat map is divided into clusters with a dotted plot representing the expression pattern of proteins in each cluster. (D) Pathway analysis of the Genes in cluster 2 and cluster were collapsed into pathways using ClueGo and CluePedia plugin of Cytoscape with KEGG and REACTOME pathway databases. Each coloured circle represents a pathway enriched with upregulated and downregulated protein in the RR cells but non-differential in the R cells. (E) Venn diagram for the overlap of pathways between cluster 2 and cluster 3

Oncotarget27672www.oncotarget.com

RR cells showed a significant increase (20 fold) in NFkB transcriptional activity as compared to the parent population (P). Importantly, administration of the proteasome inhibitor (Bortezomib) in the P and RR cells diminished this activity by 1.5 and 3.0 fold demonstrating the dependency of NFkB activity on the proteasome activity. A synergistic inhibitory effect was observed in the presence of IkB-alpha construct and bortezomib in the P and RR cells. However, the RR cells displayed a much higher reduction as compared to the P cells (Figure 5F).

Inhibition of proteasome activity inhibits tumour formation and in vivo

We have shown that radiation resistant residual (RR) cells formed in our in vitro radiation resistant model systems retain their tumorigenic potential and re-grow to give rise to recurrent tumour. We first wanted to analyze

if the RR cells are capable of forming tumour in vivo as well. For this pLenti6-luc2 U87MG cells [30] stably expressing luciferase were treated with the lethal dose of radiation 8Gy and RR cells were collected. The parent and RR cells were then stereo tactically injected in the brain of 6–8 weeks old NOD/SCID mice. Tumour growth was monitored using bioluminescence imaging. As seen from Figure 6A left panel and Figure 6C, RR cells were able to give rise to tumours and had greater tumorigenic potential as compared to the parent cells.

We then evaluated the effect of proteasome inhibition on the tumorigenicity of the parent and RR cells. Since U87MG cells showed higher proteasome activity than the SF268 (Figure 4A), hence they also required a higher concentration of bortezomib (50 nM) for reducing the viability of their RR. Therefore for in vivo studies U87MG parent and RR cells were treated with 50 nM bortezomib for 12 hrs prior to injection.

Figure 3: Deregulation of proteasome pathway in the radiation resistant population. (A) Pathway analysis of deregulated genes in Radiation Resistant (RR) vs. Parent (P) Genes deregulated in RR w.r.t P were collapsed into pathways using ClueGo and CluePedia plugin of Cytoscape with KEGG and REACTOME pathway databases. The colour gradient shows the number of genes of each group associated with the pathway. Equal proportions of the two clusters are represented in white. (B) KEGG pathways enriched with upregulated proteins according to their k/K ratio. k–Number of genes identified from the pathway, K–Total number of genes curated in the KEGG database for a pathway. (C) Western blot showing the expression of PSME1, PSMA7 and PSMB4 parent (P), Radiation Resistant (RR) and Relapse (R) cells of SF268. β-actin was used as loading control. (D) Band intensity plot for the proteins validated by western blot using IMAGE J software. (E) Shows the relative peptide intensity values of the three proteins from iTRAQ analysis.

Oncotarget27673www.oncotarget.com

Table 1: Represents the list of differential proteins identified in the proteasome pathwayREPLICATE 1Gene Symbol Protein Description Σ# Unique

PeptidesΣ#

PSMsFold Change

in RR/PPSME1 proteasome activator complex subunit 1 isoform 1 [Homo sapiens] 4 4 2.085PSMD7 26S proteasome non-ATPase regulatory subunit 7 [Homo sapiens] 3 6 1.977PSMA1 proteasome subunit alpha type-1 isoform 3 [Homo sapiens] 1 2 1.634PSMD2 26S proteasome non-ATPase regulatory subunit 2 [Homo sapiens] 9 12 1.632PSMA7 proteasome subunit alpha type-7 [Homo sapiens] 4 13 1.568PSMB4 proteasome subunit beta type-4 [Homo sapiens] 2 4 1.550PSMC1 26S protease regulatory subunit 4 [Homo sapiens] 6 10 1.518PSMA3 proteasome subunit alpha type-3 isoform 2 [Homo sapiens] 2 4 0.656PSMD14 26S proteasome non-ATPase regulatory subunit 14 [Homo sapiens] 3 4 0.593REPLICATE 2PSMD9 26S proteasome non-ATPase regulatory subunit 9 isoform 1 4 6 1.88PSMD10 26S proteasome non-ATPase regulatory subunit 10 isoform 1 6 9 1.523PSMC1 26S protease regulatory subunit 4 19 57 1.381PSMC6 26S protease regulatory subunit 10B 16 48 1.356PSMD8 26S proteasome non-ATPase regulatory subunit 8 10 21 1.356PSMA4 proteasome subunit alpha type-4 isoform 1 10 35 1.294PSME2 proteasome activator complex subunit 2 12 30 1.281PSMD13 26S proteasome non-ATPase regulatory subunit 13 isoform 1 19 47 1.243PSMD7 26S proteasome non-ATPase regulatory subunit 7 10 19 1.227PSMD12 26S proteasome non-ATPase regulatory subunit 12 isoform 1 22 44 1.207REPLICATE 3PSMD9 26S proteasome non-ATPase regulatory subunit 9 isoform 1 5 7 3.587PSMC5 26S protease regulatory subunit 8 isoform 1 21 54 1.525PSMB10 proteasome subunit beta type-10 precursor 1 1 1.445PSME2 proteasome activator complex subunit 2 9 29 1.41PSMD6 26S proteasome non-ATPase regulatory subunit 6 isoform 2 19 30 1.382PSMD4 26S proteasome non-ATPase regulatory subunit 4 12 27 1.362PSMA3 proteasome subunit alpha type-3 isoform 1 9 25 1.326PSMD8 26S proteasome non-ATPase regulatory subunit 8 9 19 1.321PSMC6 26S protease regulatory subunit 10B 18 52 1.318PSMD13 26S proteasome non-ATPase regulatory subunit 13 isoform 1 17 43 1.302PSMB7 proteasome subunit beta type-7 precursor 5 17 1.278PSMD2 26S proteasome non-ATPase regulatory subunit 2 isoform 1 31 74 1.257PSMD14 26S proteasome non-ATPase regulatory subunit 14 13 23 1.222PSMC4 26S protease regulatory subunit 6B isoform 1 17 49 1.217REPLICATE 4PSMD9 26S proteasome non-ATPase regulatory subunit 9 isoform 1 6 10 1.95PSME2 proteasome activator complex subunit 2 9 35 1.77PSMD8 26S proteasome non-ATPase regulatory subunit 8 11 22 1.579PSMD4 26S proteasome non-ATPase regulatory subunit 4 12 26 1.489PSMD7 26S proteasome non-ATPase regulatory subunit 7 11 23 1.411PSMC4 26S protease regulatory subunit 6B isoform 1 23 70 1.382

Columns from the right represent the gene symbol, protein description, #- number of unique peptides identified, number of peptide score matches (PSMs) and the fold change of the proteins in RR w.r.t P.

Oncotarget27674www.oncotarget.com

Tumour formation was monitored by bioluminescence. As expected at day 14 post injection parent and RR cells treated with vehicle control or bortezomib showed almost similar growth, however, by day 33 while the parent cells treated with bortezomib had formed large tumours, the RR cells treated with bortezomib showed significant reduced bioluminescence intensity (Figure 6A, right panel). Presence of tumour cells was seen with Haematoxylin and Eosin staining in the brain slices of all the treatment groups of mice except for the brain tissue of mice treated injected with RR cells + bortezomib (Figure 6B). As represented in Figure 6D, the mice injected with bortezomib treated RR cells showed a significant decline in bioluminescence as compared to the group injected with bortezomib treated P cells. Also, the overall survival of this group (RR-BTZ) was significantly higher than that of the other three groups as shown in Figure 6E. Median survival

of each group are as follows: P- VC–36 days, P–BTZ–38 days, RR–VC–30 days, RR–BTZ–58 days. Further, we did intracranial injection of parental cells followed by radio therapy (fractionated dose of 14 Gy) followed by intraperitoneal injection of bortezomib (0.5 mg/Kg twice in a week for two weeks) as depicted in Figure 6F. Representative bioluminescence images from each group are shown in Figure 6G. The results show a significant reduction in bioluminescence of animals treated with radiation along with BTZ as compared to the radiation alone group (Figure 6H). The disease free survival of mice was significantly higher in the group treated with radiation and BTZ as compared to radiated alone group (Figure 6I).

Together these data confirmed that the proteasome inhibition in vitro and in vivo resulted in tumour reduction and abrogation of relapse.

Figure 4: RR cells display enhanced proteasome activity and survival dependency on proteasomes in vitro. (A) Data represents the chymotrypsin like proteasome activity measured using Succ-LLVY AMC florigenic substrate in the P and RR population of SF268, U87MG, PS1 and PS2. (B) The graph depicts the RPL19 normalised mRNA levels of classical and Immunoproteasome proteasome beta catalytic subunits respectively in the RR population of SF268, U87MG, PS1, and PS2 compared to the parent population. (C) Proteasome activity inhibition and % cell viability at different concentrations of proteasome inhibitor–Bortezomib in SF268. (D) Graph shows percentage of cells of SF268 and PS1 surviving at different doses of γ radiation with and without 10 nM Bortezomib in a clonogenic assay. (D) Bar graph represents the percentage of viable cells (at 72 hrs) as assessed by MTT assay at different concentrations of Bortezomib. Cells were treated with Bortezomib for 12 hrs. Results in each bar graph are the composite data from three independent experiments performed in triplicate (mean ± SEM); ***P = 0.001c)

Oncotarget27675www.oncotarget.com

DISCUSSION

Radio resistance and recurrence is currently an inevitable consequence in the field of glioblastoma. Until now, the mechanisms of radio resistance in glioblastoma have been explored in in vitro and in in vivo settings either immediately post radiation or after generation of repeated doses of radiation (acquired resistance) but not in the residual radiation resistant cells. However, in this study we focused on the processes deregulated in the innately radiation resistant residual (RR) population as we have previously shown that these are the cells responsible for relapse in glioblastoma [9]. We performed iTRAQ

based quantitative proteomic analysis on the parent (P), innately radiation resistant residual (RR) and relapse (R) population. Amongst the many pathways, we found the proteasome pathway to be most significantly deregulated in the RR cells.

Proteasomes are well known targets in cancer therapy owing to their role in maintaining homeostasis of proteins involved in cell cycle, signalling pathways regulating cell survival and apoptosis [31–34]. Cancer cells harbour enhanced proteasome activity compared to their normal counterparts but the exact reason for this surge is still unknown. It is speculated that this escalation in proteasome activity is to cope with crisis such as

Figure 5: Proteasomes indirectly regulate RR cell survival via the NFkB activation. (A and B) Bar graph shows proteasome activity in parent and RR cells of SF268 and U87 at different concentrations of the Bortezomib as mentioned. (C) Bar graph represents the percentage of viable cells (at 72 hrs) as assessed by MTT assay at different concentrations of Bortezomib. Cells were treated with Bortezomib for 12 hrs. Results in each bar graph are the composite data from three independent experiments performed in triplicate ((mean ± SEM); ***P = 0.001) (D) Western blot represents the expression of phosphor- p65 in the P (Parent) and RR (Radiation resistant) cells of SF268, and U87MG, PS1 and PS2. Total (T) total- p65 levels were used as loading controls. (E) Heat map representation of gene expression values NFkB target genes by qPCR in the RR population of SF268, U87, PS1 and PS2 compared to the parent population. GAPDH was used as internal control. Results are the composite data from three independent experiments performed in triplicate (mean ± SEM); *P = 0.05, **P = 0.01 and ***P = 0.001 (F) Bortezomib treatment repressed the transcriptional activity of NFkB promoter luciferase constructs. The NFkB firefly luciferase construct was transfected into Parent and RR cells and then treated with Bortezomib as indicated. As a control Con A control plasmid was transfected with Renilla luciferase construct. The pTRIPZ IkB-alpha construct was used as NFkB suppressor. Luciferase values subsequent to normalization were plotted.

Oncotarget27676www.oncotarget.com

mutational events and chromosomal instabilities. Although proteasomes are identified as direct targets of radiation, their inhibition is short lived and thus the need for drugs targeting their enzymatic activity [28, 35, 36]. Lower proteasome activity is shown to be a marker for tumour initiating cells and stem cells [37]. Proteasomes are also found to be downregulated in radio-resistant cells of breast cancer and prostate cancer established in vitro [27, 35, 38]. Contrary to these reports, we observed an enhanced expression and activity of proteasomes in the innate radio-resistant residual cells of glioblastoma. Subsequently, we

also identified 14 out of 431 downregulated proteins that harbour ubiquitin binding lysine residues (Supplementary Figure 1). These proteins in the RR cells, we predict to be either ubiquitin adapters or direct targets of the ubiquitin mediated proteasome machinery. This reduced number of proteins with ubiquitin binding attributes to the fact that proteasomes degrade a significant cellular portion by a ubiquitin independent manner also which is still incompletely understood [39].

Bortezomib preferentially inhibits the chymotrypsin like activity of proteasomes and is currently being

Figure 6: Proteasome inhibition reduces the tumorigenic potential of the cells in vivo. (A) Left panel - Representative bioluminescence images after orthotopic injection of U87MG-Luciferase labelled Parent (P) and Radiation Resistant (RR) cells. Right Panel - Bioluminescent images after orthotopic injection of U87MG-Luciferase labelled Parent (P) and Radiation Resistant (RR) cells treated with Vehicle Control (VC) and Bortezomib. (B) Hematoxylin and eosin (H&E) staining of mice brain slices. Brain slices of the brain tissue from mice injected with Parent Vehicle control, RR Vehicle Control, Parent + Bortezomib, RR + Bortezomib cells were formalin fixed and paraffin embedded. Sections stained with H&E show regions infiltrated with tumour cells. All photomicrographs are shown with the same magnification. Bar = 100 μm. (C) Graph represents bioluminescence signal at different days post injection in mice injected with P and RR cells. (D) Graph represents bioluminescence intensity at different days post injection of mice injected with P and RR cells pretreated with bortezomib as compared to P and RR cells treated with vehicle control. ‘n’ represents number of mice per group. (E) Kaplein Meier Curve for the overall survival of the mice in the pretreated study. (F) Schematic representation for studying the effect of intraperitoneal injections of bortezomib along with radiation treatment of mice intracranially injected with parent GBM cells. IR–Radiation; BTZ–Bortezomib. (G) Representative bioluminescence images of tumor formation in the mice treated with IR and BTZ compared to the mice which were administered with Vehicle Control (VC), only BTZ and only IR. (H) Graphical representation of bioluminescence intensity recorded for mice treated with IR and BTZ compared to the mice which were administered only saline as Vehicle Control (VC), only BTZ, only IR. (I) Kaplein Meier Curve for % tumor free animals in the radiation and intraperitoneally administered BTZ study.

Oncotarget27677www.oncotarget.com

used in the treatment for multiple myeloma [28, 40, 41]. In GBM, it has been reported to sensitize the parent GBM cells to temozolomide and radiation treatment but after immediate exposure to the drug and radiation [42]. However, in our study we show that the residual resistant cells that are formed after a period of 5–7 days post radiation are more sensitive to proteasome inhibition compared to the parent cells, although, there is a differential response to proteasome inhibition amongst the cell lines (SF268, U87MG) and patient samples (PS1 & PS2) as depicted in Figure 5C. This could be due to the heterogeneity of GBM tumours. The subtle effect of bortezomib seen in vitro after 72 hrs post treatment is significantly enhanced in reducing tumorigenicity of the treated cells in vivo, suggesting a slow and prolonged effect of proteasome inhibition on the survival of the cells. A significant effect of proteasome inhibition was observed on the overall survival of mice which were injected with pre-treated RR-BTZ cells along with an increased % of tumour free mice when BTZ was administered intraperitoneally along with radiation as shown in Figure 6H and 6I. The increased levels of activated NFkB and its transcriptional activity in the RR cells correlate with previous reports where NFkB has been shown to promote radio resistance in Glioblastoma and other cancers. It has been reported to trigger pro-survival and anti-apoptotic signals by transcriptional activation of over 200 genes including the pro inflammatory cytokines, cell-cell adhesion molecules. We have observed cytokines such as TNF-α, IFN-γ, IL-6 and antioxidant genes such COX2 levels increased in the RR. Its activation can occur via IkB-α degradation (Classical pathway) or the by TNF-α (alternative pathway) [43–45]. However, the exact mechanism downstream to higher proteasome expression and NFkB activity in the RR cells needs to be further explored. Nonetheless, this study as illustrated in Figure 7, establishes that proteasomes aid the survival of the innate radiation resistant population via NFkB pathway and hence can be valuable targets for precluding relapse in glioblastoma.

MATERIALS AND METHODS

Cell culture and drug treatment

GBM grade IV cell lines U87MG and SF268 were obtained from ATCC in 2011. These cell lines were last authenticated in the laboratory by short tandem repeat profiling based on eight markers in May 2014. The cell line was maintained in DMEM containing 10% (v/v) FBS, penicillin (200 U/ml), streptomycin (100 μg/ml) and incubated at 37° C in a humidified incubator with an atmosphere of 50 mL/L CO2. Proteasome inhibitor was obtained from NATCO.

Cell synchronization and radiation treatment

The cells growing in 10% FBS containing media were washed with 1X PBS. The cells were incubated with 0.05% FBS containing DMEM for 72 hrs. After 72 hrs, cells were replaced by 10% FBS containing median and were irradiated using 60 Co γ-rays at the respective lethal dose.

Protein extraction

10 million cells of the Parent (P), Radiation Resistant (RR) and Relapse (R) cells were grown under normal growth conditions. The media was aspirated and the cells were washed thrice with cold 1 X PBS after which the cells were scraped and pelleted down. The cell pellet was suspended in 150 µl of 0.5% SDS Solution and sonicated with 10 pulses each for 10secs. The sonicated cells were centrifuged at 4000 RPM for 15 mins at 4° C and the supernatant was used for the proteomic analysis. The protein concentration was determined using bichoninic acid assay and equal amounts of protein from the 3 conditions were taken for further analysis.

iTRAQ labelling

Protein extracts from the untreated, radiation resistant and relapse cells were digested with trypsin and

Figure 7: Proposed model for the study.

Oncotarget27678www.oncotarget.com

the peptides were labelled with iTRAQ reagents according to the manufacturer’s instructions (iTRAQ Reagents Multiplex kit; Applied Biosystems/MDS Sciex, Foster City, CA). Briefly, 80 µg of protein from each sample was reduced, alkylated and digested with sequencing grade trypsin; (Promega, Madison, WI, USA). Peptides from P, RR and R were labelled with iTRAQ reagents containing 114, 115 and 116 reporter ions, respectively. The three labelled samples were pooled, vacuum-dried and subjected to fractionation by strong cation exchange (SCX) chromatography.

SCX fractionation

The pooled sample after iTRAQ labelling was resuspended in 1 ml of buffer A [10 mM KH2PO4, 25% (v/v) acetonitrile (ACN), pH 2.9] and separated on a SCX column (Zorbax 300-SCX, 5 µm, 2.1 mm ID × 50 mm, Agilent Technologies, Santa Clara, CA, USA) at a flow rate of 700 µl/min with a 40 min gradient [5 min, 0–5% buffer B (buffer A + 350 mM KCl); 5 min, 5–10%; 5 min, 10–23%; 5 min, 23–50%; 10 min, 50–100%; 10 min, 100% B]. One minute fractions were collected, vacuum-dried and desalted using C18 cartridge (Pierce, Rockford, USA) as per the manufacturer’s instructions. After desalting, consecutive fractions were pooled to obtain a total of thirteen fractions for LC-MS/MS analysis.

LC-MS/MS analysis

Nanoflow electrospray ionization tandem mass spectrometric analysis of peptide samples was carried out using LTQ-Orbitrap Velos (Thermo Scientific, Bremen, Germany) interfaced with Agilent’s 1200 Series nanoflow LC system. The chromatographic capillary columns used were packed with Magic C18 AQ (particle size 5 μm, pore size 100Å; Michrom Bioresources, Auburn, CA, USA) reversed phase material in 100% ACN at a pressure of 1000 psi. The peptide sample from each SCX fraction was enriched using a trap column (75 μm × 2 cm) at a flow rate of 3 μl/min and separated on an analytical column (75 μm × 10 cm) at a flow rate of 350 nl/min. The peptides were eluted using a linear gradient of 7–30% ACN over 65 min. Mass spectrometric analysis was carried out in a data dependent manner with full scans acquired using the Orbitrap mass analyser at a mass resolution of 60,000 at 400 m/z. For each MS cycle, twenty most intense precursor ions from a survey scan were selected for MS/MS and fragmentation detected at a mass resolution of 15,000 at m/z 400. The fragmentation was carried out using higher-energy collision dissociation (HCD) as the activation method with 40% normalized collision energy. The ions selected for fragmentation were excluded for 30 sec. The automatic gain control for full FT MS was set to 1 million ions and for FT MS/MS was set to 0.1 million ions with a maximum time of accumulation of 500 ms,

respectively. For accurate mass measurements, the lock mass option was enabled.

Protein identification and quantitation

The MS data was analyzed using Proteome Discoverer (Thermo Fisher Scientific, Version 1.4). The workflow consisted of a spectrum selector and a reporter ion quantifier. MS/MS search was carried out using SEQUEST and MASCOT search algorithms against the NCBI RefSeq database (release 52 40) containing 31,811 proteins. Search parameters included trypsin as the enzyme with 1 missed cleavage allowed; oxidation of methionine was set as a dynamic modification while alkylation at cysteine and iTRAQ modification at N-terminus of the peptide and lysine were set as static modifications. Precursor and fragment mass tolerance were set to 20 ppm and 0.1.Da, respectively. False Discovery Rate (FDR) was calculated by searching the proteomic data against a decoy protein database. Only those Peptide Spectrum Matches (PSMs) that qualified a 1% FDR threshold were considered for further analysis. Unique peptide (s) for each protein identified was used to determine relative protein quantitation based on the relative intensities of reporter ions released during MS/MS fragmentation of peptides.

Bioinformatics analysis

Heat Map representation for the differential genes on the basis of their relative peptide intensities was constructed using MeV software (v 4.9.0). Unsupervised Hierarchical clustering of the genes was done using Pearson Correlation method. Functional annotation and Gene enrichment pathway analysis was done using Cytoscape (v 3.5.1) ClueGo (v 1.8) and CluPedia (v 1.0) plugin with default parameters. KEGG and REACTOME pathway databases were used for reference.

Western blot analysis

Cells were lysed using EBC lysis buffer (120 mM NaCl, 50 mM Tris-Cl (pH 8.0), 0.5% (v/v) Nonidet P-40, 50 μg/ml PMSF and protease, phosphatase inhibitor cocktail for 45 minutes on ice. The supernatant were collected and 40 ug of protein was used for immunoblotting using anti-YBX3 (rabbit; 1:1000; Pierce), anti-PSMB4 (rabbit; 1:1000; Pierce), and anti-PSMD10 (rabbit; 1:1000; Pierce), Actin (Sigma; 1:4000 dilutions), was used as a loading control. Immune-reactive proteins were visualized using an enhanced chemiluminescence (ECL) reagent (Pierce).

MTT cytotoxicity assay

5000 cells/well were seeded in 96 well plates for overnight. Bortezomib (Bortenat 2 mg; Natco Company) was added at different concentration i.e. 0.1 nM, 1 nM, 10 nM and 100 nM. After 72 hrs 10 μL of MTT reagent

Oncotarget27679www.oncotarget.com

(5 mg/ml in PBS, Himedia TC191-1G) was added to each well and incubated for 4 h. Crystals were dissolved using freshly prepared acidified isopropanol containing 10% tritonX-100. Optical density was measured at 570 nM by (SPECTROstarNANOstar spectrophotometer).

Proteasome activity assay

0.1 million cells were pelleted, washed twice with 1X PBS and resuspended in ATP buffer containing 50 mM Tris (pH 7.5), 5 mM MgCl2, 1 mMATP, 10% glycerol and protease inhibitor cocktail (Sigma). Cell suspensions were ultra-sonicated for four cycles of 5 s each (with 1 s break after each 2 s) at 30 kHz on ice. Proteasome activity was measured using 50 µM Suc-LLVY-7-amino-4-methyl coumarin substrate and fluorescence readings were taken at excitation 355 nm/emission 460 nm.

Trypan blue exclusion assay

0.1 million cells from all cultures were seeded in a 24 well plate and irradiated with the lethal dose of radiation. Viable cells from each well were counted every alternative day till 22 days to monitor the cell survival post radiation on a haemocytometer.

Orthotopic xenograft mouse experiments

All animal experiments were licensed through the Laboratory Animal Facility of ACTREC, TMC. Protocols were reviewed by the Institutional Animal Ethics Committee (IAEC). NUDE/SCID mice (6–8 weeks old) bred and maintained in an isolated facility within a specific pathogen-free environment were used for this study. 1 × 10⁵ pLenti6-luc2 U87MG cells stably expressing luciferase were intracranially injected for generating the orthotopic GBM model and for studying the tumorigenicity of pre-treated Parent and RR cells. 2.5 × 10⁵ pLenti6-luc2 U87MG stably expressing luciferase were intracranially injected for studying the effect of proteasome inhibitor along with radiation. In order to perform intracranial injection, the cells were suspended in 5 µl 1X PBS prior to injection and kept on ice until injected. Prior to injecting the cells intracranially, the mice were anesthetized using an injection mix of Ketamine (120 mg/kg)/Xylazine(mg/kg)/Saline and the mice was placed on the stereotaxic for stereotactic surgery. A 10 mm to 15 mm long incision was made on top of the skull. A small hole was drilled using a sterile 26 gauge sharp needle at 1 mm posterior to bregma and 2 mm lateral to coronal suture and 2.5 mm depth. The 5 µl cell suspension was then loaded onto the Hamilton syringe and injected at a rate of 1 μl per minute for a total of 6–8 minutes. The tumours were allowed to grow and animals were sacrificed using CO2 at the onset of disease symptoms, such as weight and activity loss, and the brains were removed.

Radiation and drug treatment of orthotopic GBM mouse model.

The mice were divided into four groups post 7–10 days of intracranial injection: Vehicle control, bortezomib (Bortenat 2 mg, NATCO company), Radiated group, Radiation and BTZ group. Radiation was delivered to the whole brain of anesthetized mice, immobilized in a plastic chamber using 60Co γ-rays. A total dose of 14 Gy was administered over a period of 7 days. 0.5 mg/Kg of bortezomib was administered intraperitoneally twice in a week for 2 weeks.

Bioluminescence imaging of orthotopic tumor xenografts

Mice were anaesthetized with Ketamine/Xylazine and were administered luciferin (D-Luciferin potassium salt, 150 mg/kg, Calliper Life Sciences) via intraperitoneal injection. The images were acquired 10–12 minutes post injection. The time chosen was based on the pharmacokinetics of luciferin which defines that maximum luminescence emission and greatest sensitivity of detection will be obtained when cell luminescence is detected after 10–15 mins of injection of luciferin. The selected imaging time was maintained as constant among all the animals to be imaged. Regions of interest encompassing the intracranial area of signal were defined using Living Image software, and the total photons/s/sr/cm2 (photons per second per steradian per square cm) was recorded.

Statistical methods

All data are represented as means ± standard error means (SEMs). The two-tailed Student’s t-test was applied for statistical analysis. The Kaplan–Meier curve was plotted to generate the survival curves and to estimate the median survival values. Differences between survival curves were compared using a log-rank test.

ACKNOWLEDGMENTS

We thank Dr Neelam Shirsat and Dr Amit Dutt for providing the glioma cell lines. We acknowledge the funding from Department of Biotechnology (BT/PR4040/MDE/30/792/2012) and Tata Memorial Centre to SD

CONFLICTS OF INTEREST

Authors declare no conflicts of interest.

REFERENCES

1. Stupp R, Mason WP, van den Bent MJ, Weller M, Fisher B, Taphoorn MJ, Belanger K, Brandes AA, Marosi C, Bogdahn U, Curschmann J, Janzer RC, Ludwin SK, et al;

Oncotarget27680www.oncotarget.com

and European Organisation for Research and Treatment of Cancer Brain Tumor and Radiotherapy Groups; and National Cancer Institute of Canada Clinical Trials Group. Radiotherapy plus Concomitant and Adjuvant Temozolomide for Glioblastoma. The new england journal of medicine. 2005.

2. Stupp R, Hegi ME, Mason WP, van den Bent MJ, Taphoorn MJ, Janzer RC, Ludwin SK, Allgeier A, Fisher B, Belanger K, Hau P, Brandes AA, Gijtenbeek J, et al; European Organisation for Research and Treatment of Cancer Brain Tumour and Radiation Oncology Groups; National Cancer Institute of Canada Clinical Trials Group. Effects of radiotherapy with concomitant and adjuvant temozolomide versus radiotherapy alone on survival in glioblastoma in a randomised phase III study: 5-year analysis of the EORTC-NCIC trial. Lancet Oncol. 2009; 10:459-66.

3. Zhang X, Zhang W, Cao WD, Cheng G, Zhang YQ. Glioblastoma multiforme: molecular characterization and current treatment strategy (Review). Exp Ther Med. 2012; 3:9–14. Review https://doi.org/10.3892/etm.2011.367.

4. Reardon DA, Wen PY. Therapeutic advances in the treatment of glioblastoma: rationale and potential role of targeted agents. Oncologist. 2006; 11:152–64. https://doi.org/10.1634/theoncologist.11-2-152.

5. Glas M, Rath BH, Simon M, Reinartz R, Schramme A, Trageser D, Eisenreich R, Leinhaas A, Keller M, Schildhaus HU, Garbe S, Steinfarz B, Pietsch T, et al. Residual tumor cells are unique cellular targets in glioblastoma. Ann Neurol. 2010; 68:264–69.

6. Kelley K, Knisely J, Symons M, Ruggieri R. Radioresistance of Brain Tumors. Cancers. 2016; 8.

7. Weller M, Cloughesy T, Perry JR, Wick W. Standards of care for treatment of recurrent glioblastoma—are we there yet? Neuro-oncol. 2013; 15:4–27. https://doi.org/10.1093/neuonc/nos273.

8. Roy S, Lahiri D, Maji T, Biswas J. Recurrent Glioblastoma: where we stand. South Asian J Cancer. 2015; 4:163–73. https://doi.org/10.4103/2278-330X.175953.

9. Kaur E, Rajendra J, Jadhav S, Shridhar E, Goda JS, Moiyadi A, Dutt S. Radiation-induced homotypic cell fusions of innately resistant glioblastoma cells mediate their sustained survival and recurrence. Carcinogenesis. 2015; 36:685–95. https://doi.org/10.1093/carcin/bgv050.

10. Pandey A, Mann M. Proteomics to study genes and genomes. Nature. 2000; 405:837–46. https://doi.org/10.1038/35015709.

11. Chumbalkar V, Sawaya R, Bogler O. Proteomics: the new frontier also for brain tumor research. Curr Probl Cancer. 2008; 32:143–54. https://doi.org/10.1016/j.currproblcancer.2008.02.005.

12. Lage H. Proteomics in cancer cell research: an analysis of therapy resistance. Pathol Res Pract. 2004; 200:105–17. https://doi.org/10.1016/j.prp.2004.02.003.

13. Larance M, Lamond AI. Multidimensional proteomics for cell biology. Nat Rev Mol Cell Biol. 2015; 16:269–80. https://doi.org/10.1038/nrm3970.

14. Kalinina J, Peng J, Ritchie JC, Van Meir EG. Proteomics of gliomas: initial biomarker discovery and evolution of technology. Neuro-oncol. 2011; 13:926–42. https://doi.org/10.1093/neuonc/nor078.

15. Kumar DM, Patil V, Ramachandran B, Nila MV, Dharmalingam K, Somasundaram K. Temozolomide-modulated glioma proteome: role of interleukin-1 receptor-associated kinase-4 (IRAK4) in chemosensitivity. Proteomics. 2013; 13:2113–24. https://doi.org/10.1002/pmic.201200261.

16. Vogel TW, Zhuang Z, Li J, Okamoto H, Furuta M, Lee YS, Zeng W, Oldfield EH, Vortmeyer AO, Weil RJ. Proteins and protein pattern differences between glioma cell lines and glioblastoma multiforme. Clin Cancer Res. 2005; 11:3624-32. https://doi.org/10.1158/1078-0432.CCR-04-2115.

17. Hill JJ, Moreno MJ, Lam JC, Haqqani AS, Kelly JF. Identification of secreted proteins regulated by cAMP in glioblastoma cells using glycopeptide capture and label-free quantification. Proteomics. 2009; 9:535–49. https://doi.org/10.1002/pmic.200800257.

18. Furuta M, Weil RJ, Vortmeyer AO, Huang S, Lei J, Huang TN, Lee YS, Bhowmick DA, Lubensky IA, Oldfield EH, Zhuang Z. Protein patterns and proteins that identify subtypes of glioblastoma multiforme. Oncogene. 2004; 23:6806–14. https://doi.org/10.1038/sj.onc.1207770.

19. Fang X, Wang C, Balgley BM, Zhao K, Wang W, He F, Weil RJ, Lee CS. Targeted tissue proteomic analysis of human astrocytomas. J Proteome Res. 2012; 11:3937–46. https://doi.org/10.1021/pr300303t.

20. Deighton RF, Le Bihan T, Martin SF, Barrios-Llerena ME, Gerth AM, Kerr LE, McCulloch J, Whittle IR. The proteomic response in glioblastoma in young patients. J Neurooncol. 2014; 119:79–89. https://doi.org/10.1007/s11060-014-1474-6.

21. Com E, Clavreul A, Lagarrigue M, Michalak S, Menei P, Pineau C. Quantitative proteomic Isotope-Coded Protein Label (ICPL) analysis reveals alteration of several functional processes in the glioblastoma. J Proteomics. 2012; 75:3898–913. https://doi.org/10.1016/j.jprot.2012.04.034.

22. Polisetty RV, Gautam P, Sharma R, Harsha HC, Nair SC, Gupta MK, Uppin MS, Challa S, Puligopu AK, Ankathi P, Purohit AK, Chandak GR, Pandey A, Sirdeshmukh R. LC-MS/MS analysis of differentially expressed glioblastoma membrane proteome reveals altered calcium signaling and other protein groups of regulatory functions. Mol Cell Proteomics. 2012; 11:M111.013565.

23. Collet B, Guitton N, Saïkali S, Avril T, Pineau C, Hamlat A, Mosser J, Quillien V. Differential analysis of glioblastoma multiforme proteome by a 2D-DIGE approach. Proteome Sci. 2011; 9:16. https://doi.org/10.1186/1477-5956-9-16.

24. Niclou SP, Fack F, Rajcevic U. Glioma proteomics: status and perspectives. J Proteomics. 2010; 73:1823–38. https://doi.org/10.1016/j.jprot.2010.03.007.

25. Thirant C, Galan-Moya EM, Dubois LG, Pinte S, Chafey P, Broussard C, Varlet P, Devaux B, Soncin F, Gavard J,

Oncotarget27681www.oncotarget.com

Junier MP, Chneiweiss H. Differential proteomic analysis of human glioblastoma and neural stem cells reveals HDGF as a novel angiogenic secreted factor. Stem Cells. 2012; 30:845–53. https://doi.org/10.1002/stem.1062.

26. de Aquino PF, Carvalho PC, Nogueira FC, da Fonseca CO, de Souza Silva JC, Carvalho Mda G, Domont GB, Zanchin NI, Fischer Jde S. A Time-Based and Intratumoral Proteomic Assessment of a Recurrent Glioblastoma Multiforme. Front Oncol. 2016; 6:183.

27. Della Donna L, Lagadec C, Pajonk F. Radioresistance of prostate cancer cells with low proteasome activity. Prostate. 2012; 72:868–74. https://doi.org/10.1002/pros.21489.

28. McBride WH, Iwamoto KS, Syljuasen R, Pervan M, Pajonk F. The role of the ubiquitin/proteasome system in cellular responses to radiation. Oncogene. 2003; 22:5755–73. https://doi.org/10.1038/sj.onc.1206676.

29. The UniProt Consortium. UniProt: the universal protein knowledgebase. Nucleic Acids Res. 2017; 45:D158–69. https://doi.org/10.1093/nar/gkw1099.

30. Monika A. Jarzabek PCH, Kai O. Skaftnesmo, Emmet McCormack, Patrick Dicker, Jochen H.M. Prehn, Rolf Bjerkvig, and Annette T. Byrne. In Vivo Bioluminescence Imaging Validation of a Human Biopsy–Derived Orthotopic Mouse Model of Glioblastoma Multiforme. Molecular Imaging. 2013.

31. Burger AM, Seth AK. The ubiquitin-mediated protein degradation pathway in cancer: therapeutic implications. Eur J Cancer. 2004; 40:2217–29. https://doi.org/10.1016/j.ejca.2004.07.006.

32. Qureshi N, Morrison DC, Reis J. Proteasome protease mediated regulation of cytokine induction and inflammation. Biochim Biophys Acta. 2012; 1823:2087–93. https://doi.org/10.1016/j.bbamcr.2012.06.016.

33. Livneh I, Cohen-Kaplan V, Cohen-Rosenzweig C, Avni N, Ciechanover A. The life cycle of the 26S proteasome: from birth, through regulation and function, and onto its death. Cell Res. 2016; 26:869–85. https://doi.org/10.1038/cr.2016.86.

34. Pajonk F, van Ophoven A, Weissenberger C, McBride WH. The proteasome inhibitor MG-132 sensitizes PC-3 prostate cancer cells to ionizing radiation by a DNA-PK-independent mechanism. BMC Cancer. 2005; 5:76. https://doi.org/10.1186/1471-2407-5-76.

35. Pervan M, Iwamoto KS, McBride WH. Proteasome structures affected by ionizing radiation. Mol Cancer Res. 2005; 3:381–90. https://doi.org/10.1158/1541-7786.MCR-05-0032.

36. Pajonk F, McBride WH. Ionizing radiation affects 26s proteasome function and associated molecular responses, even at low doses. Radiother Oncol. 2001; 59:203–12. https://doi.org/10.1016/S0167-8140(01)00311-5.

37. Tamari K, Hayashi K, Ishii H, Kano Y, Konno M, Kawamoto K, Nishida N, Koseki J, Fukusumi T, Hasegawa S, Ogawa H, Hamabe A, Miyo M, et al. Identification of chemoradiation-resistant osteosarcoma stem cells using an imaging system for proteasome activity. Int J Oncol. 2014; 45:2349–54. https://doi.org/10.3892/ijo.2014.2671.

38. Smith L, Qutob O, Watson MB, Beavis AW, Potts D, Welham KJ, Garimella V, Lind MJ, Drew PJ, Cawkwell L. Proteomic identification of putative biomarkers of radiotherapy resistance: a possible role for the 26S proteasome? Neoplasia. 2009; 11:1194–207. https://doi.org/10.1593/neo.09902.

39. Baugh JM, Viktorova EG, Pilipenko EV. Proteasomes can degrade a significant proportion of cellular proteins independent of ubiquitination. J Mol Biol. 2009; 386:814–27. https://doi.org/10.1016/j.jmb.2008.12.081.

40. Crawford LJ, Walker B, Irvine AE. Proteasome inhibitors in cancer therapy. J Cell Commun Signal. 2011; 5:101–10. https://doi.org/10.1007/s12079-011-0121-7.

41. Teicher BA, Tomaszewski JE. Proteasome inhibitors. Biochem Pharmacol. 2015; 96:1–9. https://doi.org/10.1016/j.bcp.2015.04.008.

42. Thaker NG, Zhang F, McDonald PR, Shun TY, Lewen MD, Pollack IF, Lazo JS. Identification of survival genes in human glioblastoma cells by small interfering RNA screening. Mol Pharmacol. 2009; 76:1246–55. https://doi.org/10.1124/mol.109.058024.

43. Cahill KE, Morshed RA, Yamini B. Nuclear factor-κB in glioblastoma: insights into regulators and targeted therapy. Neuro-oncol. 2016; 18:329–39. https://doi.org/10.1093/neuonc/nov265.

44. Ahmed KM, Li JJ. NF-kappa B-mediated adaptive resistance to ionizing radiation. Free Radic Biol Med. 2008; 44:1–13. https://doi.org/10.1016/j.freeradbiomed.2007.09.022.

45. Pahl HL. Activators and target genes of Rel/NF-kappaB transcription factors. Oncogene. 1999; 18:6853–66. https://doi.org/10.1038/sj.onc.1203239.

Enhanced proteasomal activity is essential for long term survival and recurrence of innately radiation resistant residual glioblastoma cells

www.oncotarget.com Oncotarget, Supplementary Materials

SUPPLEMENTARY MATERIALS

Supplementary Figure 1: Downregulated proteasome target proteins. List of downregulated proteins with ubiquitin binding lysine residues.

Supplementary Figure 2: Pathway analysis of deregulated proteins in all the biological replicates. (A) Pathway analysis of deregulated proteins in replicate 2. (B) Pathway analysis of deregulated proteins in replicate 3. (C) Pathway analysis of deregulated proteins in replicate 4.
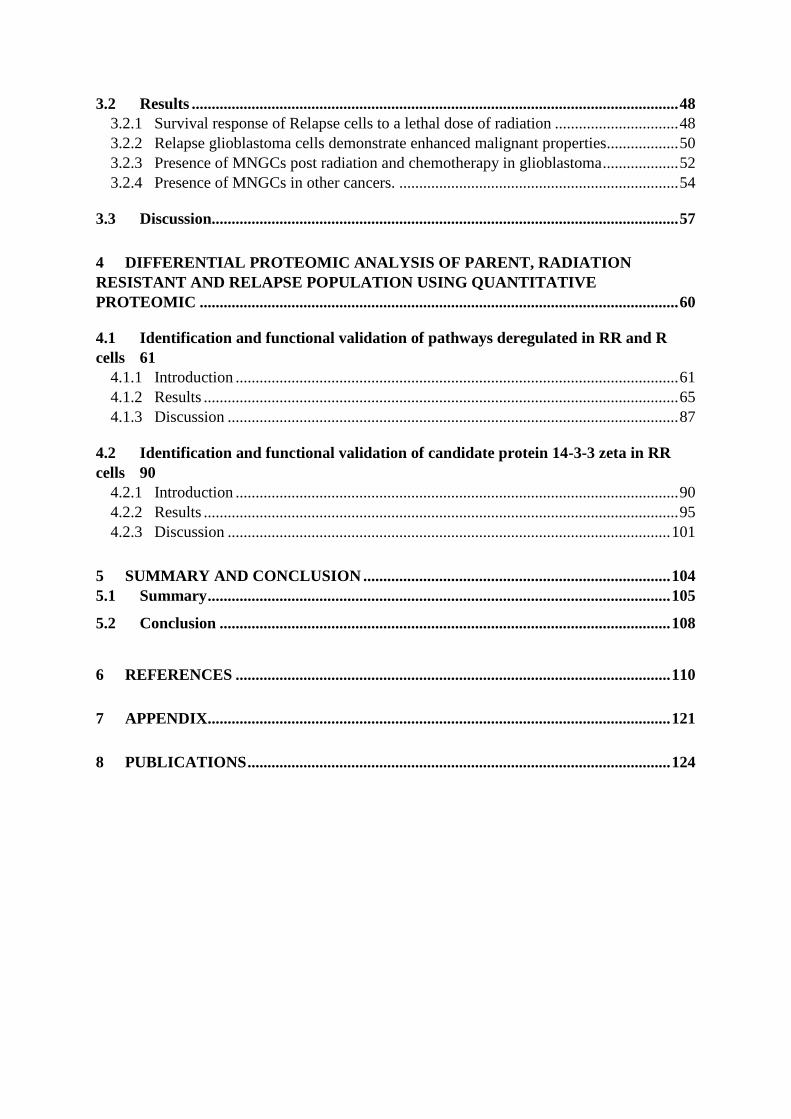
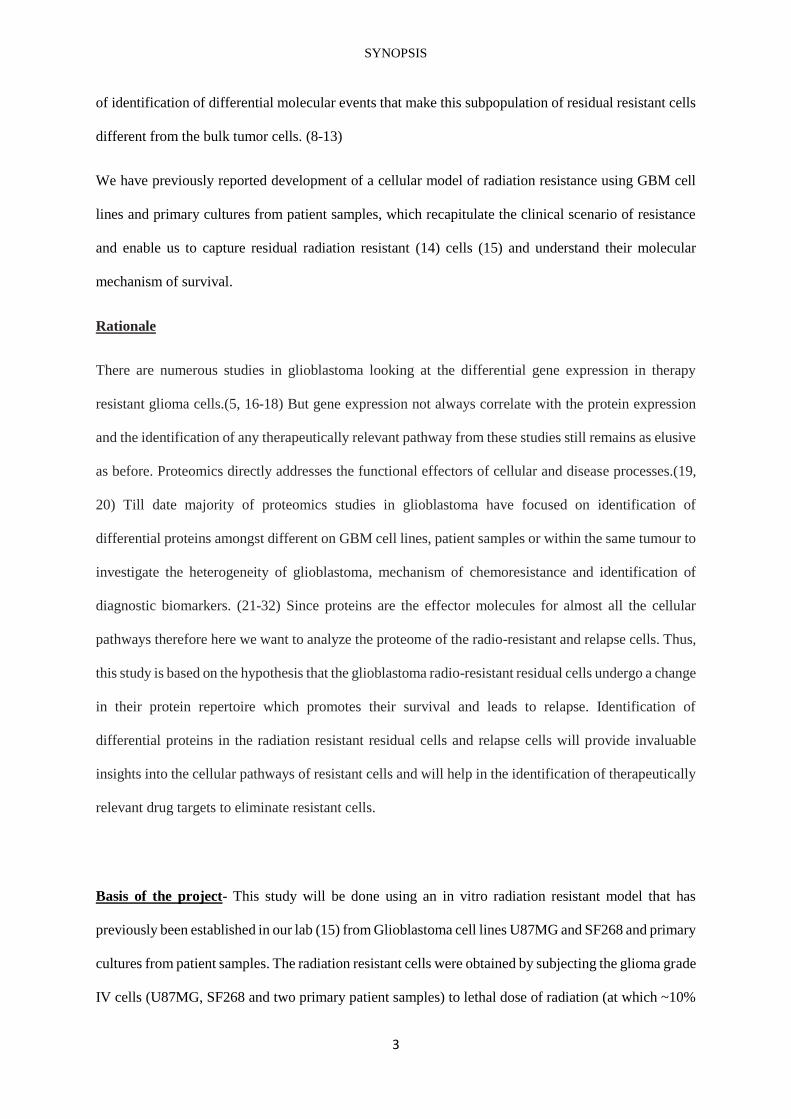
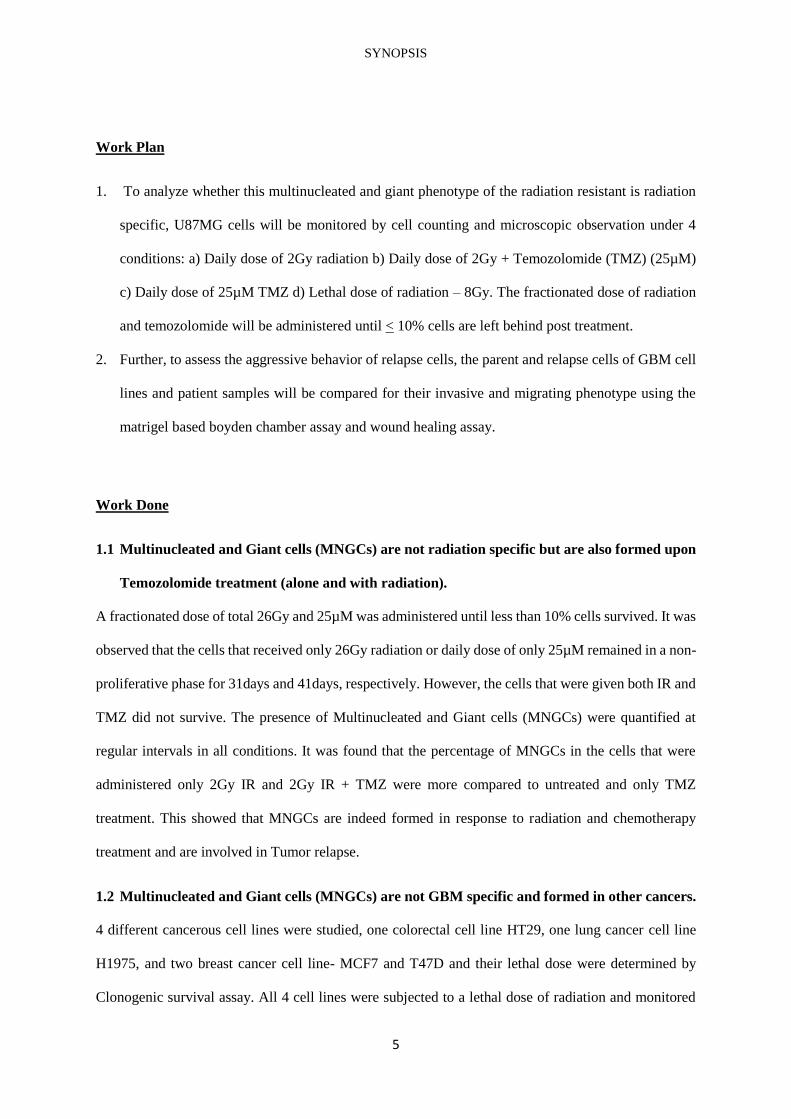
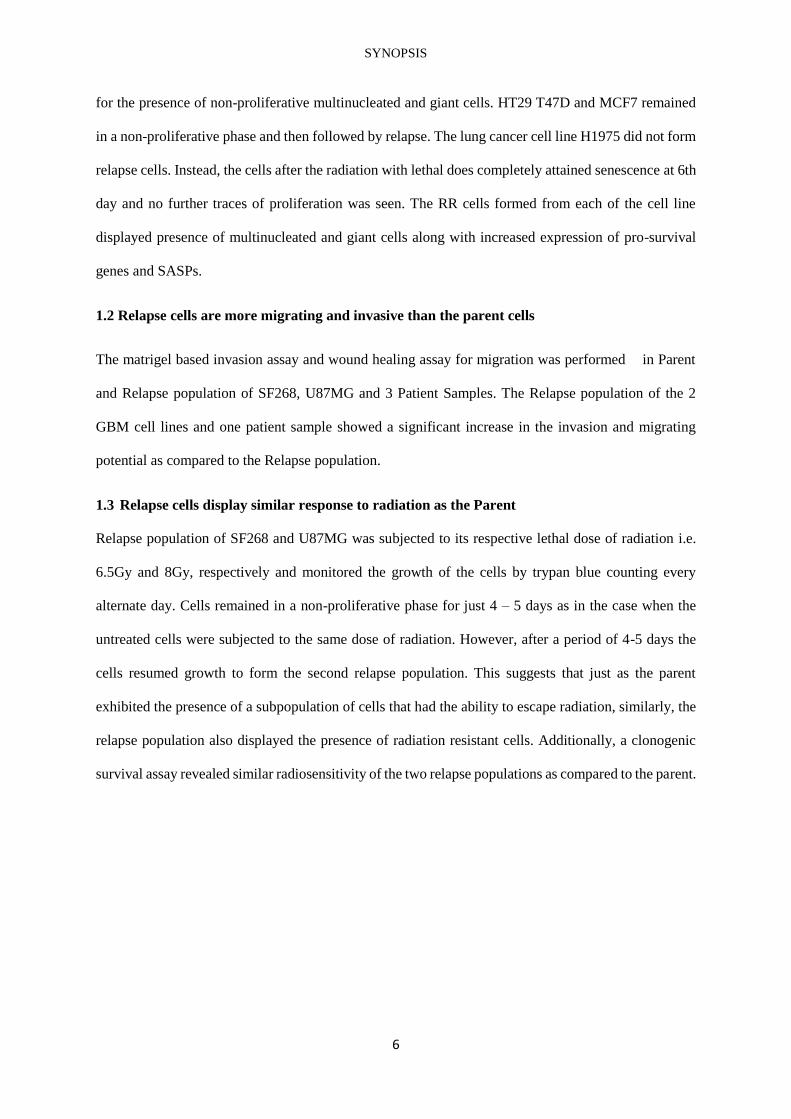
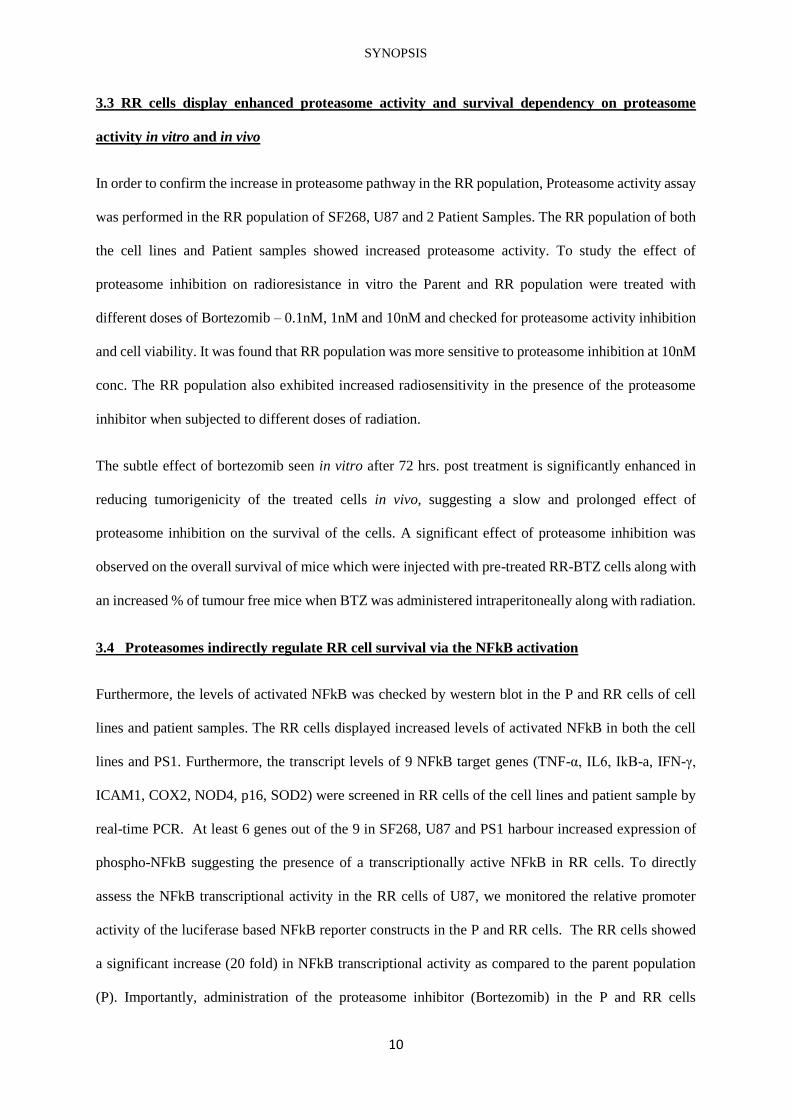
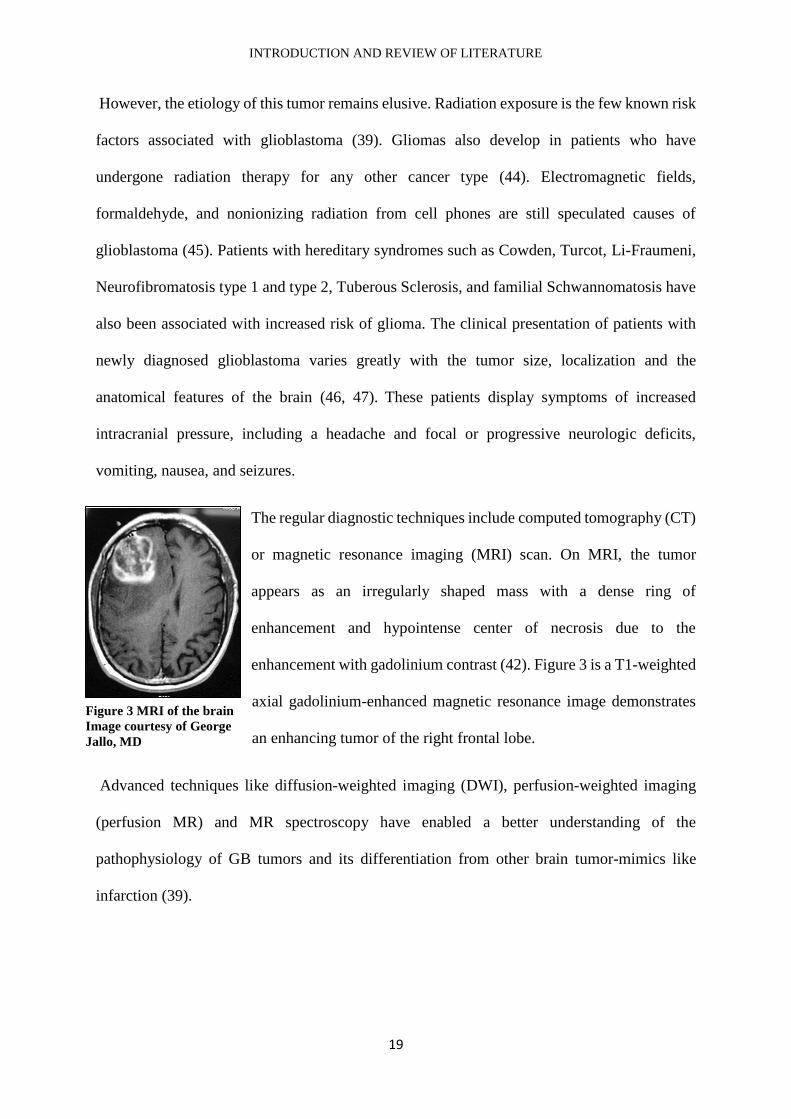
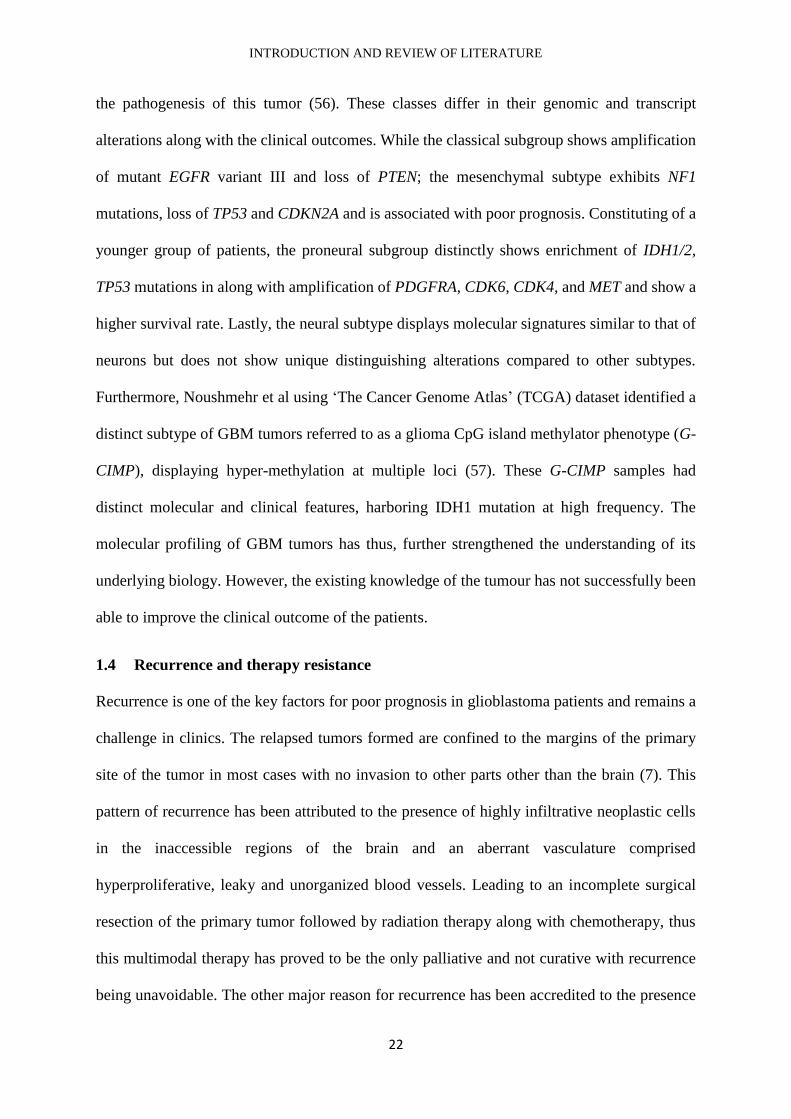
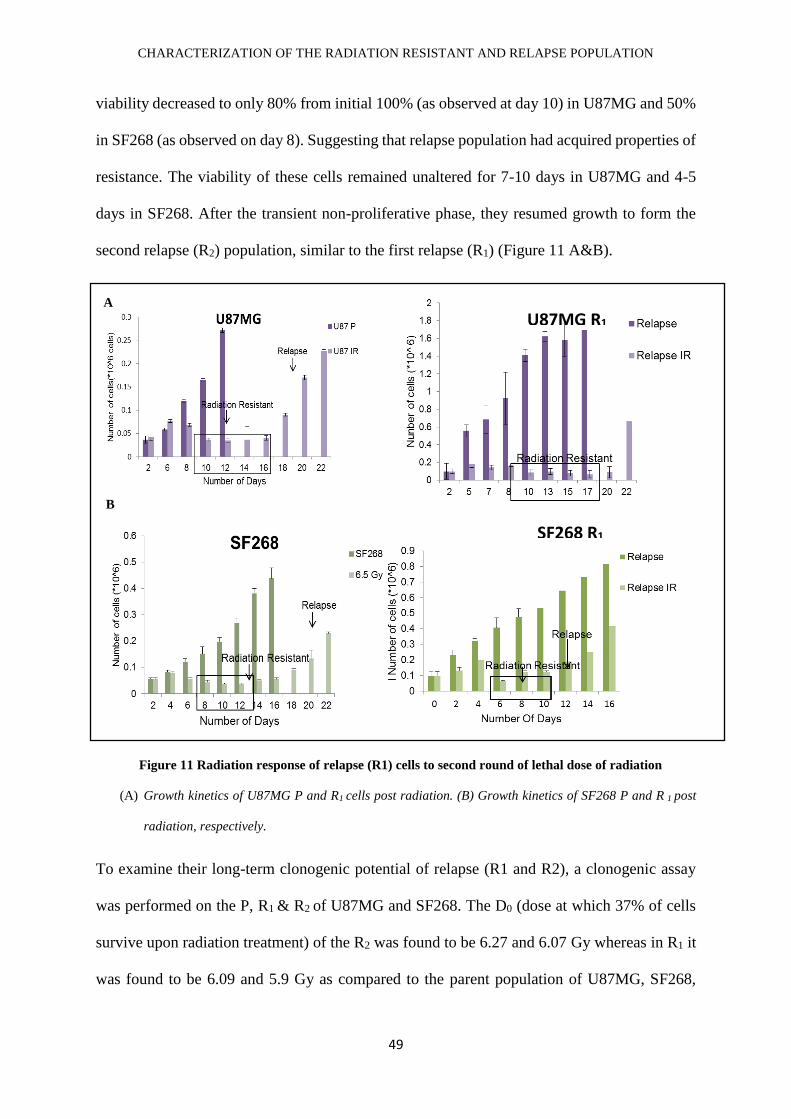
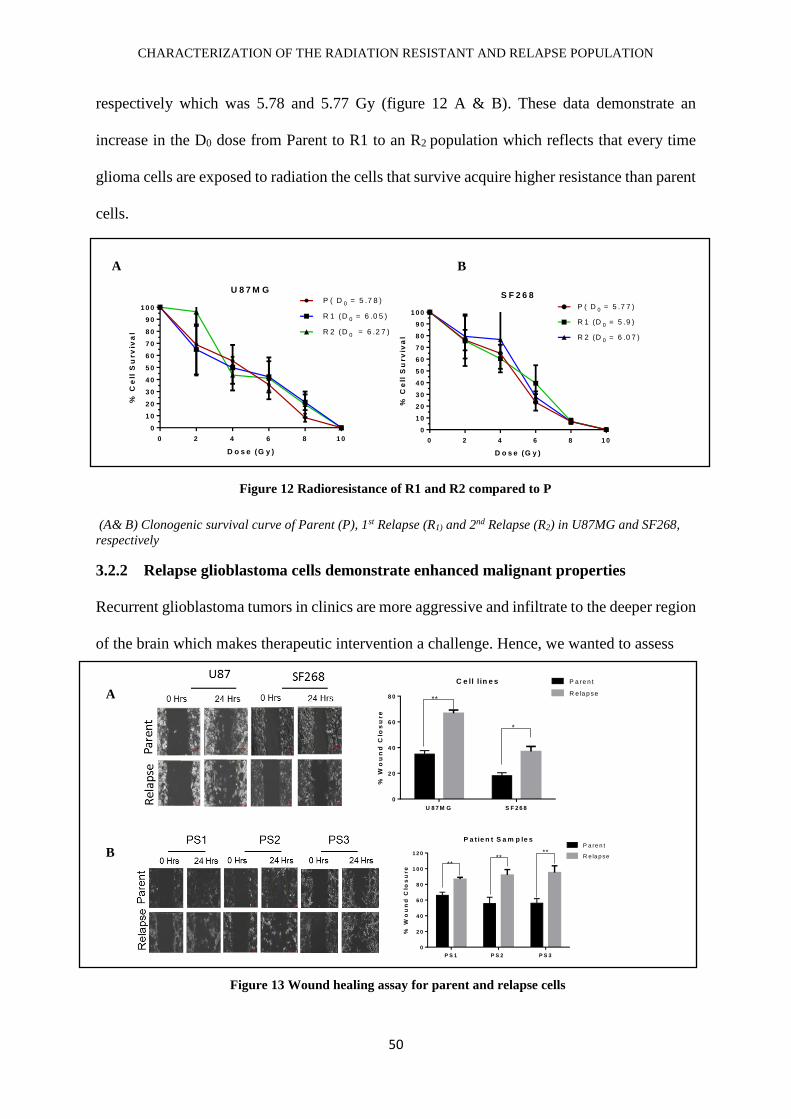
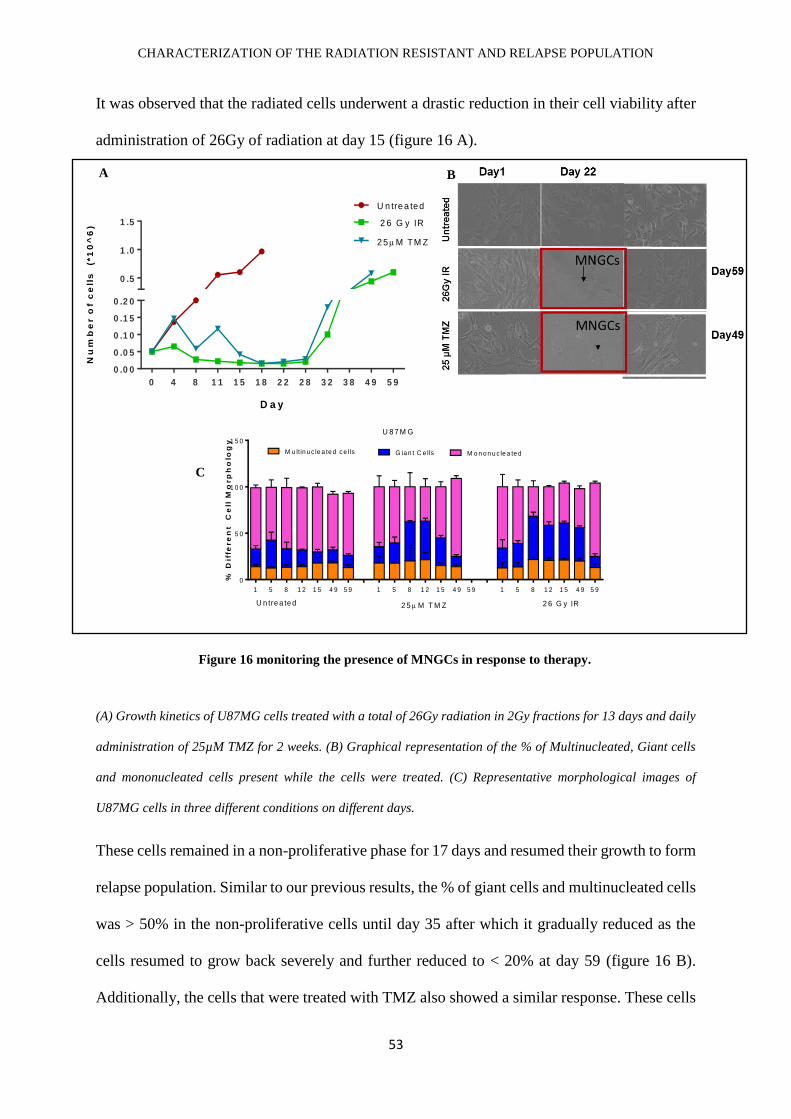
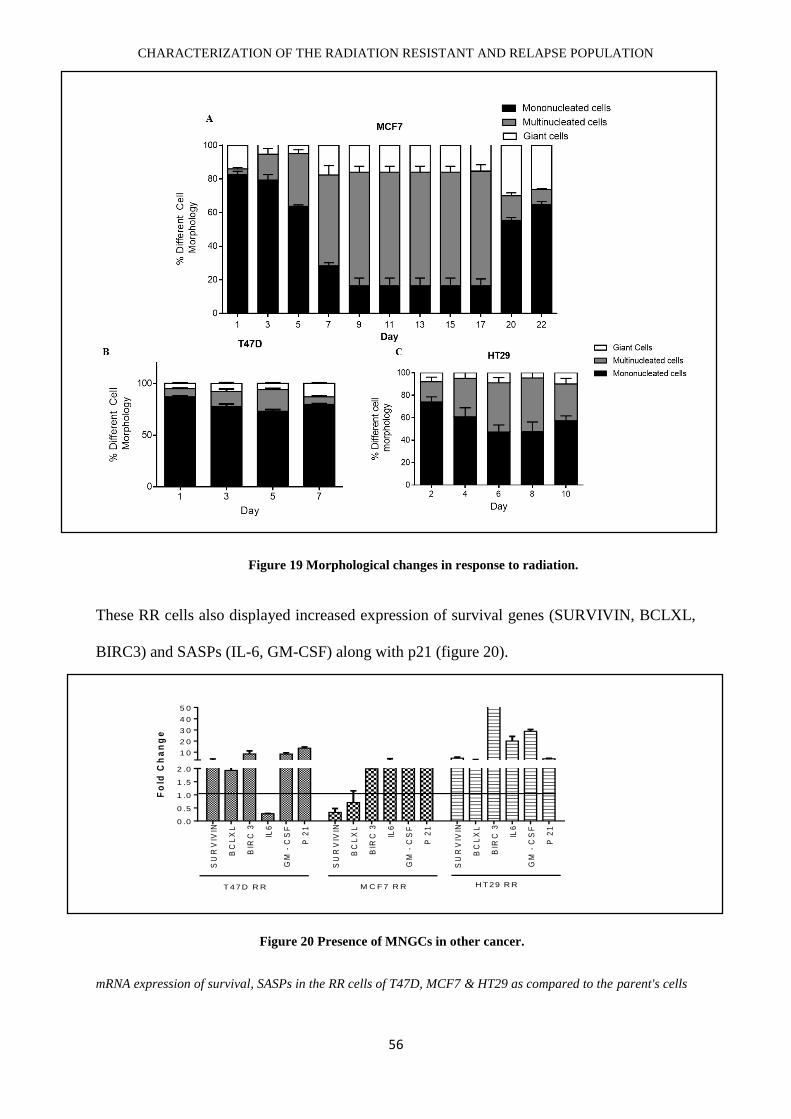
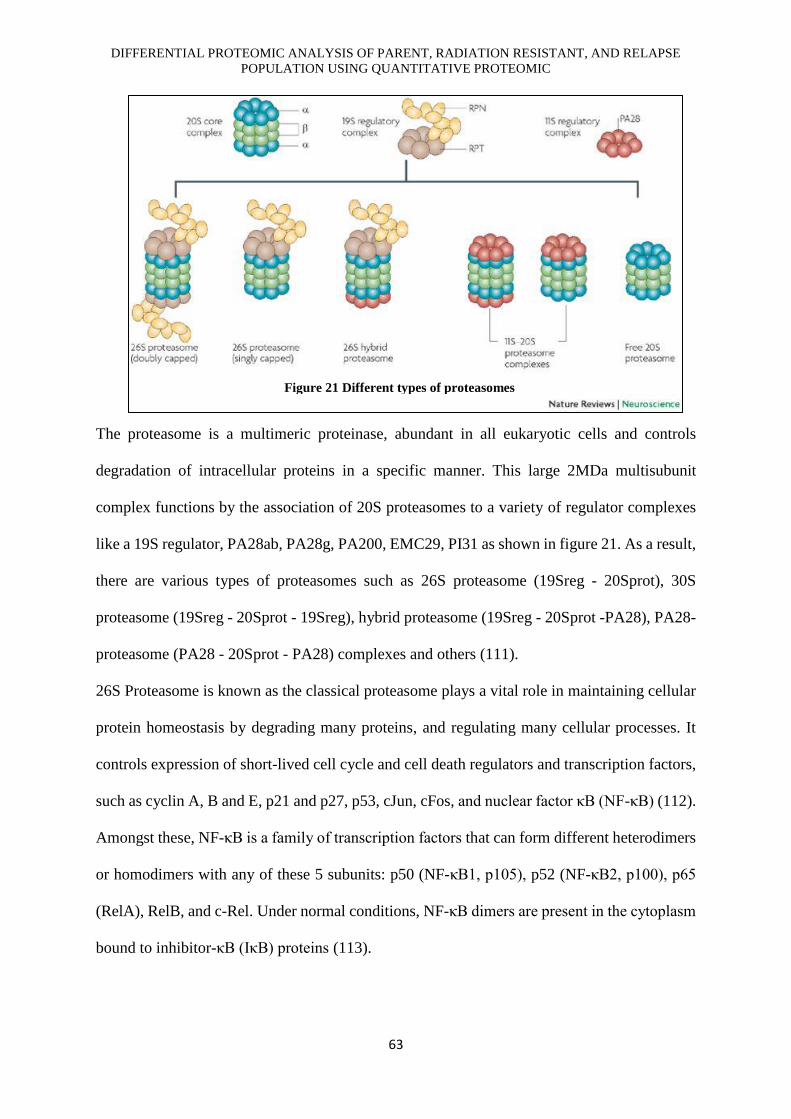
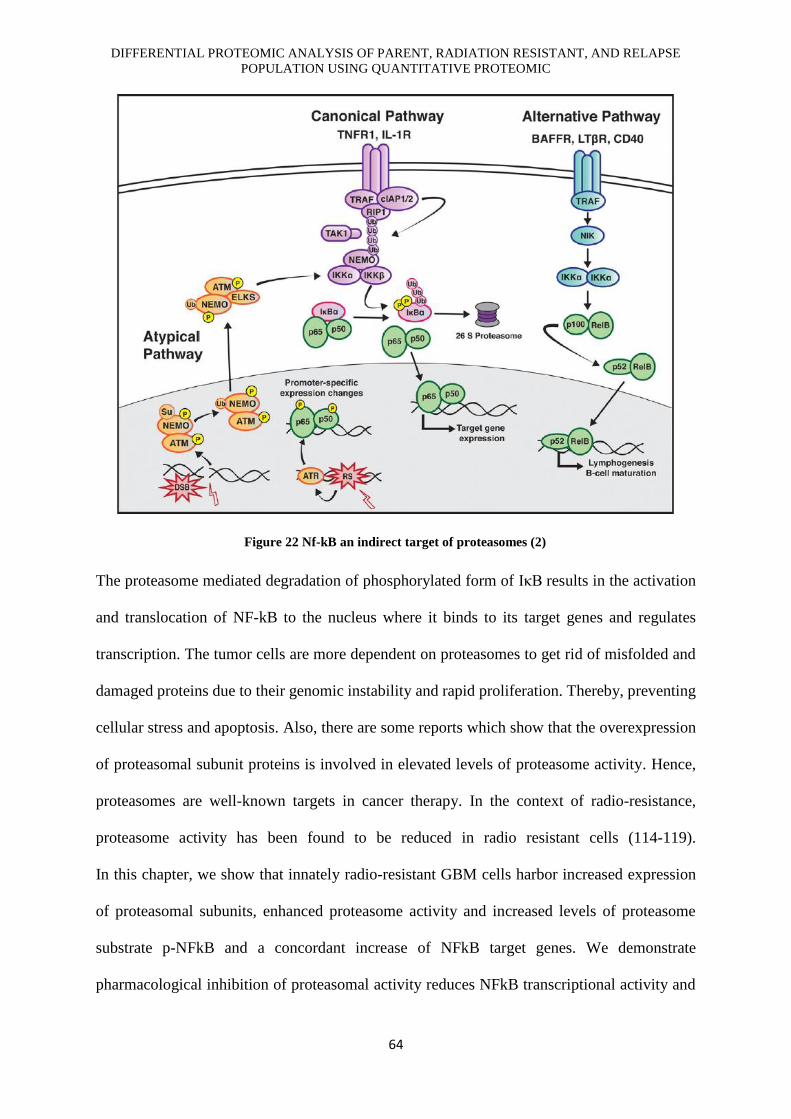
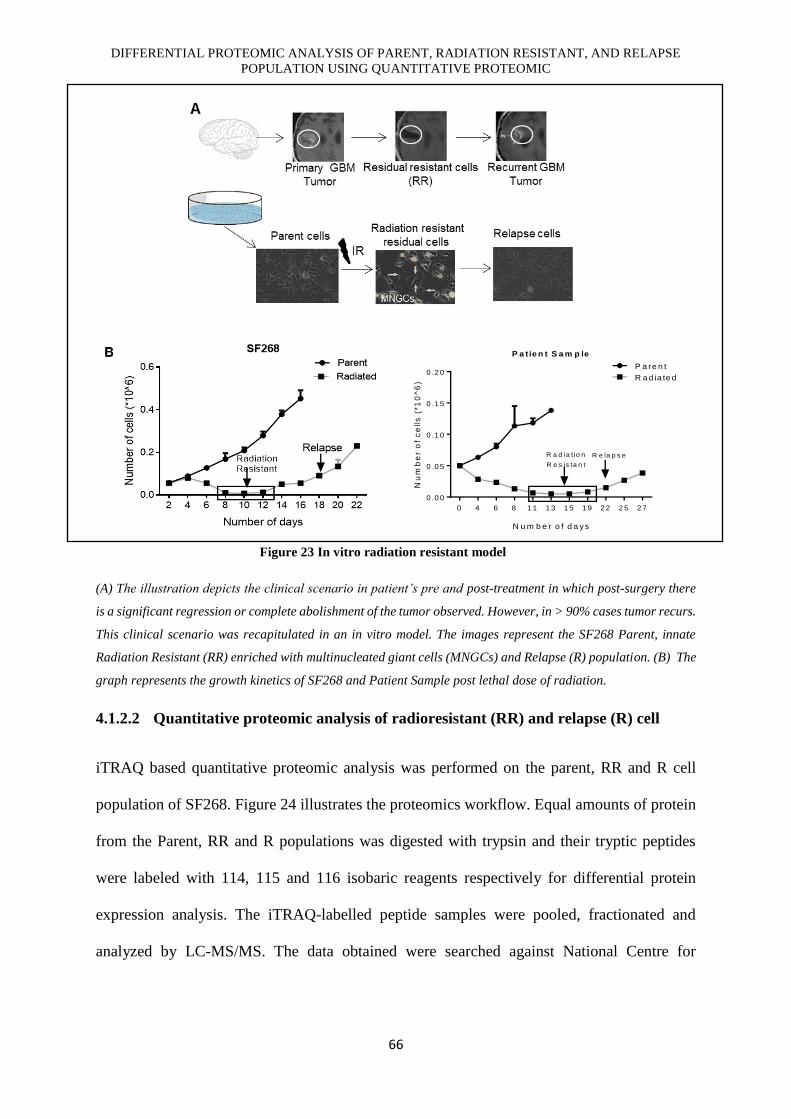
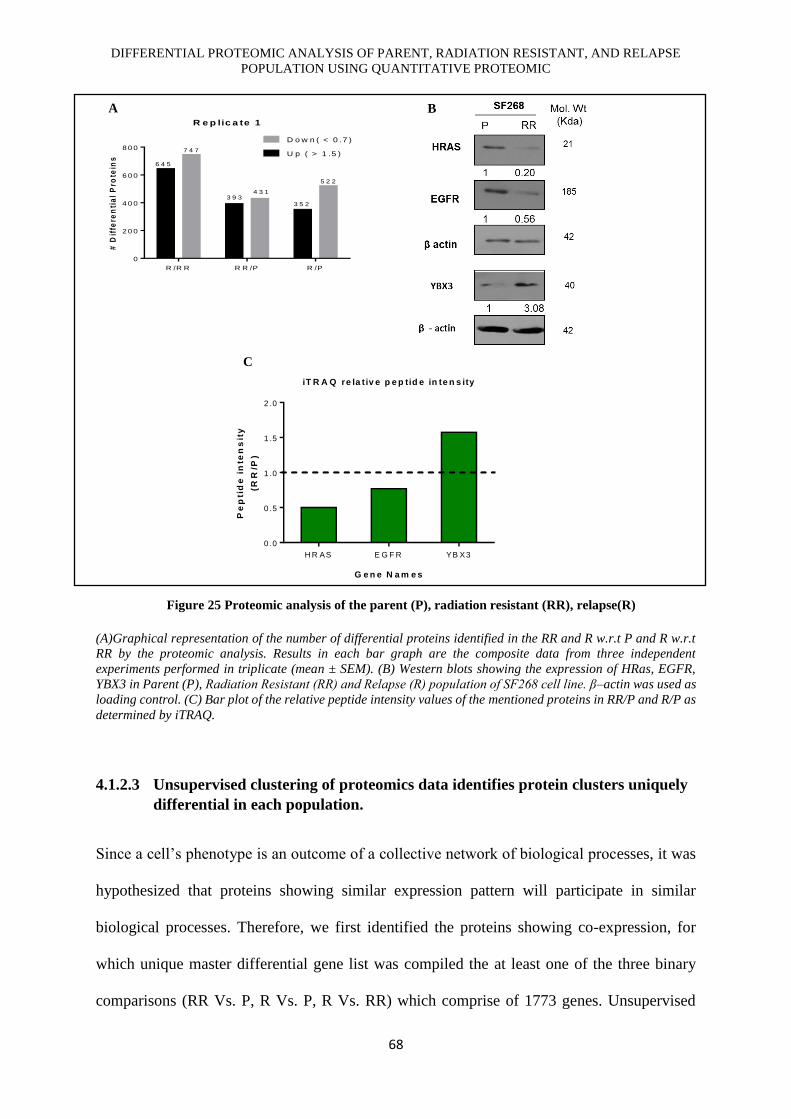
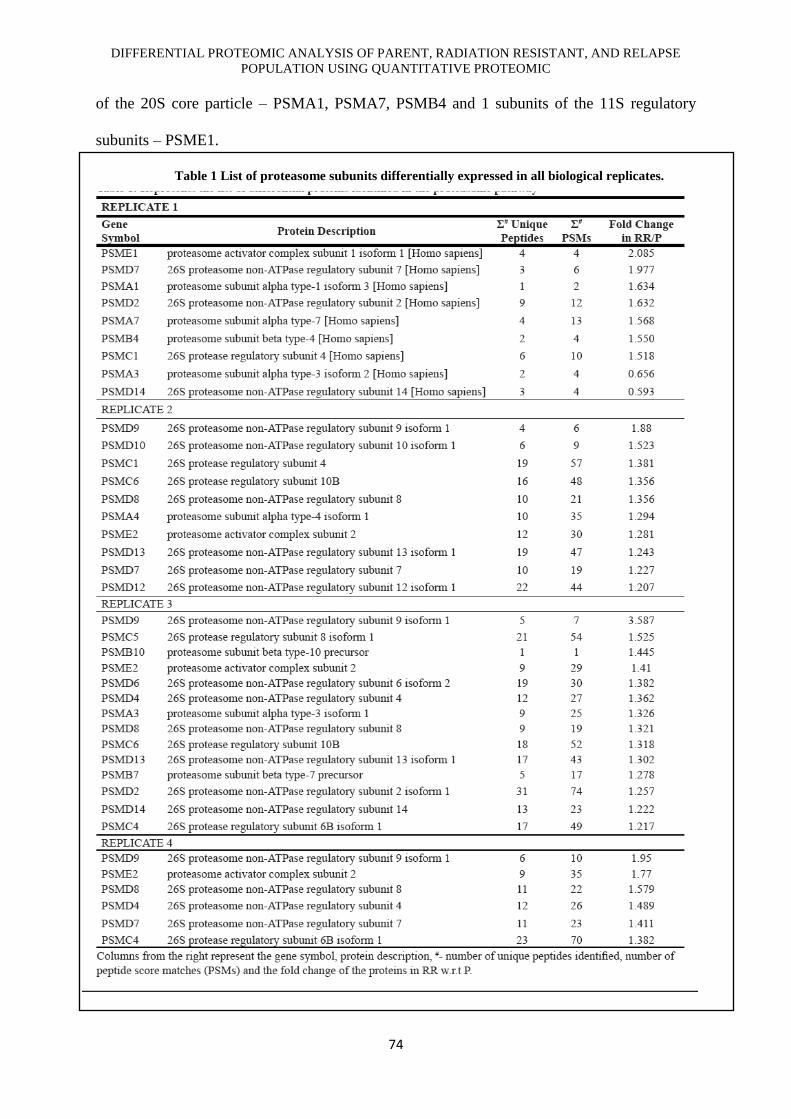
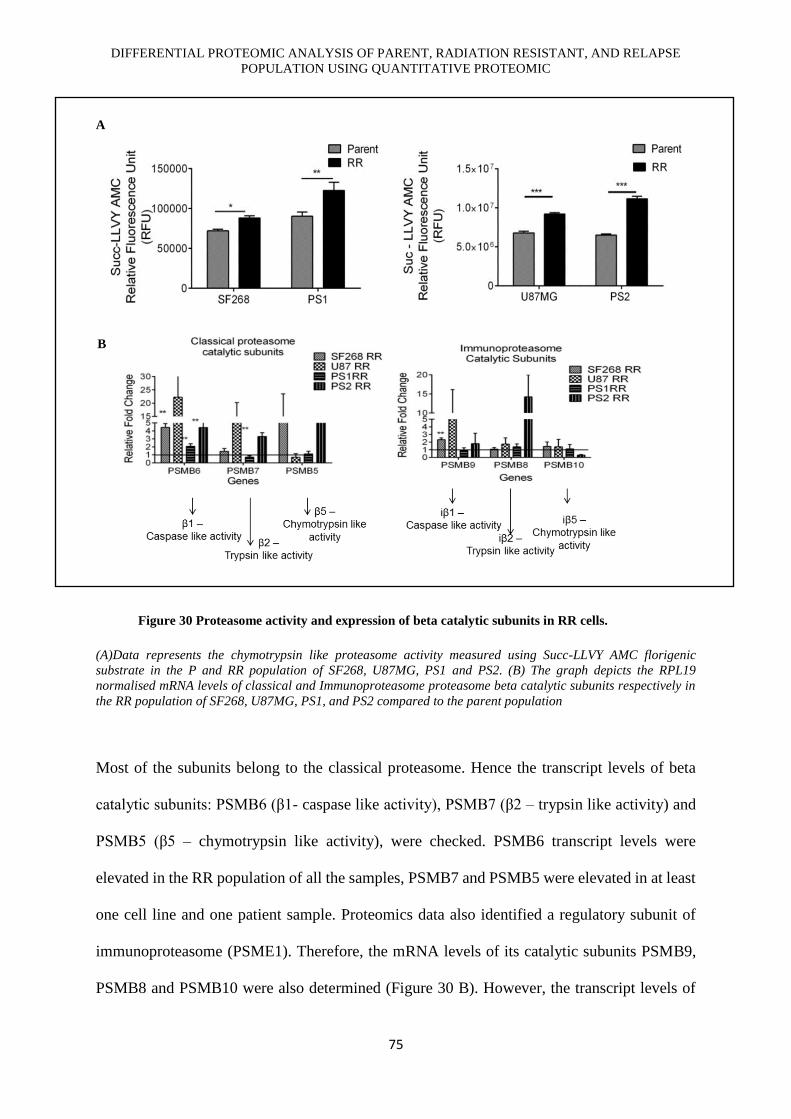
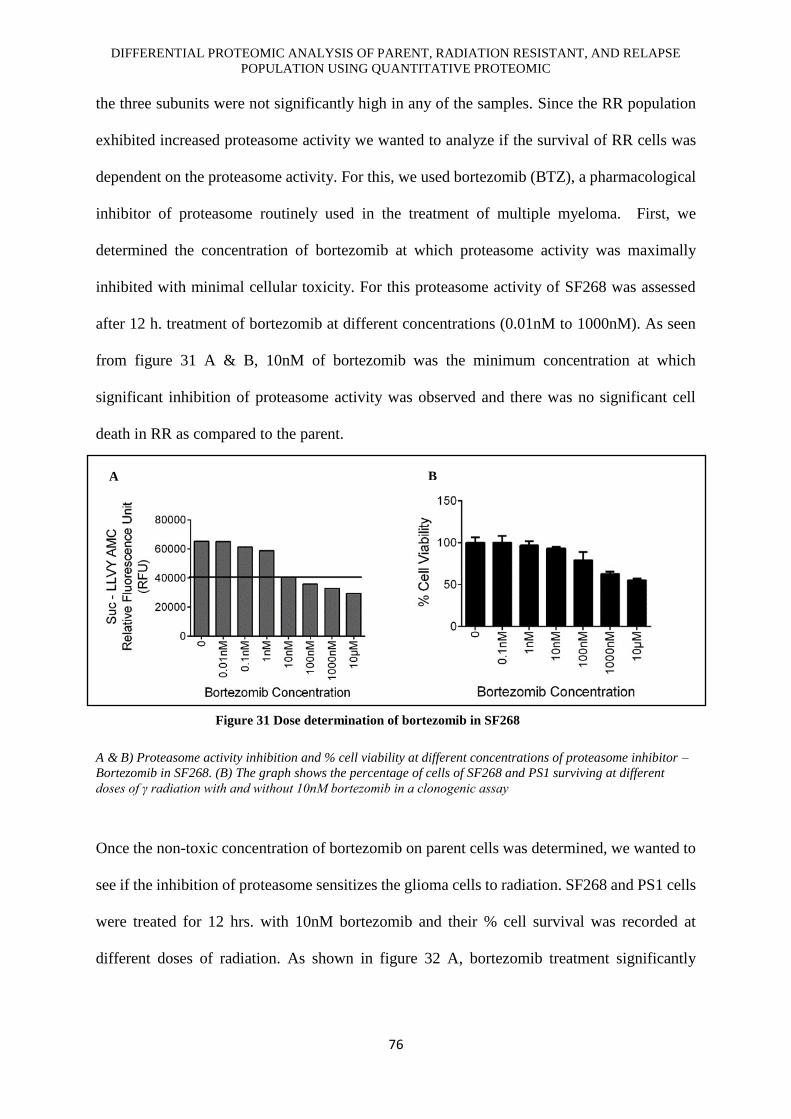
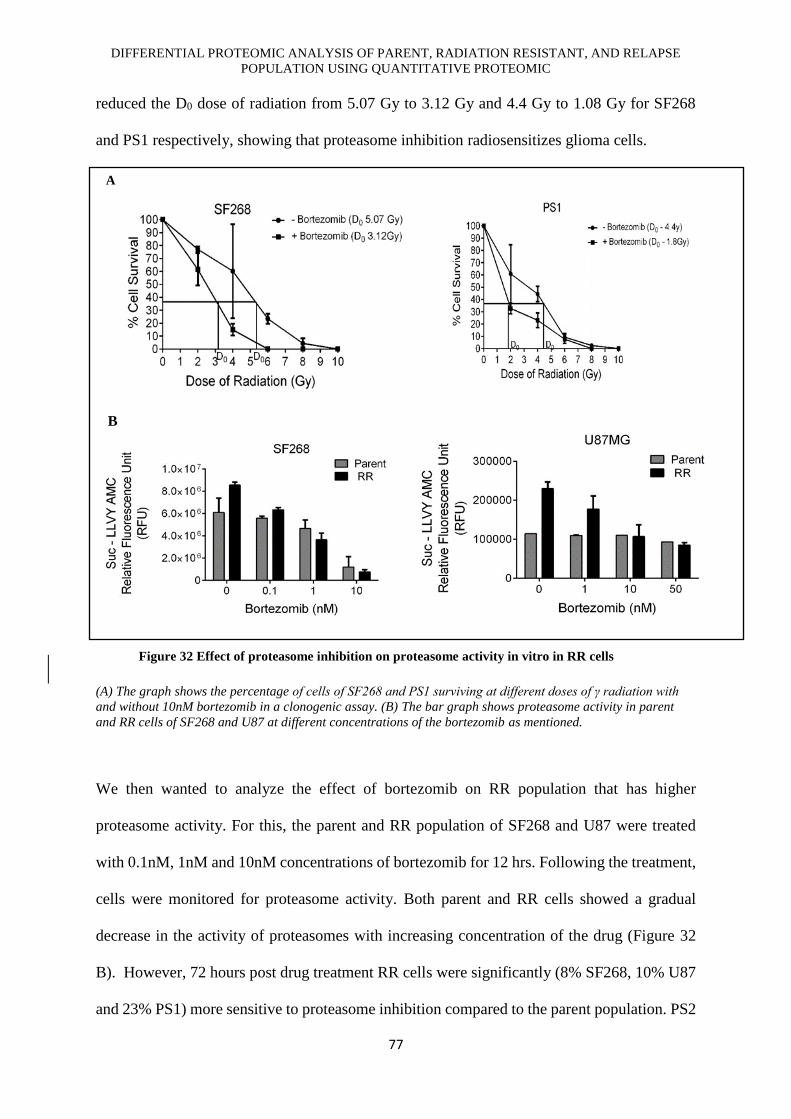
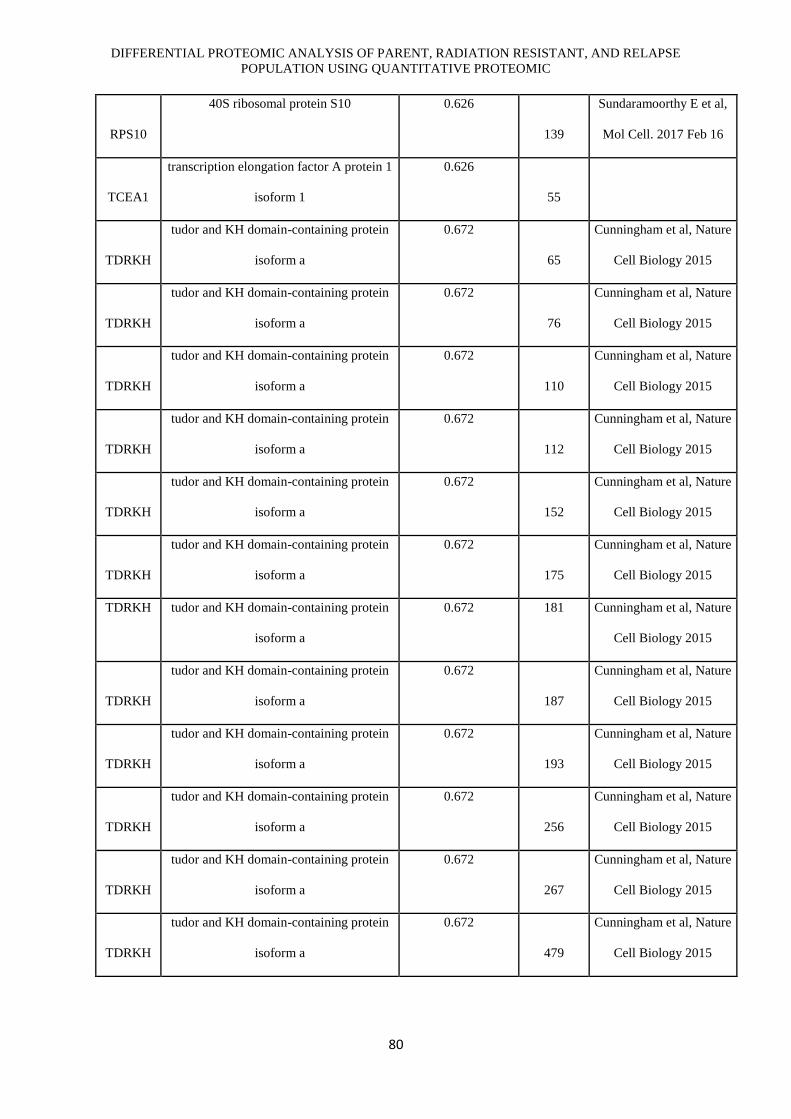
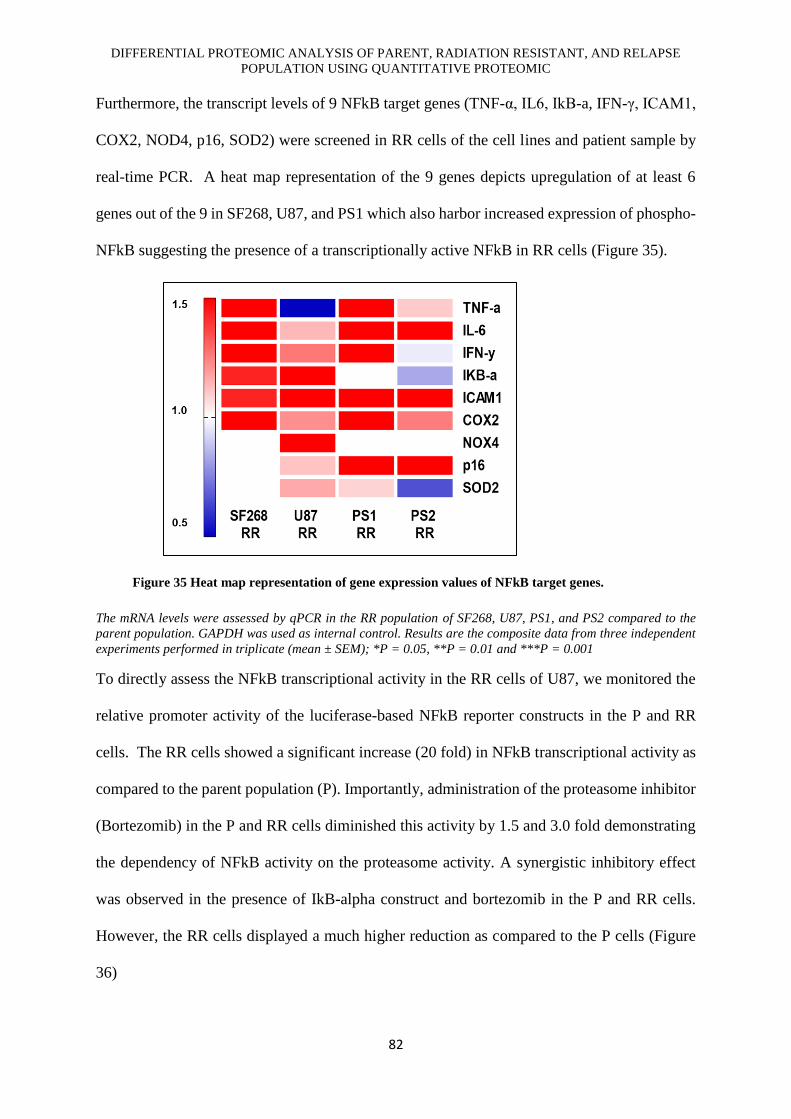
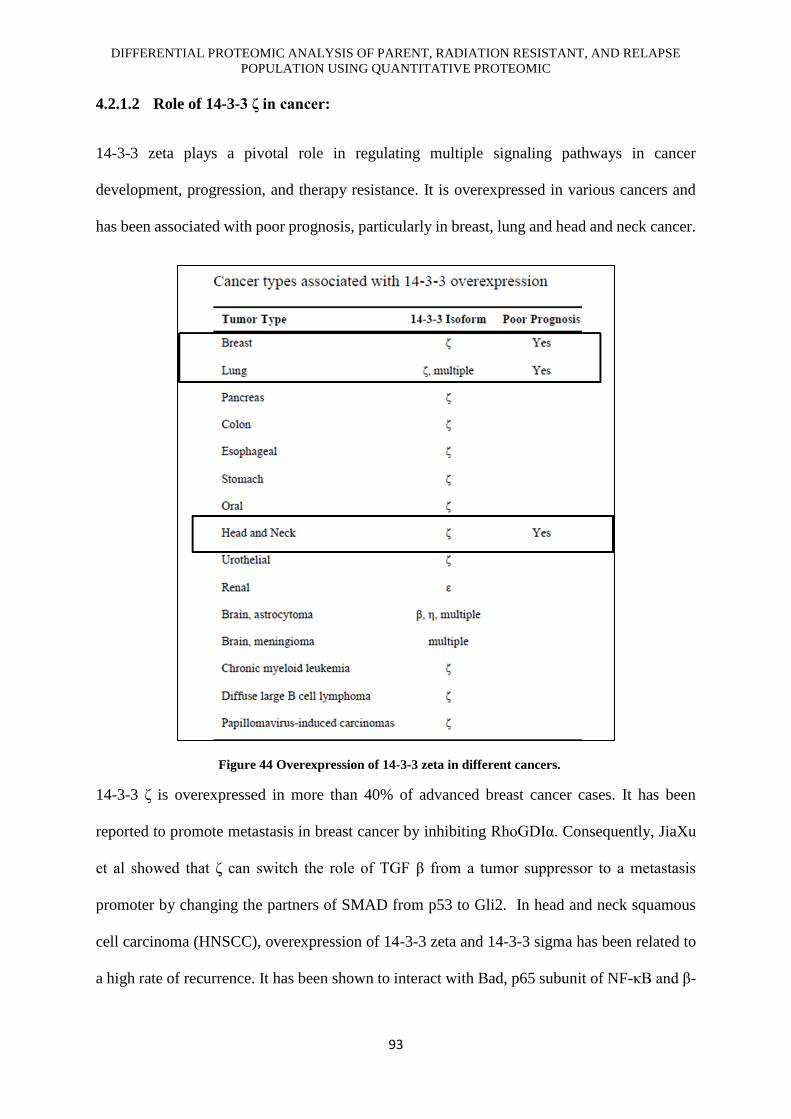
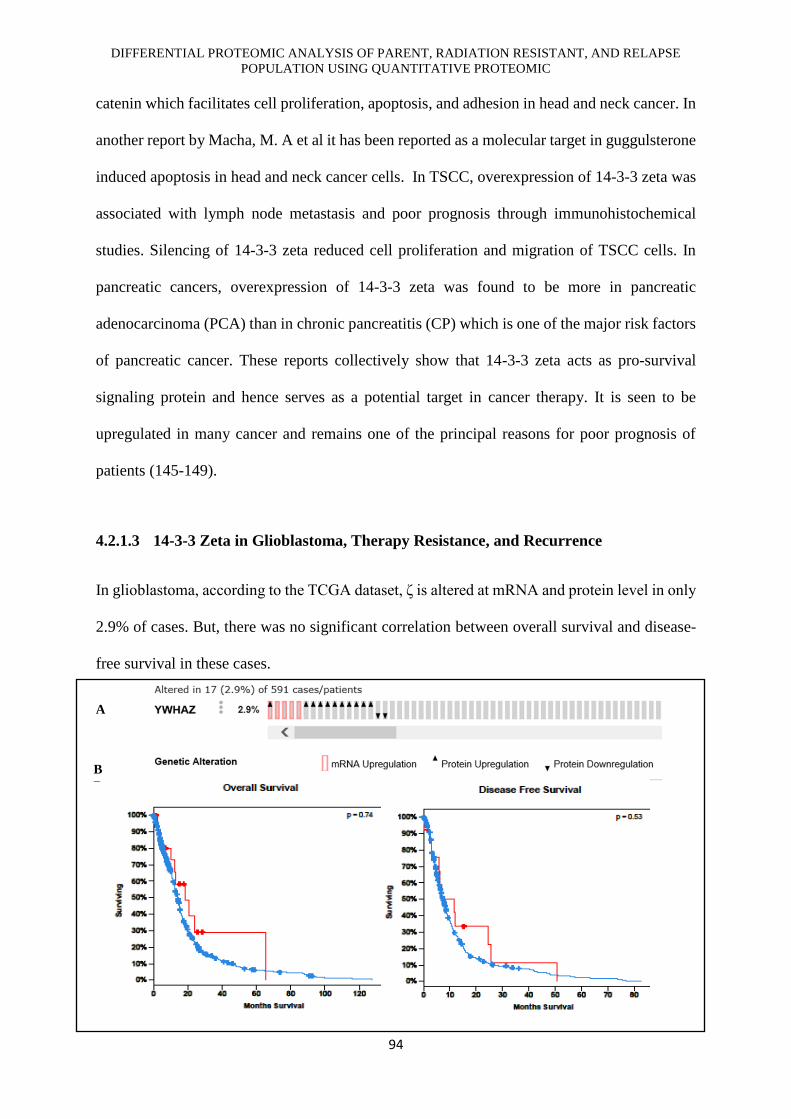
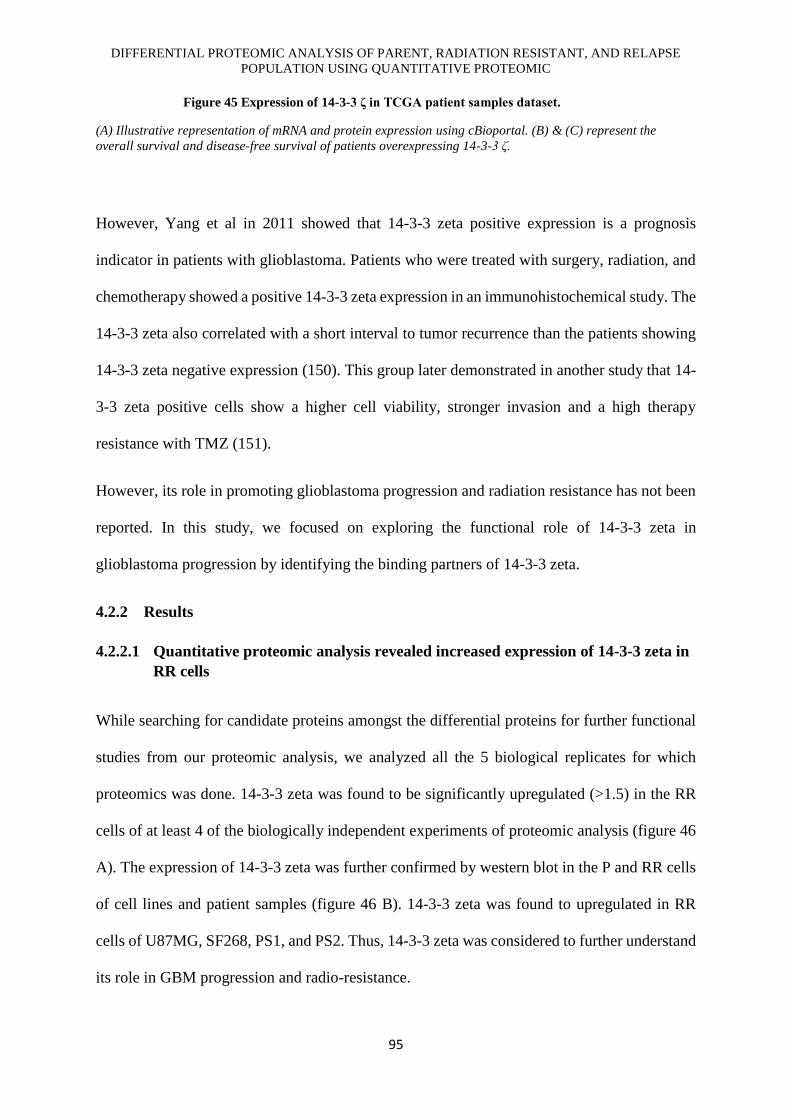
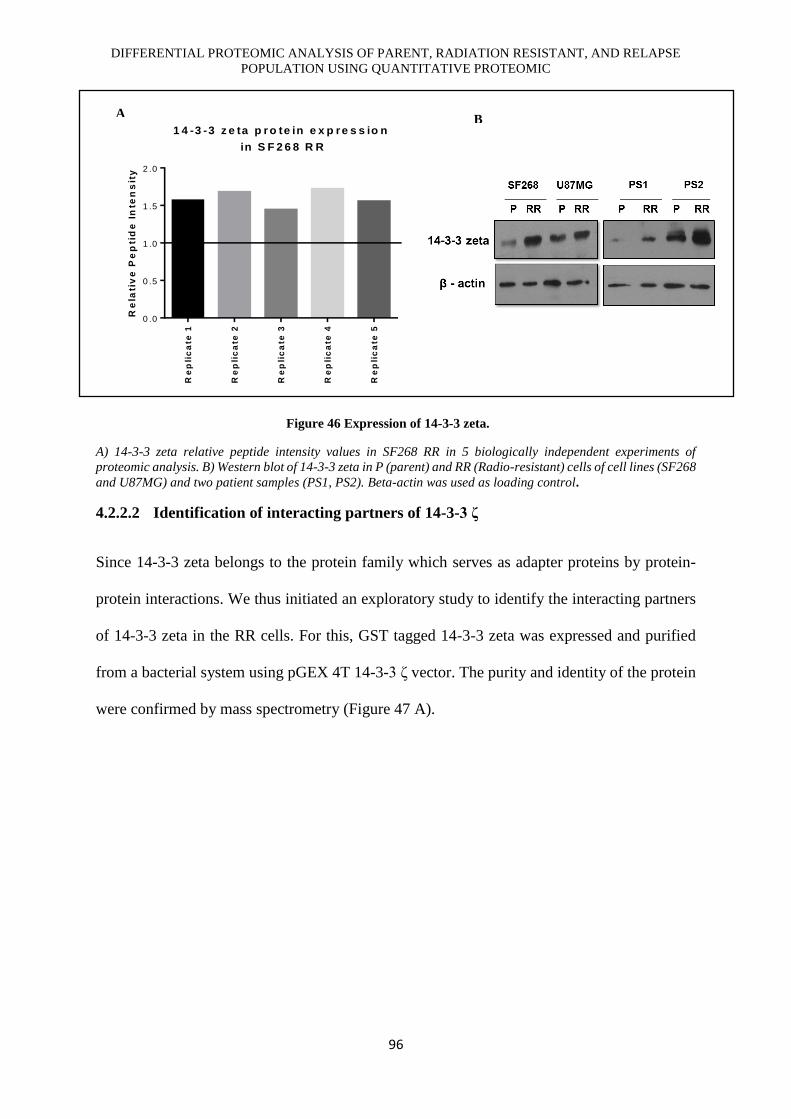
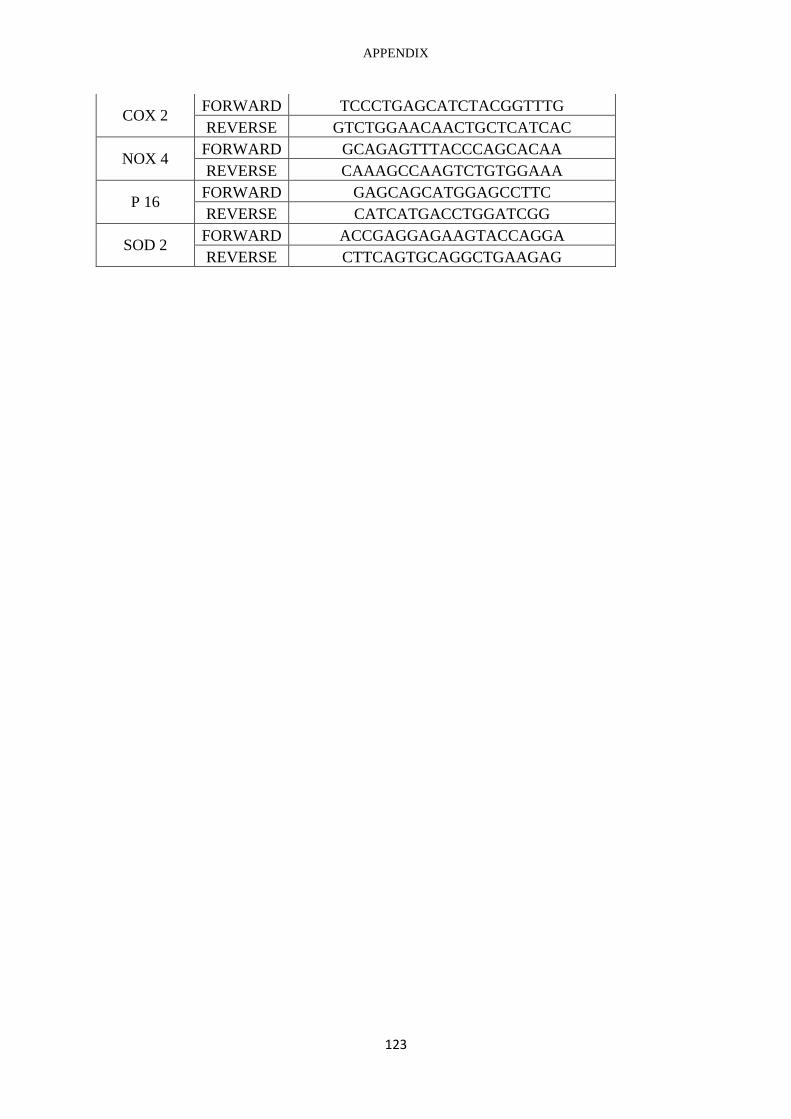
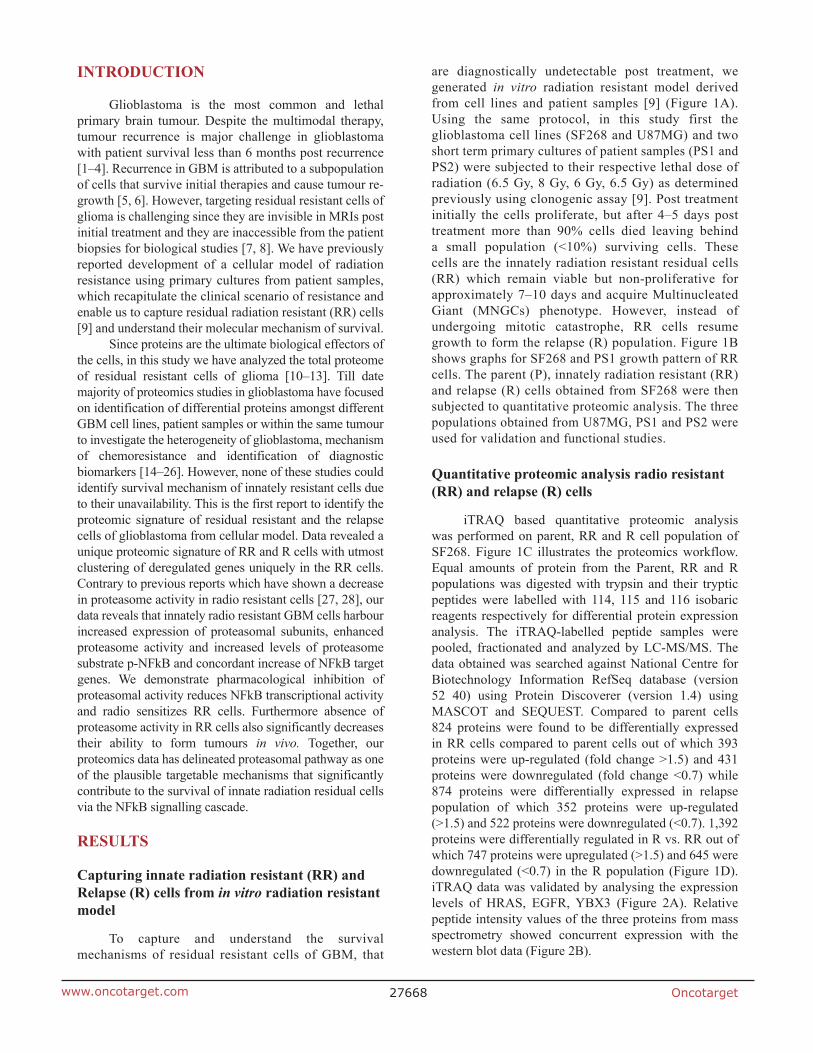
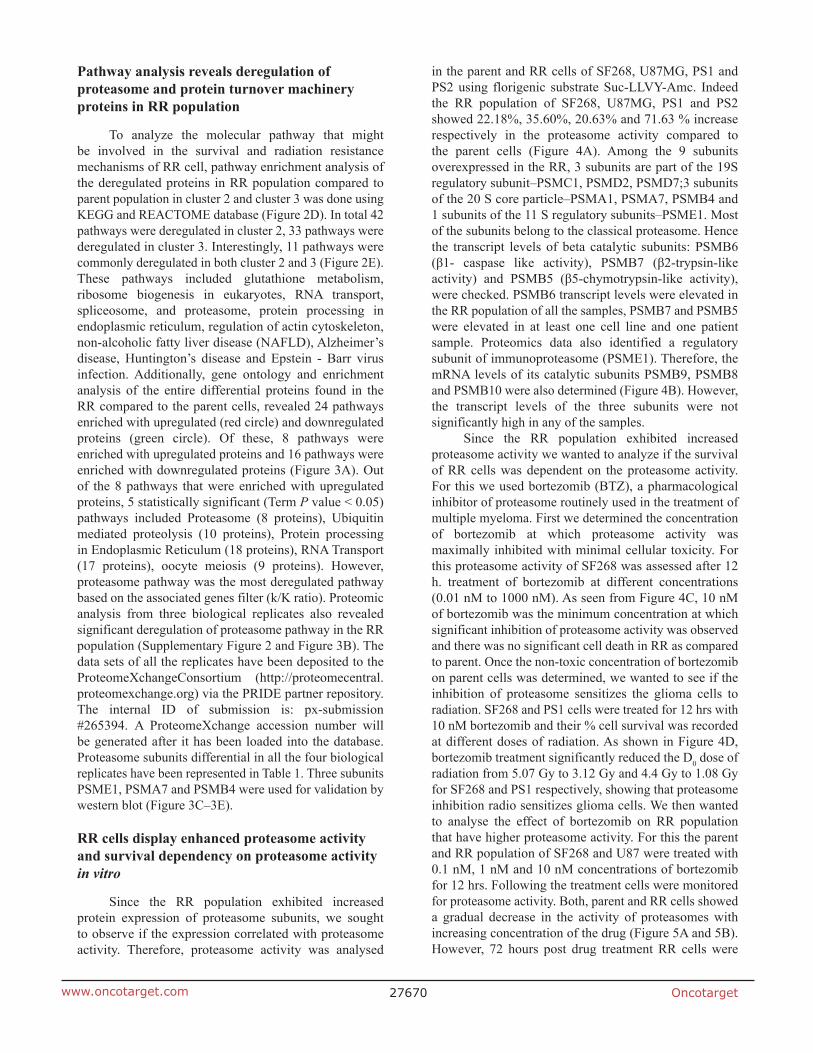
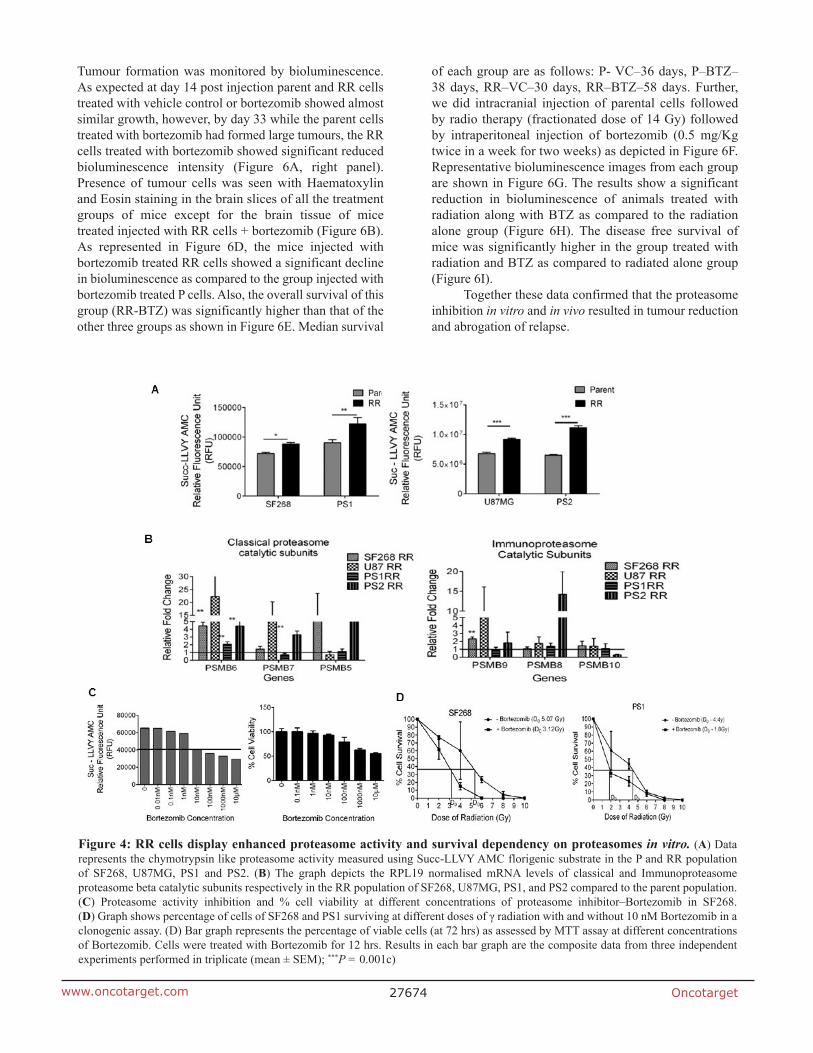
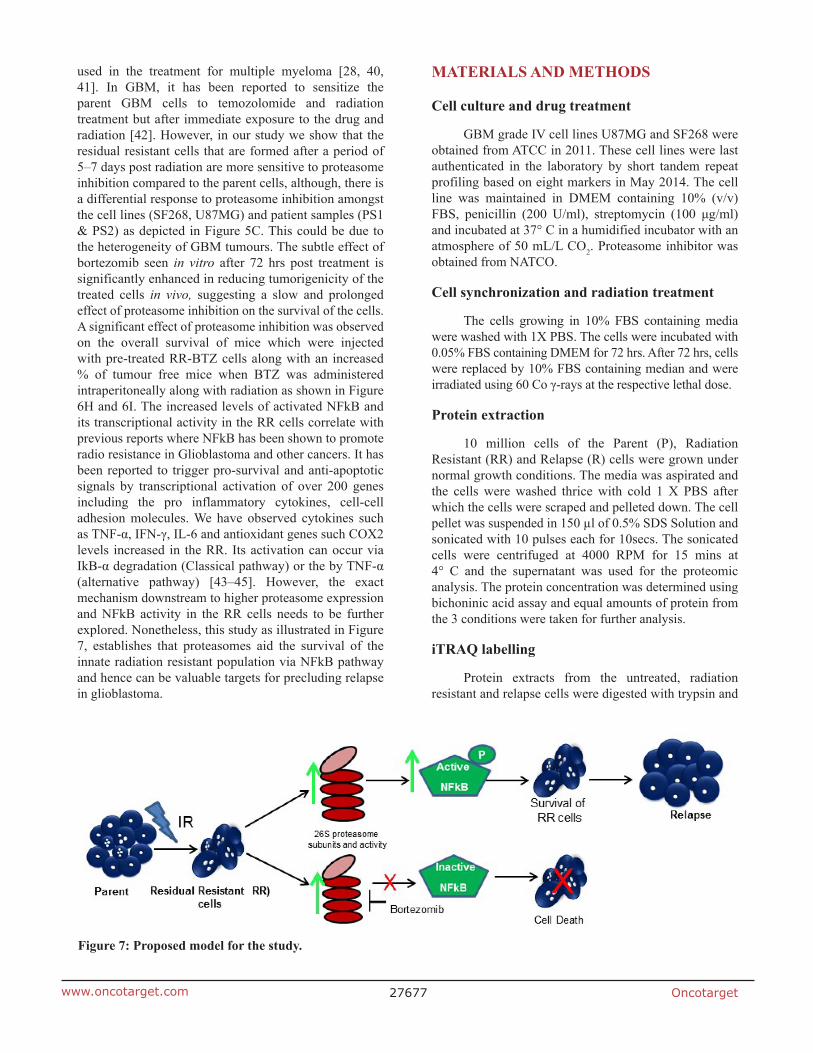
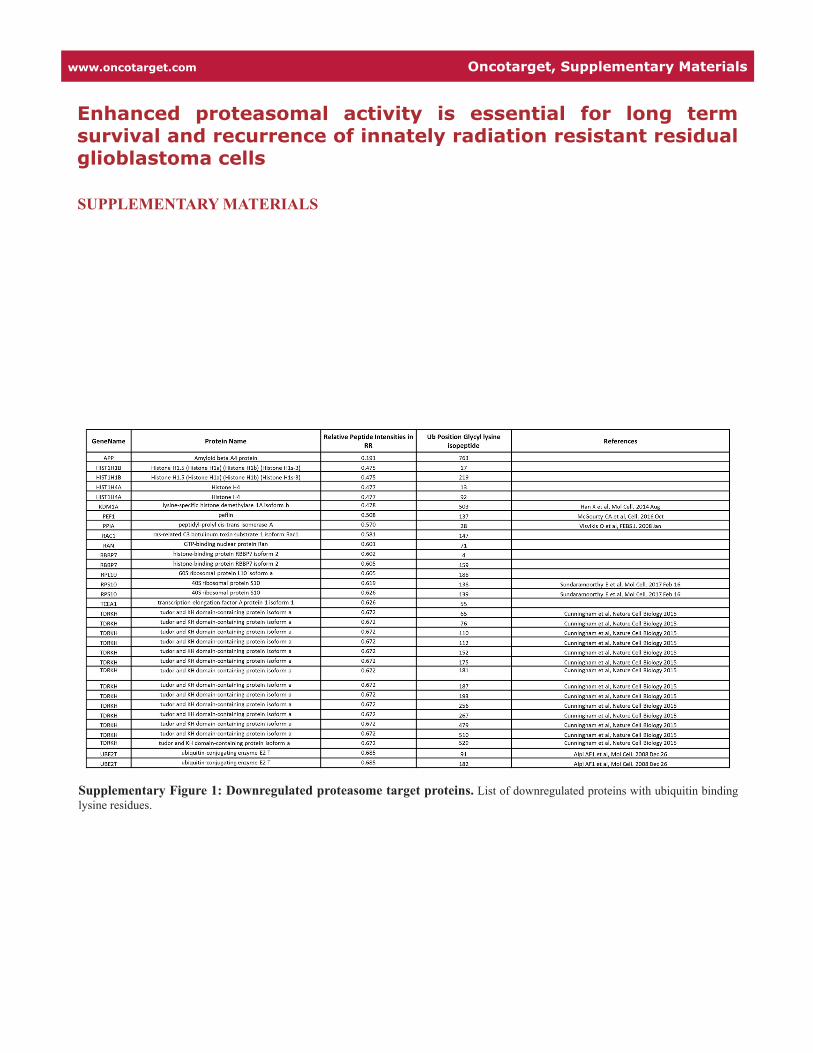
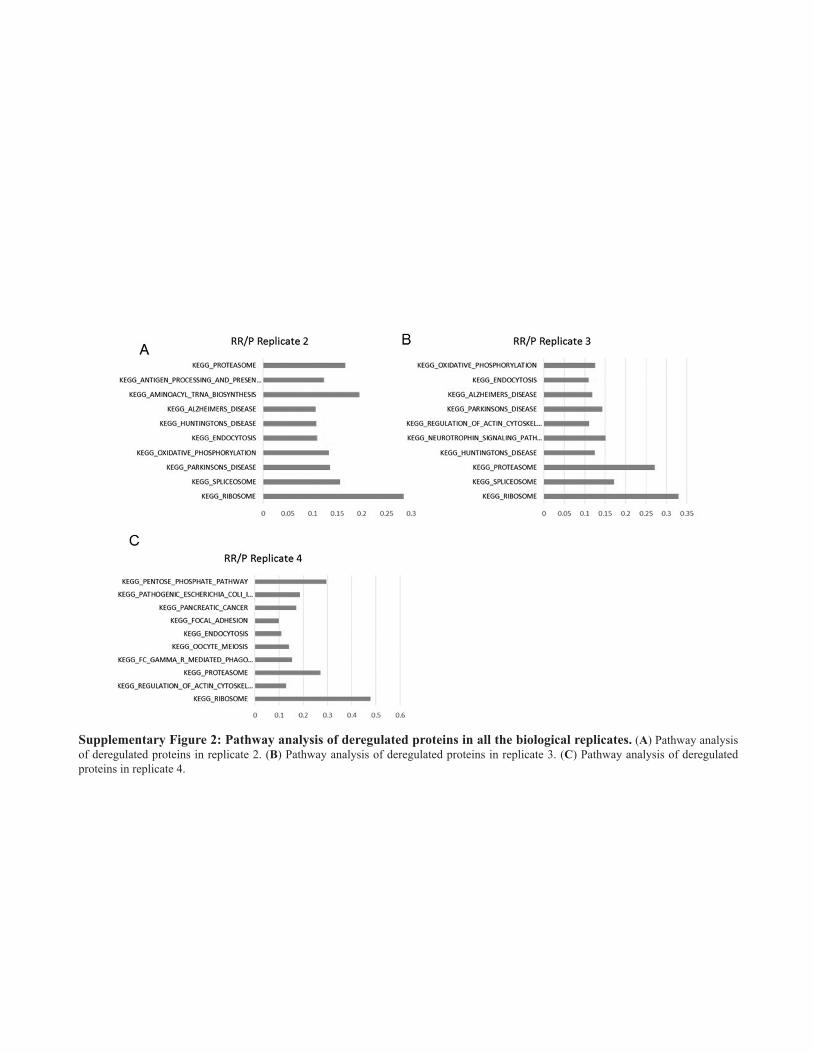

Recommended