Page 1
HorizonsETFs.com
Understanding Volatility: What is the VIX
and What Does it Mean for Your Portfolio?
February 2013
ETF solutions for every investor™
Eden Rahim, VP & Portfolio Manager, Options Strategist
Page 2
2 A Member of Mirae Asset Financial Group
“Markets are constantly in a state of uncertainty & flux, & money is
made by discounting the obvious & betting on the unexpected”
George Soros
Page 3
3 A Member of Mirae Asset Financial Group
Outline
Why volatility impacts our decision-making
Distribution of market returns over time
VIX: how is it constructed & why?
What causes volatility?
Volatility as a barometer of market uneasiness or complacency
Volatility as a tool to forecast market direction
New frontiers of analysing turbulence
Page 4
4 A Member of Mirae Asset Financial Group
The Great Modulation
Source: Adaptive Markets & New World Order, Andrew Lo – January 2nd, 1926-August 9, 2006
% h
isto
ric
vo
lati
lity
Page 5
5 A Member of Mirae Asset Financial Group
Overview
Volatility is about the uncertainty of a possible bad outcome, and how it
impacts our decision-making
Our future expectations are impacted by low volatility in an asymmetric way to
how it is when volatility is rising: comfort vs. fear
Every investor has a different way of coping with risk and volatility and must
find the level with which they can deal with it. Decisions about managing risk
are inherently subjective, so a ‘one size fits all’ solution is inadequate.
Over the past year, we’ve designed different portfolio hedges for Canadian
insurance company & U.S. hedge fund, each with a different aim to be
addressed
Best decision combines your expectations about possible outcomes &
preference for payoff
Page 6
6 A Member of Mirae Asset Financial Group
Investors confront Volatility in 3 general ways:
1. Passively – it’s part of all markets and must be endured,
2. Hedge against by taking steps to dampen it by either:
I. going to cash,
II. diversifying to non-correlated assets & ETFs,
III. buying put options or
IV. buying securities that rise in value with VIX,
3. Volatility as an asset class - agnostically seeking profit on both a rise and
fall in volatility.
Page 7
7 A Member of Mirae Asset Financial Group
About the VIX
Designed by Robert Whaley and launched in 1993
Has become the ubiquitous measure of market Volatility and Uncertainty
It is a measure of the average implied volatility of 8 index options on S&P
Composed or current month ATM and first OTM call and put options,
and same for next month
With a week to expiration, the front month is rolled to the 3rd month.
Page 8
8 A Member of Mirae Asset Financial Group
TSX Distribution of Daily Returns Pre-Crisis vs Post Crisis
Distinctly fatter left-tail & smaller percent of small gains
Source: HIMI, May 2008-February 2013
Source: HIMI, January 1980 to April 2008
Page 9
9 A Member of Mirae Asset Financial Group
Annual Distribution of Equity Returns is Right-tailed (142 Years)
Source: Horizons Investment Management Inc. , Annual Distribution of Returns, 1871-2013
Page 10
10 A Member of Mirae Asset Financial Group
Volatility Cycle: Simmer, Spike, Aftershocks, Decay, Steady-State
Source: Bank of America Merrill Lynch Research
Page 11
11 A Member of Mirae Asset Financial Group
What Causes Volatility? Distilling Telegraphed Forecasts
NOT HEADLINES! Fiscal Cliff = Y2K
When stocks become strongly correlated
Widening credit spreads / inverting treasury yield curve
Frequent two-way gaps & swings – even if in a small range
Leverage effect: As equities fall, balance sheet leverage increases
Deleveraging & credit unwinding, leading to illiquidity
Pressing need for hedging: Insurance costs most when your house is on fire
Fight-or-flight fear when bad outcomes seem inevitable & assurances of
‘Experts’ become hot air.
Page 12
12 A Member of Mirae Asset Financial Group
Skew: How Much More you Pay for OTM Puts vs OTM Calls:
Impacts the cost of hedging with options
Reflects relative cost of bearish vs. bullish hedging expectations
Costing the lowest amount for put protection relative to calls in 2 years
Source: B of A Merrill Dec 31-95 – Feb 1-2013
Page 13
13 A Member of Mirae Asset Financial Group
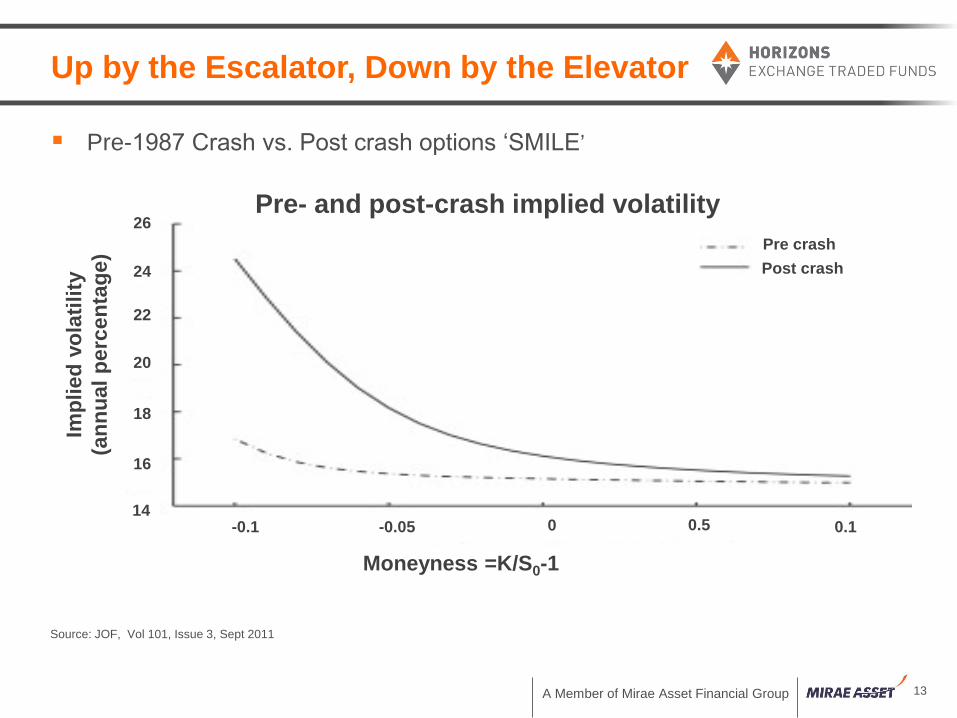
Up by the Escalator, Down by the Elevator
Pre-1987 Crash vs. Post crash options ‘SMILE’
Source: JOF, Vol 101, Issue 3, Sept 2011
Pre- and post-crash implied volatility
Imp
lied
vo
lati
lity
(an
nu
al
perc
en
tag
e)
Moneyness =K/S0-1
Pre crash
Post crash
0.1 0.5 0 -0.05 -0.1 14
16
18
20
22
24
26
Page 14
14 A Member of Mirae Asset Financial Group
Rising Correlation of Stocks Causes Rise in Volatility
When a market becomes stressed, strong stocks break down & join weak
stocks
Diversification ceases to buffer & most stocks become unstable together
Component volatility rises & each company trades with higher volatility
Indexes face macro & systemic risk offset by dampening of diversification
In contrast, companies have both risks, plus risks such as earnings
expectations, obsolescence, competition, pricing, demand, cost of credit,
leverage
A stressed market brings these into focus & re-prices company risk higher
Source: Bloomberg Data, Horizons Investment Management Inc. November 22,2010-November 22,2012
Page 15
15 A Member of Mirae Asset Financial Group
Volatility is Correlated to 5 Year Corporate Credit Spreads
Regression Of S&P Volatility (VIX) vs IG Credit Spreads (CDX IG 5 Yr)
Source: HIMI
Page 16
16 A Member of Mirae Asset Financial Group
Two-Year Swap Spread Vs. VIX
The spread at which 2 year fixed rate is exchanged for floating rate exposure
During poor liquidity or increasing turbulence in the credit markets, floating
rates reflect the current credit risk, while those in fixed rates are insulated
So those with fixed rates must be compensated for taking credit risk off the
hands of firms that need to exit that risk and go to cash
Note years before the financial crisis in 2008, this spread was rising
Source: Bloomberg, 1989-2013
Page 17
17 A Member of Mirae Asset Financial Group
Inverting Yield-Curve Lead Changes in Volatility Cycle by 2 Years
Source: Horizons Investment Management Inc., January 31, 1989-January 31, 2013
Inverse 105 – 25 Yield Curve
Page 18
18 A Member of Mirae Asset Financial Group
At Turning Points, Internal Intraday Volatility Telegraph Turbulence
Market becomes internally unstable before turns
Source: Horizons Investment Managemenet Inc. May 12, 1997-May 12, 2012
Page 19
19 A Member of Mirae Asset Financial Group
Level of VIX has Implicit Probability Forecast of Future Direction
Source: BAMI
Unlike equity, the distribution of volatility is heavily
dependent on its level, one of the factors that makes
volatility more predictable
When VIX is
higher than its
median, future
changes are
skewed to the left
When VIX is lower
than its median,
future changes are
skewed to the right
3 Month Change in VIX
Perc
en
tag
e o
f o
bserv
ati
on
s
Page 20
20 A Member of Mirae Asset Financial Group
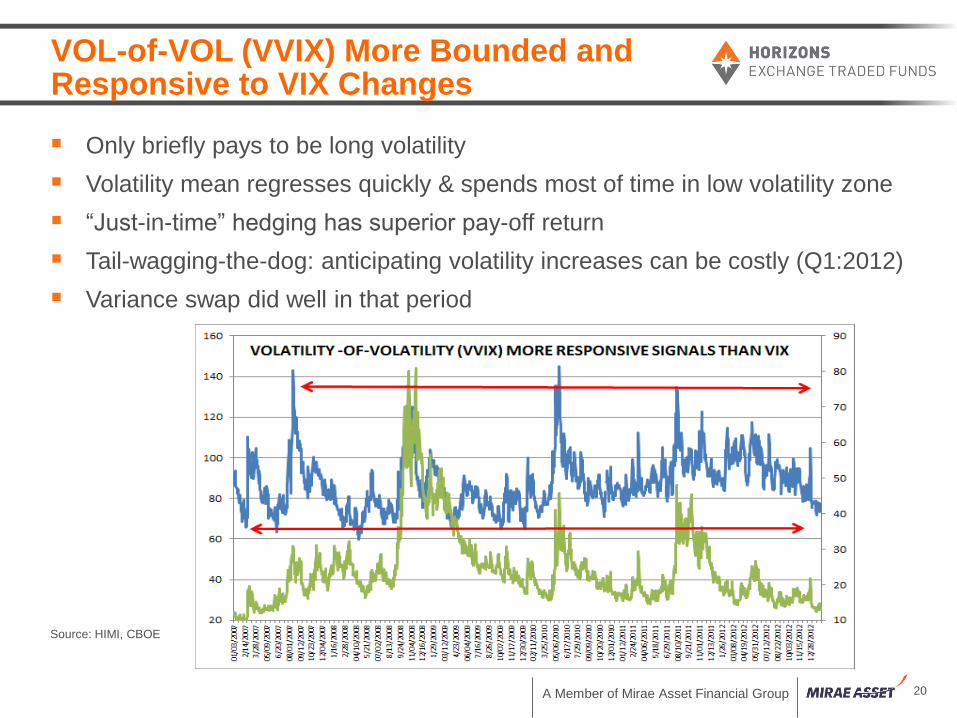
VOL-of-VOL (VVIX) More Bounded and Responsive to VIX Changes
Only briefly pays to be long volatility
Volatility mean regresses quickly & spends most of time in low volatility zone
“Just-in-time” hedging has superior pay-off return
Tail-wagging-the-dog: anticipating volatility increases can be costly (Q1:2012)
Variance swap did well in that period
Source: HIMI, CBOE
Page 21
21 A Member of Mirae Asset Financial Group
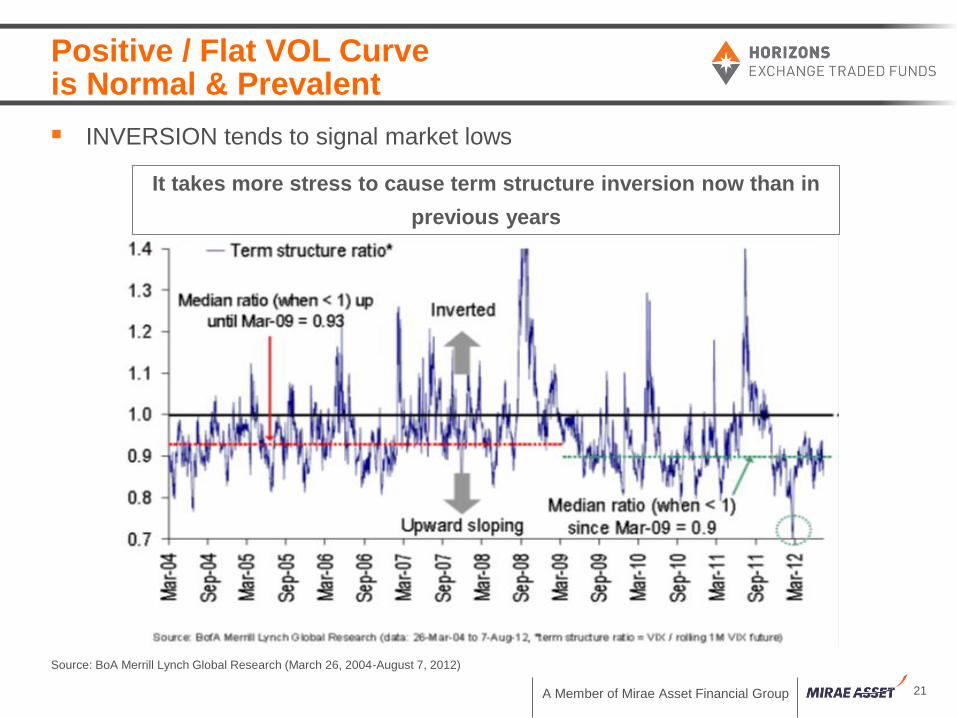
Positive / Flat VOL Curve is Normal & Prevalent
INVERSION tends to signal market lows
Source: BoA Merrill Lynch Global Research (March 26, 2004-August 7, 2012)
It takes more stress to cause term structure inversion now than in
previous years
Page 22
22 A Member of Mirae Asset Financial Group
Hurricane at our Doorstep: How VIX Curves Fluctuated During 2007-2009 Crisis
Source: Horizons Investment Management Inc. & CBOE, Data as of April 2, 2007-December 31, 2010
S&P and Phases of Change in VIX Forward
Curve During A) Topping B) Orderly
Page 23
23 A Member of Mirae Asset Financial Group
Hurricane at our Doorstep: How VIX Curves Fluctuated During 2007-2009 Crisis
Source: Horizons Investment Management Inc. CBOE
Page 24
24 A Member of Mirae Asset Financial Group
VIX Curve Spends Almost 80% of Time in Contango
In year with extreme drawdown, the market looks out and says “This is
unsustainable” and prices future Volatility expectations into Backwardation
Source: CBOE from January 1st, 2007 through December 31st, 2012
Trading Days Contango Backwardation % Contango % Backwardation
2007 251 177 74 70.52% 29.48%
2008 253 143 110 56.52% 43.48%
2009 252 202 50 80.16% 19.84%
2010 252 223 29 88.49% 11.51%
2011 252 178 74 70.63% 29.37%
2012 221 221 0 100.00% 0.00%
Total 1481 1144 337 77.25% 22.75%
Page 25
25 A Member of Mirae Asset Financial Group
Current Volatility Curve Extremely Steep (>80th Percentile)
Source: CBOE.com, data February 16,2013-December 20, 2014
Page 26
26 A Member of Mirae Asset Financial Group
Misbehavior of Markets by Benoit Mandelbrot
Father of chaos theory & fractal geometry,
turned MPT on its head
Markets are fractal, exhibit self-similarity &
scales with time
Markets are more risky than bell curve
suggest
Turbulence runs in streaks & clusters
Power laws better explain volatility spikes, as
it does cascade dynamics of fluid turbulence,
avalanches, earthquakes, solar flares….
Much of what we deem predictable is in fact
market noise
Market time is relative, expanding &
contracting with volatility
Page 27
27 A Member of Mirae Asset Financial Group
Interestingly, VIX Follows Power Law Distributions
Non-Financial work of Zipf’s law (physics), Navier-Stokes (combustion engine) & Omori
(seismology) better explain behavior of Volatility outbursts
Volatility ebb & flows in negative feedback loop until is pushed into positive feedback
that results in cascade spikes
Source: HIMI
Page 28
28 A Member of Mirae Asset Financial Group
Hedging: PUT Options vs Long VIX Products
Unlike Put Options, VIX products require 4 simultaneous bets: direction, path,
volatility increase, & shift in shape of curve
1. Both hedge against downside directional moves
2. Puts respond almost immediately while VIX is delayed
3. Puts benefit if market moves down without increase in Volatility ie. orderly
decline, while VIX requires an increase in Volatility
4. Puts are not concerned with the Volatility curve, while a shift in curve may
impact where long VIX product is profitable even in down market
Page 29
29 A Member of Mirae Asset Financial Group
Summary
Volatility impacts our decision making, requiring an actionable roadmap
Position for normal volatility, be alert to signs when it’s becoming abnormal
One size doesn’t fit all: every investor has own tolerance & return expectation
Investors greet volatility either passively, to be hedged, or traded
VIX has become the ubiquitous barometer of market uncertainty
Since the crisis, daily returns have become more ‘left-tailed’ distributed
Each phase of volatility must be confronted uniquely: simmer, spike, aftershock, decay,
& steady-state
Volatility impacted by: correlation, credit spreads, leverage, yield-curve & fear
Level & curve of volatility is itself a forecast. That can be said of few assets
Cascade dynamics & power laws best explain turbulence of volatility
Tools have existed for a 150 years to dampen & distribute risk
Horizons ETFs offers 3 volatility ETFs HVU HUV HVI
Page 30
30 A Member of Mirae Asset Financial Group
Disclaimer
The views and opinions expressed herein are of a general nature and the suggestions are not and should not be considered as advice to purchase
or to sell mentioned securities. Before making any investment decision, please consult your investment advisor or advisors.
Commissions, trailing commissions, management fees and expenses all may be associated with an investment in exchange traded products
managed by AlphaPro Management Inc and Horizons ETFs Management (Canada) Inc. (the "Horizons Exchange Traded Products"). The Horizons
Exchange Traded Products are not guaranteed, their values change frequently and past performance may not be repeated. Please read the
relevant prospectus before investing.
The Horizons Exchange Traded Products consist of the Horizons Index ETFs ("Index ETFs"), Bull Plus and Bear Plus ETFs ("Plus ETFs"), Inverse
ETFs ("Inverse ETFs"), VIX ETFs (defined below) and active ETFs. The Plus ETFs and certain other Horizons Exchange Traded Products use
leveraged investment techniques that magnify gains and losses and result in greater volatility in value. These Horizons Exchange Traded Products
are subject to leverage risk and may be subject to aggressive investment risk and price volatility risk, which, where applicable, are described in
their respective prospectuses. Each Plus ETF seeks a return, before fees and expenses, that is either 200% or -200% of the performance of a
specified underlying index, commodity or benchmark (the "Target") for a single day. Each Index ETF or Inverse ETF seeks a return that is 100% or
- 100%, respectively, of the performance of a Target. Due to the compounding of daily returns, a Plus ETF's or Inverse ETF's returns over periods
other than one day will likely differ in amount and possibly direction from the performance of their respective Target(s) for the same period. The
Horizons Exchange Traded Products whose Target is the S&P 500 VIX Short-Term Futures Index™ (the "VIX ETFs"), one of which is a Plus ETF
and one of which is an Index ETF, as described in their prospectus, are speculative investment tools that are not conventional investments. The
VIX ETFs' Target is highly volatile. As a result, the VIX ETFs are not generally viewed as stand-alone long-term investments. Historically, the VIX
ETFs' Target has tended to revert to a historical mean. As a result, the performance of the VIX ETFs' Target is expected to be negative over the
longer term and neither the VIX ETFs nor their Target are expected to have positive long term performance. Investors should monitor their
holdings, as frequently as daily, to ensure that they remain consistent with their investment strategies.
All trademarks/service marks are registered by their respective owners. None of the owners thereof or any of their affiliates sponsor, endorse, sell,
promote or make any representation regarding the advisability of investing in the Horizons Exchange Traded Products. Complete trademark and
service-mark information is available at www.horizonsetfs.com/pub/en/Trademark.aspx