UNESCO- GRAPHIC project 2004- GRAPHIC : G roundwater R esources A ssessment under the P ressures of H umani ty and C limate Change Makoto Taniguchi 1 and Alice Aureli 2 1: Research Institute for Humanity and Nature 2: UNESCO-IHP
Transcript
UNESCO- GRAPHIC project2004-
GRAPHIC: Groundwater Resources Assessment under the Pressures of Humanity and Climate Change
Makoto Taniguchi1 and Alice Aureli21: Research Institute for Humanity and Nature
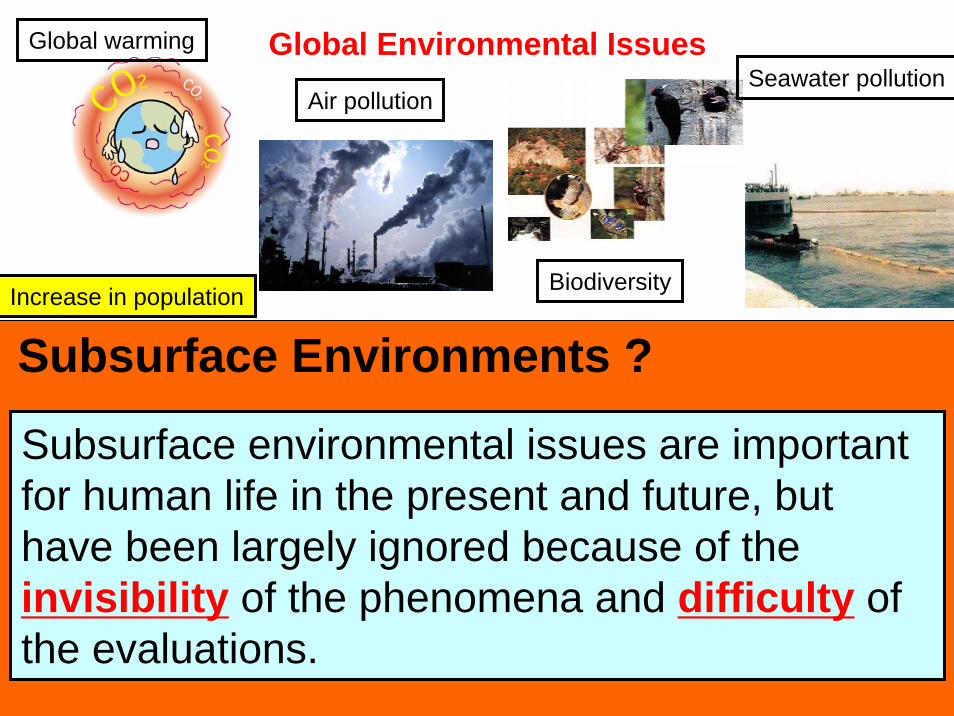
Subsurface environmental issues are important for human life in the present and future, but have been largely ignored because of the invisibility of the phenomena and difficulty of the evaluations.
Biodiversity
Seawater pollutionGlobal warming
Air pollution
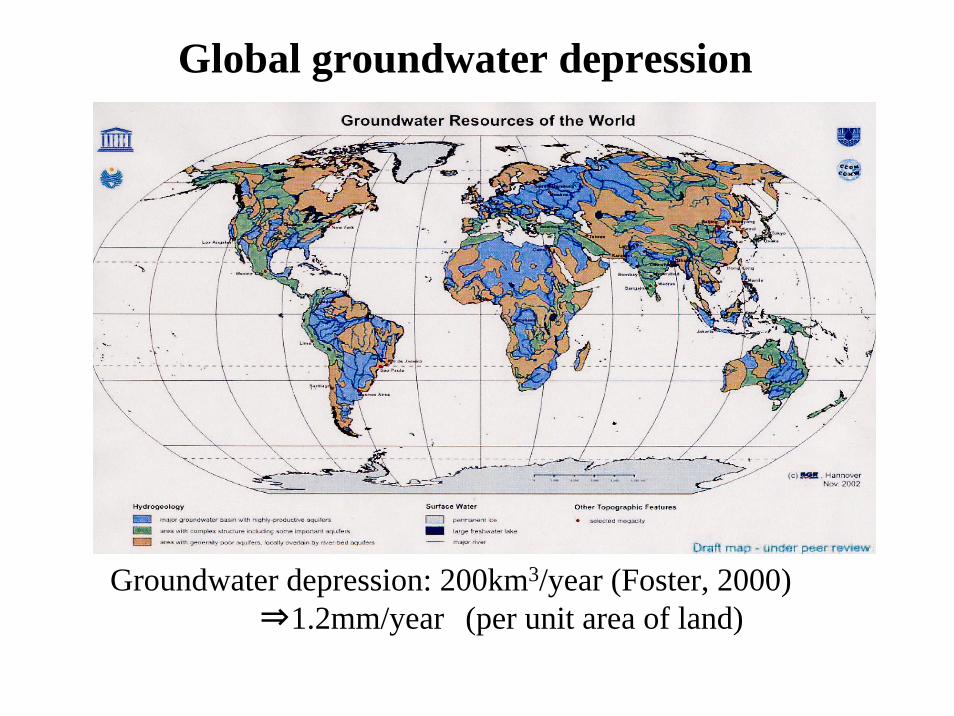
Groundwater depression: 200km3/year (Foster, 2000) ⇒1.2mm/year (per unit area of land)
Global groundwater depression
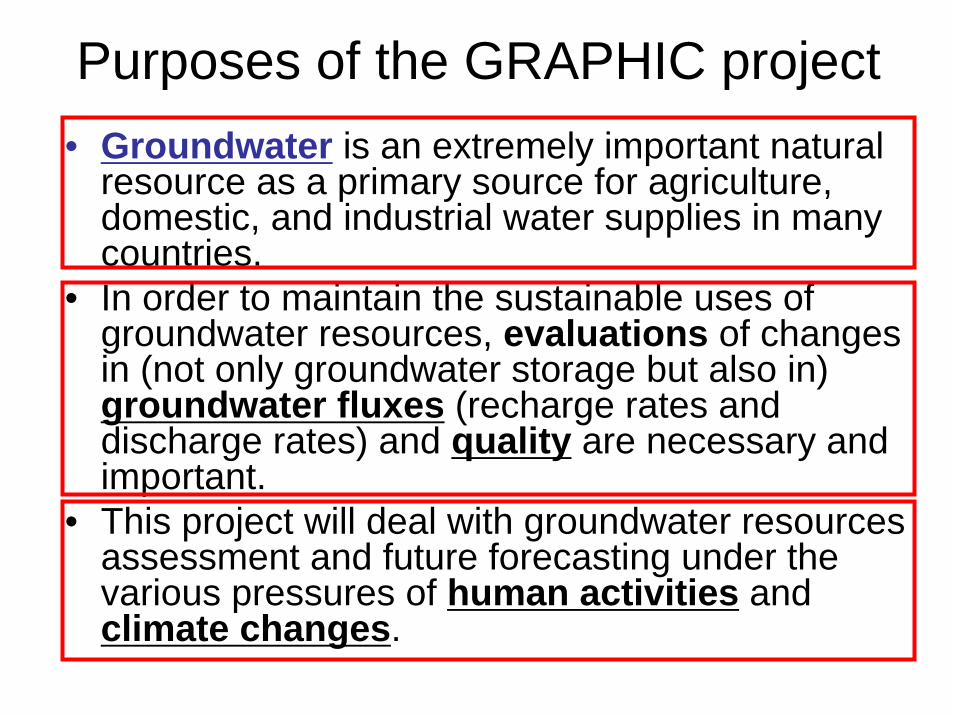
Purposes of the GRAPHIC project• Groundwater is an extremely important natural
resource as a primary source for agriculture, domestic, and industrial water supplies in many countries.
• In order to maintain the sustainable uses of groundwater resources, evaluations of changes in (not only groundwater storage but also in) groundwater fluxes (recharge rates and discharge rates) and quality are necessary and important.
• This project will deal with groundwater resources assessment and future forecasting under the various pressures of human activities and climate changes.
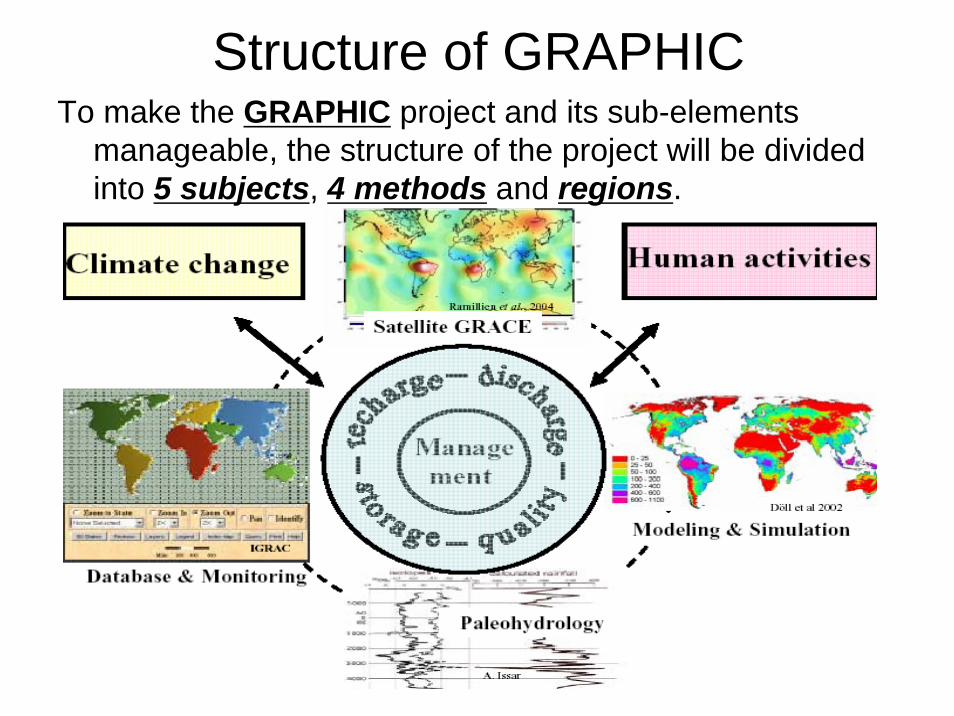
Structure of GRAPHIC To make the GRAPHIC project and its sub-elements
manageable, the structure of the project will be divided into 5 subjects, 4 methods and regions.
Subject 1
Changes in groundwater recharge rates
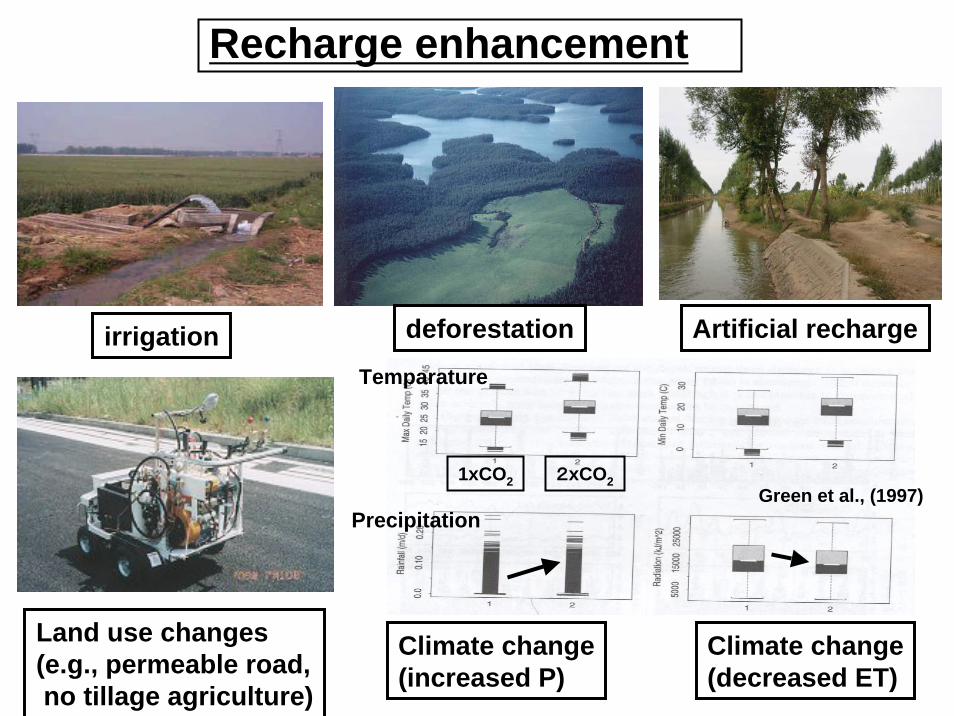
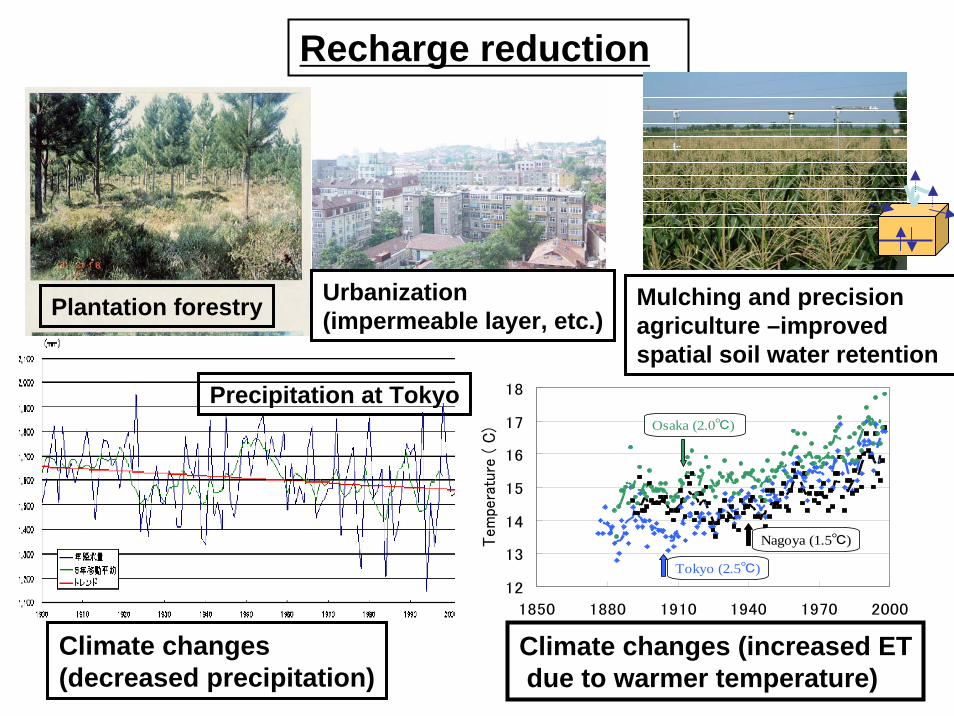
Recharge enhancement
irrigation
Land use changes(e.g., permeable road,no tillage agriculture)
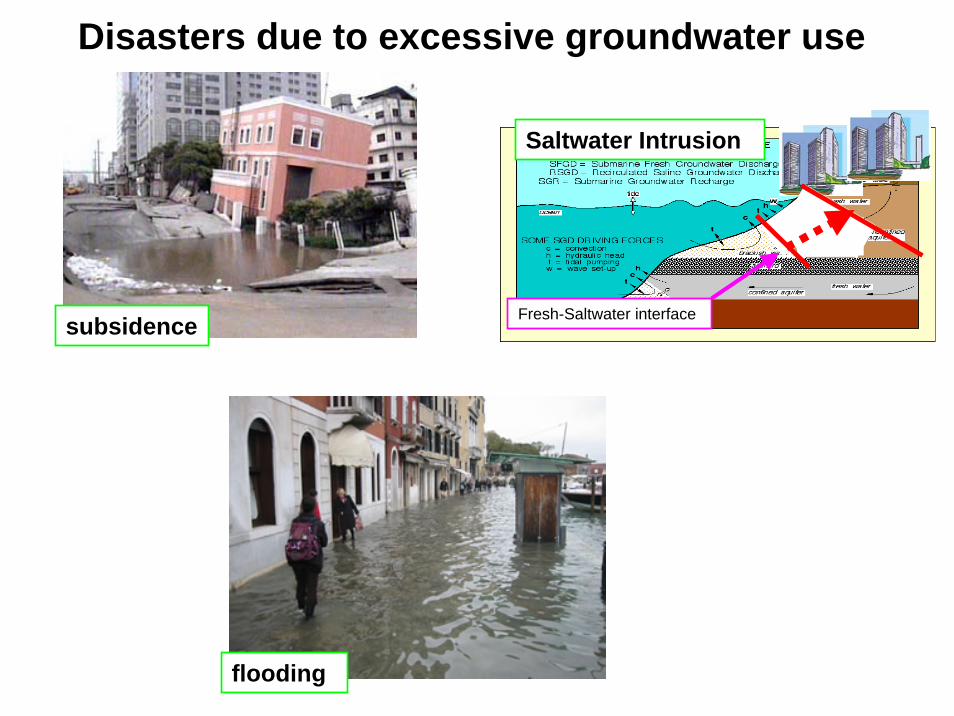
• Groundwater mining• Negative balance between recharge and discharge• Saltwater intrusion due to excessive pumping• Saltwater intrusion by sea level rise due to climate change• Groundwater contamination
North of Yellow River, China High Plain aquifer, USA
Reduction of Groundwaterstorage
Saltwater Intrusion
subsidence
flooding
Fresh-Saltwater interface
Disasters due to excessive groundwater use
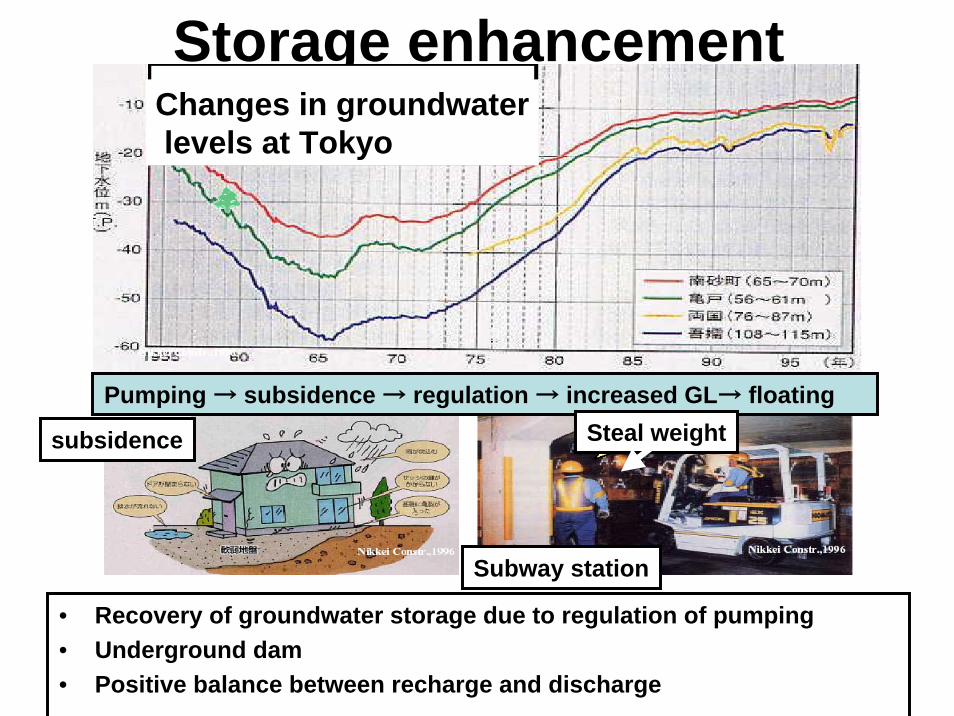
Storage enhancement
• Recovery of groundwater storage due to regulation of pumping• Underground dam• Positive balance between recharge and discharge
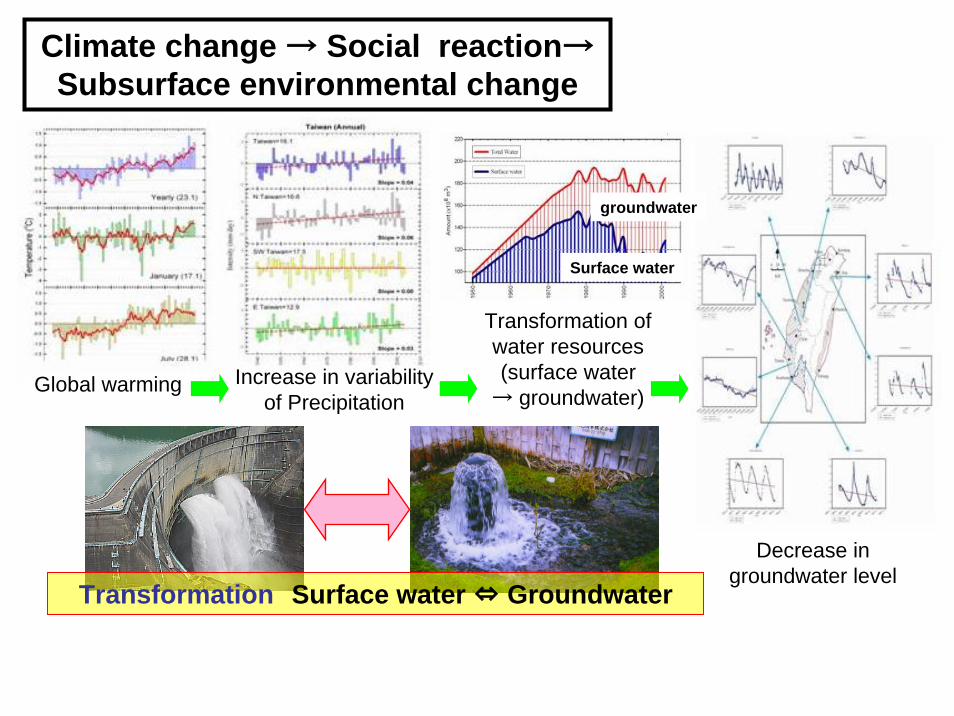
Climate change → Social reaction→Subsurface environmental change
groundwater
Surface water
Global warming Increase in variability of Precipitation
Transformation of water resources (surface water
→ groundwater)
Decrease in groundwater level
Transformation Surface water ⇔ Groundwater
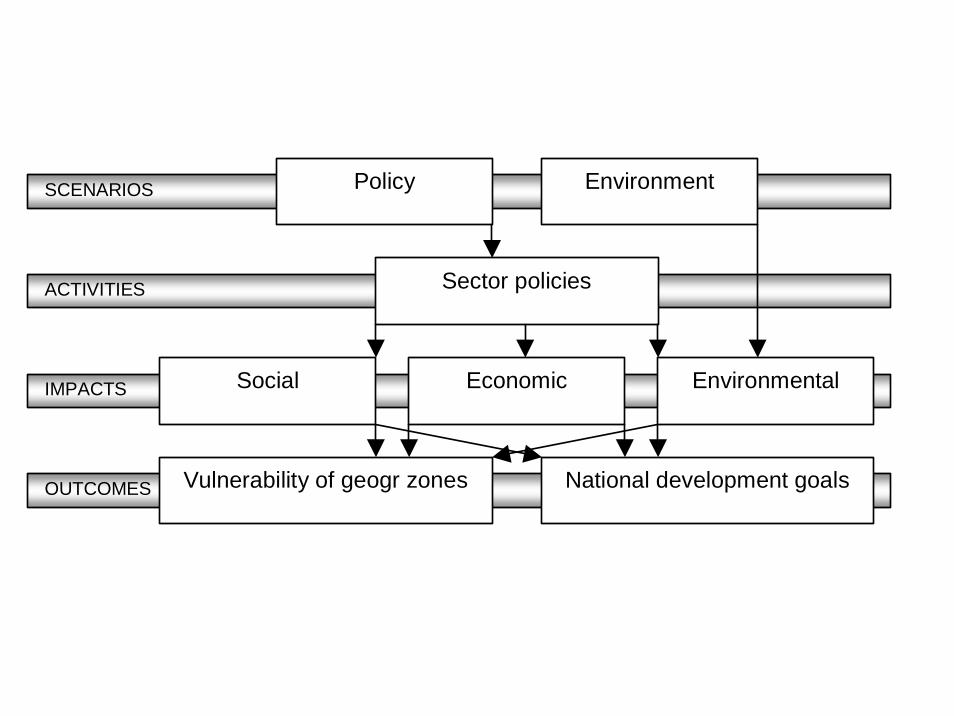
Subject 5
Managements
OUTCOMES
SCENARIOS Environment Policy
National development goalsVulnerability of geogr zones
IMPACTS Environmental Economic Social
ACTIVITIES Sector policies
Method 1Database and monitoring
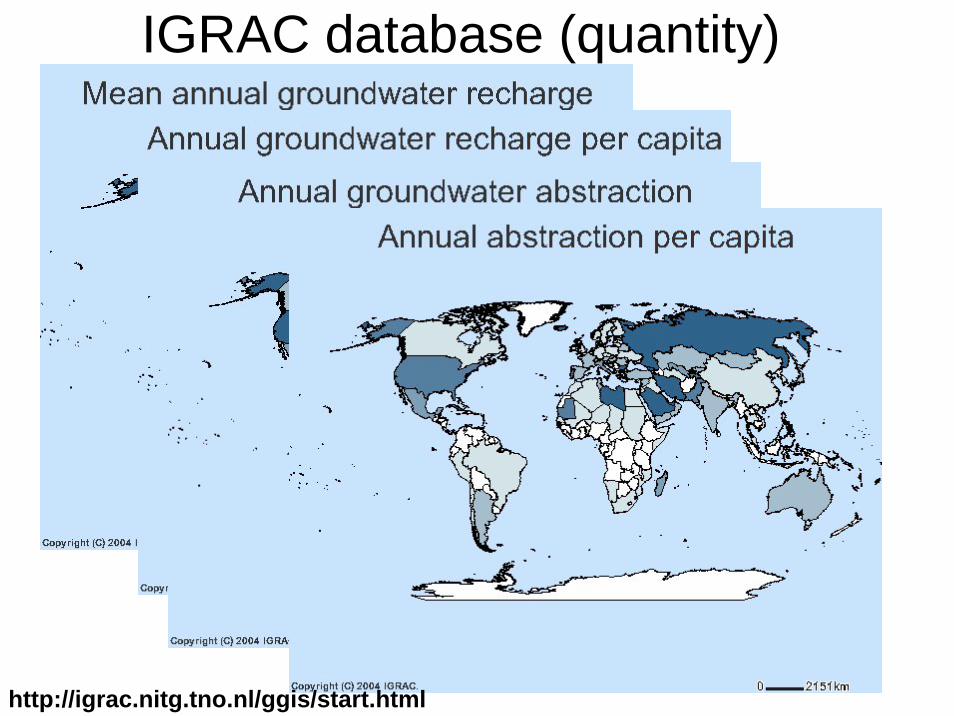
IGRAC database (quantity)
http://igrac.nitg.tno.nl/ggis/start.html
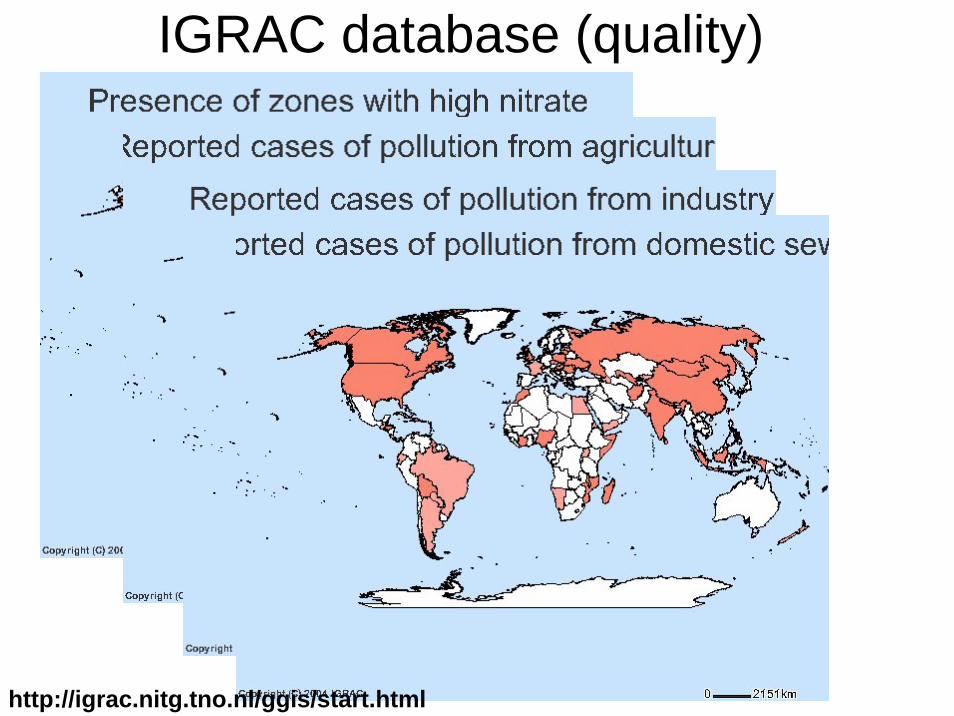
IGRAC database (quality)
http://igrac.nitg.tno.nl/ggis/start.html
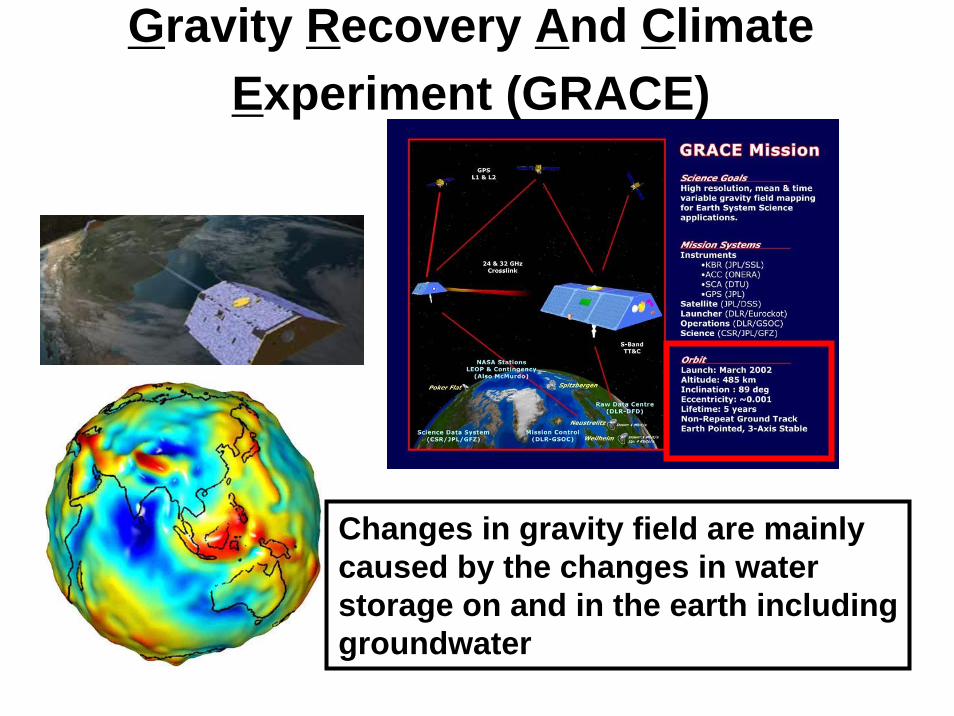
Method 2Satellite GRACE
Changes in gravity field are mainly caused by the changes in water storage on and in the earth includinggroundwater
Gravity Recovery And Climate Experiment (GRACE)
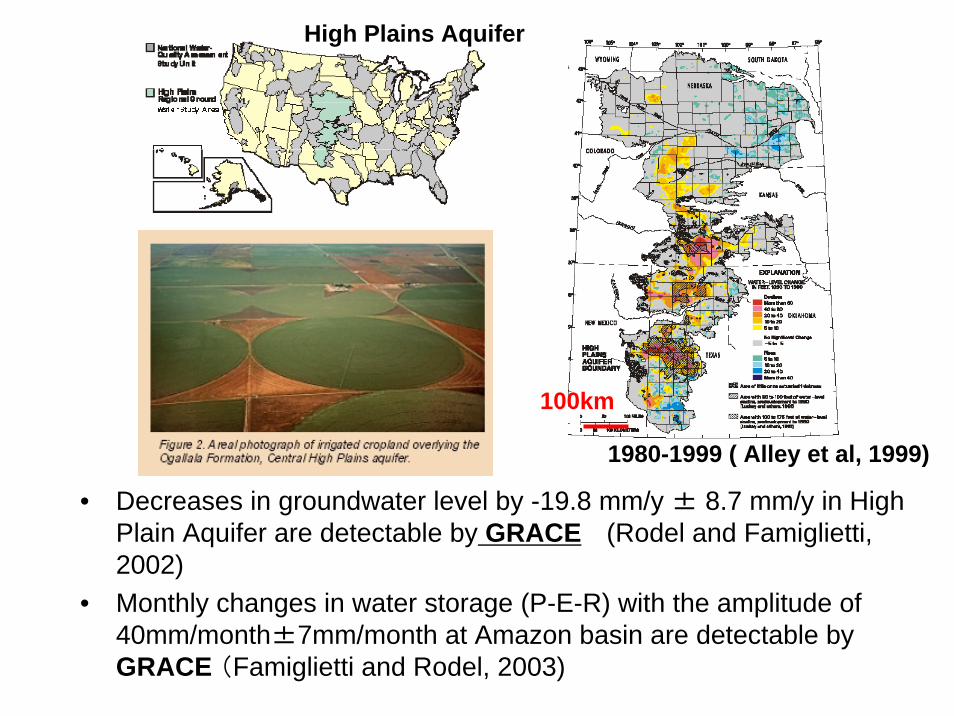
1980-1999 ( Alley et al, 1999)
100km
• Decreases in groundwater level by -19.8 mm/y ± 8.7 mm/y in High Plain Aquifer are detectable by GRACE (Rodel and Famiglietti, 2002)
• Monthly changes in water storage (P-E-R) with the amplitude of 40mm/month±7mm/month at Amazon basin are detectable by GRACE (Famiglietti and Rodel, 2003)
High Plains Aquifer
Method 3Modeling and simulation
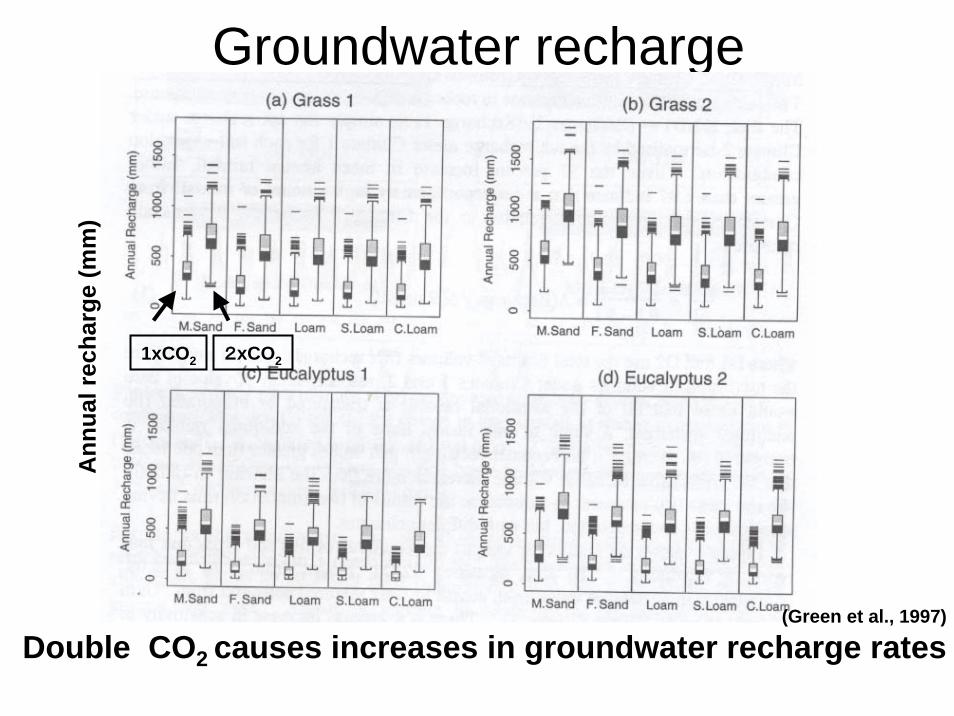
Groundwater recharge
Double CO2 causes increases in groundwater recharge rates(Green et al., 1997)
Ann
ual r
echa
rge
(mm
)
1xCO2 2xCO2
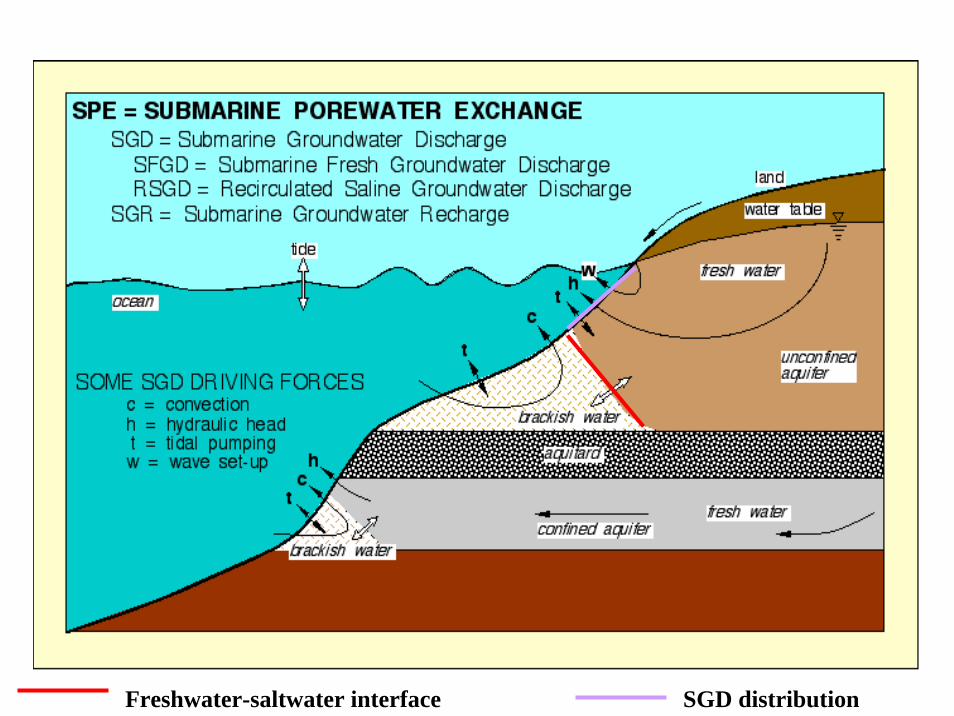
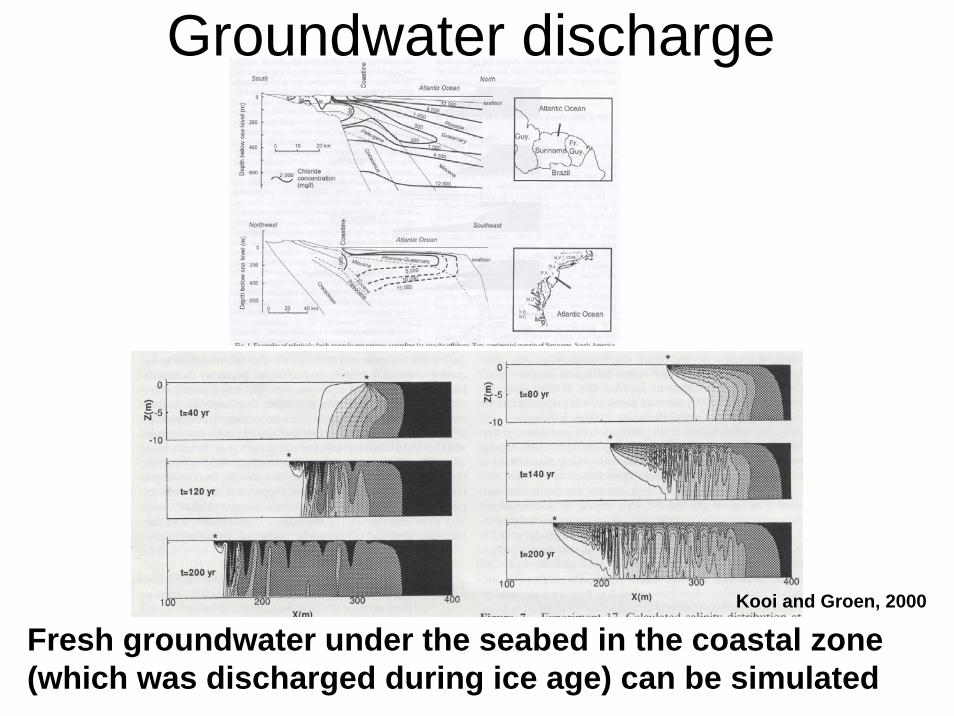
Groundwater discharge
Kooi and Groen, 2000
Fresh groundwater under the seabed in the coastal zone (which was discharged during ice age) can be simulated
Method 4Paleohydrology
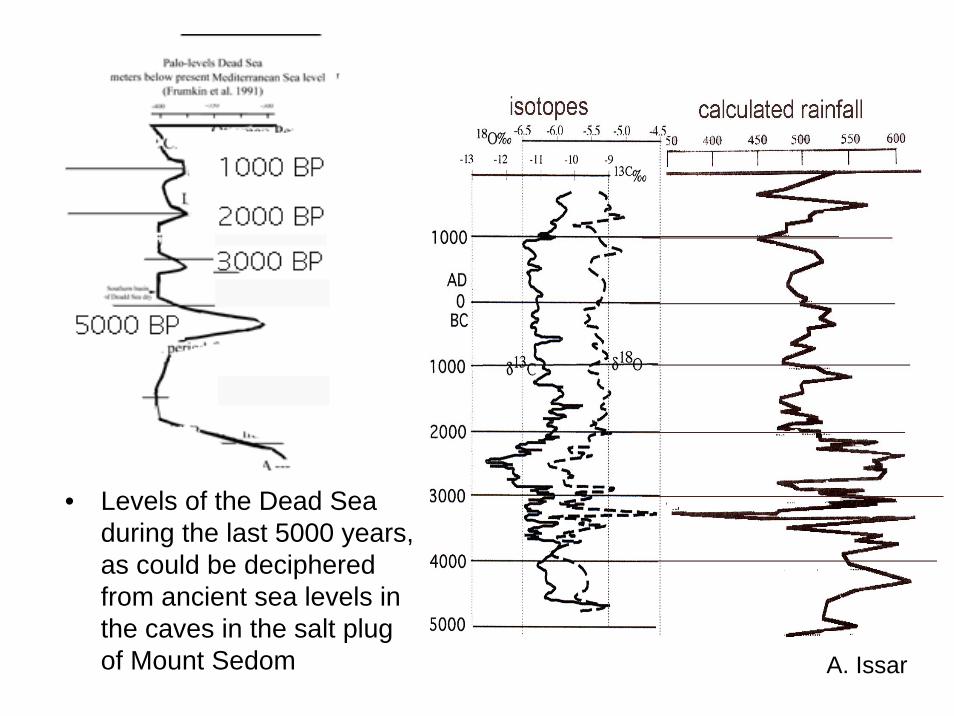
• Levels of the Dead Sea during the last 5000 years, as could be deciphered from ancient sea levels in the caves in the salt plug of Mount Sedom A. Issar
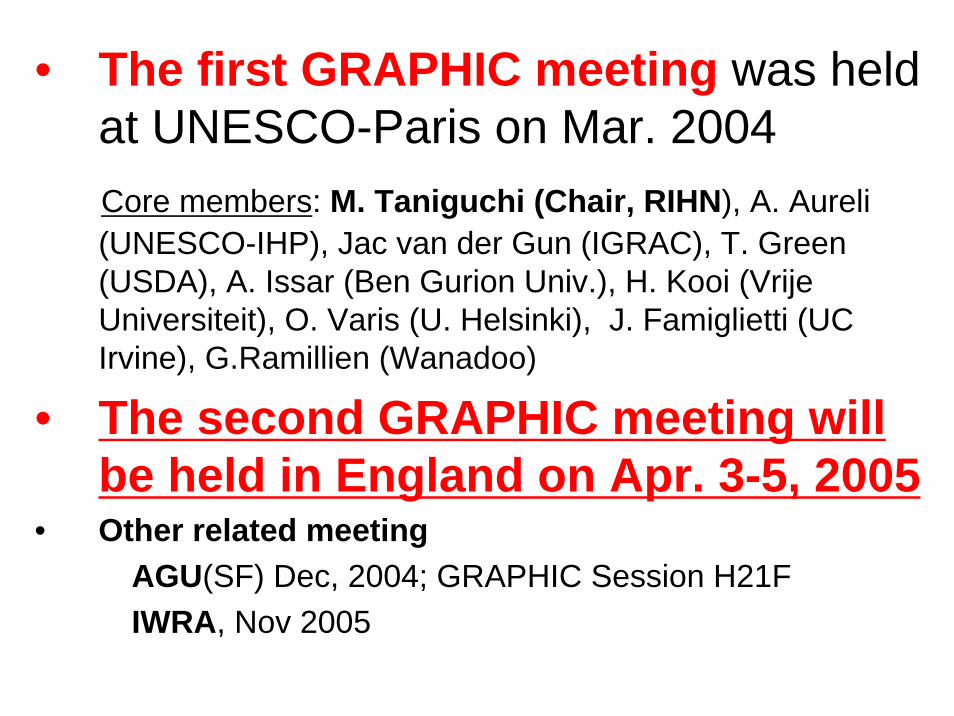
• The first GRAPHIC meeting was held at UNESCO-Paris on Mar. 2004 Core members: M. Taniguchi (Chair, RIHN), A. Aureli(UNESCO-IHP), Jac van der Gun (IGRAC), T. Green (USDA), A. Issar (Ben Gurion Univ.), H. Kooi (VrijeUniversiteit), O. Varis (U. Helsinki), J. Famiglietti (UC Irvine), G.Ramillien (Wanadoo)
• The second GRAPHIC meeting will be held in England on Apr. 3-5, 2005
• Other related meetingAGU(SF) Dec, 2004; GRAPHIC Session H21FIWRA, Nov 2005
GRAPHIC: Cooperation with research organizations and groups
• UNESCO/IHP http://www.unesco.org/water/ihp/• IGRAC http://igrac.nitg.tno.nl/homepage.html• WMO http://www.wmo.ch/index-en.html• GWSP (Global Water System Project) http://www.gwsp.org/• IAH (International Association of Hydrogeology), Commission
on “Hydrogeology and Climate changes” http://www.iah.org/• IAHS (International Association of Hydrological Sciences),
International commission on groundwater http://host.uniroma3.it/associazioni/iahs_icgw/
• CUAHSI (Consortium of Universities for the Advancement of Hydrologic Sciences, Inc.) http://www.CUAHSI.org/