UNESCO INSTITUTE for STATISTICS Financing Education: Investments for the Future in Latin America and the Caribbean Third Meeting of Ministers of Education Albert Motivans UNESCO Institute for Statistics Mexico
Transcript
UNESCOINSTITUTE for STATISTICS
Financing Education:Investments for the Future in
Latin America and the Caribbean
Third Meeting of Ministers of Education
Albert Motivans UNESCO Institute for Statistics Mexico City, 12 August 2003
UNESCOINSTITUTE for STATISTICS
2
Data quality issues Coverage (private, local government) Comparability
Adopting and implementing upon a common framework and approach
Summit of the Americas technical assistance programme
World Education Indicators Programme Finance comparability study
Comparing education finance indicators
UNESCOINSTITUTE for STATISTICS
3
Investing in Education
1. Educational participation – past and future
2. Public and private funding for education
3. Resources per student and per school career
4. Meeting regional goals for 2010
UNESCOINSTITUTE for STATISTICS
4
A Latin American success story…
Source: UNESCO/OECD, 2003; OECD, 1999
02468
1012141618
Mea
n ye
ars
of s
choo
ling
Adult population School expectancy (5 year-old)
UNESCOINSTITUTE for STATISTICS
5
Expanding educational opportunities
Most countries are near UPE and some enrol more than 90 per cent of youth up to age 15
Secondary net enrolment rates have risen in the 1990s and range from 26 per cent (Guatemala) to 86 per cent (Bahamas)
Tertiary graduation rates are over 20 per cent in Chile and Argentina, but under 10 per cent in Brazil and Paraguay
UNESCOINSTITUTE for STATISTICS
6
The distribution of opportunities
Source: IDB as cited in Wolff and De Moura Castro, 2003
0
2
4
6
8
10
12
14
Mea
n ye
ars
of s
choo
ling
Richest 10% Poorest 30%
UNESCOINSTITUTE for STATISTICS
7
Education expenditure and primary enrolments, 1975 to 1997
0
50
100
150
200
250
5 10 15 20 25 30 35 40
Current Expenditure (billions of US$ 95)
En
rolm
en
t (m
illio
ns)
Sub-Saharan Africa
Arab states
Latin America / Caribbean
Eastern Asia / Oceania
Southern Asia
1997
1975
1975
1975
1975
1975
1997
1997
1997
1997
1997
UNESCOINSTITUTE for STATISTICS
8
Education expenditure and primary classroom inputs, 1975 to 1997
20
25
30
35
40
45
50
5 10 15 20 25 30 35 40
Current Expenditure (billions of US$ 95)
Pu
pil/
Te
ach
er
Ra
tio
Sub-Saharan Africa
Arab states
Latin America / Caribbean
Eastern Asia / Oceania
Southern Asia
1975
1997
1997
19971997
1997
1975
1975
1975
19751975
UNESCOINSTITUTE for STATISTICS
9
Education expenditure as a % of GDP
6.1
8.0
4.83.7
4.75.5
4.5 4.8 5.24.3
3.3
1.2
2.8
5.7 5.2 4.8 4.73.4 3.2
2.5
1.1
3.3
2.2 0.61.4 1.0
0.8
1.2
2.5
0.1
0.0
0.23.22.2
0
2
4
6
8
10
Ed
uca
tio
n e
xpen
dit
ure
as
a %
of
GD
P
Public Private
Source: UIS
UNESCOINSTITUTE for STATISTICS
10
Tertiary expenditure as a % of GDP
1.21.4
0.8
0.4
0.9 0.8 0.8
1.51.8
0.90.7 0.8
0.6
1.5 1.6
0.81.0
0.80.5
0.2
0.20.4
0.7 0.0
0.30.5
1.3
0.0
1.8
1.8
<1
0.5
0.0
0.5
1.0
1.5
2.0
2.5
3.0
Jam
aica
Cub
aP
arag
uay
Chi
leU
.S.A
.B
eliz
eA
rgen
tina
Can
ada
Bar
bado
sM
exic
oP
eru
Col
ombi
aU
rugu
ay
Pan
ama
Bol
ivia
Cos
ta R
ica
Bra
zil
Trin
idad
&A
ntig
ua&
El S
alva
dor
Ter
tiary
exp
endi
ture
as
a %
of
GD
P
Public Private
Source: UIS
UNESCOINSTITUTE for STATISTICS
11
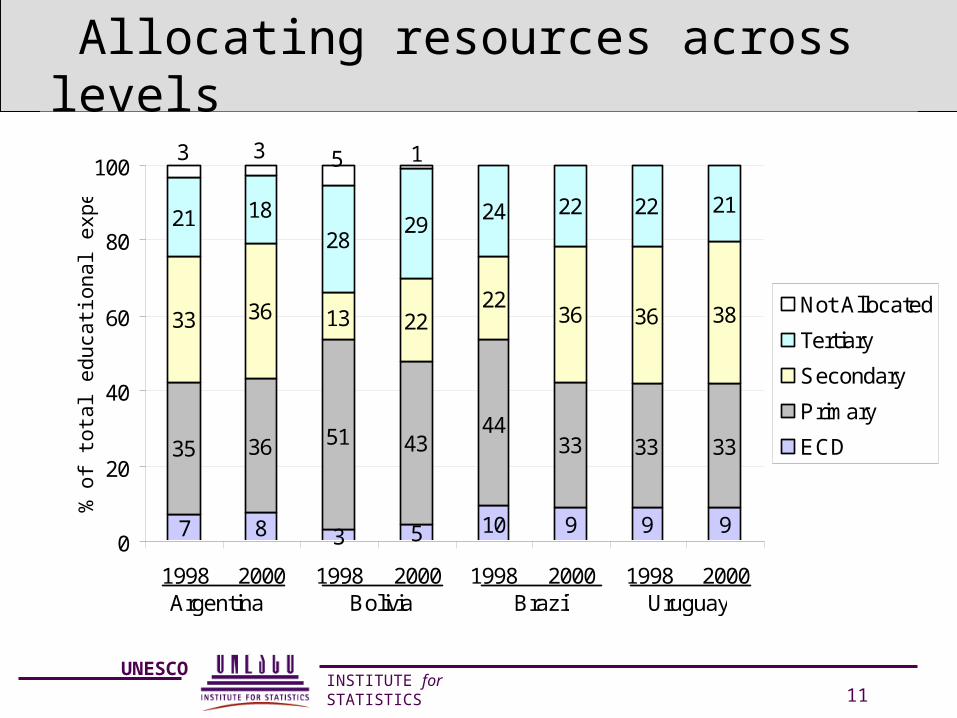
Allocating resources across levels
7 8 3 5 10 9 9 9
35 36 51 4344
33 33 33
33 36 13 2222
36 36 38
21 1828
2924 22 22 21
1533
0
20
40
60
80
100
1998 2000 1998 2000 1998 2000 1998 2000
% o
f to
tal e
du
catio
na
l exp
en
ditu
re
Not Allocated
Tertiary
Secondary
Primary
ECD
Argentina BrazilBolivia Uruguay
UNESCOINSTITUTE for STATISTICS
12
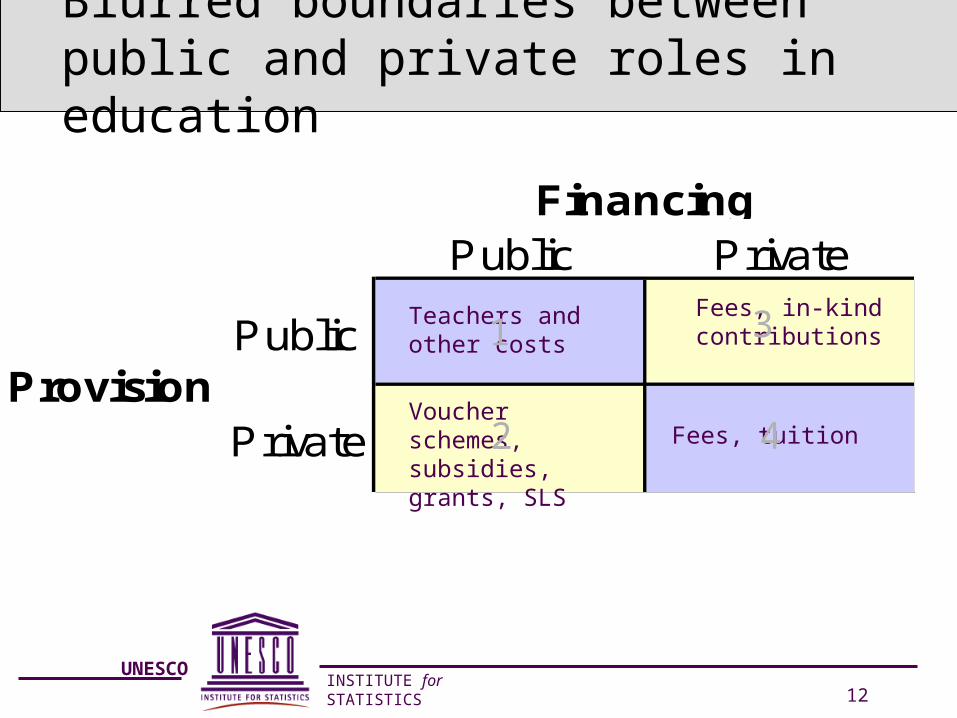
Blurred boundaries between public and private roles in education
Public Private
Public
Private
Financing
Provision
Teachers and other costs
Voucher schemes, subsidies, grants, SLS
Fees, tuition
Fees, in-kind contributions1 3
2 4
UNESCOINSTITUTE for STATISTICS
13
Public and private education providers
Defined by governance and source of funding Public Private
Private provision in LAC countries is prevalent at both primary and secondary levels, especially govt.-dependent; private tertiary provision is considerable
UNESCOINSTITUTE for STATISTICS
14
Primary expenditure per student, PPP$
252 300 471801 886 902 947 967 994 1019
1533 1570 1720
4632
6719
0
1000
2000
3000
4000
5000
6000
Gua
tem
ala
Bol
ivia
Per
u
Bel
ize
Bra
zil
Jam
aica
Par
agua
yU
rugu
ayP
anam
aM
exic
oA
rgen
tina
Cos
ta R
ica
Chi
leB
arba
dos
U.S
.A.
Pri
mar
y ex
pend
iture
per
stu
dent
in P
PP
$
Source: UIS
UNESCOINSTITUTE for STATISTICS
15
Expenditure per primary student as a % of GDP per capita