57
UNEVEN-AGED MANAGEMENT NORTHWEST CERTIFIED FORESTRY Rolf Gersonde, 6/6/2015

UNEVEN-AGED MANAGEMENTNORTHWEST CERTIFIED FORESTRY
Rolf Gersonde, 6/6/2015

Uneven-aged Management in 90 Minutes
Silviculture Background Forest Ecology Management Tools and Stocking Control Multi-aged Management Regime
Group Selection Example Single Tree Selection Example
Tools for Assessment and Management Operations
2

What is Uneven-aged Management?3
Even-aged “age-class” Forestry
Uneven-aged Management System

4
Managing Multi-aged Stands

5
Alfred Möller, 1922“Dauerwald”
Continuous Cover Forestry

Ecological Basis- Diameter distribution of natural stands- Small-scale disturbance regime
6
Meyer 1952
Tree Diameter
Tre
e C
ou
nt
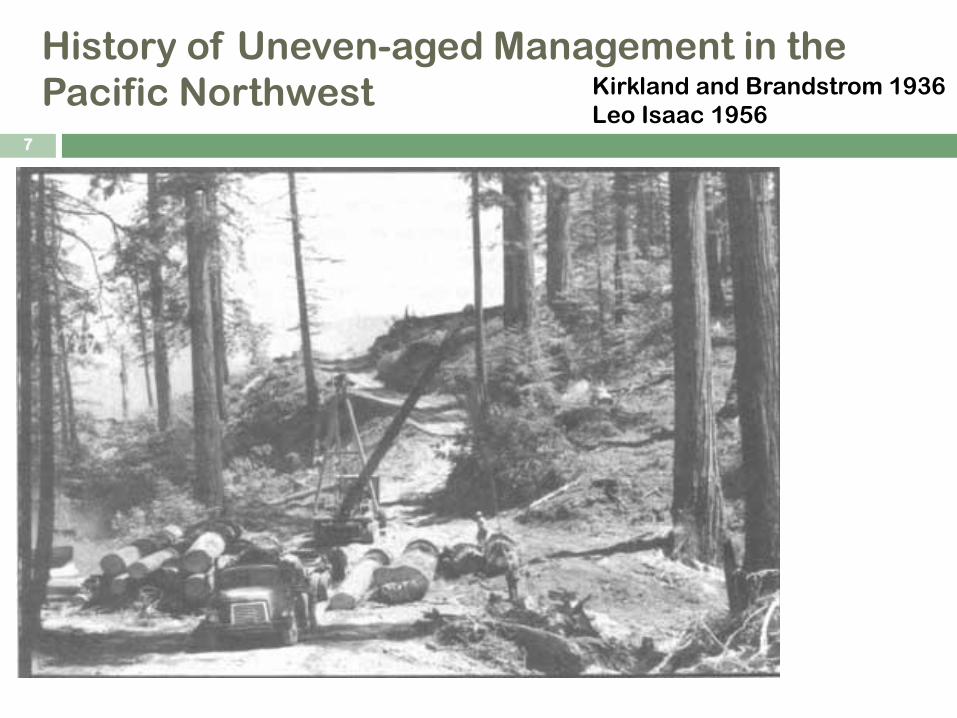
History of Uneven-aged Management in the Pacific Northwest
7
Kirkland and Brandstrom 1936Leo Isaac 1956

Silvicultural System –System of coordinated regeneration, tending, control, and harvest treatments
8
Even-aged SystemClear CutSeed TreeShelterwoodThinning
Two-aged SystemVariable RetentionCoppice with Reserves
Uneven-aged systemGroup SelectionThinningSingle Tree Selection

Seed-Tree and ShelterwoodRegeneration Methods
9
Shelterwood

Continuum of Silvicultural Approaches10

Forest Stand DynamicsStand development stages, disturbance dynamics, habitat
11
S
70 150 250 500 7500
Franklin and Van Pelt 2004
Stand InitiationStem Exclusion Understory
Re-Initiation
Diversification – Vertical - Horizontal

Crown Differentiation12
Emmingham and Elwood 2004
D – DominantC – Co-dominantI – IntermediateS – OvertoppedM – Mortality

Height vs. Diameter Growth13
Douglas-fir grown at three different densities, from Marshall and Curtis, 2002
Age (years)
He
igh
t
Ste
m D
iam
ete
r

Competitive vs. Agent Mortality14

Natural Regeneration- Understory Establishment Stage
15
Seed Source Species, seed year,
predation
Environment Temp, water, light
Seed bed Soil, competition,
mycorrhiza

Understory Development –Identify Shade Tolerance
16
Gra
nd
fir
Do
ug
las-fir
We
stern
he
mlo
ck
We
stern
wh
ite p
ine

Shade tolerance –Ranking of western tree species (Daniel et al. 1979)
17
Very tolerant
Western hemlockPacific yew
Pacific silver firVine maple
TolerantWestern redcedar
Grand firSitka spruce
IntermediateBig-leaf maple
Douglas-firWestern white pine
IntolerantPonderosa pine
Lodgepole pineRed alder
Very intolerant CottonwoodsLarch

Understory Growth –Morphological Plasticity
18
Noble fir
Pacific silver fir
•Sun and shade foliage
•Terminal vs. lateral growth
•Apical dominance
Western hemlock

Mixed-species Forests19

Mixed-SpeciesStands
20
Species specific Growing space Height growth Stratification Shade tolerance Senescence Facilitation Forage

Growing Space - Resources, leaf area, basal area, and allocation
21

Growing Space Allocation –Trees versus Stands
Stand
Tree
Vo
lum
e G
row
th
Stand Density
22

Growing Space Allocation23
80% Growing SpaceIn Overstory
20% Growing SpaceIn Understory

Growing Space Allocation –Overstory versus Understory
24
Tre
e G
row
th
Overstory Density

Managing Uneven-aged Stands25
Manage stand density to:1. Sustain growth of all stand
components2. Maintain stand structure3. Replace tree mortality and harvest
through regeneration# Sustainability IndicatorsTransformation

Stand Volume and Rotation in Even-aged System
26
Sta
nd
Vo
lum
e
Stand Age RotationAge

Cutting Cycle27
Sta
nd
De
nsi
ty
Stand Age
1. Age 40200 TPABA 120
2. Age 60180 TPABA 180
3. Age 6090 TPABA 120
4. Age 80/20200 TPABA 160

Cutting Cycle – cutting cycle length depends on cutting intensity and growth rates
28
Sta
nd
Vo
lum
e -
De
nsi
ty -
Gro
win
g S
pa
ce
Stand Age
Cutting Cycle Length
RemovedTimber Volume
GrowthRate

Yield Tables for Even-aged Stands
29

Group Selection System30

Group Selection System- Area Control Method of Uneven-aged Management
PCTRegeneration
ThinnedMatrix
Un-thinnedLarge Tree
Activities:
Group-Selection Harvest
Natural RegenerationPlanting
Pre-comm. Thinning
Commercial Thinning
Understory Thinning

Scheduling Group Selection TreatmentsArea Control Method
Cutting Cycle1 2 3 4 5 6
Stand Area
20% Group Selection
PCTCommercial
ThinCommercial
ThinGroup
SelectionPCT
20% Commercial Thin
Group Selection
PCTCommercial
ThinCommercial
ThinGroup
Selection
20% Commercial Thin
Commercial Thin
Group Selection
PCTCommercial
ThinCommercial
Thin
20% Commercial Thin
Commercial Thin
Group Selection
PCTCommercial
Thin
20% Commercial Thin
Commercial Thin
Group Selection
PCT
40 60 80 100 120 140Stand Age

Group Selection System –Prescription Matrix
33
Uneven-aged Group Selection Management Regime
Activity Conditions Prescription (SI 110)
Regeneration at cutting cycle 20% in 1-2 ac gaps, min age 35 yrs, Cutting Cycle 20 yrs
Reforestation at year 1where cover <40%
nat.regen WH200 DF, 50 RA, 100 RC,
Density Management
Pre-commercial Thinning
top height 15 ft.or age >15 yrs Thin to 250 TPA
Commercial Thinning at 55% of max SDI(or BA > 260 sqft)
160 TPA thin from below or 30% CF volume, possible 2nd
CT remove 20% of CFvol
Understory Thinningat 2nd CT,
after CT where WH understory established
if understory h/d<100 Thin to 150 TPA,
Habitat Enhancement
Riparian Management Zone
applies to CT and group selection
retain 20 TPA >12"DBHor retain 20-40% cover in RMZ,
underplant 100 RC/ac
Dead woodretain 2 TPA as snags
and 2 TPA as down woodat Regeneration

Single Tree Selection
34

35

Single Tree Selection – developing a guide curve from tree count and diameter
36
2 4 6 8 10 12 14 16 18 20 22 24
Nu
mb
er
of
Tre
es
Tree Diameter
Tree Tally by 2 inch Diameter Class
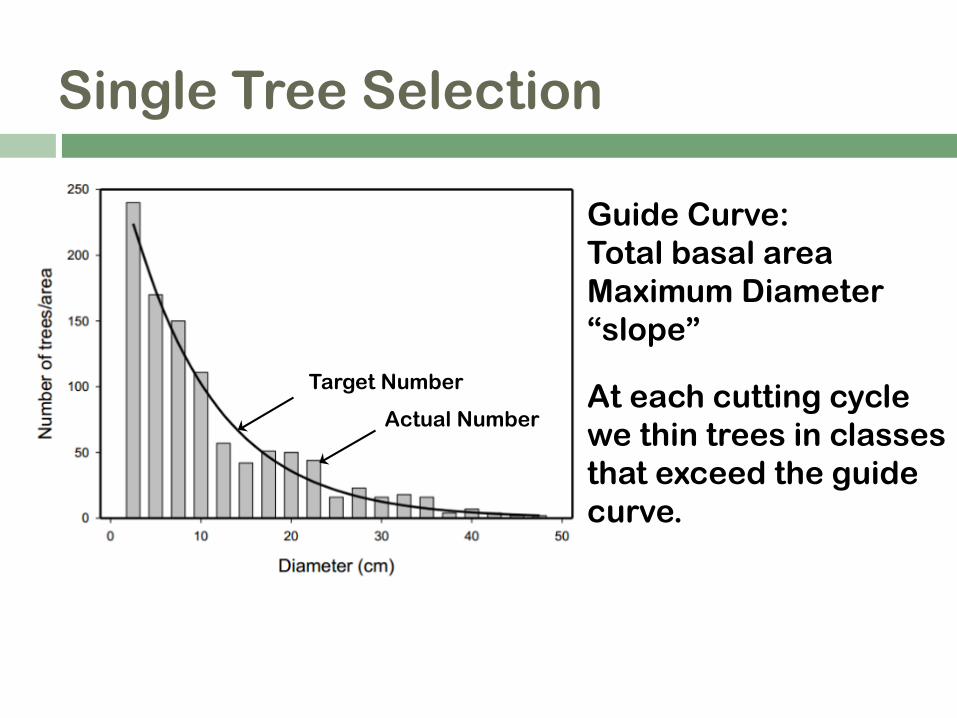
Single Tree Selection
37
Target Number
Actual Number
Guide Curve:Total basal areaMaximum Diameter“slope”
At each cutting cyclewe thin trees in classesthat exceed the guidecurve.

Uneven-aged Management Forest Products – Marketing Product Diversity
38

Assessing growth and control density of all tree sizes and species in the same stand
39

Assessment of Growth –Overstory diameter increment
40
Diameter growth rates

Assessment of Growth –Mid-canopy trees
41
Crown ratio Height-diameter ratio

Assessment of Growth –Understory trees
42
Large Gap >30% LightSmall Gap ~20% Light
Under Canopy >20% Light
Growth of terminal shoot versus lateral branches -Douglas-fir

Tools For Assessment –Diameter Distribution
43
Tree Diameter Tally Sheet
DBH Class Plot 1 Plot 2 Plot 3 Sum
(Inches) Count Count Count Tree Count
0-4 0 0 0 0
4-8 2 1 1 4
8-12 4 1 3 8
12-16 6 2 2 10
16-20 2 2 8 12
20-24 6 2 8
24-28 1 5 6
28-32 4 4
32-36 1 1 2

Tools For Assessment –Diameter Distribution of Even-aged Stand
44
0
5
10
15
2 6 10 14 18 22 26 30 34T
ree
Co
un
t
Diameter Class (Midpoint, Inch)

Growing Space Distribution –Diameter Distribution of Multi-aged Stand
45
0
10
20
30
40
2 6 10 14 18 22 26 30 34Tre
e C
ou
nt
/ Ba
sal A
rea
Diameter Class (Midpoint, Inch)

Growing Space Distribution –Basal Area of Diameter Classes
46
0
10
20
30
40
2 6 10 14 18 22 26 30 34Tre
e C
ou
nt
/ Ba
sal A
rea
Diameter Class (Midpoint, Inch)

Permanent Sample Plots47
Species composition Size classes Stand volume Diameter growth Height growth Mortality Harvest

Permanent Sample Plots –Diameter distribution and increment
48
0
10
20
30
40
2 6 10 14 18 22 26 30 34
Tre
e C
ou
nt
Diameter Class (Midpoint, Inch)0
10
20
30
40
2 6 10 14 18 22 26 30 34
Tre
e C
ou
nt
Diameter Class (Midpoint, Inch)
Inventory Period 1:Diameter distribution
Inventory Period 2:Diameter distributionDiameter class transition

49
Thinning and Harvest
Objectives Stocking Control, Regeneration, and Timber
Timing Recovered previous harvest, market conditions, boat
payments
Make a plan Long-term plan as Guide not Rule
Creating habitat CWD, snags, canopy layers

50
Tree Selection and Marking
Creating growing space Selection guide Basal area Diameter distribution
Mark your Trees
51
Harvest Layout
Units and boundaries Uneven-aged stands are more variable
Forest Practices
Roads and trails Long-term planning and reuse
Collaboration

Group Selection System –Planning operations
52
Layout for thinning and group selection harvest
Location for yardingcorridors
Tracking regeneration Prescriptions for matrix
thinning Estimating stocking and
ingrowth

Implementation53

Equipment Options54
Equipment Options

55

56

57
Harvest Impacts


