32
| Date post: | 14-May-2017 |
| Category: |
Documents |
| Upload: | sarah-mckenzie |
| View: | 224 times |
| Download: | 0 times |
Minnesota 2020 2324 University Avenue West,
Suite 204, Saint Paul, MN 55114 www.mn2020.org
Editing: Joe Sheeran Design & Layout: Rachel Weeks
All work published by Minnesota 2020 is licensed under a Creative Commons Attribution-No Derivative Works 3.0 Unported License.
1Minnesota 2020 - www.mn2020.org
Table of ConTenTs
Executive Summary . . . . . . . . . . . . . . . . . . . . . . . . . . . . . . . . . . . . . . . . . 3
Urban Wealth Loss
Suburban Recovery
Moving to the Exurbs
A View from the Countryside
Affordability: A Key Housing Issue
Findings: . . . . . . . . . . . . . . . . . . . . . . . . . . . . . . . . . . . . . . . . . . . . . . . 5
Recommendations: . . . . . . . . . . . . . . . . . . . . . . . . . . . . . . . . . . . . . . . . . . 6
At the federal level:
West metro wealth loss . . . . . . . . . . . . . . . . . . . . . . . . . . . . . . . . . . . . . . . 7
North Minneapolis . . . . . . . . . . . . . . . . . . . . . . . . . . . . . . . . . . . . . . . . . . 8
Brooklyn Park and Brooklyn Center . . . . . . . . . . . . . . . . . . . . . . . . . . . . . . . 11
East Metro’s Vulnerable Neighborhoods . . . . . . . . . . . . . . . . . . . . . . . . . . . . . 11
Picket Fence Sill Faded in Exurbia . . . . . . . . . . . . . . . . . . . . . . . . . . . . . . . . . 14
Northwoods’ Promise and Pain . . . . . . . . . . . . . . . . . . . . . . . . . . . . . . . . . . 17
Bemidji and the surrounding area . . . . . . . . . . . . . . . . . . . . . . . . . . . . . . . . . 17
Hibbing . . . . . . . . . . . . . . . . . . . . . . . . . . . . . . . . . . . . . . . . . . . . . . . . 19
Brainerd Area . . . . . . . . . . . . . . . . . . . . . . . . . . . . . . . . . . . . . . . . . . . . . 19
Grand Rapids on the Mend . . . . . . . . . . . . . . . . . . . . . . . . . . . . . . . . . . . . . 20
Conclusion . . . . . . . . . . . . . . . . . . . . . . . . . . . . . . . . . . . . . . . . . . . . . . 23
Needs Mount, Housing Programs Underfunded
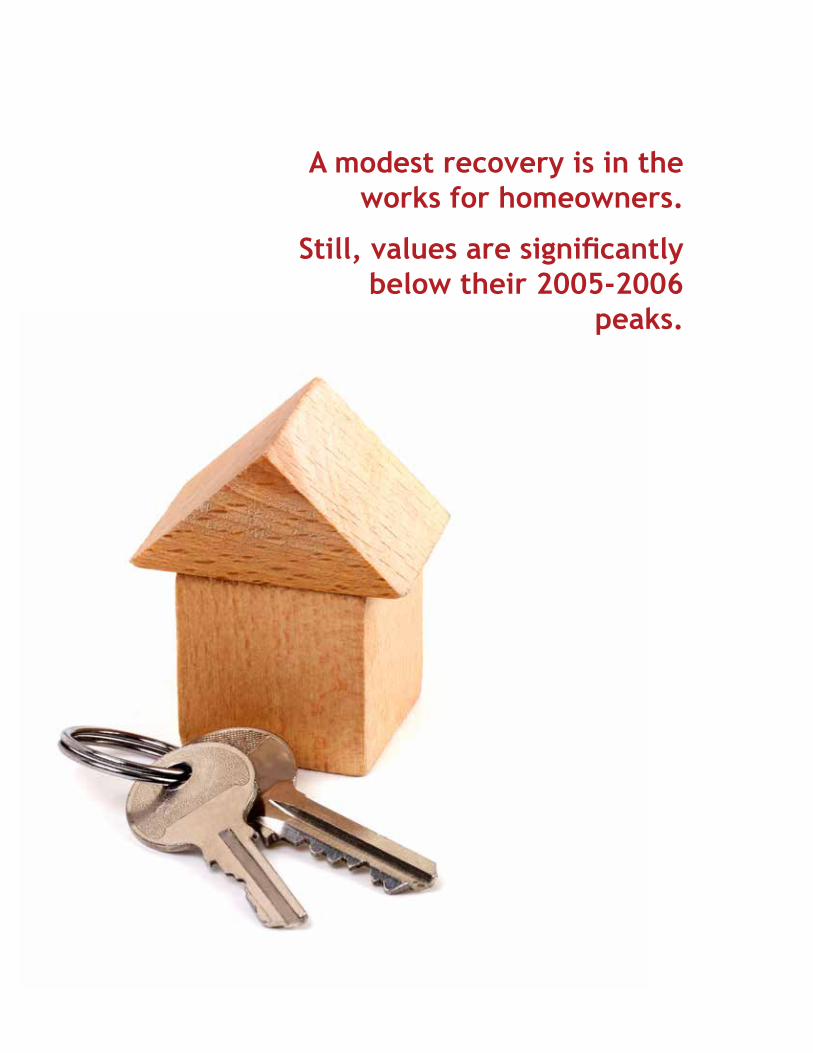
a modest recovery is in the works for homeowners.
Still, values are significantly below their 2005-2006
peaks.
3Minnesota 2020 - www.mn2020.org
exeCuTive summary
How’s the housing market recovery going and what does it mean for Minnesota’s homeowners and renters?
Minnesota 2020 and Minnesota Housing Partnership set out to examine and profile the housing crash’s impact on select communities hit hard by the foreclosure crisis in Minneapolis, St. Paul, the suburbs, exurbs, and Greater Minnesota.
In most areas we observed, a modest recovery is in the works for homeowners. Still, values are significantly below their 2005-2006 peaks, even when adjusted for inflation in 2013 dollars.
Furthermore, the wave of foreclosures and housing market collapse halted most single- and multi-family housing construction. This supply restriction coincided with an increased demand for rental housing, as tens of thousands of foreclosed homeowners flooded the rental market. The stock of rental housing, already in short supply in many areas, widened the affordability gap for renters, especially lower-income families, senior citizens, and people with disabilities.
urban Wealth loss
In low-income urban areas, families seeking the American dream lost wealth and homes. Unlucky renters living in properties owned by investors also lost when their homes went into foreclosure. While median home values in the urban communities examined in this report are higher than they were in 2011, on average, neighborhoods in North Minneapolis, St. Paul’s Eastside and Frogtown have lost 57 percent in median home value from the 2005-2006 peak.
suburban recovery
Generally suburban communities now have home prices higher than 2011’s lows. However, there’s a dual story in suburbia. While not losing quite the value of their urban neighbors, Brooklyn Center, West St. Paul, and Spring Lake Park came out of the recession worse off than suburban counterparts, losing 44 percent of their median home value since the market’s height.
4 Uneven Recovery: A Look back at Minnesota’s Housing Crisis
moving to the exurbs
Exurban communities are seeing a fairly mixed recovery. We took the closest look at Albertville and St. Michael, which are back from the deepest depths of the housing crash, recovering 21 and 15 percent respectively from their 2011 lows. However, median home values are still roughly 33 percent below their 2005-2006 highs.
Exurban communities experienced especially high mortgage foreclosure rates, with Isanti, Sherburne, and Chisago counties comprising three of the top four respectively in average countywide foreclosure rates between 2005 and 2012. As we move past county-wide analysis, digging deeper into communities, we’ll drill down on certain zip codes in rural areas and within Hennepin and Ramsey Counties hit especially hard by foreclosures.
a view from the Countryside
Greater Minnesota’s housing recovery tells distinct stories depending on location and industrial ties. For many, the worst is over. A few pockets, however, were generally immune to the Great Recession. Southern Minnesota towns largely avoided a housing crash because their economies were tied to agriculture, which remained strong in the economic downturn.
Those areas hard hit in northern Minnesota that we will be featuring—Bemidji, Baxter and Brainerd—all experienced sharp declines in median home prices, with mixed but generally modest recoveries by 2013.
affordability: a Key Housing issue
In these same locales across the state; salaries have often lagged, especially for lower income renters, in comparison to housing costs during the recovery.
Census and other data show 58 percent of Minnesota households with $50,000 or less in annual household income now pay more than 30 percent of income for housing, including 66 percent of renters. That 30 percent threshold is where federal guidelines determine housing costs are burdensome by competing with food, medical, transportation, energy and clothing costs.
5Minnesota 2020 - www.mn2020.org
findings:
9 After prices hit rock bottom in 2011, a modest housing recovery is in the works.
9 Renters and many homeowners are still struggling, with 12.5 percent of households paying more than 50% of their salary on housing.
9 Homeowners in parts of North Minneapolis and St. Paul’s Eastside lost as much as 57 percent of their home values between 2005-2006 and 2013.
9 Statewide homeownership rates fell slightly, but there was a disparity in who lost housing, especially in the urban areas studied:
• St. Paul’s Asian community, mainly comprised of the Hmong population, saw its ownership rate drop from 46 percent pre-crash to 32 percent after.
• St. Paul’s Hispanic community went from 46 percent to 30 percent ownership rates over the same time period.
• African Americans in St. Paul went from a 23 percent homeownership rate to 18 percent ownership during the housing collapse. African Americans on Minneapolis’ Northside experienced similar home ownership declines.
9 When it comes to overall foreclosure rates, the exurbs were hit hardest, with Isanti, Sherburne, and Chisago as three of the top four foreclosure rate counties from 2005-2012. All three still have higher foreclosure rates than the statewide average.
9 Higher transportation and home energy costs have complicated the exurban recovery.
9 Central Minnesota, comprising the central lakes region and part of the exurbs, experienced a significant increase in homelessness—up 40% from 2006-2012, according to Wilder Research.
9 Greater Minnesota communities generally didn’t experience the building boom, speculative buying, or subprime issues of the metro and exurbs, limiting their pre-crash bubble. When the housing crash brought down the wider economy, they lost jobs. Some eventually lost homes.
6 Uneven Recovery: A Look back at Minnesota’s Housing Crisis
reCommendaTions:
at the state level:
Minnesota legislators must pass a robust bonding bill that includes at least $100 million in funds dedicated to building and refurbishing affordable housing, including public housing units.
at the federal level:
Pursue current legislation that makes funds available for the National Housing Trust Fund by reforming the mortgage interest deduction.
at federal, state and local levels:
Better fund public housing maintenance and construction and low income housing tax credits.
median Home sale priCe inflaTion adjusT To 2013
2005 2006 2007 2008 2009 2010 2011 20122013
(thru nov)
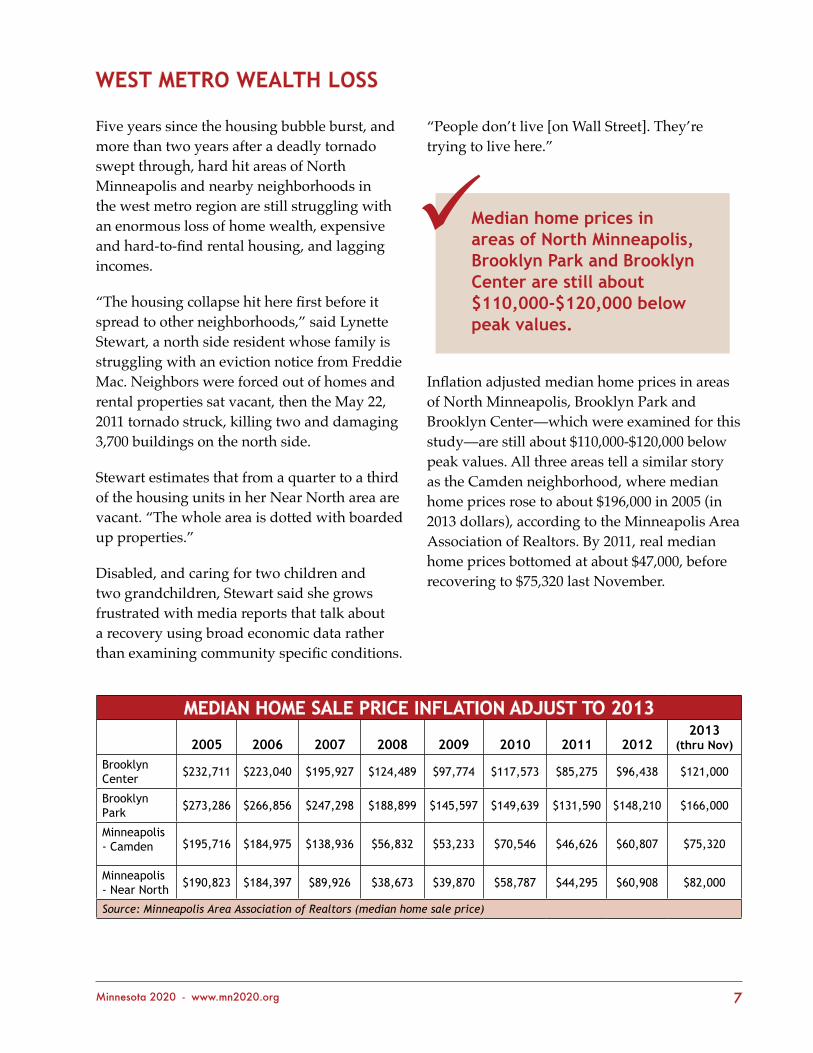
Brooklyn Center $232,711 $223,040 $195,927 $124,489 $97,774 $117,573 $85,275 $96,438 $121,000
Brooklyn Park $273,286 $266,856 $247,298 $188,899 $145,597 $149,639 $131,590 $148,210 $166,000
Minneapolis - Camden $195,716 $184,975 $138,936 $56,832 $53,233 $70,546 $46,626 $60,807 $75,320
Minneapolis - Near North $190,823 $184,397 $89,926 $38,673 $39,870 $58,787 $44,295 $60,908 $82,000
Source: Minneapolis Area Association of Realtors (median home sale price)
7Minnesota 2020 - www.mn2020.org
WesT meTro WealTH loss
Five years since the housing bubble burst, and more than two years after a deadly tornado swept through, hard hit areas of North Minneapolis and nearby neighborhoods in the west metro region are still struggling with an enormous loss of home wealth, expensive and hard-to-find rental housing, and lagging incomes.
“The housing collapse hit here first before it spread to other neighborhoods,” said Lynette Stewart, a north side resident whose family is struggling with an eviction notice from Freddie Mac. Neighbors were forced out of homes and rental properties sat vacant, then the May 22, 2011 tornado struck, killing two and damaging 3,700 buildings on the north side.
Stewart estimates that from a quarter to a third of the housing units in her Near North area are vacant. “The whole area is dotted with boarded up properties.”
Disabled, and caring for two children and two grandchildren, Stewart said she grows frustrated with media reports that talk about a recovery using broad economic data rather than examining community specific conditions.
“People don’t live [on Wall Street]. They’re trying to live here.”
Inflation adjusted median home prices in areas of North Minneapolis, Brooklyn Park and Brooklyn Center—which were examined for this study—are still about $110,000-$120,000 below peak values. All three areas tell a similar story as the Camden neighborhood, where median home prices rose to about $196,000 in 2005 (in 2013 dollars), according to the Minneapolis Area Association of Realtors. By 2011, real median home prices bottomed at about $47,000, before recovering to $75,320 last November.
median home prices in areas of north minneapolis, brooklyn park and brooklyn Center are still about $110,000-$120,000 below peak values.
9
8 Uneven Recovery: A Look back at Minnesota’s Housing Crisis
Many, however, couldn’t afford to hold on to their homes, sending homeownership rates, especially for non-whites, falling. Going into the recession, whites enjoyed homeownership rates from about 64-85 percent versus rates for non-whites of about 29-53 percent in the
communities examined, based on 2005-2007 American Community Survey data. With the recession and housing market collapse, homeownership rates fell for both groups, but non-whites have fallen farther.
norTH minneapolis
Jean Bain, a realtor and coordinating consultant to the Northside Home Fund, said there were 316 vacant and boarded up home properties in North Minneapolis at the end of 2013. That was an improvement from 2009 when there were 558 such properties, she said. Some of those properties have been cleared; new housing is being constructed in some cases.
A sign of progress, Bain said, is the declining foreclosure rate on housing properties. There were 1,558 foreclosure actions in 2007. Those actions have dropped 81 percent, to 301 foreclosures in the past year.
Despite this improvement, five years of people vacating houses and a near halt in single- and multi-family housing construction has made an already tight rental housing market even tighter, with rental vacancy rates at about two percent. This has sent rents upward at a time when real household incomes are shrinking both statewide and in the metro.
Minneapolis city planners, in their Quarterly Trends report, found rental prices increased 23 percent, adjusted for inflation from 2006 to last year. By 2012, Twin Cities rental prices
were considered burdensome for 71 percent of renters’ households with incomes under $50,000 a year, under federal housing standards.
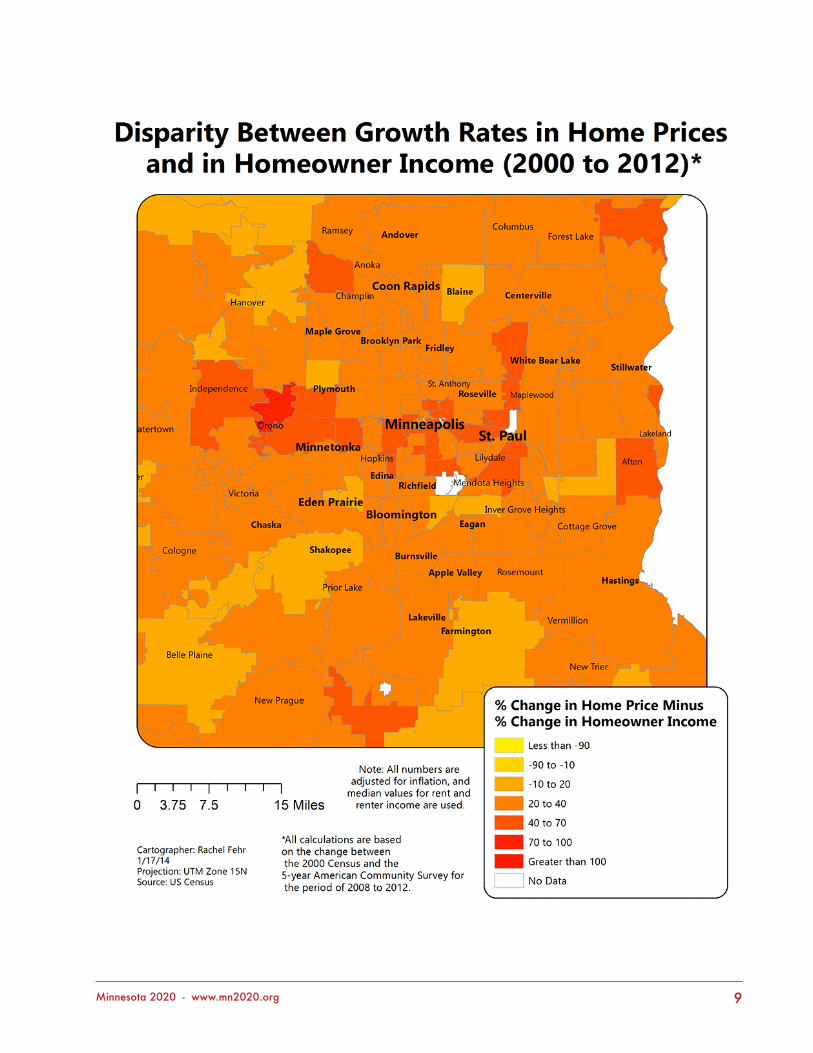
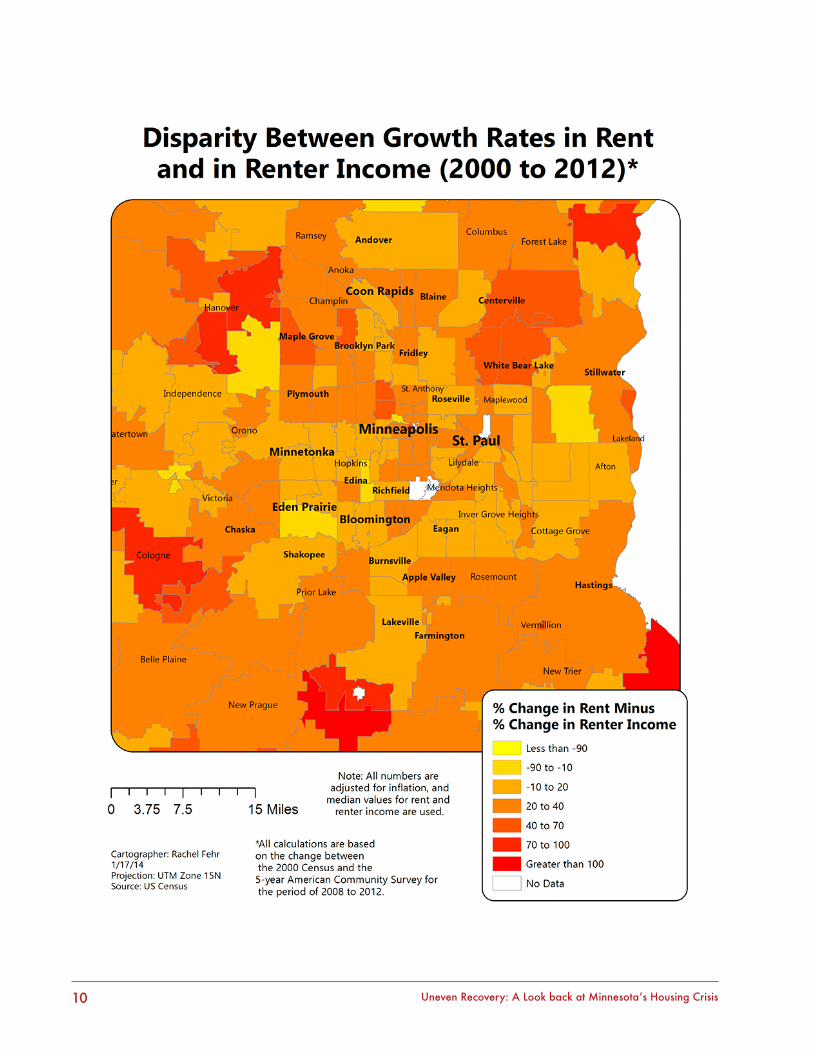
Camden (55412), for instance, saw a 23 percent increase in median gross rent from 2000 through the 2008-12 period, while renters’ median household income fell by nearly 40 percent. Even in many places where there have been modest housing price gains since 2000, incomes have not kept pace, as the maps below show.
Similar differences are found in Near North neighborhoods, with rents rising and renters’ median household income falling by 24 percent over the past decade.
Camden saw a 23% increase in median gross rent from 2000 through the 2008-12 period, while renters’ median household income fell by nearly 40 percent.
9
9Minnesota 2020 - www.mn2020.org
10 Uneven Recovery: A Look back at Minnesota’s Housing Crisis
11Minnesota 2020 - www.mn2020.org
brooKlyn parK and brooKlyn CenTer
Neighboring first ring suburbs around North Minneapolis also struggle with shrinking household incomes and growing disparities between housing/rental costs and incomes.
The trend of higher median gross rents and declining renters’ incomes continued in the large suburb of Brooklyn Park (pop. 77,752). However, this gap varied greatly depending on the neighborhood, with inflation–adjusted rents modestly outpacing real incomes in some areas and wide rent-to-income disparities in other parts of the city.
Brooklyn Park assistant city manager Michael Sable says the city is trying to figure out how to effectively manage rapid changes in the area, “Either by good planning or by good luck, we have talented people looking at how we are
changing and what we need for planning, job training, housing, and infrastructure going forward.”
Part of the reason might be Brooklyn Park’s wide population diversity, which already reflects demographers’ projections for America by the year 2030. That is when population will be evenly balanced between people who are called “white” by Census takers, and people of other races or ethnicities lumped together as “non-white” in statistics.
“We’re already there,” Sable said, so community activists, officials, educators, business leaders and others are working on strategic planning to keep household incomes rising and mixed, affordable housing for all.
easT meTro’s vulnerable neigHborHoods
No East Metro or St. Paul neighborhood was spared in the housing crash, but the East Side and Frogtown – more formally Thomas-Dale – neighborhoods were especially impacted by foreclosures, property abandonment and loss of family wealth tied up in homes.
These are the neighborhoods that have always held out a “Welcome” mat for new Minnesotans. The housing crash has wiped out much of the economic gains of residents, new and old alike.
“By my calculations, we lost a good billion dollars in family household wealth (equity) in St. Paul. Dayton’s Bluff and Payne-Phelan neighborhoods were hard hit and are slower to recover,” said Jim Erchul, executive director of Dayton’s Bluff Neighborhood Housing Services.
This loss in wealth spills over on everyone in the communities. From 20 to 25 percent of dwellings are abandoned in some areas, Erchul said. This squeezes the supply of rental property and raises the cost of rents at the same time household incomes have steadily declined. Early during the housing market collapse, American Community Survey data showed housing costs were already burdensome by 2009 for a third of East Side homeowners and more than
“We lost a good billion dollars in family household wealth (equity) in st. paul.”
9
12 Uneven Recovery: A Look back at Minnesota’s Housing Crisis
50 percent of renters under federal guidelines, and households facing housing burdens have increased for both groups in the four years since.
Only the North Minneapolis neighborhoods have had a statistically worse recovery, Erchul said. The most impacted in Minneapolis were poor African Americans, he said. On St. Paul’s East Side and in Frogtown, north and west of the State Capitol, housing hardships have especially impacted Asian and other immigrants and refugees “who were looking for lower cost housing to start their ‘American Dream’,” he said.
Median home prices tracked by metro realtors found the price hit $197,000 in Dayton’s Bluff, just east of Downtown St. Paul, in 2005 at the peak of the housing bubble. After the bubble burst, the median home price fell to a low of $52,000 in 2011 before recovering to $87,000 as of November this past year.
Up the East Side in the Payne Phalen neighborhood that reaches to Larpenteur Avenue and suburban Maplewood, median home prices hit $212,000 in 2005, crashed to $67,000 in 2011, and were back to $100,000 in November. Thomas-Dale followed the same pattern, peaking at $192,000 in 2005, falling to $48,000 in 2008, and recovering to $81,000 this past year.
Close by suburbs share many characteristics of the East Side and felt similar impacts from the housing bust and the Great Recession that wiped out jobs, pushed families into foreclosure, and raised rents. Maplewood and West St. Paul median home prices have since recovered a little more than 14 percent from hitting bottoms, Inver Grove Heights has recovered nearly 20 percent from its floor, and White Bear Lake is back a little more than 16 percent.
But there has still been a loss of more than $100,000 in median home values in Maplewood and West St. Paul, and nearly that much in White Bear Lake and Inver Grove Heights.
These aren’t just paper money losses, said Brad Griffith, a St. Paul realtor who serves on East Side neighborhood committees dealing with housing. Families that “toughed it out” and made payments on underwater mortgages cannot get additional loans for proper maintenance and improvements, he said.
This also explains why a large number of remaining empty houses and apartment properties aren’t being repaired and brought back into use. Nonprofit organizations and other community-minded groups can’t sink more money into repairs than the improved property would be worth — not without grant money, which is in short supply.
Thinking on the fly, Griffith said this predicament could be holding back economic recovery for the entire Twin Cities metro area. When immigrants and refugees want to launch new businesses as entrepreneurs, not being able to access home equity limits potential, he said.
From pre-crash to the 2010-12 period, citywide St. Paul home ownership rates fell six percentage points for white households, but by 17 percentage points for Hispanic/Latino households, and 15 points for Asian households.
from pre-crash to the 2010-12 period, citywide st. paul home ownership rates fell six percentage points for white households, but by 17 percentage points for Hispanic/latino households
9
13Minnesota 2020 - www.mn2020.org
This loss deepened the divide between white and non-white homeownership since households of color had lower home ownership rates to begin with.
Looking across a longer timeline, Census and American Community Survey data show the convergence of poverty, race and housing costs deepening disparities in homeownership.
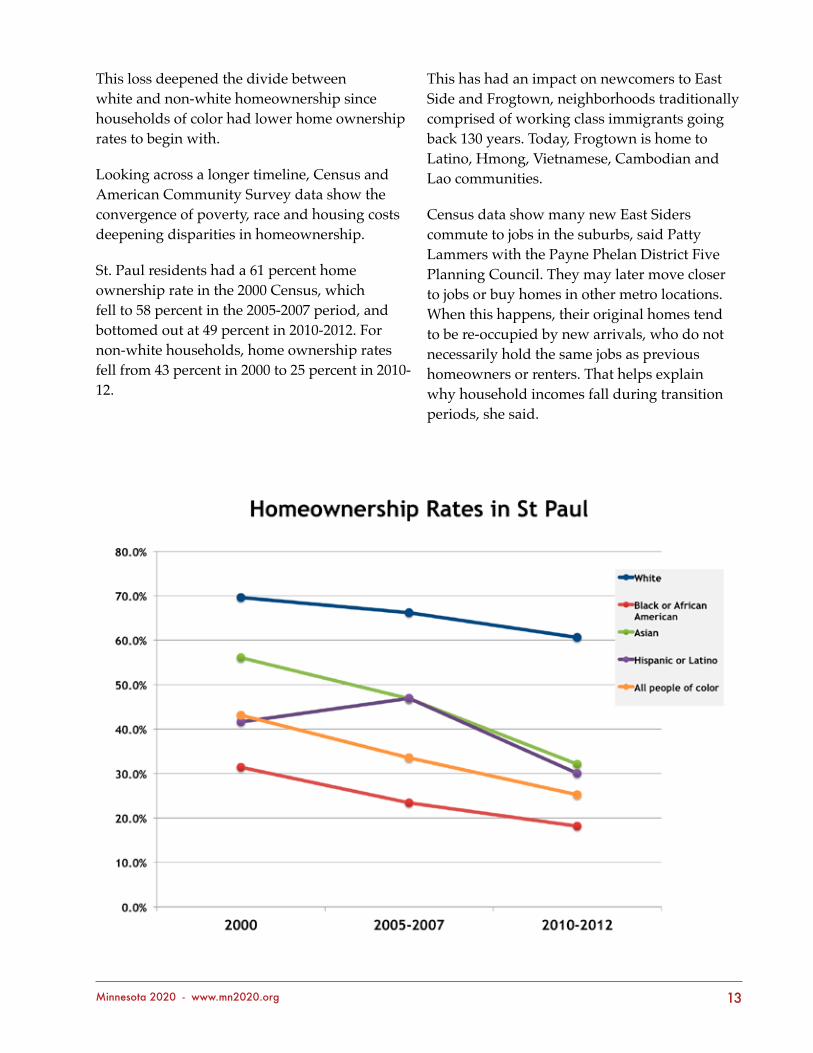
St. Paul residents had a 61 percent home ownership rate in the 2000 Census, which fell to 58 percent in the 2005-2007 period, and bottomed out at 49 percent in 2010-2012. For non-white households, home ownership rates fell from 43 percent in 2000 to 25 percent in 2010-12.
This has had an impact on newcomers to East Side and Frogtown, neighborhoods traditionally comprised of working class immigrants going back 130 years. Today, Frogtown is home to Latino, Hmong, Vietnamese, Cambodian and Lao communities.
Census data show many new East Siders commute to jobs in the suburbs, said Patty Lammers with the Payne Phelan District Five Planning Council. They may later move closer to jobs or buy homes in other metro locations. When this happens, their original homes tend to be re-occupied by new arrivals, who do not necessarily hold the same jobs as previous homeowners or renters. That helps explain why household incomes fall during transition periods, she said.
14 Uneven Recovery: A Look back at Minnesota’s Housing Crisis
Meanwhile, individual households are joined by outside investors in buying up foreclosed and abandoned properties, Erchul said. What remains boarded up and untouched is mostly property that can’t be repaired and rented, or sold, for more than the improvements would cost.
This is where future public policy comes in, Erchul and neighborhood housing officials say. Cities and counties will demolish and resell abandoned properties, or they will make public investment in improving the housing stock for neighborhoods recovering from foreclosure. Fortunately, bonding proposals for housing to go before the 2014 Legislature could be used for this purpose.
piCKeT fenCe sill faded in exurbia
When the housing crisis hit with a vengeance, new home construction in exurban counties that ring the Twin Cities and St. Cloud came to a screeching halt, new housing tracts were boarded up, and thousands of people lost homes they couldn’t afford after losing jobs.
Within the past two years, new families have moved in, repopulating vacant homes and starting daily commutes from exurban bedroom communities all over again, said Tony Rasmuson, who works in the Wright County Assessor’s office. St. Michael and Albertville, two I-94 communities known for commuter traffic jams going both north and south during drive times, have mostly found new occupants for their foreclosed properties, he said.
Single-family homes in Albertville and St. Michael, for instance, have recovered 21 percent and 15 percent of their value, respectively, since hitting bottoms in 2011, according to data from Twin Cities metro realtors. New home construction has resumed up and down the freeway. Next door in Otsego, 190 new homes were built in 2013, said Barb Williams with the city’s building inspection office.
The Minneapolis Area Association of Realtors found the median home price in Albertville had recovered to $179,450 in November last year, up
from a low of $147,650 in 2011 but still $90,000 less than the housing bubble peak price in 2005. St. Michael median home prices followed the same pattern, peaking at $292,381 in 2005, bottoming at $170,964 in 2011 before climbing back to $197,000 by November.
Across the Mississippi River, in Sherburne County, similar signs of recovery and recycling are underway, and foreclosure rates have dropped. But problems still linger for families facing twin costs of housing and transportation.
“We are still trying to figure out if we are urban, suburban or rural,” said Mary Jo Cobb, interim director of Health and Human Services for Sherburne County. All agree, she added, that Sherburne is a “commuter county.”
When gasoline prices dipped to around $1.90 a gallon in 2009 commuting wasn’t too much of a household hardship, Cobb said. County residents were mostly two car families with two wage earners. With gasoline prices now in the $3.30 to $3.60 range, transportation costs have nearly doubled.
foreClosure raTe by CounTy
County 2005 2006 2007 2008 2009 2010 2011 2012avg
2005-12isanti 0.63% 1.49% 2.40% 3.38% 2.86% 2.56% 2.36% 2.37% 2.26%
sherburne 0.81% 1.26% 2.41% 2.76% 2.48% 2.93% 2.15% 1.84% 2.08%
mille lacs 0.70% 1.15% 2.52% 2.68% 2.45% 2.47% 2.11% 1.80% 1.98%
Chisago 0.62% 0.96% 1.70% 2.04% 2.01% 2.32% 2.00% 1.71% 1.67%
Kanabec 0.58% 1.04% 1.56% 1.98% 2.05% 2.45% 1.81% 1.57% 1.63%
anoka 0.51% 0.81% 1.58% 2.14% 1.93% 2.08% 1.86% 1.46% 1.55%
pine 0.80% 1.08% 2.00% 1.64% 1.76% 2.05% 1.60% 1.40% 1.54%
scott 0.39% 0.82% 1.48% 2.28% 1.93% 2.23% 1.73% 1.39% 1.53%
Wright 0.00% 0.00% 1.87% 2.45% 2.08% 2.18% 1.79% 1.45% 1.48%
ramsey 0.44% 0.97% 1.62% 2.07% 1.72% 1.79% 1.43% 1.14% 1.40%
Hennepin 0.46% 0.82% 1.48% 1.93% 1.49% 1.61% 1.30% 1.08% 1.27%
15Minnesota 2020 - www.mn2020.org
All in all, statistical signs of improvement haven’t lessened hardships for many county families, said Dan Weber, the county assessor. His records show foreclosure actions dropped to about 360 in 2013, down from nearly 830 in 2010.
The cities of Elk River and Big Lake have had the highest numbers of foreclosures in Sherburne County, but third on Weber’s list is Zimmerman, a farm town until recent decades, which had 43 foreclosures last year after 70 and 55 foreclosures the two years before.
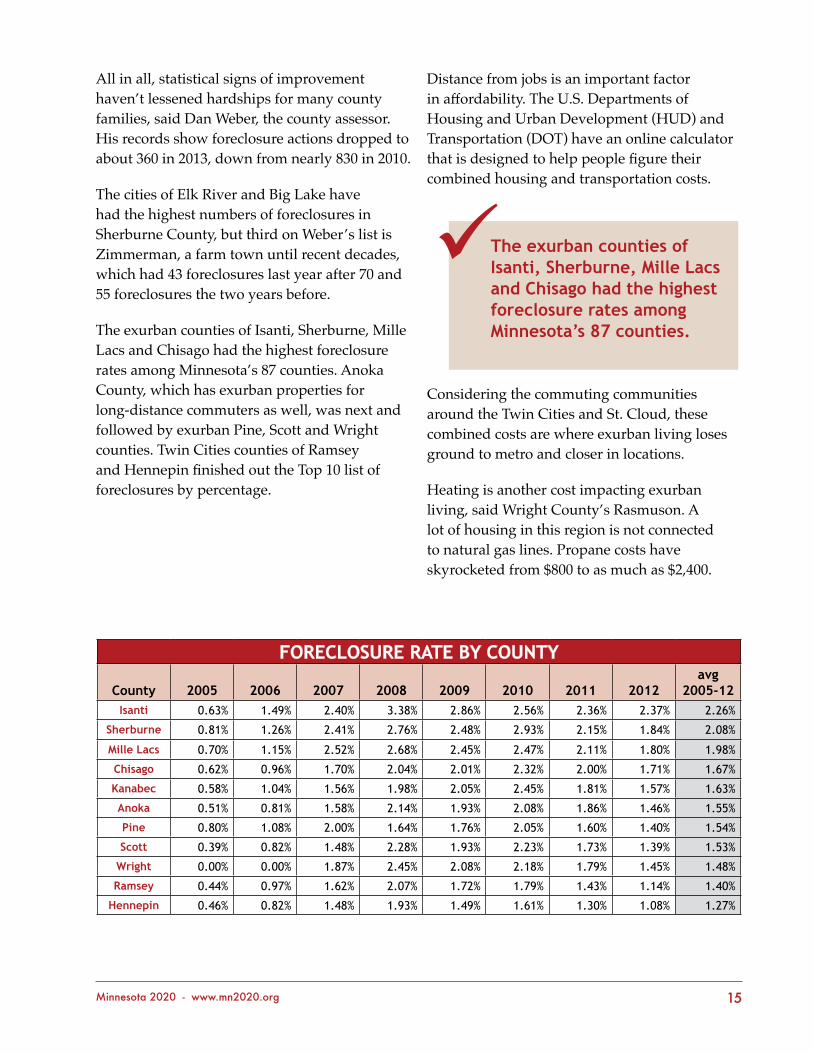
The exurban counties of Isanti, Sherburne, Mille Lacs and Chisago had the highest foreclosure rates among Minnesota’s 87 counties. Anoka County, which has exurban properties for long-distance commuters as well, was next and followed by exurban Pine, Scott and Wright counties. Twin Cities counties of Ramsey and Hennepin finished out the Top 10 list of foreclosures by percentage.
Distance from jobs is an important factor in affordability. The U.S. Departments of Housing and Urban Development (HUD) and Transportation (DOT) have an online calculator that is designed to help people figure their combined housing and transportation costs.
Considering the commuting communities around the Twin Cities and St. Cloud, these combined costs are where exurban living loses ground to metro and closer in locations.
Heating is another cost impacting exurban living, said Wright County’s Rasmuson. A lot of housing in this region is not connected to natural gas lines. Propane costs have skyrocketed from $800 to as much as $2,400.
The exurban counties of isanti, sherburne, mille lacs and Chisago had the highest foreclosure rates among minnesota’s 87 counties.
9
16 Uneven Recovery: A Look back at Minnesota’s Housing Crisis
Problems with homelessness and poverty often associated with urban areas are now an increasingly reality in places like Cambridge, Isanti and other bedroom communities.
As in most of Minnesota, the divide between owners and renters remains stark. About 85% of households in Chisago and Isanti counties are homeowners with a median income of $71,000 and $64,000 respectively. But renters in these same counties have a median household income of less than $30,000, and are more likely to end up homeless.
Mary Westlund, program manager and family educator for New Pathways Inc., at Cambridge, said her network of volunteers from 23 churches in Isanti and Chisago counties has provided temporary housing, meals and services for about 500 families and 900 children since it was founded in 2000. Affordable housing was always an Isanti County problem, she said.
Volunteers prepare meals in church kitchens. Sunday school rooms are converted into temporary shelters. And still, she said, 645 families have been turned away “because of lack of capacity. It isn’t getting any better.”
According to the triennial Wilder Research study of homelessness in Minnesota, homelessness in the Central region is indeed on the rise – up 40% from 2006 to 2012, faster than the state as a whole. The counties in the state’s central region include Benton, Cass, Chisago, Crow Wing, Isanti, Kanabec, Mille Lacs, Morrison, Pine, Sherburne, Stearns, Todd, Wadena, and Wright Counties, many of which high are exurban counties where foreclosures have been high.
Former middle class workers who lost their previous jobs in the recession are now taking low-paying jobs that used to provide incomes and rent money for the most impoverished area residents, Westlund reports. Those neighbors are likely the ones being pushed into homelessness.
In 2014, the Minnesota legislature is considering $100 million in bonding for housing. One of the uses for this funding would be supportive housing, which couples housing with support services to ensure that people who have been homeless can remain in housing successfully.
Another would be to preserve federally-assisted rental housing for low income people. Such units are too few to meet needs of Minnesota’s renters. But the buildings that do exist are at risk of being lost as properties age and decay. Building owners and housing authorities can’t collect enough from rents from low income residents to make needed repairs, and other funding sources are inadequate. State bonding would help preserve this needed resource – in exurban Minnesota and all throughout the state.
Homelessness in the Central region is indeed on the rise – up 40% from 2006 to 2012, faster than the state as a whole.
9
17Minnesota 2020 - www.mn2020.org
norTHWoods’ promise and pain
Greater Minnesota’s foreclosure crisis has played out very differently than in the Twin Cities metro area in the years since 2008’s housing crash.
In the population centers across the state’s northern tier examined for this report, the crash developed slowly. While home prices rose slightly pre-crash, a huge bubble never formed. There weren’t slews of sub-prime loans or adjustable rate mortgages being written. With the exception of a few lake towns, massive home construction never occurred in northern Minnesota.
Instead, the Great Recession’s housing crisis-induced tidal wave is what hit Northern Minnesota. When people lost jobs in the Great Recession, they lost homes. And when the economy tanked, renters, already in a more precarious economic position, were hit hardest.
Overall, there’s been a slight rebound in housing prices and income, but for most who’ve lost jobs in the wood products, mining, and outdoor recreation industries, a home is out of reach, and making the rent is a struggle.
Between 2006 and 2012, homelessness increased across the entire Northern region, and more than doubled in Northwestern Minnesota.
bemidji and THe surrounding area
Homelessness and access to affordable housing have become more severe for low-income and out-of-work people in north-central Minnesota. Bemidji stands out as one economic, cultural and service-providing hub, and was not spared by the foreclosure crisis and recession.
Inflation-adjusted median household income has declined by $2,800 in Beltrami County and $4,800 in Itasca County since 2007, according to SAIPE data from the US Census compiled by Wilder Research.
Housing affordability in this region will likely remain a persistent problem until forestry and its related industries find new uses for the timber that once supplied the now declining
printed magazine industry. Loggers harvested 2.7 million cords of timber this past year, less than half their potential, said James Skurla, director of the Bureau of Business and Economic Research at the University of Minnesota-Duluth.
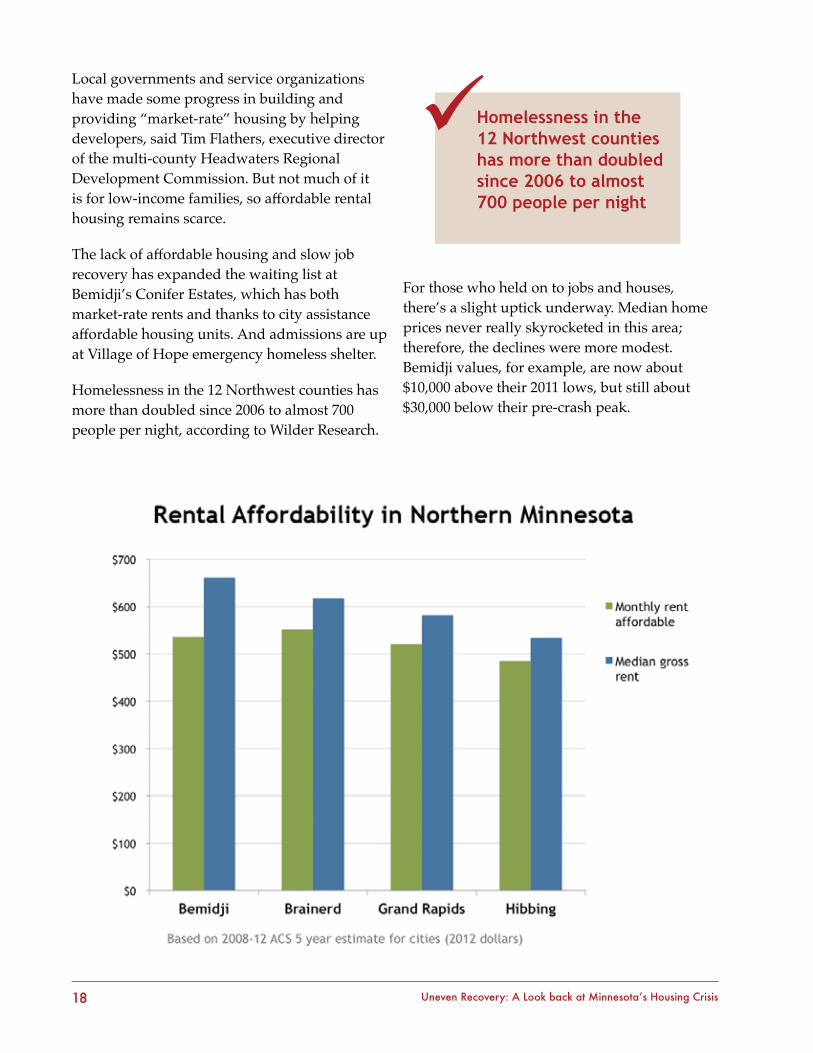
The slow economy is squeezing homeowners and renters. In just Beltrami and Itasca Counties, there have been over 1,300 foreclosures combined since the start of the crisis. And renters fare worse. Affordable monthly rents, based on renters’ median household income cost $536 in Bemidji and $521 in Grand Rapids. Yet actual median rents are more than that: $661 and $582 respectively.
When people lost jobs in the great recession, they lost homes. and when the economy tanked, renters, already in a more precarious economic position, were hit hardest.
9
18 Uneven Recovery: A Look back at Minnesota’s Housing Crisis
Local governments and service organizations have made some progress in building and providing “market-rate” housing by helping developers, said Tim Flathers, executive director of the multi-county Headwaters Regional Development Commission. But not much of it is for low-income families, so affordable rental housing remains scarce.
The lack of affordable housing and slow job recovery has expanded the waiting list at Bemidji’s Conifer Estates, which has both market-rate rents and thanks to city assistance affordable housing units. And admissions are up at Village of Hope emergency homeless shelter.
Homelessness in the 12 Northwest counties has more than doubled since 2006 to almost 700 people per night, according to Wilder Research.
For those who held on to jobs and houses, there’s a slight uptick underway. Median home prices never really skyrocketed in this area; therefore, the declines were more modest. Bemidji values, for example, are now about $10,000 above their 2011 lows, but still about $30,000 below their pre-crash peak.
Homelessness in the 12 northwest counties has more than doubled since 2006 to almost 700 people per night
9
19Minnesota 2020 - www.mn2020.org
Hibbing
On the Iron Range, which is heavily dependent on mining for its economic base, foreclosure is part of a much older story.
For decades, Hibbing and Iron Range communities have taken big hits in housing with setbacks to the iron mining industry, said Kari Kilen with the St. Louis County Assessor’s Office in Hibbing. Employment in mining fell from about 25,000 jobs in the early 1980s to about 5,500 jobs now.
Without a housing bubble to burst, any recent declines in home values were more modest than in most parts of Minnesota and the nation, Kilen said.
Still, Hibbing and Iron Range residents who remained after the mining jobs were lost have struggled finding affordable housing. Monthly affordability based on renters’ income is about $485, yet actual median gross rent is about $530, according to ACS’s 2008-2012 data.
Jackie Prescott, executive director of the Hibbing Housing Authority, said the city has more than a six-month waiting list for affordable housing. Apartments with two or more bedrooms are in especially short supply. And the rental stock, suffering from years of disinvestment, is too often of very poor quality.
About 200 new mining jobs have been added in the past year by Minnesota DEED calculations, but area residents will need more than that to turn around housing in the area.
brainerd area
The Brainerd Lakes region—a playground for seasonal visitors—was hit hard when the foreclosure crisis caused many lake homes to go vacant. People lost jobs in the recreation and hospitality industry, and that exacerbated the slowly-forming housing crisis for year-round residents. Crow Wing County’s foreclosure rates topped out at 1.6 percent in 2009, significantly above the state average at the time. They have since declined to 1.1 percent, still slightly ahead of the state average.
Median home prices in Brainerd and Baxter lost $60,000 to $70,000 in value by 2011, the general statewide housing price low-point, and have made only modest recoveries since.
Unfortunately, data about whether the foreclosures were mostly lake homes or people’s residences is hard to come by. But with Crow Wing County unemployment peaking as high as 13% during the recession, and still far above the state average now, rental affordability remains a significant issue, with median prices about $70 higher a month than what’s considered affordable based on incomes.
Central Minnesota, which includes Crow Wing County, saw its homeless population grow by about 170 to more than 600 between 2006 and 2012.
20 Uneven Recovery: A Look back at Minnesota’s Housing Crisis
Churches in the Brainerd and wider Central Minnesota region provided temporary, or transitional housing services for 67 homeless adults and 87 children in 2013. Every night, 21 churches linked with the New Pathways nonprofit at Brainerd help people with warm, temporary housing.
Kathy Carlson, program manager and family educator, said her organization only begins filling the need. Approximately 100 families were turned away in 2013, settling for shelter in cars, tents and icehouses.
grand rapids on THe mend
With 160 new housing units constructed or converted to residential use in 2013, Grand Rapids offers all Minnesota communities a glimmer of hope that housing shortages can be conquered when all local resources and government programs are put to work.
There is progress coming out of the housing crisis that hit most of the state five years ago, say Grand Rapids and surrounding Itasca County housing officials. “Everyone is pitching in,” said Rob Mattei, community development director for Grand Rapids.
Using federal, state, local and nonprofit resources to study, leverage and assist developers, last year Grand Rapids issued permits for 83 assisted living rental units, as well as 77 additional units, most of which were for rental housing, he said.
Mattei said 78 of the units permitted this past year are what housing officials consider affordable, although most market rate rents in Grand Rapids are close to that measurement. The city also helped the developer of assisted living units keep costs down through use of tax increment financing (TIF) though which road and utility improvements were made to support the project.
That is a strong rebound from 2010, the low point of Grand Rapids’ housing crisis, when only 11 housing units were added in the city, and the years 2007 through 2012 when new units never topped 44 in a year. Only 14 assisted living units were added in that entire period.
This is progress. Yet at the same time, homelessness and need for affordable housing are also increasing.
The Itasca County Housing and Redevelopment Authority (HRA) has more than 500 people, comprising a two-and-a-half-year waiting list, for U.S. Housing and Urban Development (HUD) low-income Section 8 rental assistance.
“We have the two companion problems of not enough affordable housing and poor-paying jobs,” said Sherry Shadley, executive director of the Grace House emergency shelter in Grand Rapids.
We have the two companion problems of not enough affordable housing and poor-paying jobs
9
21Minnesota 2020 - www.mn2020.org
The unemployment rate in Itasca County far exceeds the state’s average, and median household incomes have fallen by $4,800 since 2007, according to data compiled by Wilder Research.
In many ways, homelessness is more visible in the Twin Cities, Duluth and other large cities where the homeless are often out in the open. Surrounded by forests, the homeless in Itasca County are less visible as people hunker into icehouses, hunting cabins or take to the woods with tents, cars, campers and vans. “We think there is more ‘couch hopping,’ where friends are opening their homes for temporary shelter, especially on cold nights,” Shadley said.
Demand for emergency shelter services seems to be a little less this winter. Eight churches in Itasca County back up Grace House’s work with temporary housing for up to one week at a time. But forest rangers, game wardens, sheriff’s deputies and others keep bringing in people from the woods who need warm places to stay. Shadley said a disturbing number of them are veterans who haven’t sought social services for reasons of pride or other factors.
Putting Grand Rapids and county statistics in perspective, Itasca County is Minnesota’s third largest county in land size, but had an estimated population of only 45,221 in 2012. That is a gain of about 200 people from the 2010 Census and of about 1,000 from the 2000 Census.
Grand Rapids is the county seat, cultural and marketing center with a population of about 11,000. Cohasset (2,700), Keewatin (1,000), Nashwauk (1,000), Deer River (900) and Bovey (800) are the other larger cities in the county, and scattered through the woods are 37 unincorporated settlements with extremely small populations.
Such numbers make what Grand Rapids and Itasca County are doing all the more impressive. They also make homeless and housing problems shocking.
Grand Rapids and Itasca County are currently engaged in a comprehensive study of housing needs that will help the communities going forward, said Rosemary Fagrelius, housing development director at Minnesota Housing Partnership (MHP) in St. Paul. The collaboration of groups involved with this project consists of a team of seven Grand Rapids area leaders, representing 15 area organizations.
Funding for their work is coming from Grand Rapids-based Blandin Foundation, Duluth-based Northland Foundation, and MHP through its Housing Institute for Greater Minnesota collaborative training project with the Greater Minnesota Housing Fund.
These are resources that not all communities can muster, said Fagrelius, and the key is that Grand Rapids and the county are all working regionally. This prevents playing one city off against another in the battle for HUD, Minnesota Housing Finance Agency, USDA Rural Development and other sources of housing funds.
surrounded by forests, the homeless in itasca County are less visible as people hunker into icehouses, hunting cabins or take to the woods with tents, cars, campers and vans.
9

22 Uneven Recovery: A Look back at Minnesota’s Housing Crisis
Federal funds have been cut back, making access to housing programs more difficult, she added. But Fagrelius said collaborators in Grand Rapids and statewide are hopeful the Minnesota Legislature will make $100 million in state bonding authority available for housing programs.
That will help Grand Rapids and Itasca County keep making headway on housing, she said. And it would help other Minnesota communities follow our Northwoods neighbors’ lead.
23Minnesota 2020 - www.mn2020.org
ConClusion
Minnesota has made a significant housing recovery since the depths of the Great Recession; however, it’s been an uneven recovery. For too many Minnesotans affordable housing is still out of reach and mortgages are still underwater.
One in eight Minnesota households paid more than half their total income on housing in 2012, including 115,000 owner-occupied households and 132,000 renter households, according to Census Bureau’s American Community Survey (ACS).
The same survey showed 58 percent of Minnesota households making $50,000 a year or less paid 30 percent or more of income on housing in 2012, including 66 percent of renters. That’s the threshold set by the U.S. Department of Housing and Urban Development (HUD) as the upper limit for what households can comfortably pay on housing and still meet other household and family expenses.
“We still have severe problems with affordability and availability,” said Jan Plimpton, executive director for Habitat for Humanity in Minnesota. “Those are the two big questions everywhere. It is a problem in every county in the state,” she added.
It applies to renters and homeowners alike. In February, the Minnesota Home Ownership Center released its 2013 report counting 11,834 foreclosed homes in the state that were sold at sheriffs’ sales. That was a 34 percent drop from the 17,895 foreclosures the year before and less than half the numbers of sheriffs’ sales in 2008 and 2010 – the worst years for Minnesotans losing their homes.
While that marks improvement, said Julie Gugin, the Center’s executive director, “it still means that more than 11,000 Minnesota families lost their homes, and thousands more struggled with payments.”
It also matters where you live. In a January article for the Federal Reserve Bank of Minneapolis, Michael Grover made that point by looking at the 160,000 homeowners who lost their homes in the six-state Ninth Federal Reserve District between 2002 and 2009.
“[Y]es, geography does matter, and…consumers in middle- or upper-income neighborhoods returned to the mortgage market twice as fast as those who lived in lower-income neighborhoods,” Grover wrote.
24 Uneven Recovery: A Look back at Minnesota’s Housing Crisis
It is a slow recovery in North Minneapolis and some adjacent suburban areas home to many low-income households, with the 2011 tornado compounding the pain. In areas already squeezed for affordable homes and apartments, the tornado caused damage to 3,700 buildings – mostly homes – on the north side. There were still 316 vacant and boarded up home properties at the end of 2013, between foreclosures and the tornado.
The hardships in North Minneapolis and adjacent areas of Brooklyn Center and Brooklyn Park especially impacted low-income African-American families. In the East Metro area of St. Paul’s Eastside and Frogtown, west of the State Capitol Building, new immigrants and refugees were especially impacted.
Jim Erchul, executive director of Dayton’s Bluff Neighborhood Housing Services, calculates that St. Paul homeowners lost a billion dollars in family household wealth with the housing crash. Only a fraction of that has been recovered since low points in 2010 and 2011, with Dayton’s Bluff and Payne-Phelan neighborhoods especially slow to recover.
Twenty to 25 percent of dwellings in some areas are abandoned, he said, and this adds demand pressure for rental properties, raising rents at the same time the area’s household incomes have been falling.
Exurban communities have also been hit hard. In Wright, Sherburne, Kanabec, Pine, Isanti and Chisago counties, for instance, homelessness jumped by 40 percent between 2006 and 2012, according to Wilder Researchers. These counties also had disproportionately high mortgage foreclosure rates.
The areas never had sufficient affordable rental properties, but rents rose as foreclosed owners flocked to the rental market and increased demand for apartments. Many of the homeowners who lost homes in these counties were long-distance commuters who needed two household incomes that didn’t survive the recession, said Mary Westlund at New Pathways Inc. in Cambridge. Transportation and energy costs added to housing burdens.
Greater Minnesota communities have different sets of housing problems, reflecting the diversity of the state’s population and economy. North-central communities and towns across the Iron Range didn’t join the run-up in housing costs associated with the housing bubble, but jobs in mines and in forestry-related occupations took hits during the economic downturn.
25Minnesota 2020 - www.mn2020.org
Housing officials at Bemidji and Brainerd said affordable rental properties have always been in short supply. Grand Rapids had a spurt of new rental housing construction in 2013, but Northern Minnesota communities struggle with increased homelessness, poor quality of much of the rental housing, and an uneven housing recovery.
Housing is, as Habitat for Humanity’s Plimpton said, a lingering problem for all 87 Minnesotan counties.
needs mount, Housing programs underfunded
Back in 2004, before the housing bubble burst and America headed into the worst recession since the Great Depression, Minnesota developed a good “game plan” for ending homelessness.
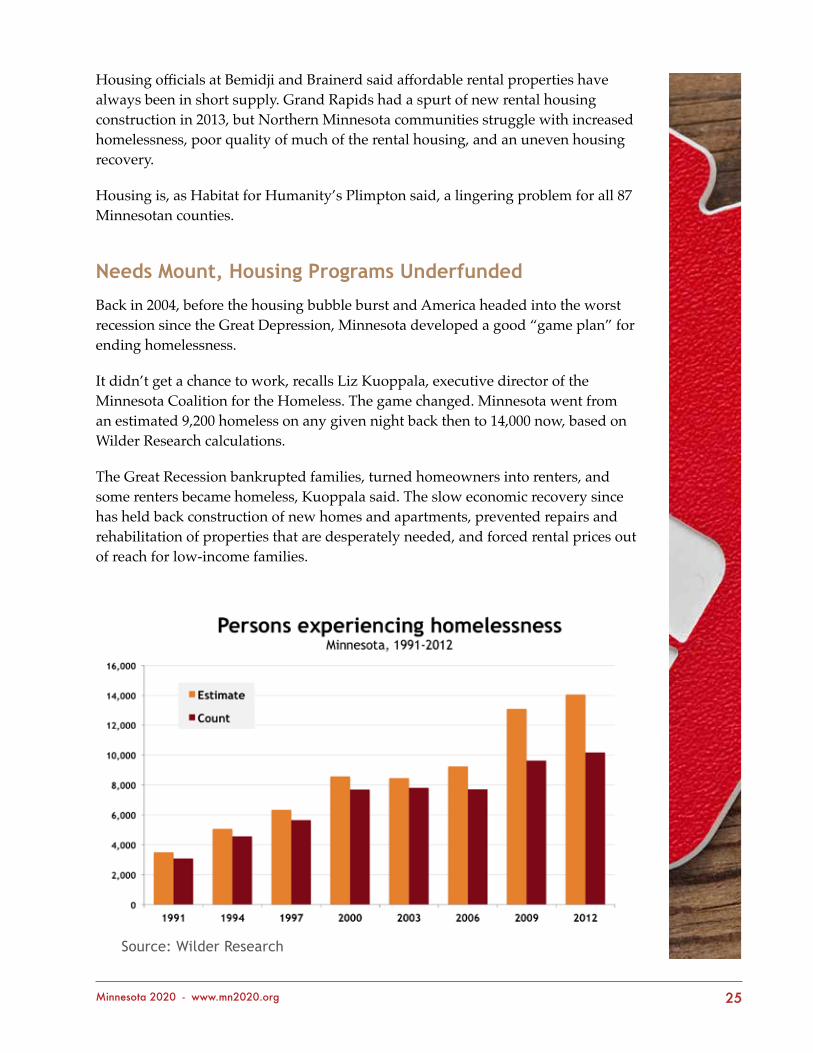
It didn’t get a chance to work, recalls Liz Kuoppala, executive director of the Minnesota Coalition for the Homeless. The game changed. Minnesota went from an estimated 9,200 homeless on any given night back then to 14,000 now, based on Wilder Research calculations.
The Great Recession bankrupted families, turned homeowners into renters, and some renters became homeless, Kuoppala said. The slow economic recovery since has held back construction of new homes and apartments, prevented repairs and rehabilitation of properties that are desperately needed, and forced rental prices out of reach for low-income families.
Source: Wilder Research
26 Uneven Recovery: A Look back at Minnesota’s Housing Crisis
Minnesota neighborhoods, cities, counties and regions have experienced mixed results in coming out of the housing crisis. Unfortunately, the range of recovery appears to stretch from modest to nonexistent.
At the state level, more than 100 Minnesota organizations are engaged with the Homes for All alliance and are pushing the Minnesota Legislature for $100 million in bonding authority for housing.
“Bonds are our best tools at the state level, especially for smaller cities in Greater Minnesota,” said Kuoppala. “The Feds have got to do their part, and they keep cutting back. We need to do what we can in Minnesota.”
With the bonding dollars for housing before the Minnesota Legislature, Minnesota Housing Finance Agency would award funding competitively for supportive housing, preservation of affordable rental housing and foreclosure recovery. General obligation bonds would be used for repair of public housing, which is in tremendous need of restoration all across the state.
Housing groups and developers of affordable housing could undertake hundreds of millions of dollars’ worth of projects to make housing available and affordable to low-income people, if funds were available. Similarly, the Minnesota Interagency Council on Homelessness updated the state government’s plan in December to fight homelessness, starting with ending homelessness for veterans in the next two years. Securing sufficient funding is a key strategy within the plan.
State efforts to make homes affordable, however, only have so much impact and require federal resources to better meet needs.
Housing advocates and their community development allies watch annual battles over funding existing programs while Congress is also looking down the road at tax policy proposals. Both these public policy exercises will have major impacts on housing, new home construction, and rehabilitation of existing housing for low-income people.
Federal tax policy changes promise powerful tools to support housing for lower income families. Reform of the mortgage interest deduction for homeowners to help low income renters and homeowners is one such proposal. And, advocates want to preserve a tax credit program, the Low Income Housing Tax Credit, a key tool in producing much of the nation’s new affordable rental housing.
“bonds are our best tools at the state level, especially for smaller cities in greater minnesota.”
9
27Minnesota 2020 - www.mn2020.org
One force behind housing tax policy change is Rep. Keith Ellison, D-Minn. who introduced the Common Sense Housing Investment Act bill a year ago. It would make additional funds available for the National Housing Trust Fund through reform of the mortgage interest deduction, including capping tax benefits for homes with mortgages over $500,000. Ellison’s bill would also provide additional funding for Public Housing and Low Income Housing Tax Credits.
Sheila Crowley, president and chief executive of the National Low Income Housing Coalition in Washington, said during a December interview with MN2020 that Ellison’s bill would be incorporated into more sweeping tax legislation and not “stand alone.” But, she added, introducing bills and picking up cosponsors are important steps in getting housing initiatives before the tax writing panels.
That is exactly what has happened. In a summary of tax policy analysis and reviews sent to Minnesota housing groups, MHP executive director Chip Halbach noted Congress isn’t likely to complete major tax legislation work this year. At the same time, coalition groups such as the United for Homes campaign and Affordable Rental Housing A.C.T.I.O.N. Campaign were buoyed to find bipartisan housing proposals, including elements of Ellison’s bill, included in the Feb. 26 draft tax legislation proposed by Rep. Dave Camp, R-Mich., who is the chairman of the House Ways and Means Committee. This document will form a basis for next year’s tax policy-making.
Of more immediate concern is what happens to programs dependent on federal budgets.
Early this year, Congress passed an omnibus spending bill that kept the government operating, and it passed the long-delayed federal farm bill as well. The first of these cut funding but kept alive housing programs through the Departments of Housing and Urban Development (HUD), Treasury and Justice, and the Veterans Administration; the farm bill kept rural housing programs from expiring.
Housing program budgets have become especially important nationwide since congressional failure on past spending bills led to automatic program funding cuts known as sequestration. These cuts took 70,000 low-income families out of the housing voucher system nationwide that helps pay rents in private housing, noted the Center on Budget and Policy Priorities. This included 1,994 Minnesota families who lost housing assistance, a 6 percent decline since December 2012
Minnesota’s “Uneven Recovery” has disproportionately impacted low-income families. The need for housing help didn’t go away; sequestration cuts only made matters worse.
28 Uneven Recovery: A Look back at Minnesota’s Housing Crisis
Duluth is a case in point, reflecting communities all over Minnesota, said Pam Kramer, executive director of Duluth LISC (Local Initiatives Support Corp) that helps nonprofit organizations with various housing projects.
“We have aging housing stock that needs repair and rehab work. We have only a 1.5 percent vacancy rate. We need the full range of new housing from affordable for working households on up to market rate housing.”
Groups and government agencies LISC works with need access to both state bonding help and “fully funded” federal housing programs, Kramer said. And echoing what community leaders and housing and development officials say all across the state, she added, “This is no time to cut back on housing funding when it is so closely tied to economic development.”


Minnesota 2020 is a progressive, non-partisan think tank, focused on what really matters.
2324 University Avenue West, Suite 204, Saint Paul, MN 55114
www.mn2020.org


