259
Industrial Development Report 2011 Industrial energy efciency or sustainable wealth creation Capturing environmental, economic and social dividends
| Date post: | 06-Apr-2018 |
| Category: |
Documents |
| Upload: | dayat-laodengkowe |
| View: | 224 times |
| Download: | 0 times |

8/2/2019 Unido Full Report eBook
http://slidepdf.com/reader/full/unido-full-report-ebook 1/259
Industrial Development Report 2011
Industrial energy efciencyor sustainable wealth creation
Capturing environmental, economic and social dividends

8/2/2019 Unido Full Report eBook
http://slidepdf.com/reader/full/unido-full-report-ebook 2/259
Industrial Development Report 2011
Industrial energy efficiencyfor sustainable wealth creation
Capturing environmental, economic and social dividends

8/2/2019 Unido Full Report eBook
http://slidepdf.com/reader/full/unido-full-report-ebook 3/259
Copyright © 2011 United Nations Industrial Development Organization
Te designations employed and the presentation o material in this publication do not imply the expression o
any opinion whatsoever on the part o the Secretariat concerning the legal status o any country, territory, cityor area, or o its authorities, or concerning the delimitation o its rontiers or boundaries.
Designations such as “developed,” “industrialized” and “developing” are intended or statistical convenienceand do not necessarily express a judgement about the state reached by a particular country or area in the devel-opment process.
Te mention o rm names or commercial products does not imply endorsement by UNIDO.
Material in this publication may be reely quoted or reprinted, but acknowledgement is requested, together witha copy o the publication containing the quotation or reprint.
UNIDO ID No.: 442Sales No.: E.11.II.B.41ISBN-13: 978-92-1-106448-3

8/2/2019 Unido Full Report eBook
http://slidepdf.com/reader/full/unido-full-report-ebook 4/259
iii
Contents
xi Foreword
xiii Acnowledgements
xiv Technical notes and abbreviations
xv Glossary
1 Overview
Part A Industrial energy eciency or sustainable wealth creation: capturing
environmental, economic and social dividends
Section 1 Setting the scene
23 Chapter 1 Trends in industrial energy eciency23 Decoupling industrial energy use and economic growth24 How is global industrial energy consumed?26 What has happened to industrial energy intensity globally and regionally?29 How has sectoral industrial energy intensity changed?31 Notes
33 Chapter 2 Technological and structural change or industrial energy
eciency
33 What drives changes in industrial energy intensity?
34 What role have structural and technological actors had in lowering industrial energy intensity?38 How much has technological change lowered energy intensity?46 How much has structural change lowered energy intensity?51 Notes
Section 2 The basis or sustainable wealth creation
52 Chapter 3 The environmental dividend rom industrial energy
eciency
52 Industrial energy use is a key lever or sustainable industrial development53 Lessening the environmental impact o industrial energy use60 Improving industrial energy eciency by reducing materials and water use62 Making industry more energy ecient67 Te mitigation potential is substantial67 Notes
Page

8/2/2019 Unido Full Report eBook
http://slidepdf.com/reader/full/unido-full-report-ebook 5/259
iviv
C ont e nt s
68 Chapter 4 The economic and social dividends rom industrial energy
eciency
68 Te importance o energy costs to businesses72 Risks and rewards o investing in industrial energy eciency75 Does investment in industrial energy eciency pay?80 Te social dividend83 Is there stil l room or protable industrial energy-eciency investments?85 It can be done
85 Notes
Section 3 Challenges and opportunities in sustainable industrialization
86 Chapter 5 Barriers to industrial energy eciency
86 Barriers, ailures and hidden costs87 Market ailures92 Behavioural and institutional ailures: bounded rationality94 Hidden costs95 How the importance o barriers varies
99 Note
100 Chapter 6 Overcoming barriers to industrial energy eciency
through regulation and other government policies
100 Establishing the legal and governance structure or industrial energy-eciency policy106 Creating an industrial energy-eciency regulatory ramework109 Developing an inormation policy112 Promoting new technology and innovation115 Using market-based policy instruments118 Launching nancial instruments
121 Policy design and implementation considerations or developing countries122 Many options123 Notes
125 Chapter 7 International collective action or industrial energy
eciency
125 Te rationale or international collective action127 Setting international targets and standards130 Facilitating technological and structural change132 Contributing to international technology transers135 Procuring international nancing 137 Establishing an international monitoring and coordinating unction or industrial energy
eciency138 Notes
Page

8/2/2019 Unido Full Report eBook
http://slidepdf.com/reader/full/unido-full-report-ebook 6/259
v
C ont e nt s
Part B Trends in manuacturing and manuactured exports, and
benchmaring industrial perormance
141 Chapter 8 Trends in manuacturing – beore and ater the global
nancial and economic crisis
141 Manuacturing in developing countries146 Te impact o the 2008–2009 economic and nancial crisis on manuacturing 151 Structure o global manuacturing employment
152 Notes
153 Chapter 9 Manuactured exports trade
153 rends in world manuactured exports156 Developing countries’ role in world manuactured exports157 rends in manuactures trade between developing countries160 Te impact o the economic and nancial crisis162 Notes
163 Chapter 10 Benchmaring industrial perormance
163 Te new Competitive Industrial Perormance index163 Dimensions, indicators and calculation o the Competitive Industrial Perormance index165 Ranking economies on the Competitive Industrial Perormance index, 2005 and 2009168 Industrial perormance o developing economies by region169 Te Competitive Industrial Perormance index and energy intensity173 Notes
Annexes
176 1 Energy intensity data and methodology177 2 Decomposition data and methodology
178 3 Energy and manuacturing value added sector data179 4 Economies included in the energy-intensity analysis181 5 Industrial energy intensity183 6 How Competitive Industrial Perormance index rankings change when new indicators are added186 7 echnological classication o manuacturing value added data187 8 echnological classication o international trade data188 9 Data clarications or the Competitive Industrial Perormance index, by indicator192 10 Components o the Competitive Industrial Perormance index by economy200 11 Indicators o the Competitive Industrial Perormance index by region and income group208 12 Summary o world trade, by region and income group214 13 Country and economy groups218 14 Industrial energy eciency policy measures
221 Reerences
Page

8/2/2019 Unido Full Report eBook
http://slidepdf.com/reader/full/unido-full-report-ebook 7/259
vivi
C ont e nt s
Boxes
10 1 Experiences o industrial energy-eciency policies applied in selected developing countries34 2.1 Decomposition analysis39 2.2 Industrial energy-eciency R&D case study: decreasing the inlet velocity required or
pneumatic and hydraulic conveying 41 2.3 Uptake o best available technology is generally slow: the case o energy-ecient motors55 3.1 rends in carbon dioxide emissions56 3.2 Climate change aects regions dierently
57 3.3 Discriminating among primary energy sources59 3.4 Coping with the anticipated peak in oil production61 3.5 How a Colombian metal working company saved energy by reducing wastewater and
chemicals63 3.6 Lie-cycle assessment and carbon ootprinting 65 3.7 Integrated clean technology solutions in India73 4.1 Weighing a high-complexity–high energy-cost project in South Arica74 4.2 Weighing a low-complexity–high energy-cost project in China77 4.3 Case study: P. Pindo Deli Pulp & Paper repairs steam leaks81 4.4 Chinese company secures environmental co-benets
82 4.5 Increasing productivity and securing environmental and social co-benets in Viet Nam87 5.1 Determining energy needs88 5.2 Te Firozabad experience with adopting new industrial energy-eciency technology89 5.3 Carrots and sticks or energy eciency90 5.4 Developing countries are the biggest energy subsidizers92 5.5 China: policy impediments to nance or investments in industrial energy eciency96 5.6 Te rebound eect
101 6.1 Energy conservation laws in India and Japan101 6.2 unisia’s National Energy Conservation Agency104 6.3 Voluntary agreements on long-term energy-eciency targets in the Netherlands
105 6.4 China’s op-1,000 Energy Consuming Enterprises programme106 6.5 Key stages in target-setting at the rm level111 6.6 Capacity-building or absorptive capacity117 6.7 Energy saving certicates in India119 6.8 ools or addressing liquidity constraints and risk in developing countries127 7.1 UNIDO and the Montreal Protocol134 7.2 Te Global Environment Facility’s technology transer projects in selected countries134 7.3 National Cleaner Production Centres136 7.4 UNIDO and the Global Environment Facility
Figures
2 1 Growth in energy consumption and energy consumption per capita, 1990–20083 2 Global trends in manuacturing value added, industrial energy consumption and industrial
energy intensity, 1990–20083 3 Industrial energy intensity, by income group, 1990–2008
Page

8/2/2019 Unido Full Report eBook
http://slidepdf.com/reader/full/unido-full-report-ebook 8/259
vii
C ont e nt s
4 4 Components o change in global industrial energy intensity, 1995–20084 5 Components o change in industrial energy intensity, by region and income group, 1995–
2008 (percent)7 6 Internal rates o return o industrial energy-eciency projects with an expected lietime o
ve years24 1.1 Split in industrial energy consumption between manuacturing processes and eedstock,
1990–200825 1.2 Growth in energy consumption and energy consumption per capita, by economic sector,
1990–200825 1.3 Industrial energy consumption, by sector, 1990–200827 1.4 Global trends in manuacturing value added, industrial energy consumption and industrial
energy intensity, 1990–200827 1.5 Industrial energy intensity, by income group, 1990–200828 1.6 Industrial energy intensity in developing economies, by region, 1990–200830 1.7 Energy intensity, by industrial sector and income group, 1995–2008 (tonnes o oil equivalent
per $1,000 manuacturing value added, in 2000 prices)35 2.1 Components o change in global industrial energy intensity, 1995–200836 2.2 Components o change in industrial energy intensity, by region and income group, 1995–
2008 (percent)37 2.3 Components o change in industrial energy intensity by economy, 1995–2008 (percent)39 2.4 Public sector R&D expenditure on energy technologies in selected countries, 1990–200843 2.5 Global average energy intensity and best available technology or ammonia, iron and steel,
aluminium and cement, 1960–201044 2.6 Energy savings potential in iron and steel making, 200646 2.7 System model o industrial energy use48 2.8 ypical energy losses in energy conversion chains49 2.9 Share o selected industrial sectors in global manuacturing value added, 1995–200854 3.1 Global greenhouse gas emissions, by greenhouse gas and sector, 2004
58 3.2 Variability in lie-cycle emissions o principal air pollutants rom electricity generation, 200460 3.3 Factors generally contributing to lowering process energy requirements64 3.4 Breakdown o all greenhouse gas emissions rom the industrial sector, 200466 3.5 Share o direct industrial carbon dioxide emissions rom ossil uel use and industrial
processes, by sector and region or country, 200666 3.6 Contributions to carbon dioxide emissions rom ossil uel combustion, by economic sector,
200871 4.1 Price dierentials in natural gas and electricity71 4.2 Implicit energy prices and energy costs in Germany and Tailand, by sector, 2000 and 200672 4.3 Criteria or making energy-eciency project decisions75 4.4 Valuation and risk drivers or energy-eciency projects77 4.5 Sectoral composition o UNIDO sample o industrial rms investing in energy eciency,
201078 4.6 Payback period o UNIDO sample o industrial rms investing in energy eciency79 4.7 Internal rates o return o industrial energy-eciency projects, by expected lietimes
Page

8/2/2019 Unido Full Report eBook
http://slidepdf.com/reader/full/unido-full-report-ebook 9/259
viiiviii
C ont e nt s
91 5.1 Energy eciency and power supply reliability in selected countries, most recent year available97 5.2 Percentage o rms mentioning specic barriers to energy eciency as most signicant, 201098 5.3 Ranking barriers to industrial energy eciency in the Swedish pulp and paper sector
103 6.1 Breakdown o energy-eciency targets incorporated in laws or programmes, by region, 2009119 6.2 echnology innovation path and nancing gaps126 7.1 Economic benets rom participating in international collective action in industrial energy
eciency141 8.1 Manuacturing value added, 1990–2010
143 8.2 Developing countries’ share in world manuacturing value added and GDP, 1990–2010143 8.3 Share o large manuacturers in developing economy manuacturing value added, 1990,
2000 and 2010150 8.4 Developing countries’ share in world manuacturing employment, 1980–2008150 8.5 Share o manuacturing employment in developing countries, by region, 1998–2008155 9.1 Developed and developing countries’ share o world manuactured exports, 1992–2009155 9.2 echnology composition o manuactured exports, 1992–2009155 9.3 Change in world market share o manuactured exports, by technological level, 2004–2009157 9.4 Share o developing country manuactured exports, by region, 1998–2009158 9.5 Change in regional share o world manuactured exports by technological level, 2004–2009
158 9.6 rade patterns between developed and developing countries, 2004–2009159 9.7 Manuactured exports markets, by region, 2005 and 2009159 9.8 Largest country share in region’s manuactured exports, 1997, 2003 and 2009160 9.9 Manuactured exports between developing countries, 1990–2009162 9.10 Growth o manuactured exports in selected large developing countries, 1996–2010171 10.1 Linking the Competitive Industrial Perormance index with manuacturing energy
intensity, 2008183 A6.1 Small and large economy bias, manuacturing value added, 2005184 A6.2 Small and large economy bias, manuactured exports, 2005
Tables9 1 echnical and economic savings potential arising rom industrial energy-eciencyimprovements
16 2 Manuacturing value added levels and growth, by region, 2005–2010 (US$ billions unlessotherwise indicated)
17 3 World manuactured export levels and growth, by region, 2004–2009 (US$ billions unlessotherwise indicated)
18 4 Rank on the revised Competitive Industrial Perormance index, 2005 and 200942 2.1 Examples o best available technology uptake in China: technology diusion as a share o
capacity, 2000 and 2006–2009 (percent)45 2.2 ypical savings rom eciency measures or steam systems (percent unless otherwise indicated)47 2.3 Resource-ecient and cleaner production approaches to improving industrial energy eciency69 4.1 Share o energy costs in total industry input costs, by sector, latest available year (percent)84 4.2 echnical and economic savings potential arising rom industrial energy-eciency
improvements
Page

8/2/2019 Unido Full Report eBook
http://slidepdf.com/reader/full/unido-full-report-ebook 10/259
ix
C ont e nt s
95 5.1 Hidden costs associated with investments in industrial energy eciency108 6.1 Use o minimum eciency perormance standards in selected economies110 6.2 Inormation and technology policies applied in developing countries, 2010142 8.1 Level and share o world manuacturing value added, by region and income group, 1990,
2000 and 2010144 8.2 echnology composition o manuacturing value added, by region and income group,
1995–2009 (percent)145 8.3 Industry sector share o manuacturing value added or developing and developed
countries, selected years, 1995–2009 (percent)146 8.4 Developing and developed countries’ share o global manuacturing value added by
industry sector, selected years, 1995–2009 (percent)148 8.5 Leading producers in the ve astest growing industry sectors, 2000 and 2009 (percent)149 8.6 Manuacturing value added levels and growth, by region and income group, 2005–2010
(US$ billions unless otherwise indicated)151 8.7 Share o manuacturing employment or developing and developed countries, by industry
sector, selected periods over 1993–2008 (percent)153 9.1 World exports, by product category, 2004–2009 (US$ billions unless otherwise indicated)154 9.2 World manuactured exports, by region and income group, selected years, 1995–2009
(US$ billions)156 9.3 op 20 dynamic manuactured exports, 2005–2009161 9.4 World manuactured export levels and growth, by region and income group, 2004–2009
(US$ billions unless otherwise indicated)165 10.1 Rankings on the Competitive Industrial Perormance index, 2005 and 2009167 10.2 Change in rank on the Competitive Industrial Perormance index between 2005 and
2009170 10.3 Rank o developing economies on the Competitive Industrial Perormance index, by
region, 2005 and 2009178 A3.1 Correspondence between energy data and manuacturing value added data by sector
179 A4.1 All economies, by income group180 A4.2 Developing economies, by region181 A5.1 Industrial energy intensity by economy, 1990, 2000 and 2008 (tonnes o oil equivalent per
US$1,000 o manuacturing value added)184 A6.1 Impact o changes in the Competitive Industrial Perormance index methodology on the
rankings, 2005186 A7.1 echnology classication o manuacturing value added, ISIC Revision 3186 A7.2 echnology classication o manuacturing value added, ISIC Revision 2187 A8.1 echnology classication o exports, SIC Revision 3188 A9.1 Data years used or computing the Competitive Industrial Perormance index192 A10.1 Indicators o industrial perormance by economy, 2005 and 2009200 A11.1 Manuacturing value added per capita, 2005–2009 (2000 US$)201 A11.2 Share o manuacturing value added in GDP, 2005–2009 (percent)202 A11.3 Share o manuacturing value added in world manuacturing value added, 2005–2009
(percent)
Page

8/2/2019 Unido Full Report eBook
http://slidepdf.com/reader/full/unido-full-report-ebook 11/259
xx
C ont e nt s
203 A11.4 Share o medium- and high-technology production in manuacturing value added,2005–2009 (percent)
204 A11.5 Manuactured exports per capita, 2005–2009 (current US$)205 A11.6 Share o manuactured exports in total exports, 2005–2009 (percent)206 A11.7 Share in world manuactured exports, 2005–2009 (percent)207 A11.8 Share o medium- and high-technology production in manuactured exports, 2005–2009
(percent)208 A12.1 otal exports, 2005–2009 (US$ billions)
209 A12.2 Primary exports, 2005–2009 (US$ billions)210 A12.3 Resource-based manuactured exports, 2005–2009 (US$ billions)211 A12.4 Low-technology manuactured exports, 2005–2009 (US$ billions)212 A12.5 Medium-technology manuactured exports, 2005–2009 (US$ billions)213 A12.6 High-technology manuactured exports, 2005–2009 (US$ billions)214 A13.1 Countries and economies by region, and largest developing economy in each region216 A13.2 Countries and economies by income group and least developed countries218 A14.1 Industrial energy eciency policy measures in selected developing countries
Page
8/2/2019 Unido Full Report eBook
http://slidepdf.com/reader/full/unido-full-report-ebook 12/259
xi
Foreword
Since the IndustrialRevolution and theintroduction o steam
power, industrializationhas produced goods
that have improved liv-ing standards aroundthe world. Te greateravailability o a broaderrange o manuactured
products has been based on a substantial expansion inthe use o energy. Over the past 200 years, energy con-sumption per capita has increased, and overall energyconsumption is unlikely to decline in the oreseeableuture.
During the early stages o industrialization, energyseemed to be plentiul, without evident limits on itsuse. More recently, we have become aware that the os-sil uels that have powered industrial development are
probably not as abundant as once thought. Even moreimportant, their use has generated unintended andundesirable environmental impacts.
echnological change has helped to address thedual problems o growing resource scarcity and envi-ronmental degradation. New and emerging tech-
nologies that consume materials more eciently, use waste heat or upgrade motor perormance have spread within the manuacturing sectors, boosting the energyeciency o existing equipment, production processesand plants. Large price changes in global energymarkets as well as national and international policyresponses to energy availability and environmentalimpact have also helped to shi attention towardsindustrial energy eciency.
However, we are ar rom conquering the chal-lenges posed by ossil uel–based energy depletionand greenhouse gas emissions. As developing coun-tries raise their standards o living, take on a growing share o manuacturing and engage in a wider rangeo industrial activity, energy use is likely to continue
its upward trajectory. Te question that arises is howto accommodate rising living standards in developing countries while moderating the pernicious eects o energy use.
UNIDO’s Industrial Development Report 2011
(IDR 2011) shows that increased industrial energyeciency is one o the most promising routes to sus-tainable industrial development worldwide, particu-larly in developing countries. Industry remains among the most energy-intensive sectors: its contribution toglobal GDP is lower than its global share o energyconsumption. Industrial processes have an estimatedtechnical eciency potential o 25–30 percent. Tatmeans that adopting best available technologies andrelated business and engineering practices could even-
tually enable industry to lower emissions o green-house gases and combat climate change and alsoreduce other pollutants. Te energy savings could beredirected to meeting social needs or access to energy,
particularly acute in developing countries, and couldhelp companies everywhere to improve their bottomline.
Te report provides urther evidence that improve-ments in industrial energy eciency continue apace.During the past 20 years, developed countries, which
are the largest energy users, have lowered their energyintensity. Large developing countries have also real-ized the importance o boosting eciency early intheir industrialization processes and have begunto adopt the technologies and other measures thathave led to unprecedented gains in energy eciency.Low- and middle-income developing countries, whichare gradually taking over manuacturing production,are also contemplating ways o becoming more energyecient.
Te report argues that the key to sustaining thesegains continues to be industrial technological changeand the related economic and policy incentive sys-tem. Yet markets do not always work as expected, norare individual and corporate behaviour as rational as

8/2/2019 Unido Full Report eBook
http://slidepdf.com/reader/full/unido-full-report-ebook 13/259
xiixii
F or e w or d
predicted by orthodox economic theory. Multiple bar-
riers block the path to ull energy-eciency levels.
Te report suggests that overcoming barriers to
industrial energy eciency will require public policy
measures, including a sectorally coordinated energy
strategy; ormal and inormal mechanisms, tar-
gets, benchmarks and standards; and policy designs
grounded in the specic context at the country level.
Policy interventions involve choosing the right policymix, continuously assessing efectiveness and ocus-
ing on small and medium-size enterprises. Policy
measures include ocial support or developing more
ecient industrial technologies, disseminating best
available technologies, introducing scal incentives
or innovation and difusion o industrial energy e-
ciency, and establishing nancial mechanisms to und
improvements.
Te report recommends decisive international col-
lective action, including reducing industrial energyintensity by 3.4 percent a year through 2030. It calls
or international collaborative research and develop-
ment and the establishment o inormation clearing-
houses and inormation exchanges to identiy best
practices and compare the perormance o diferent
technologies under varying conditions. Since the
adoption o energy-ecient technologies involves the
acquisition o increasingly sophisticated technologi-
cal capabilities, the report points at ways in which the
international community can assist in capacity devel-opment. It also discusses the need or a well developed
ramework or international nancing o industrial
energy eciency.
I am pleased to note that the IDR 2011 is a prelude
to the UN Secretary General’s Sustainable Energy
or All initiative. Te General Assembly has declared
2012 as the International Year o Sustainable Energy
or All, and collaborations are planned with all rel-
evant stakeholders in the public and private sectors
to raise public awareness and the nancial resources
needed to combat energy poverty. Te Sustainable
Energy or All initiative will bring these stakehold-
ers together in a global campaign to turn attention
towards the importance o energy or development
and poverty reduction. Energy is vital to almost every
major challenge and opportunity that the world acestoday. Be it jobs, security, climate change, ood pro-
duction or poverty reduction, sustainable energy or
all is essential or strengthening economies, protecting
ecosystems and achieving equity.
It also gives me great satisaction to report that the
IDR 2011 has drawn on all o the knowledge resources
o UNIDO, bringing together the organization’s
expertise and experience in analytical research, tech-
nical cooperation and policy advice. Tis has resulted
in a comprehensive and multidisciplinary treatment o the critical issues covered in the report. Moreover, the
IDR 2011 has a unique ocus on developing countries,
backed by a set o statistics unavailable anywhere else.
And as has become customary, the report includes
sections on trends in manuacturing value added and
manuactured exports and on UNIDO’s Competitive
Industrial Perormance index, which ranks econo-
mies according to multiple indicators o industrial
perormance.
Kandeh K. Yumkella
Director-General, UNIDO

8/2/2019 Unido Full Report eBook
http://slidepdf.com/reader/full/unido-full-report-ebook 14/259
xiii
Acknowledgements
Te Industrial Development Report (IDR) 2011 was prepared under the overall guidance o Kandeh K.Yumkella, Director-General o the United NationsIndustrial Development Organization (UNIDO).
Te report was prepared by a cross-organizational
team led by Ludovico Alcorta, Director o theDevelopment Policy, Statistics and Research Branch,and comprising Morgan Bazilian, René van Berkel,Amadou Boly, Smeeta Fokeer, Dol Gielen and OlgaMemedovic. Many o the concepts developed in thereport were discussed and validated at workshops atUNIDO in Vienna in November 2009 and at TeEnergy and Resources Institute (ERI) in New Delhiin June 2010.
he IDR 2011 beneited rom the support o
many international experts, including Robert Ayres,Nicola Cantore, Giuseppe De Simone, Wolgang Eichhammer, obias Fleiter, Marta Foresti, DukeGhosh, Mark Jaccard, Paul Kleindorer, RitinKoria, Hoang Viet Le, Alexandra Mallett, DirkMasselink, Brian McCrohan, Mike Morris, JohnNyboer, Sheridan Nye, Martin Patel, Ascha Pedersen,Amitav Rath, Fang Rong, Joyashree Roy, JoachimSchleich, Steve Sorrell, Dirk Willem te Velde, Jeroen
van den Bergh, Ernst Worrell and Shaojun Zeng.
Robert Ayres and Steve Sorrell oered advice andcomments throughout report preparation. Huijong Wang, Vice President o the Academic Committeeo the Development Research Center o China’s StateCouncil, and Girish Sethi, Director o the IndustrialEnergy Eciency Division o ERI, together with
Arno Behrens, Mark Hopkins, Jim Lazar, LynnMytelka, David Popp and Lynn Price, reviewed vari-ous dras and sections o the report. Te nal drabeneited rom substantive comments and sugges-tions by Wilried Luetkenhorst, Managing Director,
Strategic Research, Quality Assurance and AdvocacyDivision, UNIDO.
Te report also received support rom a team o interns including Nargiza Abdullaeva, Eva Festl, ElisaFuruta, Vassilena Ivanova, Brian Klausen, SushmithaNarsiah, Ijeoma Onyeji, Erik Schau, Jorge Vázquezand Juanshi Wu. Debby Lee, Fernando Russo andIguaraya Saavedra provided clerical, administrativeand secretarial support, and Niki Rodousakis pro-
vided copyediting assistance.
Many UNIDO colleagues participated in IDR 2011–related advisory panels, task orces, steering groups and working teams. Among them are ManuelAlbaladejo, Michele Clara, Edward Clarence-Smith,Nobuya Haraguchi, Sam Hobohm, Anders Isaksson,Eric Lacanlale, Heinz Leuenberger, Pradeep Monga,Cormac O’Reilly, Dmitri Piskounov, Bettina Schreckand Shyam Upadhyaya. Relevant parts o the report
were reviewed and amended, as needed, by UNIDOtechnical branches and publications committee.
Meta de Coquereaumont, Bruce Ross-Larson andLaura Wallace o Communications Development Inc. were the principal editors o the report. Christopherrott and Rob Elson, also with CommunicationsDevelopment Inc., copyedited and prooread thereport. Elaine Wilson designed and laid out the report.

8/2/2019 Unido Full Report eBook
http://slidepdf.com/reader/full/unido-full-report-ebook 15/259
xiv
Reerences to dollars ($) are to US dollars, unless otherwise indicated.
In this report, industry reers to the manuacturing industry and sectors reers to specic manuacturing sectors.
Tis report denes developed countries or developed economies as the group identied as “high-income OECD
countries” by the World Bank and developing countries or developing economies as all other economies. SeeAnnex 13 or a complete list o economies by region, income level, least developed countries and largest develop-ing economy in each region.
Tis report ocuses on the energy consumed in industrial processes, so most o the analysis excludes eedstockuse.
Components in tables may not sum precisely to totals shown because o rounding.
AGECC Advisory Group on Energy and Climate Change
CIP Competitive Industrial PerormanceCO2-eq carbon dioxide equivalentEJ exajoulesGDP gross domestic productGEF Global Environment FacilityGJ gigajoulesGt gigatonnesGtoe gigatonnes o oil equivalentIDR Industrial Development Report IEA International Energy Agency
ISIC International Standard Industrial ClassicationISO International Organization or StandardizationMVA manuacturing value addedOECD Organisation or Economic Co-operation and DevelopmentR&D research and developmentSAR Special Administrative Region o China (Hong Kong, Macao)toe tonnes o oil equivalentUNEP United Nations Environment ProgrammeUNIDO United Nations Industrial Development Organization
Technical notes and abbreviations

8/2/2019 Unido Full Report eBook
http://slidepdf.com/reader/full/unido-full-report-ebook 16/259
xv
Best available technology. Te most energy-ecient way o producing goods and services that is com-mercially viable and in use.
Best practice technology. Te top perorming tech-nologies and business practices or industrial
energy eciency among those in use by most plants within an industry.
Combined sector. A sector that combines some o the characteristics o discrete and process productsectors. (See also discrete product sector and process
sector.)Decoupling. Weakening or breaking the link between
environmental eects and economic activity sothat output increases with a less than commensu-rate increase (or with a decrease) in energy con-
sumption (Von Weizsäcker 1989; Enevoldsen,Ryelund and Andersen 2007). Absolute decoup-
ling in industry is when the decrease in material,energy and pollution intensity is greater than thegrowth rate in manuacturing (OECD 2002;Spangenberg, Omann and Hinterberger 2002).
Relative decoupling is when the growth rate o manuacturing value added is higher than that o industrial energy consumption.
Discrete product sector. A sector that involves a vari-
ety o production processes because o the dieren-tiated nature o the products and their constituentcomponents, each also requiring its own produc-tion process. Te equipment used depends on pro-duction volume and technical complexity; large-
volume and low- to moderate-complexity output islargely automated. Tere are also sequential trans-ormation stages – numerous in more complex
products – oen linked through an assembly lineand requiring many parts. Troughput is trans-ormed by temperature, orce or chemical reaction;output is counted in units rather than in weight or
volume. (See also process sector.)Embodied energy. Te cumulative amount o com-
mercial energy (ossil, renewable, nuclear) invested
to extract, process and manuacture a product andtransport it to its point o use. Tis accounting concept sums the energy physically embodied inthe materials (which can be released by reversing the process) and the energy invested in creating the
processing conditions and bringing the materialstogether (including transport).
Energy. Te ability to do work. In industry it com-monly reers to the energy used to power manu-acturing processes. Tis report measures energyin tonnes o oil equivalent to allow compari-sons o energy rom various sources. Primary
energy sources include biomass-based uels (trees,branches, crop residues), ossil uels (coal, oil, natu-ral gas) and renewable sources (sun, wind, water).
Secondary energy sources are derived rom other(usually primary) energy sources and have zero pol-lution at the point o use (electricity, or example).
Energy eiciency. he ratio o a system’s energyinputs to its output. Since inputs and outputs canbe measured in more than one way, energy eciency has no single meaning. (See also exergy.) An engi-neer’s denition will dier rom an environmen-talist’s or an economist’s – mainly reecting dier-ences in the level o aggregation.
Te energy-eciency ratio is commonly calledthermal or rst-law eciency, based on the rstlaw o thermodynamics. In any closed energy-conversion process, energy can be neither creatednor destroyed; energy that goes in must come outor be accumulated in the system. But only a por-tion o the energy output will be in a useul orm(or example, light) while the rest is waste, typi-cally low-temperature heat. Te thermal eciencyo a process is thus the ratio o useul energy out-
puts to total energy inputs.In engineering, energy eciency is interpreted
as conversion eciency – the proportion o theenergy input that is available as a “useul” output.For example, only 5–10 percent o the electrical
Glossary

8/2/2019 Unido Full Report eBook
http://slidepdf.com/reader/full/unido-full-report-ebook 17/259
xvixvi
Gl o s s a r y
energy ed to an incandescent light bulb is con- verted to useul light energy; the remaining 90–95 percent is lost to the environment as “waste”energy (low-temperature heat). In developed coun-tries, the average eciency o conversion o heatenergy rom uel to electric power delivered toconsumers is 33–35 percent (Ayres, urton andCasten 2006), so i this electricity is converted to
light energy using an incandescent bulb, the over-all energy eciency is just 3 percent.
In economics, energy eiciency is the ratioo the value o output to the quantity or cost o energy inputs – the amount o economic activity
produced rom one unit o energy. (See also energyintensity.)
Energy intensity. Te amount o energy used to produce one unit o economic activity. It is theinverse o energy eciency: less energy intensity
means more energy eciency. Tis report meas-ures energy input in physical terms (tonnes o oilequivalent) and economic activity in monetaryterms (sectoral and manuacturing value added),so the energy intensity o a manuacturing processis the amount o energy used to produce a unit o
value added – or example, tonnes o oil equivalent per $1,000 in manuacturing value added (in con-stant dollars).
Energy services. Te physical services (light, torque
or heat) delivered when energy is consumed. Someenergy is used directly in manuacturing (or exam- ple, uel or direct-red kilns or ovens), but mostis converted by utilities into an energy service thatis then used in the manuacturing system, such as
process heating and cooling liquids, compressedair, motion and lighting. Te aim o process econo-mies is to produce more products with less use o energy services – or example, more beer per tonneo steam use or more cups per unit o uel consump-tion in the ring kiln.
Environmental impacts o industrial energy use.
Te environmental impacts o industrial energyuse dier by energy source. Direct impacts ariseduring energy use in industrial processes, while
indirect impacts result rom production and sup- ply o the energy source.
Exergy. Te maximum work that can be perormed asa subsystem approaches thermodynamic equilib-rium with its surroundings – that is, the amounto energy actually used to achieve an intended ordesired end result in an end-use application or totalenergy used minus estimated losses. It is known
technically as “useul energy.”Unlike irst-law energy eiciency, this con-
cept takes into account qualitative dierencesbetween types o energy, particularly their abilityto perorm physical work (to move an object overa distance). For example, high temperature steamhas a greater ability to perorm physical workthan low-temperature hot water. While rst-laweciency is easy to grasp (energy is conserved;all o it must be accounted or as useul output or
waste). Te problem is that the numerator (useuloutput) is not rigorously dened. For instance, itis easy to misinterpret a boiler’s eciency (say, 80
percent i 80 percent o combustion heat goes intothe water tank and 20 percent goes up the ue) asthe eciency with which a house or bathwater isheated by the boiler. In act, the ratio reveals noth-ing about how much energy would be required toheat the house by the best (most ecient) availabletechnology.
A more precise denition is the ratio o theminimum amount o energy theoretically neededto perorm a task (such as heating a house) to theamount o energy used in practice (the eciency o the urnace-plus-boiler system in heating a house islikely to be around 5 percent, much less than theboiler’s 80 percent eciency). An equivalent wayo expressing this idea is the ratio o the amounto thermodynamic work perormed by a process(the numerator) to the maximum amount o workthat could be perormed in theory (exergy). Tisratio is second-law eciency because it takes intoaccount the unavoidable losses owing to the sec-ond law o thermodynamics. While energy is con-served, exergy, the useul component o energy, is

8/2/2019 Unido Full Report eBook
http://slidepdf.com/reader/full/unido-full-report-ebook 18/259
xvii
Gl o s s a r y
destroyed by every process or action, while the non-useul component o energy (anergy) increases.Eventually, all energy becomes anergy, because itcan do no work. Only second-law eciency canshow how well machines and systems are doing andhow much opportunity there is or improvement.he irst-law deinition has oten been used toclaim that an economic system, or a process within
it, is much more ecient than it really is.Feedstock. Energy used as a raw material to generate
power. Most o the analysis in this report excludeseedstock.
Gross energy requirement. Te amount o energyrequired to manuacture a product. Similar toembodied energy but product-specic.
Industrial energy eciency. Te ratio o the useulor desired output o a process to the energy inputinto a process; or a higher aggregated level (sector,
economy or global), the ratio o the amount o eco-nomic activity produced rom one unit o energy.
Industrial energy intensity. Te amount o energyused to produce one unit o economic activityacross all sectors o an economy; related to theinverse o energy eciency but only at the sectoral,economy or global level.
Manuacturing value added. See value added.Primary energy. Te energy embodied in natural
resources beore they undergo any human-made
conversions or transormations; examples are coal,crude oil, sunlight, wind, running water in rivers, vegetation and uranium.
Process sector. An industrial sector that uses coal,natural gas, metallic and non-metallic mineralsor oil as raw material or eedstock; that involvesa sequence o linked transormation stages withseveral supporting processes operating on site; thatrequires a series o containers, pipes, vessels, com-
plex purpose-designed and abricated plants andadvanced control technologies; that employs high
pressures, high temperature and chemical reactionsto transorm throughput; and that delivers outputin bulk, generally in units o weight or volume,although the output may be presented or packaged
dierently depending on the customer. See alsodiscrete product sector.
Sectoral value added. See value added.Structural change. Changes in the long-term compo-
sition and distribution o economic activities. (Seealso technological change.)
Technological change. Improvements in technology.echnological change involves a series o stages
with multiple actors, relationships and eedbackloops – rom invention, as a new technology is cre-ated and prototyped, to innovation, as it becomescommercially viable (Freeman and Soete 1997;IEA 2008a). In decomposition analysis, i data onmanuacturing processes were available at the low-est level o aggregation, the measure o technicalchange would be actual physical eciency and therest would be structural change (Jenne and Cattell1983). Industrial energy intensity can be lowered
by improving technology (technological change)and producing more goods that require less energy(structural change).
Technological eciency. Te eciency with whichthe economy converts raw materials into nishedmaterials, or the ratio o actual work output to thetheoretical maximum. It is the result o technologi-cal change, system change and product upgrading.
Technological intensity. Te ratio o input use andservice output across a specic manuacturing sec-
tor. It is the inverse o technological eciency.Technology. Te application o knowledge to produc-tion. It comprises processes (organizational andmanagement practices and production processes),knowledge (tacit and codied) and products andmachines (physical equipment and artiacts).Processes and knowledge are sometimes reerred toas “soware” and products and machines as “hard-
ware” (IPCC 1996).Total fnal energy consumption. Te sum o con-
sumption in end-use sectors. For the most part,nal consumption reects deliveries to consumers(IEA 2010c).
Value added. A measure o output net o intermediateconsumption, which includes the value o materials

8/2/2019 Unido Full Report eBook
http://slidepdf.com/reader/full/unido-full-report-ebook 19/259
xviiixviii
Gl o s s a r y
and supplies used in production, uels and electric-ity consumed, the cost o industrial services suchas payments or contract and commission workand repair and maintenance, compensation o employees, operating surplus and consumption o xed capital. Manufacturing value added is thecontribution o the entire manuacturing sector to
GDP (manuacturing net output). Sectoral value
added is the net output produced by individualsectors. Te sum o value added rom all manuac-turing sectors should equal manuacturing valueadded, but limited coverage o activity units ordata items in manuacturing surveys can result indiscrepancies.
8/2/2019 Unido Full Report eBook
http://slidepdf.com/reader/full/unido-full-report-ebook 20/259
1
Overview
Part A
Industrial energy eciency or sustainable wealth creation:
capturing environmental, economic and social dividends
he Industrial Development Report 2011 (IDR)addresses the role o industrial energy eciency insustainable industrial development. About a h o global income is generated directly by the manuactur-ing industry, and nearly hal o household consump-tion relies on goods rom industrial processes. People’sneeds or ood, transportation, communication,
housing, health and entertainment are met largelyby manuacturing. Since the Industrial Revolution, waves o innovation have shaped how people work andlive. During the 19th and 20th centuries, developedcountries relied on manuacturing to reduce povertyand improve the quality o lie o their growing popu-lations. oday, developing countries are counting onindustrialization to do the same or them.
Improvements in the standard o living made possible through industrialization have come at anenvironmental cost. Energy consumption per capitahas increased nine-old over the last 200 years (Cook1971). Materials use per capita more than doubled over1900–2005 (Krausmann et al. 2008). And though theossil uels that have ed industrial development are
not as abundant as once thought, overall energy con-sumption is not likely to all soon. Pollution, resourcedepletion and the waste o discarded products – eachat an all-time high – are major causes o environmen-tal degradation and climate change. Policy-makersmust address them as they remap development paths.
Industrial development must become sustain-
able. Continued high resource consumption and reli-ance on carbon-intensive and polluting technologies will sap the potential or growth and development.Innovative solutions, national and global, are vitalto making industrial activity more sustainable – toattuning it to environmental, economic and socialneeds. Tis “green industry” approach can provide theblueprint or sustained industrial development.
Industrial energy eciency is a key oundationor greener industry worldwide. By building on pastsuccesses, countries can develop their industries andgenerate employment while tempering the impacts onresource depletion and climate change.
he IDR 2011 ocuses on industrial energy-eciency challenges in developing countries, which
Key messages
• Impovingindustiaenegyefciencyisakeyoutetosustainabeindustiadeveopmentwodwide–especiayin
deveopingcounties.Investinginenegy-efcienttecnoogies,systemsandpocessescanpovideenvionmenta,
economicandsociadividendstoacievegeengowt.
• Inecentdecades,industiaenegyefciencyasbeenimpovingasindustiaenegyintensityasfaen(atan
aveageof1.7pecenta yea),tougabsouteenegyconsumptionose35pecentove1990–2008.Enegy
consumptioncoudgowevenfasteasdeveopingcountieseduceteincomegapwitdeveopedcountiesand
gappewitisingdemandfomanufactuedpoductsfomgowingpopuations.
• Inbotdeveopedanddeveopingcounties,investinginindustiaenegyefciencymakesnanciasense.Yette
potentiafofuteinvestmentsemainsig.Wyaeteseinvestmentoppotunitiesnotbeingeaized?Because
countiesfacenumeousbaiestoinvestment–baiesstemmingfommaketandbeaviouafaiues.
• Pubic poicy inteventions wi be needed to ovecome tese baies, dawing on eguatoy and maket-,
knowedge- andinfomation-basedtoos.Agobaconsensuscoudbebuittosuppotsucinteventionstouginte-
nationacoectiveactiontoeduceindustiaenegyintensity3.4pecentayea,o46pecentintota,toug2030.

8/2/2019 Unido Full Report eBook
http://slidepdf.com/reader/full/unido-full-report-ebook 21/259
22
ov e r v i e w
“ Industry is the largest energy user
globally, and growth in industrial energy use
would have been higher over 1990–2008 but
or reductions in industrial energy intensity
are emerging as key actors in global industrial develop-ment. Te report looks in depth at long-term trends inindustrial energy intensity and related technologicaland structural change; examines the environmental,economic and social benets o industrial energy e-ciency; and identies obstacles to its promotion anduptake and ways to overcome them.
Changing industrial energy trendsFinal energy consumption worldwide increased rom6.0 gigatonnes o oil equivalent (Gtoe) in 1990 to 8.2Gtoe in 2008, a 35 percent rise. Per capita, the increase
was ar less steep, rom 1.2 tonnes o oil equivalent(toe) in 1990 to 1.3 toe in 2008, or just above 7 percent(Figure 1). Developed economies saw a steady increasein energy demand to 3.4 Gtoe in 2008, equivalent to3.5 toe per capita. Energy demand by developing coun-tries grew aster, reaching 4.7 Gtoe in 2008, or 0.9 toe
per capita.
Industry is the largest energy user, accounting or around 31 percent o world energy consumptionsince the early 1990s. In developed economies, how-ever, industry accounted or only 24 percent o energyconsumption (0.8 Gtoe), lagging behind the transportsector (32 percent) and slightly ahead o the residentialsector (19 percent). In developing economies, energydemand in industry rose much aster and remains the
main user o energy (1.7 Gtoe).
Industrial energy intensity is alling
Growth in industrial energy use would have beenhigher over 1990–2008 but or reductions in indus-trial energy intensity – the ratio o the amount o energy used to produce a unit o output (convention-ally measured as $1,000 in manuacturing value added[MVA]). Over the past 20 years, developed economieshave been reducing industrial energy intensity. In
addition, large developing economies such as China,
20082005200019951990 20082005200019951990
20082005200019951990
20082005200019951990
20082005200019951990 20082005200019951990
G i g a t o n n e s
o f o i l e q u i v a l e n t
World
T o n n e s
o f o i l e q u i v a l e n t p e r c a p i t a
World
Developed economies Developing economies
Developed economies Developing economies
Mining and construction Agriculture, forestry and fishing Commercial and public services Energy Residential Transport Industry
0
2
4
6
8
10
0
1
2
3
4
0
1
2
3
4
5
0.0
0.2
0.4
0.6
0.8
1.0
0
1
2
3
4
0.0
0.3
0.6
0.9
1.2
1.5
Figure 1
Growth in energy consumption and energy consumption per capita, 1990–2008
Industry is contributing to the rise in global energy consumption
Source: IEA 2010c.

8/2/2019 Unido Full Report eBook
http://slidepdf.com/reader/full/unido-full-report-ebook 22/259
3
ov e r v i e w
“ Over 1995–2004, technological change
accounted or a slightly larger share o
the decline in industrial energy intensity
globally, but structural change has become
increasingly important since 2005
India and Mexico and transition economies such asAzerbaijan and Ukraine began adopting technologiesand measures that produced unprecedented cutbacksin industrial energy intensity. Among the trends:• Global industrial energy intensity dropped some
25 percent over 1990–2000, but stabilized morerecently at around 0.35 toe per $1,000 o MVA (inconstant 2000 prices; Figure 2).
• Industrial energy intensity has been inversely related to national income since 1990 (Figure 3). On aver-age over 1990–2008, developed economies had thelowest energy intensity (0.2 toe per $1,000), andlow-income developing economies had the highest(2.2 toe per $1,000).Closer analysis o industrial energy intensity
trends over 1995–2008 or 62 economies meeting specic criteria or decomposition analysis shows a22.3 percent decline, or an average annual reduction
o 1.9 percent (Figure 4). Both technological andstructural actors contributed. echnological changeoccurs through changes in the product mix o each
manuacturing sector, adoption o more energy-eicient technologies, optimization o productionsystems and application o energy-ecient organiza-tional practices. Structural change reects changes inthe contribution o each sector, including shis romor towards energy-intensive industries. Over 1995–2004, technological change accounted or a slightlylarger share o the decline in industrial energy inten-
sity globally (see Figure 4), but structural change hasbecome increasingly important since 2005. By 2008,structural change (12.5 percent) had a larger eectthan technological change (9.8 percent).
Structural change was the main driver o
alling energy intensity over 1995–2008
Reductions in energy intensity over 1995–2008 werelarger in developing economies than in developedeconomies (Figure 5). Structural change was the
driving orce behind reductions in developed econo-mies and in high-income developing economies asthey shied rom energy-intensive industries towards
0
50
100
150
200
20082005200019951990
I n d e x ( 1 9 9 0
= 1
0 0 )
Manufacturing value added, 2008
US$7.35 trillion
Industrial energy intensity, 20080.35 tonnes of oil equivalent per US$1,000
Industrial energy
consumption, 20082.54 gigatonnes of oil equivalent
Figure 2
Global trends in manuacturing value added,industrial energy consumption and industrialenergy intensity, 1990–2008
Industrial energy intensity ell markedly in 1990–2000 but stabilized
more recently
Note: Industrial energy intensity in 2000 US dollars.
Source: UNIDO 2 010e,,g; IEA 2010c.
0
1
2
3
20082005200019951990
T o n n e s o f o i l e q u i v a l e n t p e r $ 1 , 0
0 0 m a n u f a c t u r i n g
v a l u e a d d e d
Low-income developing economies
Developed economies
Upper middle-incomedeveloping economies
Developingeconomies
High-income developing economies
Lower middle-income developing economies
Figure 3
Industrial energy intensity, by income group,1990–2008
The higher the development level, the lower the industrial energy
intensity
Note: See Annex 4 or economies in e ach group. Industrial energy intensity in 2000 US dollars.
Source: UNIDO 2010e,,g; IEA 2010c.

8/2/2019 Unido Full Report eBook
http://slidepdf.com/reader/full/unido-full-report-ebook 23/259
44
ov e r v i e w
“ Reductions in industrial energy intensity ater
1995 were around 30 percent or high-income
developing economies and or upper middle-income
developing economies and around 40 percent
or lower middle-income developing economies
high-tech sectors. echnological change was appar-ent at all developing economy income levels, and thelower the income level, the higher the technical eect.otal reductions in industrial energy intensity aer1995 were around 30 percent or high-income devel-oping economies and or upper middle-income devel-oping economies and around 40 percent or lower
middle-income developing economies. Te respectivecontributions rom technological change were 5 per-cent, 32 percent and 40 percent.
As industrialization progresses and incomes rise,the large gaps in energy intensity between developedand developing countries begin to close. Initial gainscan be substantial as new vintages o energy-ecientcapital goods are adopted, production processes are
modernized and new resource-ecient products areoered. Concerns about energy eciency also beginto kick in, both within industry and among policy-makers. In China, India and the Russian Federation,technological change was responsible or 37–48 per-cent o reductions in energy intensity. A major excep-tion among the upper middle-income countries isBrazil. Investing heavily in petrochemical and steelindustries, it experienced rising energy intensity as thestructural eects cancelled the technological eects.
As countries reach a more mature stage o indus-trial development, industrial energy intensity declines,largely as a result o structural shis rom energy-intensive industries as industries relocate elsewhereor move into higher value services. In high-incomedeveloping economies, the structural eect is alreadymore signicant than the technological eect. And in
Japan, the Republic o Korea and the United States,structural change accounts or more than two-thirdso the decline in industrial energy intensity.
0
70
80
90
100
2008200520001995
P e r c e n t a g e c h a n g e f r o m 1
9 9 5
Industrial energy intensity
Due to technological improvement
Due to structural change
Figure 4
Components o change in global industrialenergy intensity, 1995–2008
Structural change is the main driver o alling global industrial energy
intensity
Source: UNIDO 2010e,; IEA 2010c.
Total change in industrial energy intensity
High-income developing economies
Upper middle-income developing economiesLower middle-income developing economies
Latin America and the Caribbean
Sub-Saharan Africa
Middle East and North Africa
South and Central Asia
East Asia and the Pacific
Developing Europe
Developed economies
Developing economies
Contribution of technological changeContribution of structural change
–60 –50 –40 –30 –20 –10 100–60 –50 –40 –30 –20 –10 100–60 –50 –40 –30 –20 –10 100
Figure 5
Components o change in industrial energy intensity, by region and income group,1995–2008 (percent)
Technological change is the primary driver o lower industrial energy intensity in developing economies
Source: UNIDO 2010e,,g; IEA 2010c.

8/2/2019 Unido Full Report eBook
http://slidepdf.com/reader/full/unido-full-report-ebook 24/259
5
ov e r v i e w
“ The IDR 2011 presents diverse
estimates suggesting that large savings
in energy use continue to be possible
rom industrial energy eciency
Large savings in energy use continue to be
possible rom energy eciency
Can the world satisy the mounting demand or indus-trial goods, particularly rom developing countries,
while keeping energy consumption growth in check?Can developing countries’ legitimate demands or ris-ing living standards and poverty reduction be madecompatible with green industry?
In 2008, per capita industrial energy consump-tion in developing economies was 29 percent o thatin developed economies. As per capita income indeveloping economies converges to that in developedeconomies, the gap in per capita industrial energyconsumption is expected to narrow, with a potentiallyhuge impact on global energy demand. In combina-tion with population growth, this could accelerateresource depletion and environmental degradationand raise energy prices enough to impair economic
growth. Hence, to be sustainable, long-term industri-alization in developing countries needs to be accompa-nied by substantial improvements in industrial energyeciency.
Te IDR 2011 presents diverse estimates suggest-ing that large savings in energy use continue to be
possible rom industrial energy eciency. According to the International Energy Agency’s (IEA) 2010World Energy Outlook, a reduction in global energyintensity o 23 percent over 1980–2008 saved 32 per-
cent in energy consumption (5.8 Gtoe; IEA 2010e).Looking orward, IEA (2010e) estimates severalscenarios:• A current policies scenario, which takes into
account only policies already ormally adopted andimplemented, anticipates a 28 percent reductionin energy intensity by 2035, or savings o around6.5 Gtoe in primary energy consumption (2 Gtoerom industry).
• A new policies scenario, which assumes imple-mentation o announced policy commitments toreduce greenhouse gas emissions and phase out os-sil energy subsidies, oresees a 34 percent reductionin energy intensity, equivalent to an additional 1.3Gtoe in savings over the current policy scenario.
• A 450 scenario, limiting the average global increasein temperature to 2°C and the concentration o greenhouse gases in the atmosphere to around 450
parts per million o carbon dioxide equivalent, would add 3 Gtoe in savings to the current policiesscenario.McKinsey & Company (2007, 2008, 2009) also
estimates that the growth in global energy demand
could be reduced, rom 2.3 percent a year in the mid-2000s to 0.7 percent a year by 2020 (rom 3.4 percentto 1.4 percent in developing countries), by seizing emerging opportunities to reduce energy intensity.
Improving industrial energy eciency can delivermany well documented environmental, economic andsocial benets. Te IDR 2011 substantiates these divi-dends and then looks at how to overcome some o theobstacles to cashing in on them.
The three dividends: environmental,economic and social
Continuing eorts to improve industrial energy e-ciency should contribute to the global eort to haltor reverse climate change while reducing other pol-lutants. At the same time, these eorts should helpbusinesses improve their bottom line and optimizestrained energy systems to better meet social and eco-nomic needs. hese environmental, economic andsocial dividends are a win-win-win combination.
Environmental dividend
Industrial rms transorm raw materials into nalgoods through integrated, sequential and supporting
processes that require energy to uel them. Te energyrequired depends on the nature o the technology andon its eciency in using raw and auxiliary materials.
Improving industrial energy eciency can yield a large environmental dividend Te environmental impact o industrial energy useis direct, a result o energy demands or production
processes, and indirect, a result o energy demandson energy suppliers. Te environmental impact o energy use includes emissions (to air, water and land),

8/2/2019 Unido Full Report eBook
http://slidepdf.com/reader/full/unido-full-report-ebook 25/259
66
ov e r v i e w
“ The protability o energy-eciency
projects is well established in developed
countries. The IDR 2011 demonstrates that
substantial economic dividends can be
earned in developing countries as well
depletion o natural resources and alterations to land-scape and biodiversity. Greenhouse gas emissions, par-ticularly carbon dioxide, dominate the internationaldiscussion because o their impact on climate change.But the combustion o ossil uels or industrial usealso contributes to acid rain and to emissions o par-ticulates, heavy metals and other pollutants. Resourcedepletion is o particular concern. Physical interven-
tions to establish energy generation and distributionacilities also aect land and seascapes and local eco-systems, while nuclear radiation poses signicant risksto human health.
Cutting-edge technologies or industrial energyeciency can reduce the widespread environmentalimpact o industrial energy use. Tese include cross-cutting and industry-wide technologies (such ascogeneration, energy recovery and ecient motor andsteam systems), inter-industry opportunities (such as
reuse o waste heat or by-products by other industries),and process-specic technologies. Improving indus-trial energy eciency can yield a large environmentaldividend or two main reasons:• Industry accounts or about 25 percent o greenhouse
gas emissions om all sources globally (Bernstein etal. 2007). When indirect emissions rom powergeneration are allocated by sector, manuacturing and construction contribute almost 37 percentglobally to carbon dioxide emissions rom uel use
and industrial processes and a startling 47 percentin developing countries (IEA 2010a). Industrycauses urther emissions o greenhouse gases inother sectors through transport o raw materialsand nished manuactured goods and manage-ment o industrial waste. Industry’s direct mitiga-tion potential also includes options to reduce non-energy greenhouse gas emissions and implement
production processes that economize on materialsand water consumption.
• Industry is a major user o natural resources and could contribute substantially to mitigating resource depletion. Savings are possible in the useo ossil uels, a non-renewable resource. Savingsare also possible in the use o raw materials and
water, which are intrinsically linked to manuac-turing. Processing materials and water in manu-acturing requires energy proportional to thethroughput.
Economic dividend
Like any other investment, new technologies, pro-cesses and approaches or industrial energy eciency
need to be protable. While some companies maybe motivated by environmental and social concernsto invest in industrial energy eciency, the primaryrationale must be economic – green investments mustbe protable.
Te protability o industrial energy-eciency projects is well established in developed countriesTe decision to allocate resources to improving indus-trial energy eciency depends on the importance o
energy costs to the rm and the risks and rewardso the investment. For rms in continuous processindustries – such as basic metals, non-metallic miner-als, petroleum rening and chemicals – energy con-stitutes a large share o total costs. Cost savings romimproved energy eciency could be substantial. Butthe wide variations in energy prices and subsidiesacross countries and industries aect potential costsavings.
Investments in energy eciency must compete
with alternative projects or inancial and otherresources. Relevant actors include the energy inten-sity o the rm or industry, the organizational andtechnological complexity o the project and the tech-nological, external and business risks. echnologicalrisks include uncertainties about the technology’s per-ormance and compatibility with existing processes.External risks include uncertainties about energy and
product prices. And business risks include shis inbusiness strategies that may be required to adapt to thenew technologies.
Te protability o energy-eciency projects is well established in developed countries. Te IDR 2011demonstrates that substantial economic dividendscan be earned in developing countries as well, results

8/2/2019 Unido Full Report eBook
http://slidepdf.com/reader/full/unido-full-report-ebook 26/259
7
ov e r v i e w
“ The data suggest that there is a
wide range o protable opportunities
in improving energy eciency and that
rms in developing countries might not be
aware o many o these opportunities
that are in line with the ndings o a recent UnitedNations Environment Programme report (UNEP2011). Many energy-eciency projects perorm sig-niicantly better than the most lucrative inancialinvestments, but their protability varies widely andis sensitive to the time horizon o the investments. O 119 industrial energy-eciency projects that UNIDOassessed in developing countries, the average internal
rate o return was slightly more than 40 percent orthose with an expected lietime o ve years (Figure6). Highly protable projects oen involve smallerinvestments, process reorganization and housekeep-ing measures, and minor changes to inrastructure.Projects that involve larger investments and requirereplacing machinery and equipment (mainly in pro-cess industries) are typically less protable and takelonger to mature. But they can still have considerableabsolute impact on corporate prots.
Does this mean that all industrial energy-eciency projects are protable under normal investment criteria?Clearly not. Generally speaking, the data suggest thatthe more technologically and organizationally complexthe project, the lower the protability. Many energy-ecient technologies are likely to remain unprotableor some time, at least until environmental damages are
properly priced. But the data also suggest that there isa wide range o protable opportunities in improving
energy eciency and that rms in developing countriesmight not be aware o many o these opportunities.
Social dividend
In many developing countries, ineciencies in energyuse by manuacturing rms result in high running costs, wasted energy and materials, underuse o indus-trial capacity and unnecessary investments in standby
equipment. For these countries, improvements inindustrial energy eiciency, promoted and imple-mented through appropriate policy reorms, couldallow a better social use o energy resources. Energycould be redistributed towards the poorer segments o the population. Energy eciency improvements couldalso ree resources or investment in new machineryand urther improvements in the production process– boosting competitiveness, productivity growth,employment and wages. Te productivity improve-
ments in developing countries could be especiallylarge in small and medium-size industrial enterprises,
which tend to be less energy ecient than larger rms.
Industrial energy-eciency improvements canboost productivity and improve health outcomesIndustrial energy-eciency improvements can alsoboost skill levels, raising overall productivity. Manytraining programmes to increase industrial energy
P e r c e n t
By type of investment By functional changeBy sector By investment size
0
25
50
75
100
125
Total(119)
More than$100,000
(44)
$10,000–$100,000
(45)
Less than$10,000
(30)
0
25
50
75
Total(119)
Technologyreengineering
(99)
Processreorganization
(20)
0
25
50
75
100
0
25
50
75
100
125
T o t a l
( 1 1 9 )
P a p e
r ( 1 2 )
F o o d
a n d b e
v e r a g
e s ( 9 )
M e t a l
( 1 4 )
A u t o m
o t i v e ( 4 )
E q u i p m
e n t m
a n u f a
c t u r i n g
( 1 6 )
C e m e
n t / c e r a m
i c s ( 1 5 )
T e x t i l e s
( 2 2 )
O t h e
r s ( 1 3
)
C h e m i c a
l s ( 1 4 )
T o t a l
( 1 1 9 )
D i r e c t e q u
i p m e n t r e
p l a c e m e
n t ( 4 2
)
R e s i d u a
l t e m p
e r a t u r
e r e u
s e ( 2 0
)
W a s t e
r e u s
e ( 1 2 )
F u e l o p t i m
i z a t i o n
( 1 2 )
P i p e s
a n d i n s u l
a t i o n i m p r o
v e m e n t s
( 1 9 )
B e t t e r u s e
o f i n f
r a s t r u
c t u r e
( 1 4 )
Figure 6
Internal rates o return o industrial energy-eciency projects with an expected lietime o ve years
Note: Numbers in parentheses are number o projects.
Source: UNIDO 2010h.

8/2/2019 Unido Full Report eBook
http://slidepdf.com/reader/full/unido-full-report-ebook 27/259
88
ov e r v i e w
“ To overcome maret and behavioural barriers,
policy-maers need to ormulate a coordinated
energy strategy – including ormal and inormal
mechanisms, targets, benchmars and standards
– and adapt policies to national and local contexts
eiciency enhance worker productivity acrossthe board, as workers acquire knowledge appli-cable to multiple ields. Workers can also beneitrom improved health as actory emissions decline.Lowering atmospheric emissions o pollutants such assulphur oxides, nitrogen oxides, smoke and airbornesuspended particulate matter reduces the incidenceo acute and chronic respiratory illnesses and asthma
attacks and increases the lie expectancy o actory workers. And because many industries are clusteredin the same areas, emissions reductions can havehealth benets or local communities – especially
poor communities, since pollution-intensive indus-tries in developing countries tend to be located inlow-wage areas.
Adopting industrial energy-eciency technologiescan improve the indoor environment as well, increas-ing comort and saety (Mills and Roseneld 1996).
Variable speed drives and air blowers and energy-ecient urnaces tend to be quieter than the equip-ment they replace. Exhaust heat recovery systems alsoimprove ventilation. Glazed windows keep occupantso households and actories cooler in hot weather andreduce external noise. Ecient lighting technologiessuch as uorescent lamps and light-emitting diodesincrease the likelihood that warning signs will operate
properly when needed, thus improving saety.
Overcoming obstacles to industrialenergy eciency
Despite the substantial environmental, economicand social benets o investing in industrial energyeciency, the IDR 2011 nds numerous untappedopportunities. A study commissioned or the reportestimates that manuacturing industry spends some$1 trillion a year on energy, 55 percent o it in develop-ing countries (Saygin et al. 2010). It also shows thatuniversal adoption o best practice technologies – theenergy intensity o the top 10 percent o plants in the
world – could yield annual savings in energy costs o $65 billion in developed economies and $165 billionin developing economies, corresponding to 23 percento total energy costs and 2 percent o MVA. Investing
in best available technologies – the most energy-e-cient way o producing goods and services that is com-mercially viable and in use – could save an additional5–15 percent in costs. Te potential energy savingsrom the best available technologies total 32.7 exa-
joules a year (0.8 Gtoe), roughly 30 percent o today’sglobal industrial energy consumption and 6 percent o total energy use worldwide (able 1).
Why is so much improvement potential
ignored?
Why are so many o these potentially protable invest-ment opportunities overlooked? Because marketsdepart rom the textbook ideal, and individual andcorporate behaviour is not always rational. While long known and understood, the obstacles to improving energy eciency are dicult to remove. oo oen,
potential users are not aware o the advantages and
opportunities rom investments in energy-ecienttechnologies. And when they are, they cannot easilyobtain the unding to acquire the new equipment ormake the necessary plant modications. Decision-makers in rms do not always benet directly romtheir decisions, and it is dicult to estimate all thecosts, benets and risks o projects. Furthermore, gov-ernment subsidies that lower energy prices can makethese investments less attractive.
In developing countries, the barriers can be even
greater because o institutional, economic and techni-cal conditions. Where the supply o energy is irregu-lar, eciency typically takes a back seat to availability.Small and medium-size rms ace the biggest obstaclesto achieving energy-eciency improvements.
What policy tools are available?
How can developing countries overcome these mar-ket and behavioural barriers? Policy-makers need toormulate a coordinated energy strategy – including ormal and inormal mechanisms, targets, bench-marks and standards – and adapt policies to nationaland local contexts. Measures should have a time hori-zon o a couple o decades, including realistic interimmedium-term targets (typically 5–10 years), and be

8/2/2019 Unido Full Report eBook
http://slidepdf.com/reader/full/unido-full-report-ebook 28/259
9
ov e r v i e w
“ The potential energy savings rom the best
available technologies total roughly 30 percent
o today’s global industrial energy consumption
and 6 percent o total energy use worldwide
Sector and product
Technical improvementpotential(percent)
Total savings potential(exajoules per year)
Share of energy costsa (percent)
Carbon dioxidesavings potential
(tonnes ofcarbon dioxide
a year)
Share ofcurrent
emissions(percent)
Developedcountries
Developingcountries
Developedcountries
Developingcountries
Developedcountries
Developingcountries
Process sectors
Petroleum refneries 10–15 70 0.7 4.6 50–60
Chemical and petrochemical 0.5 1.8 300 20
Steam cracking(excludingeedstock) 20–25 25–30 0.4 0.3 50–85
Ammonia 11 25 0.1 1.3
Methanol 9 14 0 0.1
Non-errous minerals 0.3 0.7
Aluminaproduction 35 50 0.1 0.5 30 45b 12b
Aluminiumsmelters 5–10 5 0.1 0.2 35–40 35–50
Other aluminium 5–10 5 0.1 0.2 35–40 35–50
Copper smelters 45–50 0 0.1
Zinc 16 46 0 0.1
Iron and steel 10 30 0.7 5.4 10–20 30 350 14
Non-metallic minerals 0.8 2.0
Cement 20 25 0.4 1.8 25–30 50 450 23
Lime 40
Glass 30–35 40 0.4 0.2 7–20
Ceramics 30–50
Combined sectors
Pulp and paper 25 20 1.3 0.3 15–35 80 20
Textile 5–25
Spinning 10 20 0.1 0.3
Weaving 5–10 10–15
Food and beverages 25 40 0.7 1.4 1–10
Other sectors 10–15 25–30 2.5 8.7
Total 15 30–35 7.6 25.1
Excludingeedstock 15–20 30–35 12c
Note: Potential savings based on universal application o best available technologies.
a. Share o total production costs ( total xed costs and variable costs, including depreciation).
b. All aluminium activities.
c. Includes only chemical and petrochemical, aluminium, iron and steel, and pulp and paper.
Source: Saygin et al. 2010; IEA (2009b) or emissions gures.
Table 1
Technical and economic savings potential arising rom industrial energy-eciency improvements

8/2/2019 Unido Full Report eBook
http://slidepdf.com/reader/full/unido-full-report-ebook 29/259
1010
ov e r v i e w
“ key policy approaches include laws
and regulations, negotiated agreements,
inormation-based instruments, new
technology and innovation support, maret-
based instruments and nancial acilities
suciently credible and stable to encourage rmsto invest. Policy-makers need to continually assess
policy eectiveness and benchmark policies againstbest international practice. Tey should also estab-lish local, regional and national bodies or imple-mentation and explore possibilities or internationalcooperation. (See Box 1 or examples o industrialenergy-eciency policies applied in some developing
countries.)
Tere are many tools or overcoming barriersto improving industrial energy eciencyTere are many tools or tackling these barriers andconsiderable international experience with “what
works.” Te rst steps are establishing quantied andachievable eciency targets, benchmarking the per-ormance o dierent sectors and identiying opportu-nities to improve energy eciency. Once realistic and
measurable targets are set, legislation and negotiated
Brazil. TeNationaEecticaEnegyConsevation
Pogamme(Poce)intoducedteIndustiaEnegyEf-
ciencyPogammein2003,stessingawaeness-aising
andcapacity-buiding,impementationofdemonstation
pojects,eguatoy and egisativeactions and estab-
ismentofnancinginesfopojectepication.Poce
Industiaoiginayfocusedoneecticmoto-divensys-
tems,industiapocesses,enegyauditsandindustia
faciities’eecticityosses.Itusedunivesitiestopovide
taininganddeveopanayticatoosfomanufactues
andpovidednancingfoequipmentandinstumenta-
tiontoenabesef–enegyauditingandimpementationby
industy.Poce’sindustiaenegy-efciencypogamme
was executed toug te Nationa Confedeation of
Industy(NCI) tostengten NCIasa eadein indus-
tiaenegyefciency,toceateafocuspointinsteadof
avingspecicageementswitasectosandtobuid
acommonagenda.Itincudedanintenationasuveyof
industiaenegy-efciencypogammes and pojects,
anationasuveyofindustiaenegy-efciencypojectsesutsandmecanisms,andidenticationofbaiesfo
enegy-efciencypojectsandofkeysuccessfactos.
China. In2004,CinaaunceditsTenKeyPojects
initiative, a $1 biion pogamme to povide nancia
incentivesfo aangeof industiaenegy-saving po-
jects.Fundingiseamakedfo5ofte10keypojects
(coaindustiaboiesand kins,wasteeatandpowe
ecovey,petocemicaconsevation,eecticamacin-
ey,enegy-savingsystemsandenegysystemoptimiza-
tion).Appicantsmustundegoacompeensiveenegy
audit,demonstateadequateaccountingandmanage-
mentsystemsandsowtattepojectwisaveateast
7,000tonnesofoiequivaent(toe).Ifindependenteview-
esconcudetatapojectissuccessfu,appicantscan
asoeceivenanciaawadsinkedtoenegysavings.
In2007,Sangaiad243enegyconsevationpojects
witatotainvestmentof$439miionandestimatedsav-
ingsof600,000toe.WeifangCityinSandongPovince
impemented66pojectsin2007,witatotainvestment
of$1.28biion.ByJune2008,26pojectsweecompeted
witanenegy-savingcapacityof121,000toepeyea.
India. TeobjectiveofteBueauofEnegyEfciency
istoeduceteenegyintensityofteIndianeconomy.
Witin teovea famewokof te 2001Enegy Con-
sevationAct,teBueauassistsin deveopingpoicies
andstategiestatempasizesef-eguationandmaket
pincipes.Amongitsinitiativesae teNationaEnegy
ConsevationAwadfoIndusties(14industiasectos
avesetambitioustagetstocutenegyusebyupto
40pecenttougconsevationmeasues),anenegy-
efciencyabeingsceme,amodeenegypefomance
contactfoenegysevicescompaniesandoganization
ofteNationaCeticateExaminationfoEnegyManag-
esandEnegyAuditos.South Arica. TougteEnegyEfciencyAccod
signedwitteMinistyfoEnegyandMineas,tecief
executiveofcesof24majoenegyusesandseven
industyassociationsvountaiycommittedtowokindi-
viduayandcoaboativeytomeetgovenmenttagetsfo
enegysavings,pomotedemandmanagementcontacts
witenegysuppies,deveopcommonepotingequie-
mentsfoenegyusefomasouces,foecastindusty-
specicenegyusebasedonbusiness-as-usuagowt
expectations,deveopageneicenegy-auditingpotoco
tatcanbeadaptedbytesectoandcompanysigna-
toies,andexpoitoppotunitiestodeveopCeanDeve-
opmentMecanismenegy-efciencypojectsundete
KyotoPotoco.
Source: UNIDO 2011.
Box 1
Experiences o industrial energy-eciency policies applied in selected developing countries

8/2/2019 Unido Full Report eBook
http://slidepdf.com/reader/full/unido-full-report-ebook 30/259
11
ov e r v i e w
“ As industrial activity shits towards
developing countries, inormation and
nowledge exchanges and international
coordination are needed to level the playing eld
agreements can ensure their achievement. Some key policy approaches include:• Laws and regulations that remove the least ecient
equipment and practices rom the market and cutgreenhouse gas emissions. Energy eciency lawsgenerally establish government regulating, imple-menting and coordinating agencies – as well as
promotional and support organizations – and
cover energy standards, energy-savings plans,regular reporting o energy consumption, energy-auditing and energy-conservation training, andtechnical assistance. Laws can also stipulate priori-ties and provide tax incentives, subsidies and pen-alties. But legislation can have drawbacks. argetsmay be unrealistic, and laws based on experiencesrom a developed country might not be adequatelyadjusted to developing country contexts, putting the targets at odds with other economic and social
goals. Tere is also a risk o technological “lock-in”at inappropriate levels determined by regulationsrather than by market conditions. Finally, inad-equate unds are typically allocated to implement,monitor and enorce legislation.
• Negotiated agreements or energy eiciency arecontracts between government and industry –typically including specic targets to meet withinset time schedules. Te understandings can engagestakeholders in developing a long-term plan or
greater energy eciency. Some successul agree-ments contain elements that can be appliedin other countries and sectors. Agreements inDenmark, Finland and the Netherlands havebeen models or those in China. Such negotiatedarrangements are seen as viable or meeting energy-saving targets while adhering to market-oriented
policies. But the pressure o continuing economicgrowth on energy demand, the environment andcompetition may orce some countries to develop astronger, more strategic policy on energy eciency.
• Inormation-based instruments – such as inorma-tion and awareness campaigns, labelling schemes,oces to disseminate energy-eciency inorma-tion and public repositories or energy-eciency
and operational data – can raise awareness o thebenets o energy eciency at all levels in industry.By making the lietime costs o available technolo-gies more transparent, these instruments make iteasier or rms to choose energy-ecient options.Te instruments have no direct impact on produc-tion costs or greenhouse gas emissions, but theycan aect stakeholder perceptions and decisions.
Although airly easy to implement, they require public unding and institutions to organize anddevelop campaigns – again, a major obstacle ormany developing countries.
• New technology and innovation support – govern-ment’s role includes unding research and devel-opment (R&D) and supporting private sectorresearch, encouraging adoption and diusion o best available technologies, promoting demonstra-tion projects and engaging international research
partners. Best available technologies and innova-tion are key drivers o industrial energy eciency,but they are beyond the means and capabilities o allbut a ew developing countries and can take a long time to yield returns. Most developing countries
will continue to rely on oreign technologies, buteven this requires building local absorptive capacity.
• Market-based instruments – such as carbon taxes,subsidies, accelerated depreciation o energy-ecient equipment and tradable energy-eciency
certicates – are oen central measures in energy-eciency policy. Tey reinorce prices, create theappropriate market or energy eciency and driveconsumer choices towards the most socially cost-eective solutions. One merit o market-basedincentives is that they are more cost-eective thansome non-market solutions. For instance, a carbontax is in principle the least costly way to providemeaningul incentives or technology innovationand diusion, cut greenhouse gas emissions anddrive energy eciency. Demand management canencourage less energy consumption by end-users(including industry), and energy service compa-nies can promote energy eciency or industriesand rms.

8/2/2019 Unido Full Report eBook
http://slidepdf.com/reader/full/unido-full-report-ebook 31/259
1212
ov e r v i e w
“ Since 1990, industrial energy intensity has
allen globally at an average annual rate o 1.7
percent, just hal the rate needed to eep energy
consumption adequately in chec. UNIDO proposes
an annual target o 3.4 percent through 2030
• Financial acilities – such as loans, guarantees,revolving unds and venture capital unds –increase the availability o capital and lower itscost, thus reducing risk. But there must rst besound public nancial institutions and a reason-ably developed commercial banking sector, likely amajor obstacle in developing countries.
International collective actionthrough inormation exchange and
international coordination
In addition to national policy initiatives, there isa need or international collective action. Manychanges in industrial energy eiciency arise romtechnical and structural shits within and acrossindustries, some being the result o internationalmovements o goods and capital. As industrial activ-ity shis towards developing countries, inormation
and knowledge exchanges and international coor-dination are needed to level the playing eld. Andbecause problems such as climate change are systemicand involve global externalities and public goods,only international action can provide the basis orsolutions.
Five key areas or international collective
action to improve industrial energy eciency
Tere are ve key areas or international collective
action on industrial energy eciency: setting global perormance targets and standards, acilitating tech-nological and structural changes, contributing tointernational technology transer, promoting nan-cial mechanisms to support those transers, and estab-lishing an international monitoring and coordinationunction or industrial energy eciency.
Setting energy-intensity targets and standardsIn 2010, the Advisory Group on Energy and ClimateChange to the UN Secretary-General recommendedthat international cooperation to ensure universalaccess to modern energy services by 2030 give prior-ity to boosting energy eiciency. It recommendedreducing overall global energy intensity by 40 percent
through 2030, or around 2.5 percent a year, but it setno goal or industrial energy intensity.
As a well established approach to achieving per-ormance objectives, setting measurable targets clearlyidenties priorities and direction, allows or compari-son and benchmarking and acts as a ocusing deviceor action. argets are intended to improve peror-mance and to challenge those or whom they are set.
But they have to be realistic to maintain their moti- vating power. And or international collective actionto combat climate change, targets must demand majorimprovements rom current trends. Ambitious targetsare justied not only on environmental grounds butalso on nancial grounds, because industrial energy-eciency projects can yield signicant nancial gains.
Since 1990, industrial energy intensity has allenglobally at an average annual rate o 1.7 percent, just hal the rate needed to keep energy consumption adequately
in check. Against this background, UNIDO proposesan annual target o 3.4 percent through 2030, or a totalo 46 percent. Because reaching a binding internationalagreement on such a target will be dicult, countriesshould make it part o their national development
plans. And countries that have already reached the tar-get should strive to reduce energy intensity even more.
o be eective, targets must be monitored. Indeveloping countries, data are oen limited, and con-sequently a rst step is to collect and harmonize data
on energy intensity. Country perormance can then beassessed, and cross-country comparisons can identiy where progress is and is not taking place. Processes canbe set in motion to inorm countries about their pro-gress and examine reasons or deviations.
Setting international standards can also help inachieving targets. Standards can ocus on harmoniz-ing terminology and calculation methods or energyeciency, managing energy, retrotting and reur-bishing standards and standardizing energy-eciencyactivities or buildings. Tese types o standards helpdene, implement and monitor energy-eciency poli-cies at macro and micro levels. Tey also bring innova-tive energy-ecient technologies to the market aster.And they are objective metrics or regulations and

8/2/2019 Unido Full Report eBook
http://slidepdf.com/reader/full/unido-full-report-ebook 32/259
13
ov e r v i e w
“ Since targets and transers are
unliely to materialize without nancing,
a well developed institutional ramewor
or international nancing o industrial
energy eciency would be necessary
policy incentives to encourage greater use o innova-tive energy-eciency technologies.
Facilitating technological and structural changeFurther reductions in energy use could be achievedand more resource depletion avoided by launching major international eorts aimed at technological andstructural change or industrial energy eciency.
Eorts should ocus on R&D cooperation toshare knowledge, coordinate R&D priorities and poolrisk (Stern 2006). Tere has been some internationalR&D cooperation on adopting low-carbon technolo-gies such as renewable energy sources and on the trans-er and diusion o clean energy technologies. But ewinternational eorts ocus exclusively on R&D orindustrial energy-eciency technologies. An inter-national programme aimed at gradually phasing outenergy-intensive products that have economically
easible alternatives could also be established. Tere isalready signicant international experience in phasing out chlorouorocarbons worldwide and incandescentlight bulbs in the European Union.
International collective action could ensure thatthe global restructuring o industry considers energyeciency. An inormation clearinghouse and inor-mation exchanges can help countries and industriesidentiy best available technologies and compare the
perormance o dierent technologies under dier-
ent conditions beore investing in them. Internationalcoordination could also help deploy industrial energy-eciency technologies and practices, especially in col-laboration with the private sector. Lead multinationalrms in global and local value chains and productionnetworks can speed the uptake o industrial energyeciency in developing countries.
Contributing to international technology transer International energy-eciency technology transer
would involve the movement o skills, knowledge,manuacturing methods, equipment and acilitiesacross countries. A major diculty developing coun-tries ace in adopting industrial energy-eciency tech-nologies is lack o access to international best available
technology, because o lack o inormation or the largescale o the necessary investment. Host country gov-ernments could develop local absorptive capacity,acilitate local spillovers, acquire international licencesand promote learning among industrial rms. Sourcecountry governments could increase technical andnancial assistance and capacity-building to improvedeveloping countries’ ability to acquire and absorb or-
eign technologies. Tey could also disseminate tech-nological knowledge and standards, promote jointresearch and establish grants or studying industrialenergy-eciency experiences in developed and devel-oping countries.
International collective action could provide acoordinating mechanism to overcome problems in pri-
vate technology markets and negotiate rules or inter-national technology transers. hat would requiremaking scientic and technological knowledge widely
available, establishing channels or inormationon successul technology acquisition programmes,harmonizing processes or patents and standardsand enorcing international law. Scaling up multi-lateral agreements such as the Clean DevelopmentMechanism and the Global Environment Fund andestablishing international inormation exchange net-
works could ensure access to basic science and technol-ogy or industrial energy eciency.
Promoting international nancing Since targets and transers are unlikely to material-ize without nancing, a well developed institutionalramework or international nancing o industrialenergy eciency would be necessary. Multilateral andbilateral sources o nance, direct or through imple-menting agencies or local nancial institutions, couldalso provide nancial assistance to industrial energy-eciency projects in developing countries. Eortscould ocus on assessing global inancing require-ments and expanding carbon-trading programmes,again through the Clean Development Mechanismand the Global Environment Fund. Current unds areinadequate or accomplishing the task (Stern 2006).Further measures could establish a global und or

8/2/2019 Unido Full Report eBook
http://slidepdf.com/reader/full/unido-full-report-ebook 33/259
1414
ov e r v i e w
“ Global industrial production is
shiting gradually rom developed
countries to developing countries
industrial energy eciency, introduce internationalguarantees, acilitate lending by private nancial insti-tutions and banks and create international energy ser-
vice companies with a ocus on developing countries.
Establishing an international monitoring and coordinating unction or industrial energy eciencyAchieving international synergies and “internalizing
externalities” are complex tasks that require bringing national and international interests and objectivesinto a common understanding o the public good.
Yet, only a ew ragmented international initiativesare overturning the barriers to industrial energy e-ciency. Te IDR 2011 thus argues or an industrialenergy-eciency unction to help set and monitorinternational targets and standards; address data col-lection and benchmarking; provide technical andeconomic inormation; coordinate regulation, targets,standards, R&D, technology transers and value chain
operations; and devise innovative mechanisms toaddress the challenges o industrial energy-eciencynancing nationally and internationally.
Part B
Trends in manuacturing and manuactured exports,
and benchmaring industrial perormance
Global industrial production is shiting graduallyrom developed countries to developing countries asrms move to benet rom cheaper labour, qualityinrastructure, lower social costs and large markets insome countries. Changes in world MVA reect greaterintegration o national economies through trade liber-alization, wider availability o nancial resources andincreased ows o oreign direct investment.
rade expansion has been central to economicglobalization, and manuactures make up the bulko world trade, consistently accounting or more
than 80 percent o exports since 1990. Whiledeveloped countries have traditionally dominated
world manuactures trade, developing countries’share has risen steadily – as has their exposure totrade shocks (Montalbano 2011). o benchmarknational industrial perormance, UNIDO hasdeveloped the Competitive Industrial Perormance(CIP) index, which assesses industrial perormanceusing indicators o an economy’s ability to produceand export manuactured goods competitively(UNIDO 2003).
Key messages
• Ove te ast 20yeas, manufactuing vauedadded(MVA)gowt as emainedat anaveageannua ateof1.7 pecentindeveoped counties,beowteiannuaGDP gowtate,igigtingawaningeianceon
manufactuingasasouceofgowt.Meanwie,manufactuingasbeenbuoyantindeveopingcounties,wit
MVAexpandingatanaveageannuaateof5.6pecent.
• Deveopingcounties’saeofwodmanufactuestadeasasobeenisingsteadiytoa39pecentsaeinwod
manufactuedexpots,atendtatisikeytocontinueasdeveopingcountiesinceaseteiindustiapoduction
capacityandmoemanufactuingactivitiesaeeocatedtotesecountiestoeducepoductioncosts.
• Tenanciacisisaffectedtemanufactuingindustyindeveopedcountiesmoetanindeveopingcounties.In
2009,wiedeveopedcountiesfacedan8.1pecenteductioninMVA,deveopingcountyMVAgew2.9pecent.
Tecisisabuptyatedtegowtinmanufactuedexpots,wicfe18.7pecentindeveopingcountiesand
23.2pecentindeveopedcountiesin2009.
• UNIDO’s2009CompetitiveIndustiaPefomanceindex,wicassessesindustiapefomanceusingindicatos
ofaneconomy’sabiitytopoduceandexpotmanufactuedgoodscompetitiveyfo118economies,eveaedtatSingapoe,teUnitedStates,Japan,GemanyandCinaweeteoveaeades.

8/2/2019 Unido Full Report eBook
http://slidepdf.com/reader/full/unido-full-report-ebook 34/259
15
ov e r v i e w
“ Developing economies’ share in world
manuactured exports climbed rom 20.4
percent in 1992 to 39.0 percent in 2009
Trends in manuacturing value added
Over 1990–2010, global MVA grew 2.8 percent annu-ally, rom $4,290 billion to $7,390 billion. MVAgrowth averaged just 1.7 percent a year in developedcountries, below their annual GDP growth o 2 per-cent, highlighting a waning reliance on manuacturing as a source o growth and the increased role o services.In developing countries, by contrast, manuactur-
ing was buoyant, registering a remarkable 5.6 percentannual growth rate in MVA over the period, evenhigher than their 4.8 percent annual increase in GDP.
Shares in manuacturing value added
Te 15 largest developing economies accounted or83.0 percent o developing economy MVA in 2010, uprom 73.2 percent in 1990. Te increase is attributablemainly to China, which has emerged as a actory tothe world, more than tripling its share o developing
economy MVA over 1990–2010 to 43.3 percent.Both developed and developing economies
increased their share o medium- and high-technology products over 1990–2009, as the global share o these products rose rom 41.3 percent to 55.8 percent.Developing economies – particularly in East Asiaand the Pacic – have become more integrated intoglobal value chains and production networks, withtheir accelerated technology transer and better mar-ket access. Moving on rom an early ocus on low-end,
low value-added products, economies such as China,Malaysia and aiwan Province o China have diversi-ed their manuacturing production by moving intomore technologically advanced products.
In 1995, the dominant manuacturing sectors worldwide were ood and beverages (11.8 percent),chemicals and chemical products (10 percent) andmachinery and equipment (8.5 percent). By 2000,radio, television and communication equipment hadsurpassed all three, at 13.9 percent, and by 2009 thatshare had soared to 20.7 percent, riding the surgein demand or electronic goods (computers, mobile
phones and other electronic devices).Global manuacturing employment has been
shiing rom developed to developing countries. Tis
trend is expected to intensiy as more manuactur-ing relocates to developing countries. Tere are sharpregional dierences, however, with East Asia and thePacic accounting or more than 60 percent o manu-acturing employment in developing countries.
The 2008–2009 economic and nancial crisis
aected manuacturing more in developed
countries than in developing countriesGlobal MVA grew an average 2.7 percent a year over2000–2004 and 2.4 percent over 2005–2010, peak-ing at $7,350 billion in 2008 (able 2). In 2009, how-ever, the global recession led to a 4.5 percent drop inMVA over 2008, to $7,020 billion. Te crisis aecteddeveloped countries more, with MVA alling 8.1 per-cent rom 2008 to 2009. MVA growth in developing countries slowed to 2.9 percent in 2009, down rom anannual average o 6.8 percent over the previous eight
years.he inancial crisis aected developing regions
dierently through a region-specic mix o channelsincluding trade, remittances, nancial ows, oreigndirect investment and development assistance. MVAgrew 7.7 percent in East Asia and the Pacic and 4.8 per-cent in South and Central Asia but ell in other regions.
Europe was most aected, with MVA dropping 7.1 percent rom 2008 to 2009. Latin America andthe Caribbean’s MVA ell 6 percent. In the Middle
East and North Arica, MVA ell 0.5 percent between2008 and 2009. Despite declining oil revenues, someoil-exporting countries used their substantial oreignexchange reserves or large investment programmes.
Worryingly, sub-Saharan Arica’s industrial base hasbeen eroding, a process likely to be accelerated by thedepletion o much needed resources or investments in
productive capacity and inrastructure.Despite the crisis, MVA in the least developed
countries grew 6.3 percent between 2008 and 2009.Tis growth may conceal long-term adverse eectso the crisis on industrialization because o increasedinternational competitive pressures and the countries’still edgling manuacturing sectors and vulnerabilityto external shocks.

8/2/2019 Unido Full Report eBook
http://slidepdf.com/reader/full/unido-full-report-ebook 35/259
1616
ov e r v i e w
“ In 2009, 54.8 percent o developing countries’
exports were medium- and high-technology
products, up rom 48.6 percent in 1995
Trends in world manuactured exports
World manuactured exports peaked at $12,095 bil-lion in 2008 (able 3), having grown aster than bothMVA and GDP over 2005–2008. rade liberalization,
tumbling transportation costs and globalization o pro-duction contributed to the growth. rade in primary products increased even aster, likely uelled by strong demand rom ast-growing developing countries. Withgrowth rates higher than in developed countries, devel-oping countries’ share in world manuactured exportsclimbed rom 20.4 percent in 1992 to 39.0 percent in2009. Tis trend is likely to continue as developing countries increase their industrial production capac-ity and more manuacturing activities are relocated tothese countries to reduce production costs.
Shares in world exports
While developed economies account or more than60 percent o medium- and high-technology exports,
developing economies have also made some inroads,increasing the technological complexity o their exportsand gaining market share. In 2009, 54.8 percent o developing economies’ exports were medium- and high-
technology products, up rom 48.6 percent in 1995;developing economies accounted or 35 percent o globalexports o medium- and high-technology products.
Although developing economies’ share o world man-uactures trade is rising, some economies contribute morethan others. China, in particular, is changing the land-scape o world manuactures exports. Its exports grew14.6 percent annually over 1992–2001 and a staggering 27.9 percent a year over 2001–2008 aer China joined the
World rade Organization. Ranked 13th in manuac-tured exports in 1992, China steadily improved its posi-tion, becoming the global leader in 2008, with a worldmarket share o 11.3 percent and manuactured exportstotalling $1,370 billion. Te second largest importer inthe world, China’s share o world imports was 8.7 percent
Average annualgrowth rate
(percent)
Region 2005 2006 2007 2008 2009 2010 2001–2005 2006–2010
World 6,570 6,900 7,260 7,350 7,020 7,390 2.7 2.4
Developed economies 4,710 4,880 5,040 5,010 4,600 4,760 1.4 0.2
Developing economies 1,870 2,020 2,220 2,340 2,410 2,630 6.2 7.1
Region
East Asia and the Pacic 966 1,060 1,200 1,290 1,390 1,540 8.6 9.8
Excluding China 320 342 365 370 375 406 4.8 4.9
Europe 148 156 171 176 164 169 5.9 2.8
Excluding Russian Federation 81 91 101 105 101 105 6.3 5.3
Latin America and the Caribbean 373 392 411 423 397 423 1.9 2.5
Excluding Brazil 262 279 293 302 281 294 1.5 2.3
Middle East and North Arica 183 198 210 217 216 229 4.4 4.6
Excluding Turkey 116 125 134 140 143 150 4.4 5.2
South and Central Asia 149 166 179 185 194 210 7.4 7.0
Excluding India 58 64 69 72 75 79 8.6 6.2
Sub-Saharan Arica 47 49 51 53 52 54 3.2 3.0
Excluding South Arica 20 21 22 23 24 26 3.6 4.6
Least developed countries 24 26 28 30 32 34 6.6 7.1
Source: UNIDO 2010g.
Table 2
Manuacturing value added levels and growth, by region, 2005–2010 (US$ billions unless otherwiseindicated)

8/2/2019 Unido Full Report eBook
http://slidepdf.com/reader/full/unido-full-report-ebook 36/259
17
ov e r v i e w
“ World manuactured exports growth o 9.6
percent annually over 2000–2004 continued
into the second hal o the decade, but the
nancial crisis slashed sales abroad, reducing
annual growth over 2005–2009 to 5.2 percent
in 2009, behind the United States and ahead o Germany,helping uel global demand.
rade between developing economies grew 14.9 per-cent annually over 2004–2009, reaching $2,247 billionin 2008 beore dropping to $1,871 billion in 2009. Tistrade accounted or 51.8 percent o developing economies’total trade in 2009, up rom 39.9 percent in 2000. Teshare is likely to continue to rise as production ragmenta-
tion expands, trade continues to develop and large coun-tries such as Brazil, China and India grow and reinorcetheir trade ties with other developing economies.
The economic and nancial crisis halted
the growth in manuactured exports
World manuactured exports growth o 9.6 percentannually over 2000–2004 continued into the secondhal o the decade, but the nancial crisis slashed salesabroad, reducing annual growth over 2005–2009 to
5.2 percent on average (able 3). From 2005 to 2008,growth in manuactured exports in developing econo-mies (17.3 percent) was ar greater than in developedeconomies (11.0 percent). he 2008–2009 crisisabruptly halted the growth in manuactured exports,
which ell 18.7 percent in developing economies and23.2 percent in developed economies in 2009.
In 2009, manuactured exports rom East Asia
and the Pacic dropped 20.4 percent to the EuropeanUnion and 14.5 percent to the United States. Declines
were even sharper or Europe, Latin America and theCaribbean, and the Middle East and North Arica.Sub-Saharan Arica was hit hardest, with a 35.7 percent
plunge in combined exports to the European Unionand the United States. Te decline in manuacturedexport revenues, along with alling commodity prices,has constrained imports o vital production inputs andthe ability to mitigate the eects o the crisis.
Average annualgrowth rate
(percent)
Region 2004 2005 2006 2007 2008 2009 2000–2004 2005–2009
World 7,379 8,252 9,448 10,845 12,095 9,490 9.6 5.2
Developed economies 4,974 5,409 6,066 6,890 7,542 5,792 7.9 3.1
Developing economies 2,405 2,844 3,382 3,955 4,554 3,699 14.0 9.0
Region
East Asia and the Pacic 1,468 1,736 2,081 2,446 2,732 2,308 13.7 9.5
Excluding China 910 1,013 1,159 1,278 1,362 1,153 8.9 4.9
Europe 252 306 366 455 575 402 20.4 9.7
Excluding Russian Federation 183 214 258 326 398 293 20.8 9.9
Latin America and the Caribbean 318 378 419 455 534 415 8.9 5.4
Excluding Brazil 250 292 320 344 401 318 7.8 4.9
Middle East and North Arica 218 240 299 359 432 335 17.0 9.0
Excluding Turkey 160 173 222 261 314 248 16.1 9.1
South and Central Asia 100 129 154 171 197 181 16.6 12.6
Excluding India 35 42 49 46 41 31 16.4 –1.8
Sub-Saharan Arica 48 56 64 69 83 58 14.4 3.8
Excluding South Arica 21 23 29 27 32 22 19.8 0.9
Least developed countries 19 19 22 21 15 – 45.7 –
– is not available; about hal the least developed countries have yet to report 2009 data.
Source: UN 2011.
Table 3
World manuactured export levels and growth, by region, 2004–2009 (US$ billions unless otherwiseindicated)

8/2/2019 Unido Full Report eBook
http://slidepdf.com/reader/full/unido-full-report-ebook 37/259
1818
ov e r v i e w
“ The IDR 2011 adds two new indicators to the
Competitive Industrial Perormance index used to
benchmar an economy’s industrial perormance
Despite a better than average showing or the leastdeveloped countries on manuactured imports rommajor importing countries, the collapse in export rev-enues is likely to hurt these countries in the long term,
perhaps jeopardizing years o development progress,by aecting investments in productive capacity, inra-structure and social programmes.
Benchmaring industrial
perormance: the Competitive
Industrial Perormance index
UNIDO developed the Competitive IndustrialPerormance (CIP) index to benchmark an economy’sindustrial perormance. Te index assesses industrial
perormance using indicators o an economy’s ability
Rank
Economy
CIP index
2005 2009 2005 2009
3 1 Singapore 0.631 0.642
2 2 United States 0.660 0.634
1 3 Japan 0.661 0.628
4 4 Germany 0.598 0.597
6 5 China 0.461 0.557
7 6 Switzerland 0.455 0.513
9 7 Korea, Rep. o 0.438 0.480
5 8 Ireland 0.499 0.479
11 9 Finland 0.411 0.442
8 10 Belgium 0.439 0.442
12 11 Taiwan Province o China 0.401 0.437
10 12 Sweden 0.432 0.430
18 13 Austria 0.368 0.401
21 14 Slovakia 0.322 0.387
13 15 France 0.395 0.384
16 16 Netherlands 0.374 0.378
14 17 Hong Kong SAR China 0.385 0.375
17 18 Italy 0.370 0.361
15 19 United Kingdom 0.383 0.356
24 20 Czech Republic 0.310 0.352
26 21 Slovenia 0.306 0.345
30 22 Israel 0.286 0.332
25 23 Hungary 0.310 0.328
22 24 Luxembourg 0.316 0.323
27 25 Thailand 0.300 0.320
23 26 Denmark 0.311 0.320
20 27 Malaysia 0.330 0.320
19 28 Canada 0.349 0.309
28 29 Spain 0.293 0.291
29 30 Mexico 0.286 0.286
31 31 Malta 0.266 0.284
Rank
Economy
CIP index
2005 2009 2005 2009
34 32 Poland 0.235 0.279
32 33 Philippines 0.262 0.272
38 34 Norway 0.209 0.248
33 35 Turkey 0.237 0.237
35 36 Estonia 0.220 0.234
36 37 Portugal 0.218 0.224
43 38 Iceland 0.187 0.218
47 39 Romania 0.178 0.218
41 40 Lithuania 0.196 0.216
39 41 Costa Rica 0.208 0.215
42 42 India 0.190 0.206
40 43 Indonesia 0.198 0.203
37 44 Brazil 0.212 0.202
51 45 Jordan 0.167 0.193
49 46 Argentina 0.168 0.192
46 47 Australia 0.180 0.188
62 48 Swaziland 0.152 0.186
45 49 South Arica 0.181 0.184
52 50 Greece 0.166 0.182
58 51 Georgia 0.155 0.179
61 52 Latvia 0.154 0.178
44 53 Cyprus 0.182 0.176
53 54 Bulgaria 0.165 0.176
54 55 Tunisia 0.157 0.175
50 56 El Salvador 0.168 0.175
55 57 Barbados 0.156 0.174
72 58 Viet Nam 0.137 0.171
59 59 Morocco 0.155 0.168
64 60 Qatar 0.150 0.168
48 61 New Zealand 0.172 0.161
73 62 Egypt 0.137 0.157
Table 4Ran on the revised Competitive Industrial Perormance index, 2005 and 2009

8/2/2019 Unido Full Report eBook
http://slidepdf.com/reader/full/unido-full-report-ebook 38/259
19
ov e r v i e w
“ The Competitive Industrial
Perormance index now comprises eight
indicators classied in six dimensions
to produce and export manuactured goods competi-tively (UNIDO 2003).
Te IDR 2011 adds two new indicators to the CIPindex – the share o an economy’s MVA in world MVA (tomeasure impact in world manuacturing production) andthe share o an economy’s manuactured exports in worldmanuactured exports (to measure an economy’s impact
in manuactures international trade). Te CIP index nowcomprises eight indicators classied in six dimensions:• Industrial capacity, measured by M VA per capita.• Manuactured export capacity, measured by man-
uactured exports per capita.• Impact on world MVA, measured by an economy’s
share in world MVA.
Rank
Economy
CIP index
2005 2009 2005 2009
67 63 Pakistan 0.147 0.156
88 64 Kuwait 0.107 0.156
60 65 Bahamas 0.154 0.154
57 66 Russian Federation 0.155 0.154
63 67 Tr inidad and Tobago 0.151 0.151
66 68 Macedonia, Former Yugoslav Rep. o 0.147 0.149
75 69 Bangladesh 0.135 0.145
56 70 Mauritius 0.156 0.144
65 71 Lebanon 0.149 0.144
78 72 Macao SAR China 0.130 0.142
76 73 Jamaica 0.132 0.141
69 74 Colombia 0.140 0.135
68 75 Senegal 0.142 0.134
77 76 Albania 0.132 0.133
71 77 Venezuela, BolivarianRep. o 0.138 0.131
79 78 Botswana 0.128 0.131
80 79 Uruguay 0.123 0.129
102 80 Syrian Arab Rep. 0.082 0.128
70 81 Chile 0.139 0.128
89 82 St. Lucia 0.106 0.127
82 83 Iran, Is lamic Rep. o 0.114 0.126
87 84 Moldova, Rep. o 0.111 0.126
98 85 Gambia, The 0.087 0.124
83 86 Palest inian Terri tories 0.114 0.121
90 87 Rwanda 0.106 0.119
93 88 Cambodia 0.102 0.119
92 89 Honduras 0.103 0.118
74 90 Côte d’Ivoire 0.136 0.116
Rank
Economy
CIP index
2005 2009 2005 2009
99 91 Oman 0.087 0.115
86 92 Sri Lanka 0.111 0.115
94 93 Fiji 0.101 0.110
91 94 Nepal 0.105 0.108
85 95 Niger 0.111 0.107
96 96 Peru 0.094 0.106
100 97 Madagascar 0.086 0.101
105 98 Uganda 0.075 0.100
84 99 Zimbabwe 0.114 0.100
97 100 Kenya 0.092 0.094
101 101 Kyrgyzstan 0.085 0.089
103 102 Cameroon 0.080 0.083
81 103 Nigeria 0.114 0.081
108 104 Ecuador 0.069 0.079
104 105 Paraguay 0.075 0.076
107 106 Eritrea 0.071 0.076
111 107 Bolivia,
Plurinational State o 0.063 0.073
112 108 Mongolia 0.055 0.070
109 109 Ghana 0.069 0.069
114 110 Tanzania, United Rep. o 0.046 0.068
118 111 Ethiopia 0.017 0.068
110 112 Malawi 0.064 0.059
113 113 Panama 0.048 0.053
116 114 Yemen 0.036 0.044
115 115 Algeria 0.037 0.042
117 116 Gabon 0.034 0.038
106 117 Azerbaijan 0.072 0.03695 118 Sudan 0.095 0.035
Source: UNIDO.
Table 4 (continued) Ran on the revised Competitive Industrial Perormance index, 2005 and 2009

8/2/2019 Unido Full Report eBook
http://slidepdf.com/reader/full/unido-full-report-ebook 39/259
2020
ov e r v i e w
“ In 2009, East Asia and the Pacic
perormed best on the index, ollowed by
Europe, the Middle East and North Arica,
Latin America and the Caribbean, South and
Central Asia, and sub-Saharan Arica
• Impact on world manuactures trade, measured byan economy’s share in world manuactured exports.
• Industrialization intensity, measured by the aver-age o the share o MVA in GDP and o medium-and high-technology activities in MVA.
• Export quality, measured by the average o theshare o manuactured exports in total exportsand o medium- and high-technology products in
manuactured exports.
Ranking economies using the Competitive
Industrial Perormance index, 2005 and 2009
Te CIP index was computed or 2005 and 2009 or118 economies with sucient recent data. Singapore,
the United States, Japan and Germany were the over-all leaders (able 4). China ranked h in 2009. Atthe bottom o the rankings were Mongolia in EastAsia and the Pacic; Algeria, Azerbaijan and Yemenin the Middle East and North Arica; Panama inLatin America and the Caribbean; and Sudan andGabon in sub-Saharan Arica.
At a regional level, in 2009 East Asia and the
Paciic perormed best on the index, ollowed byEurope, the Middle East and North Arica, LatinAmerica and the Caribbean, South and Central Asia,and sub-Saharan Arica. Te 2005 regional rankings
were similar, except that the Middle East and NorthArica was behind Latin America and the Caribbean.

8/2/2019 Unido Full Report eBook
http://slidepdf.com/reader/full/unido-full-report-ebook 40/259
21
Part AIndustrial
energy
eciency or
sustainable wealth
creation:
capturing
environmental,
economic
and socialdividends

8/2/2019 Unido Full Report eBook
http://slidepdf.com/reader/full/unido-full-report-ebook 41/259

8/2/2019 Unido Full Report eBook
http://slidepdf.com/reader/full/unido-full-report-ebook 42/259
23
his 2011 Industrial Development Report (IDR)addresses industrial energy eiciency in sustain-able development. Around a h o global incomeis generated directly by manuacturing industry,and nearly hal o household consumption relies
on goods rom industrial processes. People’s needsor ood, transportation, communication, housing,health and entertainment are all met by industry.Since the Industrial Revolution, waves o innovationhave shaped how people work and live. During the19th and 20th centuries, developed countries reliedon manuacturing to spur economic growth. oday,developing countries are counting on industrializa-tion to reduce poverty and improve the quality o lieo its growing populations.
But improvements in the standard o living made possible through industrialization have come at anenvironmental cost. Beore the late 1960s, energyconsumption per capita had increased nine-old overthe previous 200 years (Cook 1971, 1972). Since then,energy consumption per capita has increased by a ur-ther 25 percent (IEA 2010c). Materials use per capitamore than doubled over 1900–2005 (Krausmann etal. 2008). And though the ossil uels that have edindustrial development may not be as abundant as
once thought, overall energy consumption is not likelyto all soon. Pollution, resource depletion and the waste o discarded products – each at an all-time high– are major causes o environmental degradation andclimate change. Policy-makers must address them asthey remap development paths.
Industrial development, thereore, must becomesustainable. Continued high resource consumptionand carbon-intensive and polluting technologies
will sap the potential or growth and development.Innovative solutions, national and global, are vitalto making industrial activity more sustainable – toattuning it to environmental and social needs. Tis“green industry” approach can provide the blueprintor sustained industrial development.
Increasing industrial energy eiciency is a keyoundation or green industry worldwide. By building on past successes, countries can develop their indus-tries while tempering the impacts on resource deple-tion and climate change. Te IDR 2011 emphasizes
industrial energy eciency in developing countries, which are emerging as key actors in global industrialdevelopment. Te report takes an in-depth look atlong-term trends in industrial energy intensity as wellas related technical and structural change, examinesthe environmental and economic benets o industrialenergy eciency and identies ways o overcoming obstacles.
Decoupling industrial energy use and
economic growthIndustrial energy consumption, still growing indeveloped countries, is soaring in developing coun-tries. Developed countries remain the largest percapita users o both total energy and industrialenergy, but developing countries are quickly catching up – satisying domestic demands or improved liv-ing standards and import demands rom developedcountries – and becoming large energy consumers.Teir need or energy is expected to continue to rise
or the oreseeable uture.Although energy use has been rising, industrialenergy intensity has been declining in all regions andin countries at all levels o development, implying agradual decoupling o industrial energy use and eco-nomic growth, though with considerable variationacross regions and industries. Part o the reductionin industrial energy intensity results rom govern-ment policy. Another important part is an outcomeo technological progress, industrial restructuring andchanges in uel mix and production-oriented initia-tives. And while globally 1990–2000 saw an absolutedecoupling o manuacturing value added (MVA)growth rom industrial energy intensity (a decrease inindustrial energy intensity greater than the increase
Section 1 Setting the scene
Chapter 1
Trends in industrial energy eciency

8/2/2019 Unido Full Report eBook
http://slidepdf.com/reader/full/unido-full-report-ebook 43/259
24
1
T r E ND S I NI ND U S T r I A l E N
E r GY E F F I C I E N C Y
“ Developed countries are the largest energy
consumers per capita, but developing countries are
driving the global increase in nal energy demand
in MVA;OECD 2002; Spangenberg, Omann andHintenberger 2002), industrial energy consump-tion still grew rapidly aerwards (see Glossary ordenitions o key terms). With industry essential oreconomic growth and developing countries unrelent-ingly pursuing economic development, more eortis needed to understand the sources and drivers o decoupling and the policies that encourage it.
How is global industrial energy
consumed?
A rst step in evaluating global industrial energy inten-sity is to take stock o how energy is consumed. Industryuses ossil uels in manuacturing processes and as a rawmaterial (to generate power). In the 134 economies ana-lysed or this report (see Annex 4), energy used to powermanuacturing processes accounted on average orabout 76 percent o industrial energy consumption over
1990–2008 in both developed and developing econo-mies; eedstock accounted or the rest (Figure 1.1).
otal nal energy consumption grew at an annualaverage o 0.1 percent in the early 1990s, 1.4 percentover the next decade, and an unprecedented 2.7 per-cent thereater, resulting in a 1.7 percent averageannual rise over the period (Figure 1.2).1 Growth inenergy consumption per capita was slower. Energy con-sumption per capita stagnated at around 1.2 tonneso oil equivalent (toe) until 2002 and then increased
gradually to 1.3 toe in 2008, an annual growth rate o 0.4 percent.Industry, by ar the largest energy consumer
among the seven economic sectors studied, accountsor about 31 percent o global nal energy consump-tion in 2008. ransport and residential uses ollow,at about 24 percent each. Within industry, the metalssector uses the most energy, ollowed by chemicals andnon-metallic minerals (Figure 1.3).
Developed economies, with just 15 percent o the world’s population, are the largest energy consumers per capita, accounting or 42 percent o nal energyconsumption in 2008. otal energy consumption romthe early 1990s to 2004 grew 1.3 percent. But demandhas since stabilized – at 3.4 gigatonnes o oil equivalent
(Gtoe) and 3.5 toe per capita. ransport consumes themost energy (32 percent), ollowed by industry (24 per-cent) and residential uses (19 percent). Te three highestconsuming industrial sectors are metals; chemicals andchemical products; and paper, pulp and printing. Tesegures exclude the energy used to manuacture and trans-
port goods to importing countries. Developed economiesare net importers o manuactured goods – and o theenergy and carbon emissions embodied in those goods –and developing economies are net exporters. Tis importdependence o developed economies has grown over timeand is proportionately greater or energy-intensive goods.
Developing economies are driving the globalincrease in nal energy demand, with annual averagegrowth o 0.7 percent in the early 1990s, 1.2 percentover 1994–2001, and a rapidly accelerating 4.5 per-cent since 2002 (see Figure 1.2). In 2008, industryaccounted or the largest share o nal energy con-sumption (36 percent), ollowed by residential (28
percent) and transport (18 percent). Te three topconsuming industrial sectors are metals, chemicals
Developing countriesDeveloped countriesWorld
G i g a t o n n e s
o f o i l e q u i v a l e n t
Energy used as a
raw material (feedstock)
Energy used to power
manufacturing processes
77%
23%
76%
24%
76%
24%
0
1
2
3
4
Figure 1.1
Split in industrial energy consumptionbetween manuacturing processes andeedstoc, 1990–2008
Energy’s largest role in industry is powering manuacturing processes
Note: Data are or 134 economies; see Annex 4.
Source: IEA 2010c.

8/2/2019 Unido Full Report eBook
http://slidepdf.com/reader/full/unido-full-report-ebook 44/259
25
1
T r E ND S I NI ND U S T r I A l E N
E r GY E F F I C I E N C Y
“ A rst step in evaluating global
industrial energy intensity is to tae
stoc o how energy is consumed
20082005200019951990 20082005200019951990
20082005200019951990
20082005200019951990
20082005200019951990 20082005200019951990
G i g a t o n n e s
o f o i l e q u i v a l e n t
World
T o n n e s
o f o i l e q u i v a l e n t p e r c a p i t a
World
Developed economies Developing economies
Developed economies Developing economies
Mining and construction Agriculture, forestry and fishing Commercial and public services Energy Residential Transport Industry
0
2
4
6
8
10
0
1
2
3
4
0
1
2
3
4
5
0.0
0.2
0.4
0.6
0.8
1.0
0
1
2
3
4
0.0
0.3
0.6
0.9
1.2
1.5
Figure 1.2
Growth in energy consumption and energy consumption per capita, by economic sector, 1990–2008
Industry is contributing to the rise in global energy consumption
Source: IEA 2010c.
20082005200019951990
G i g a t o n n e s o
f o i l e q u i v a l e n t
World
G i g a t o n n e s
o f o i l e q u i v a l e n t
Developed economies Developing economies
Non-specified (industry)
Wood and wood products
Transport equipment
Textile and leather
Machinery
Food and tobacco
Paper, pulp and printing
Non-metallic minerals
Petrochemicals
Chemicals and chemical products
Metals
20082005200019951990 200820052000199519900.0
0.5
1.0
1.5
2.0
0.0
0.2
0.4
0.6
0.8
1.0
0.0
0.5
1.0
1.5
2.0
2.5
3.0
Figure 1.3
Industrial energy consumption, by sector, 1990–2008
Within industry, metals, chemicals and non-metallic minerals consume the most energy
Source: IEA 2010c.

8/2/2019 Unido Full Report eBook
http://slidepdf.com/reader/full/unido-full-report-ebook 45/259
26
1
T r E ND S I NI ND U S T r I A l E N
E r GY E F F I C I E N C Y
“ A striing trend is the annual 2.3
percent growth in developing economies’
total energy consumption over 1990–2008,
more than 2.5 times the 0.9 percent
annual growth in developed economies
and chemical products, and non-metallic minerals.Average annual energy consumption per capita ell 0.5
percent over 1990–2001 and then increased rapidly, asdid industrial production relative to total output. In2008, average annual energy consumption per capitastood at 0.9 toe – an annual increase o 3.2 percentsince 2001. Even so – and despite ignoring the energyembodied in exported goods – this is less than a quar-
ter o the average in developed economies.A striking trend is the annual 2.3 percent growth
in developing economies’ total energy consumptionover 1990–2008, more than 2.5 times the 0.9 percentannual growth in developed economies. And withemerging market economies poised to grow asterthan the more advanced economies, energy demandsin developing economies are poised to rise even more.A key driver o these dierences in growth o energyconsumption is the disparity between developing
economies’ 0.6 percent annual rise in industry’s shareo energy consumption and developed economies’0.7 percent annual decline. Driving the increase indeveloping economies are population growth and ashi towards more energy-intensive activities – suchas paper and plastics – and construction activities orinrastructure and housing. In addition, productioncapacity in many sectors is shiing rom developed todeveloping economies, which are producing goods orexport to developed economies.
Over 1990–2008, the nal energy consumptiono industry rose 11 percent (0.6 percent a year) indeveloping economies while remaining airly stable indeveloped economies. As economies grow, the alloca-tion o energy resources shis – usually towards ser-
vices and away rom industry and energy (Enevoldsen,Ryelund and Andersen 2007). During periods o rapideconomic expansion, additions to capital stock are
high, resulting in a newer and more energy-ecientindustrial inrastructure, a trend that can be strength-ened with eective policy support.
What has happened to industrial
energy intensity globally and
regionally?
As energy consumption rises, what happens to energyintensity?2 Tis section looks at changes in industrialenergy intensity globally and regionally; the ollowing
section looks at sectoral patterns.
Global trends
Global industrial energy consumption ell 0.3 per-cent a year over 1990–1995, recovered over 1995–2002, and has been rising since at 3.8 percent a year(Figure 1.4). MVA had a sustained increase over the
period, averaging 3.1 percent annual growth.3 Whileaverage industrial energy intensity ell 26 percentover 1990–2008 – an average decline o 1.7 percent
annually – two distinct phases are evident: a markeddecline in 1990–2001, averaging 2.6 percent a year,and a levelling o at a 0.2 percent annual declinesince.
Tus, MVA was decoupled rom industrial energyuse during 1990–2001. Tat means that industry pro-duced considerably more value added rom a relativelysmall increase in energy consumption. Since 2001,global industrial energy intensity has stabilized ataround 0.35 toe per $1,000 o MVA.
Trends by income group
Have all economies and regions, whatever their levelso development, seen their energy intensity all? Te
pattern since 2000 is that industrial energy intensity
Energy consumption trends
• Fom 1990to 2008,especiay sincete eay
2000s, enegy consumption as isen in bot
deveopedanddeveopingeconomies.Pecapita,
teoveaconsumptioninceaseasbeeness
stiking,eveingoffindeveopedeconomiesand
isingsigtyindeveopingeconomies.
• Deveopedeconomiesavetaditionaybeente
agestenegyconsumes,butdeveopingecon-
omies’saenowsupasses tat ofdeveoped
economies,andemegingmaketeconomiesae
gowingfastetanmoeadvancedeconomies.
• Industyconsumesaigepopotionofenegy
peunitofoutputindeveopingeconomiestanin
deveopedeconomies.

8/2/2019 Unido Full Report eBook
http://slidepdf.com/reader/full/unido-full-report-ebook 46/259
27
1
T r E ND S I NI ND U S T r I A l E N
E r GY E F F I C I E N C Y
“ Developed economies have the lowest level
o industrial energy intensity, ollowed by high-
income and upper middle-income developing
economies and – arther behind – by lower middle-
income and low-income developing economies
wanes as development waxes (Figure 1.5). On aver-age over 1990–2008, developed economies have thelowest level o industrial energy intensity (0.2 toe
per $1,000 MVA), ollowed closely by high-income(0.4) and upper middle-income developing economies(0.8) and – arther behind – by lower middle-income
(1.2) and low-income developing economies (2.2). Parto the decline in energy intensity with rising devel-opment may be due to a shi rom lower to higherquality energy sources, which has not been correctedor. UNIDO (1991) reported the same trends 20
years ago, indicating a long-term correlation betweenindustrialization/income level and industrial energyintensity. While prior studies have ound that the rela-tionship between income and energy use is linear, thisstudy suggests that it is closer to a U-shaped Kuznetscurve (Cantore 2010).
Although average industrial energy intensity indeveloping economies is ve times that in developedeconomies, it ell 46 percent over 1990–2008 indeveloping economies (an average annual decline o
3.4 percent), compared with 31 percent in developedeconomies (2.0 percent annually). Among devel-oping economies, lower and upper middle-incomeeconomies reduced their energy intensity the most (58
percent and 46 percent). Te biggest overall declinescame during the 1990s, except in high-income devel-
oping economies. Te oil price shock o 1990 and thesubsequent recession likely played a role. Despite theoverall decline, individual economies show consider-able diversity.
Does the stage o industrialization shape energyuse? Our study suggests the ollowing patterns:• otal industrial energy intensity tends to be high
at early and intermediate stages o industrializa-tion, when energy-intensive materials process-ing industries dominate, technical energy ei-ciency is poor and low-quality uels (such as coal)
predominate.• Industrial energy intensity decreases at later stages
o industrialization, as the structure o indus-try shits rom energy-intensive raw material
0
50
100
150
200
20082005200019951990
I n d e x ( 1 9 9 0
= 1
0 0 )
Manufacturing value added, 2008
US$7.35 trillion
Industrial energy intensity, 20080.35 tonnes of oil equivalent per US$1,000
Industrial energyconsumption, 2008
2.54 gigatonnes of oil equivalent
Figure 1.4
Global trends in manuacturing value added,industrial energy consumption and industrialenergy intensity, 1990–2008
Industrial energy intensity ell markedly in 1990–2000 but stabilized
more recently
Note: Industrial energy intensity in 2000 US dollars.
Source: UNIDO 2 010e,,g; IEA 2010c.
0
1
2
3
20082005200019951990
T o n n e s o f o i l e q u i v a l e n t p e r $ 1 , 0
0 0 m a n u
f a c t u r i n g v a l u e a d d e d
Low-income developing economies
Developed economies
Upper middle-incomedeveloping economies
Developingeconomies
High-income developing economies
Lower middle-income developing economies
Figure 1.5
Industrial energy intensity, by income group,1990–2008
The higher the development level, the lower the industrial energy
intensity
Note: See Annex 4 or economies in e ach group. Industrial energy intensity in 2000 US dollars.
Source: UNIDO 2010e,,g; IEA 2010c.

8/2/2019 Unido Full Report eBook
http://slidepdf.com/reader/full/unido-full-report-ebook 47/259
28
1
T r E ND S I NI ND U S T r I A l E N
E r GY E F F I C I E N C Y
“ Regional energy intensity trends have
been aected by international shits in the
location o manuacturing activity rom
developed to developing economies
processing to less energy-intensive processes – rom“brown” process industries to greener industries –and technical energy eciency and the quality o the uel mix improve.
• Industrial energy intensity declines substantiallyat the most advanced stages o industrialization,
with urther technological improvements, struc-tural change, production shis towards more skill-
intensive industries and increasing use o high-quality uels (gas and electricity).
Developing economy regional trends
here is considerable regional variation, however.For example, industry uses on average 4.7 timesmore energy to produce a unit o MVA in develop-ing Europe than in Latin America and the Caribbean(Figure 1.6). One reason is the vintage o industrialacilities. Tere have been continual improvements in
nearly every aspect o industrial activities, so countries with newer industries tend to have newer, more e-cient acilities. Many non–OECD European countrieshave inherited inecient, coal-based, energy-intensiveindustries that operate at a small raction o theiroutput capacity. Te most energy-intensive industrialregion has been developing Europe (averaging 2.2 toe
per $1,000 MVA over 1990–2008), ollowed by sub-Saharan Arica (1.8) and South and Central Asia (1.6).Industry in East Asia and the Pacic (0.9), the Middle
East and North Arica (0.8) and Latin America andthe Caribbean (0.5) has been considerably less energyintensive.
Industrial energy intensity ell substantially over1990–2008 in developing Europe, East Asia andthe Pacic, and South and Central Asia. Developing Europe registered a 56 percent decline – thanks largelyto remarkable improvements across the board. Tatregion was the only one to experience a drop in indus-trial energy consumption (51 percent) and an increasein MVA (11 percent). In East Asia and the Pacic,industrial energy intensity dropped 46 percent, as a160 percent rise in industrial energy consumptionaccompanied a 381 percent jump in MVA. Industrialenergy intensity ell slightly in Indonesia and Malaysia
(less than 5 percent), while rising 273 percent in Hong Kong SAR China. And though South and CentralAsia registered a 51 percent increase in industrialenergy consumption, MVA grew rapidly (173 percent),reducing industrial energy intensity 45 percent. Indiaand Kazakhstan contributed most to this success.
Reductions in industrial energy intensity werear lower (7–33 percent) in Latin America and theCaribbean, sub-Saharan Arica, and the MiddleEast and North Arica. In Latin America and theCaribbean and sub-Saharan Arica, MVA and indus-trial energy consumption ollowed the same growth
path. In the Middle East and North Arica, however,industrial energy consumption and MVA were decou-
pled in the early 1990s.Regional energy intensity trends have been
aected by international shits in the location o industrial activity. For example, the United Stateshas seen much o its labour-intensive industrial sec-tors move to the Republic o Korea, aiwan Provinceo China, Mexico and China. Increasingly, it has
0.0
0.7
1.4
2.1
2.8
3.5
20082005200019951990
T o n n e s o f o i l e q u i v a l e n t p e r $ 1 , 0
0 0 m a n
u f a c t u r i n g v a l u e a d d e d
Developing Europe
South and Central Asia
Latin America and the Caribbean
Middle East and North Africa
East Asia and the Pacific
Sub-Saharan Africa
Figure 1.6
Industrial energy intensity in developingeconomies, by region, 1990–2008
There have been large reductions in industrial energy intensity in
some regions
Note: See Annex 4 or economies in each group. Manuacturing value added is in 2000 US dollars.
Source: UNIDO 2010e,,g; IEA 2010c.

8/2/2019 Unido Full Report eBook
http://slidepdf.com/reader/full/unido-full-report-ebook 48/259
29
1
T r E ND S I NI ND U S T r I A l E N
E r GY E F F I C I E N C Y
“ Average values or industry as a
whole mas wide variations in energy
intensity among industrial sectors
been importing petroleum and petrochemicals romSaudi Arabia, Venezuela and Nigeria and cars romGermany, the Republic o Korea and Japan. Globally,energy-intensive aluminium smelting has moved tocountries such as Brazil, Iceland and Mozambique,
with their cheap hydroelectric power, or to the MiddleEast, with its cheap natural gas. Aluminium output inthe United States has declined more than 80 percentsince 1990.
While contributing to the decline in indus-
trial energy intensity in the United States and otheradvanced industrial economies, these locational ac-tors have slowed the rate o decline in exporting coun-tries. Exporters, most o them developing countries,are engaging in energy-intensive industrial activities to
produce commodities that are consumed in developedcountries. Tese issues are explored in Chapter 2.
How has sectoral industrial energy
intensity changed?
Average values or industry as a whole mask wide vari-ations in energy intensity among industrial sectors.O the 10 (or 11, i non-specied is included) sec-tors examined, 3 dominate global industrial energyconsumption.4
Energy intensity diers by industrial sector
Industrial sectors generally all into one o three groups.
Most energy intensive. Process sectors such as metals,non-metallic minerals, and chemicals and chemical
products are the most industrial energy intensiveglobally and in all income groups considered(Figure 1.7). Te global mean or 1995–2008 is 1.6toe per $1,000 MVA or metals, 0.9 or non-metallic
minerals and 0.6 or chemicals and chemical products,each above the global industry average o 0.35. Tesesectors also have the highest proportion o energy costsin total input costs (see Chapter 4). echnologically,these energy-intensive industries:• Use coal, natural gas, metals and non-metallic
minerals or oil as raw material or eedstock.• Follow a sequence o linked transormation stages,
with several supporting processes operating on site.• Require containers, pipes, vessels, complex purpose-
designed and -built plants, and advanced controltechnologies.
• Employ high pressures, temperature and chemicalreactions to transorm throughput.
• Deliver output in bulk, generally in units o weightor volume.wo o these industrial energy-intensive sectors
process extracted natural resources. Te energy spent
mining and extracting the raw materials has not beenincluded in this assessment, implying that the energyconsumed in producing reined primary materialsrom extracted natural resource is high compared tothe value added they produce. With natural resourcesdwindling, deposits will be harder to extract and theirquality poorer, requiring increased processing andthus more energy.
Least energy intensive. Discrete product sectors such
as machinery and transport equipment are the leastenergy intensive, with global averages o 0.06 and0.07 toe per $1,000 MVA (see Figure 1.7).5 Energyconstitutes a small share o input costs in these sectors.echnologically, discrete product manuacturing involves a variety o production processes because o the dierentiated nature o the products and theirconstituent components, each also requiring its own
production process. he equipment used dependson production volume and technical complexity;large-volume and low- to moderate-complexityoutput is largely automated. Tere are also sequentialtransormation stages – numerous in more complex
products – oen linked through an assembly line andrequiring many parts. Troughput is transormed by
Industrial energy-efciency trends
• Gobaindustiaenegyintensityasbeendop-
pingsince1990butasstabiizedinecentyeas.
• Temoeadvancedteeveofdeveopment,te
oweteenegyintensity.
• Some convegence acos s egions as been
occuingoveteastdecade.

8/2/2019 Unido Full Report eBook
http://slidepdf.com/reader/full/unido-full-report-ebook 49/259
30
1
T r E ND S I NI ND U S T r I A l E N
E r GY E F F I C I E N C Y
“ Over the past 20 years, both developed and
developing economies have increased industrial
energy eciency in response to rising and
volatile energy prices, energy supply insecurities
and environmental and social concerns
4
2
3
1
0
Wood and wood productsPaper, pulp and printing
Chemicals and chemical productsNon-metallic minerals
Average, 1995–2008
1995
2008
World
High-income developing economiesHigh-income developing economies
High-income developing economiesHigh-income developing economies
Developedeconomies
Developedeconomies
Developingeconomies
Developingeconomies
Developingeconomies
Developingeconomies
Lowermiddle-income
developingeconomies
Lower
middle-incomedevelopingeconomies
Lowermiddle-income
developingeconomies
Lower
middle-incomedevelopingeconomies
Uppermiddle-income
developingeconomies
Uppermiddle-income
developingeconomies
Uppermiddle-income
developingeconomies
Uppermiddle-income
developingeconomies
Developedeconomies
Developedeconomies
World
WorldWorld
Metals
High-income developing economies
Developingeconomies
Developedeconomies
Lower
middle-incomedevelopingeconomies
Uppermiddle-income
developingeconomies
World
3
2
1
0
1.5
1.0
0.50.0
Petrochemicals
High-income developing economies
Developingeconomies
Developedeconomies
Lowermiddle-income
developingeconomies
Uppermiddle-income
developingeconomies
World
0.8
0.4
0.6
0.20.0
2.5
2.01.5
1.0
0.5
0.0
5
3
4
1
2
0
Food and tobacco
Transport equipmentMachinery
World
High-income developing economies
High-income developing economies High-income developing economies
Developedeconomies
Developingeconomies
Developingeconomies
Developedeconomies
Lowermiddle-income
developingeconomies
Lowermiddle-income
developingeconomies
Lowermiddle-income
developingeconomies
Uppermiddle-income
developing
economies
Uppermiddle-income
developing
economies
Uppermiddle-income
developingeconomies
World World
Developedeconomies
Developingeconomies
0.6
0.4
0.2
0.0
Textile and leather
World
High-income developing economies
Developingeconomies
Developedeconomies
Lowermiddle-income
developingeconomies
Uppermiddle-income
developingeconomies
0.6
0.4
0.2
0.0
0.8
0.6
0.4
0.2
0.0
0.4
0.3
0.1
0.2
0.0
Figure 1.7
Energy intensity, by industrial sector and income group, 1995–2008 (tonnes o oil equivalent per$1,000 manuacturing value added, in 2000 prices)
Process industries have the highest energy intensity and discrete product sectors the lowest
Source: UNIDO 2010e,,g; IEA 2010c.

8/2/2019 Unido Full Report eBook
http://slidepdf.com/reader/full/unido-full-report-ebook 50/259
31
1
T r E ND S I NI ND U S T r I A l E N
E r GY E F F I C I E N C Y
temperature, orce or chemical reaction; output iscounted in units rather than in weight or volume.
Intermediate energy intensity. Somewhere betweenthe high and low ends are the intermediate energy-intensive sectors o petrochemicals (0.3 toe per $1,000MVA), paper, pulp and printing (0.3), wood and wood
products (0.3), ood and tobacco (0.2) and textileand leather (0.2; see Figure 1.7). echnologicallyand economically, they combine characteristics o
process sectors (carbonated drinks and beer or paper pulp) and discrete product sectors (clothing, ootwear
and urniture). Some plants share continuous anddiscrete processes, some plants produce goods in bulk,
while others convert or “package” bulk inputs intoindividual products.
Energy intensity o industrial sectors diers
by income group
Te energy intensity o industrial sectors varies consid-erably within economies (see Figure 1.7).6 Tus, whilethe same sectors are the most energy intensive in both
developed and developing economies (metals, non-metallic minerals, and chemicals and chemical prod-ucts), the energy to produce a unit o MVA is generallyhigher in developing economies, which as a group useabout three times as much energy to produce a unit o MVA as developed economies. For developed econo-mies, metals was the most energy-intensive industrialsector (1.0 toe per $1,000 MVA), ollowed by non-metallic minerals (0.6) and chemicals and chemical
products (0.4). For developing economies, industrialenergy intensity or the three sectors was much higher(3.1, 2.1 and 1.2).
In high-income developing economies, non-metallic minerals was the most energy-intensive sec-tor (1.1 toe per $1,000 MVA), with industrial energy
intensity down just 6 percent since 1995. In upperand lower middle-income developing economies, met-als was the most energy-intensive sector (3.2 toe per$1,000), but with a 41 percent decline in energy inten-sity since 1995.
* * *
Over the past 20 years, both developed and developing economies have increased industrial energy eciencyin response to rising and volatile energy prices, energysupply insecurities, and environmental and socialconcerns. But are these the only reasons? Is it possibleor an economy to consume less energy with no lossin output? What accounts or the changes in energyintensity? Tis report now turns to the key drivers orimproving industrial energy eciency, ocusing ondeveloping countries, which have already entered or
are about to enter the energy-intensive stage o indus-trial development.
Notes
1. otal nal energy consumption is equal to thesum o the consumption in the end-use sectors.Final consumption reects mainly deliveries toconsumers (IEA 2010c).
2. Tis section examines trends in energy intensityusing International Energy Agency (IEA) esti-
mates. For details on the estimates, see Annexes 1,3 and 5. Since the estimates relate to total energyconsumption and do not distinguish among energy sources, they cannot identiy changes inenergy intensity that result rom shis rom lowerto higher quality energy sources (or example,rom coal to gas). Data on MVA in real terms arederived rom the Index o Industrial Productionrom UNIDO’s International Yearbook o
Industrial Statistics (UNIDO 2010c). All valueadded gures and energy intensity gures are in2000 US dollars.
3. See Chapter 8 or trends in MVA.4. See Annex 3 or details o the manuacturing
sectors.
“ While the same sectors are the most
energy intensive in both developed and
developing economies, developing economies
use about three times more energy per
unit o manuacturing value added
Energy intensity trends among industrial
sectors
• Attegobaeve,metas,non-metaicmineas,
andcemicasandcemicapoductsavete
igestenegyintensity.

8/2/2019 Unido Full Report eBook
http://slidepdf.com/reader/full/unido-full-report-ebook 51/259
32
1
T r E ND S I NI ND U S T r I A l E N
E r GY E F F I C I E N C Y
5. Data or all 10 sectors examined were not availa-ble or all 100 economies. For example, no energydata were available or the chemicals sector ormany Middle Eastern countries, and no value-added data were available or the petrochemical
sector in Israel, even though those countriesengaged in those activities.
6. Data availability was poor at a sectoral level orlow-income developing countries, so this group isnot included in the analysis.

8/2/2019 Unido Full Report eBook
http://slidepdf.com/reader/full/unido-full-report-ebook 52/259
33
Chapter 1 showed that energy intensity (energy use perunit o manuacturing value added [MVA]) has beenalling globally and in most countries. Average indus-trial energy intensity ell 26 percent over 1990–2008– an average annual decline o 1.7 percent. Despite
the improvement, rapidly rising industrial energy con-sumption in developing countries continues to pushglobal energy consumption higher.
Can the world satisy rising demand or industrialgoods, particularly rom developing countries, whilekeeping industrial energy consumption growth incheck? Can the demand or better standards o living and reduced poverty in developing countries be madecompatible with sustainable industrialization? In 2008,
per capita industrial energy consumption in developing
countries was only 24 percent o that in developed coun-tries. But as per capita incomes converge, so too will percapita industrial energy consumption, potentially run-ning up global energy demand and more than doubling it in industrial energy alone. Population growth would
push energy demand even higher, so that the burden onthe environment and the pressures on energy prices andsupplies could impede urther economic growth.
o address these challenges, we need to under-stand what drives changes in industrial energy inten-
sity. Tis chapter looks at the two main drivers: tech-nological change and structural change.1 It shows thatnew and more energy-ecient technology has hada large role in lowering energy intensity globally andin many countries – especially developing countries.Lower energy intensity has resulted largely rom incre-mental improvements in a range o technologies ratherthan rom a single major breakthrough:• Applying the ndings o basic and applied research.• Optimizing and integrating production systems.• Improving air and heating systems.• Introducing better motors, pumps and com pressors.• Applying good housekeeping principles.
Changes in the structure o industry have beeneven more instrumental in reducing industrial energy
intensity, particularly in developed countries and insome upper middle- and lower middle-income devel-oping countries. Te growing demands rom develop-ing countries or a higher standard o living, the inter-national relocation o productive activities to lower
cost sites and the structural change in many o thesecountries towards energy-intensive industries seem tobe exerting counter-pressures to the orces advancing the adoption o improved technologies, thus slow-ing the pace o improvements in industrial energyintensity.
Tis chapter examines:• Te process o innovation and technological change
in industrial energy eciency.• Te potential or improved energy eciency.
• rends in the composition o global MVA that would explain the observed structural eects.
What drives changes in industrial
energy intensity?
Industrial energy intensity can be reduced throughtechnological progress and system changes thatimprove technical energy eciency – changes thatincrease output using the same amount o energy orthat deliver the same output using less energy. Tese
changes include replacing old technologies, adopting energy-saving technologies (preerably best availabletechnologies), improving processes and optimizing systems, and employing energy management practices.Tey also include using more high-quality energy, suchas gas and electricity; innovating product designs; andchanging the output mix. Tese improvements, espe-cially those related to new technologies and processes,
vary in complexity – rom simple add-ons to complexsystem change – and in the rewards, as discussed laterin this report.
I data on abrication processes were available atthe lowest level o aggregation, the measure o techno-logical change would be actual physical eciency andthe rest would be structural change ( Jenne and Cattell
Chapter 2
Technological and
structural change orindustrial energy eciency

8/2/2019 Unido Full Report eBook
http://slidepdf.com/reader/full/unido-full-report-ebook 53/259
34
T E C hN Ol O GI C A l A ND S T r
U C T Ur A l C hA N GE F Or I ND U S T r I A l E NE r GY E F F I C I E N
C Y
2
“ New and more energy-ecient technology
has had a large role in lowering industrial
energy intensity globally and in many
countries, but changes in the structure o
industry have been even more instrumental
1983). But this level o disaggregation is not availableor all sectors, so physical eciency is estimated bysubtracting structural eects (discussed below) romthe change in energy intensity. Over time, technologi-cal energy eciency can be a useul indicator o tech-nological progress (Ayres 1998).
Industrial energy intensity can also be aectedby structural changes in an economy – long-term
changes in the composition o economic aggregates,including modications in output shares across sec-tors (Chenery, Robinson and Syrquin 1986; Syrquin2007). Structural change can have a strong eecton economic growth. Shiing rom low-productiv-ity, labour-intensive sectors to more value added–,capital-, skill-, and technology-intensive sectors cangenerate the nancial and knowledge resources toexpand economic activity even aster. A shi towardssectors with lower energy use per unit o MVA –
brought about by changes in product demand, prod-uct specialization or relocation o production – canreduce industrial energy intensity. Shiting rom“brown sectors” (with higher energy-intensive prod-ucts and processes) to “green sectors” (with lower
energy-intensive products and processes) can alsohave environmental benets.
What role have structural and
technological actors had in lowering
industrial energy intensity?
How much o the changes in energy intensity havecome rom technological change and how much
rom structural change? We explore this question bydecomposing energy intensity changes into its twocomponents, ocusing on 62 o the 134 economies(see Annex 4) studied in Chapter 1 because o stricterdata requirements. (See Annex 2 or the methodol-ogy and Box 2.1 on decomposition analysis.) But
while this smaller sample is more homogeneous (thereare no low-income developing countries), it mightnot be ully representative o all developing coun-tries. Nonetheless, to our knowledge, this is the rst
attempt to apply a decomposition technique to datacovering such a wide selection o developing countries.
rends in total industrial energy intensity reectchanges in technology, energy management, and out-
put volume and composition. otal industrial energy
Decompositionanaysisasbeenwideyappiedtois-
toicatendsinenegyandmateiaconsumption.Tee
avebeen numeousappications to manufactuing in
OganisationfoEconomicCo-opeationandDeveop-ment(OECD)counties;mostEastenEuopeancounties,
incudingterussianFedeation;andsucagedeveop-
ingcountiesasBazi,Cina,India,terepubicofKoea
andMexico.Tesestudiesaveusedvaiousmetods,
timepeiods,datasoucesandevesofsectoaaggega-
tion.Decompositionstudiescanfocusononecountyo
invovecoss-countycompaisons.
Tetwomaintypesofdecompositionanaysisae
indexdecompositionanaysis,wicusessectoapo-
ductionandenegyusedata,andstuctuadecomposition
anaysis,wicusesenegyinput-outputanaysis.Teeis
noconsensusonwicmetodisbest.Wenseectingametod,eseacesgeneayconsideteoeticafoun-
dation,adaptabiity,easeofuseandeaseofundestand-
ing.Tisepotusesindexdecompositionanaysis.
Tetwomainindexdecompositionanaysismetods
aetelaspeyesIndexandteAitmeticMeanDivisia
Index(AngandZang2000).TelaspeyesIndexmeas-
uestepecentagecangeinsomeaspectofagoupofitemsovetime,usingweigtsbasedonvauesinabase
yea.Teimpactoftataspectiscomputedbyaowingit
tocangewieodingaotefactosatteibase-yea
vaues.TeDivisiaIndexisaweigtedsumofogait-
micgowtates,weeteweigtsaetecomponents’
saesintotavaueintefomofaineintega.Bot
indexescanbemutipicativeoadditive.
Te decomposition metod empoyed ee is te
FiseIdeaIndex,amutipicativeenegy-intensityindex.
Toeaseteintepetation,tefactoacontibutionsof
testuctua andtecnica effects wee tansfomed
intopecentage pointsof te canging totaindustiaenegyintensity,soteoveacangeinindustiaenegy
intensitycanbeexpessedastesumoftepecentage
cangesinstuctuaandtecnicaeffects.
Box 2.1
Decomposition analysis

8/2/2019 Unido Full Report eBook
http://slidepdf.com/reader/full/unido-full-report-ebook 54/259
35
T E C hN Ol O GI C A l A ND S T r
U C T Ur A l C hA N GE F Or I ND U S T r I A l E NE r GY E F F I C I E N
C Y
2
“ Technological change has reduced
industrial energy intensity in a majority o
economies, while structural change has
reduced it in most developed economies
intensity is decomposed into a technological eectcomponent and a structural eect component.
Te technological eect measures the combinedinuence o improvements in technical energy e-ciency due to technological change, changes in uelmix, better energy management and actors unrelatedto changes in the volume or composition o output atthe level o sectoral aggregation examined. Te struc-
tural eect measures the impact o changes in theshare o output rom dierent sectors o industry (Liuand Ang 2007). A decline in either indicates that ithas helped reduce industrial energy intensity rom thebase-year level (an improvement in energy use).
Split between technological and structural
eects at the global level
Te estimated split between technological and struc-tural eects depends on the level o sectoral aggre-
gation. For this report, industry was disaggregatedinto 11 sectors: ood and tobacco; textile and leather;
wood and wood products; paper, pulp and printing; petrochemicals; chemicals and chemical products;non-metallic minerals; metals; machinery; transportequipment; and non-specied industry. (See Annex 3or details on the composition o these sectors.) Testudy ound wide variation in the contributions o technological and structural eects to energy intensityacross countries and over time, conrming the results
o an earlier UNIDO (1991) study.Global industrial energy intensity or the 62 econ-omies included in the decomposition analysis declined22.3 percent over 1995–2008 (Figure 2.1), or an aver-age annual reduction o 1.9 percent. Structural change(12.5 percent) had a slightly larger eect than techno-logical change (9.8 percent).
Developed economies and, to a lesser extent, high-income developing economies are largely responsibleor lowering global industrial energy intensity. Withstructural eects as the major contributor to lowerenergy intensity in these economies, it is not surpris-ing that structural eects contribute so strongly tolower industrial energy intensity at the global level.echnological change has reduced industrial energy
intensity in a majority o economies, while structuralchange has reduced it in most developed economies.
Technological and structural eects by
region and income group
Average industrial energy intensity ell in all incomegroups over 1995–2008 (Figure 2.2).2 In developed
economies, the structural eect was stronger in lower-ing energy intensity; in developing economies, struc-tural change increased energy intensity marginally, animpact more than oset by the reduction in energyintensity rom technological change. echnologicalimprovements were thus the main driver o the dropin industrial energy intensity in developing econo-mies, except among those with high incomes. Tesehigh-income developing economies, entering a moremature phase o industrialization and with an increas-ing share o skill- and technology-intensive output, arebeginning to resemble developed economies in manyrespects.
Latin America and the Caribbean was the onlyregion with an overall increase in industrial energy
0
70
80
90
100
2008200520001995
P e r c e n t a g e c h a n g e f r o m 1
9 9 5
Industrial energy intensity
Due to technological improvement
Due to structural change
Figure 2.1
Components o change in global industrialenergy intensity, 1995–2008
Structural change is the main driver o alling global industrial energy
intensity
Source: UNIDO 2010e,; IEA 2010c

8/2/2019 Unido Full Report eBook
http://slidepdf.com/reader/full/unido-full-report-ebook 55/259
36
T E C hN Ol O GI C A l A ND S T r
U C T Ur A l C hA N GE F Or I ND U S T r I A l E NE r GY E F F I C I E N
C Y
2
“ The average industrial energy intensity
ell in all income groups over 1995–2008
intensity, due mostly to technological change.Industrial energy intensity declined in the otherregions, with technological change being the major
contributor except in South and Central Asia, where the structural eect was marginally stronger.Although the Middle East and North Arica andsub-Saharan Arica experienced a structural changein avour o more energy-intensive industries, techno-logical changes oset this eect.
On a country or economy basis, several resultsstand out (Figure 2.3):• Industrial energy intensity ell in 52 o the 62
economies.•
he technical eect contributed to declining industrial energy intensity in all economies butArmenia, Chile, Colombia, Moldova and theUnited States.
• For 34 economies, structural changes avoured lessenergy-intensive industries; or 28 economies, itavoured more energy-intensive industries.In developed countries, the combined technologi-
cal and structural eects lowered industrial energyintensity. In the Netherlands, New Zealand, Portugaland Switzerland detrimental structural eects wereoset by technological eects. In the United States,detrimental technological changes were oset bystrong structural changes towards less energy-intensiveindustries.
Among developing economies, energy intensityell in China, India, the Russian Federation, SouthArica, unisia, urkey and Ukraine, among others.
Te technological eect was the main cause, but it was supported by the structural eect in China, theRussian Federation, urkey and Ukraine. Te struc-tural eect was ound to have a small increasing eecton energy intensity in India, South Arica and unisiabut was easily oset by the technological eect.
Energy intensity increased in Argentina, Armenia,Brazil, Chile, Colombia, Côte d’Ivoire, Gabonand Kyrgyzstan. he technological improvementsin Argentina, Brazil, Côte d’Ivoire, Gabon and
Kyrgyzstan were not sucient to oset a shi towardsmore energy-intensive industries. In Chile andColombia, shis towards less energy-intensive indus-tries could not oset adverse technological eects.
Overall, developing economies shited slightlytowards energy-intensive industries due to rising demand rom growing populations and the upsurgein manuacturing or export. Te combination o thishigh export orientation, poor energy inrastructure,reliance on low-quality and carbon-intensive uels,and less ecient industrial technology makes indus-trial activities in these economies carbon intensive as
well as energy intensive. While most developing countries are net export-
ers o energy and carbon (embodied in manuactured
Total change in industrial energy intensity
High-income developing economies
Upper middle-income developing economies
Lower middle-income developing economies
Latin America and the Caribbean
Sub-Saharan Africa
Middle East and North Africa
South and Central Asia
East Asia and the Pacific
Developing Europe
Developed economies
Developing economies
Contribution of technological changeContribution of structural change
–60 –50 –40 –30 –20 –10 100–60 –50 –40 –30 –20 –10 100–60 –50 –40 –30 –20 –10 100
Figure 2.2
Components o change in industrial energy intensity, by region and income group, 1995–2008 (percent)
Technological change is the primary driver o lower industrial energy intensity in developing economies
Source: UNIDO 2010e,,g; IEA 2010c.

8/2/2019 Unido Full Report eBook
http://slidepdf.com/reader/full/unido-full-report-ebook 56/259
37
T E C hN Ol O GI C A l A ND S T r
U C T Ur A l C hA N GE F Or I ND U S T r I A l E NE r GY E F F I C I E N
C Y
2
“ In developed economies, the combined
technical and structural eects lowered
industrial energy intensity, while in developing
economies there was a slight overall shit
towards energy-intensive industries due to
rising demand rom growing populations and
the upsurge in manuactured exports
Total change in manufacturing energy intensity Contribution of technological change
Armenia
Kyrgyzstanb
Brazil
Cyprus
Chile
Gabon
Colombia
Côte d’Ivoire
New Zealand
Argentina
Macedonia, FYRb
Indonesia
Denmark
Switzerland
Philippinesb
Spain
United Kingdom
Italy
South Africa
Morocco
Australia
Portugal
Norway
Croatia
Venezuela, Bolivarian Rep.c
Kazakhstanb
Canada
Austria
France
Belgium
Thailand
Moldova, Rep.c
NetherlandsGermanya
Mexico
Greece
Japan
Taiwan Province of Chinaa
Slovenia
Costa Ricaa
Turkey
India
United States
Latvia
Finland
Korea, Rep.
Russian Federation
China
Ireland
Israel
Sweden
Tunisia
Bulgaria
SlovakiacUkraineb
Lithuania
Azerbaijanb
Czech Republic
Romania
Hungary
Estoniaa
Poland
–100 –50 0 50 100 –100 –50 0 50 100
Contribution of structural change
–100 –50 0 50 100
Figure 2.3
Components o change in industrial energy intensity by economy, 1995–2008 (percent)
Technological change has lowered energy intensity or most economies, but structural change has a mixed record
a. Data or 1991–2008.
b. Data or 1998–2008.
c. Data or 2000–2008.
Source: UNIDO 2010e,; IEA 2010b.
8/2/2019 Unido Full Report eBook
http://slidepdf.com/reader/full/unido-full-report-ebook 57/259
38
T E C hN Ol O GI C A l A ND S T r
U C T Ur A l C hA N GE F Or I ND U S T r I A l E NE r GY E F F I C I E N
C Y
2
“ Innovation in industrial energy eciency and
in systems optimization and systems solutions
are the ey elements o technological change
goods), most OECD countries are net importers(Davis and Caldeira 2010).3 As a result, developedcountries’ energy intensity is substantially lower thanit would be i they manuactured their own goods.And i the carbon emitted by developing countries in
the manuacture o goods imported by OECD coun-tries were taken into account, most European coun-tries’ emissions would rise by a third and US emissions
would rise 12 percent. For China, the situation is thereverse; its emissions all by a quarter i exports aretaken into account.
Tus, improving technology in developing coun-tries might not suice to curb growing industrialenergy demand. With rising per capita incomes anddomestic demand and an increasing orientation
towards energy-intensive goods or export, indus-trial energy consumption seems likely to continue itsupswing in most developing countries.
How much has technological change
lowered energy intensity?
Capital renewal is the main actor permanently alter-ing energy use across industries. Industries consist o dierent age cohort o capital (capital vintages), witheach vintage distinguished by specic attributes ininput and energy eciency, output volume, rate o
production capacity utilization and so on and witholder vintages generally requiring more inputs per unito output than newer vintages. Industries evolve by
progressively adding new capital stock while retiring
older capital and, through this process, change theattributes and age o the capital stock and thus its pro-ductivity (Davidsdottir and Ruth 2004, 2005, 2008;De Beer 1998; Doms and Dunne 1998; Lempert et al.2002).
Adding to the capital stock requires invest-ments to replace or retrot machinery, equipmentand buildings. Te extent o energy savings depends
on the capital intensity o an industry – because o lock-in eects, the attributes o new capital vintages,the lie-cycle o individual pieces o equipment or acombination o these (Davidsdottir and Ruth 2005).Industries’ capital intensities, vintage attributes andcapital lie-cycles arise rom their underlying processand equipment technologies, and technological andnancial considerations guide investment decisions.So, capital investment is a process o technologicalchange.
echnological change involves multiple stages with multiple actors, relationships and eedback loops– rom invention, as a new technology is created and
prototyped, to innovation, as it becomes commer-cially viable (Freeman and Soete 1997; IEA 2008a).Te more radical the innovation, the larger the gainsto industrial energy eciency and the environment(Eichhammer and Walz 2011; Fleiter, Eichhammerand Schleich 2011). Much contemporary innovationresults rom dedicated research and development
(R&D). For energy projects, this includes investing in demonstration or the scientic community and potential users (Grubb 2004; Foxon et al. 2004).Innovation in industrial energy eciency and in sys-tems optimization and systems solutions are the keyelements o technological change.
Innovation in industrial energy eciency
Public sector energy R&D expenditure increasedrom €10.0 billion in 1990 to €15.8 billion in 2008 –
with a dip in the late 1990s and early 2000s – drivenby expenditures on uel cells, renewable energy sourcesand ossil uels (IEA 2010d; Figure 2.4). As a share o total public R&D expenditure, however, energy R&Dell rom around 17 percent to 15 percent. Public
Trends in industrial energy intensity
• Since 1995, tecnoogy as contibuted most
toeducingindustiaenegyintensitygobay–
especiayindeveopingcounties.
• Stuctuacangesaveeducedindustiaenegy
intensity in deveoped countiesbut made itte
diffeenceindeveopingcounties.
• Industiaenegyconsumptionindeveopingcoun-
tiesisikeytoinceaseduetoisingpopuations,
pecapitaincomesanddemandfomanufactuedexpots,coupedwitstuctuacangeoiented
towads te moe enegy-intensive pase of
industiaization.

8/2/2019 Unido Full Report eBook
http://slidepdf.com/reader/full/unido-full-report-ebook 58/259
39
T E C hN Ol O GI C A l A ND S T r
U C T Ur A l C hA N GE F Or I ND U S T r I A l E NE r GY E F F I C I E N
C Y
2
“ Major transitions in energy technologies can
tae decades and entail massive investments that
are beyond the reach o most private investors
sector R&D expenditure on energy eciency has beengrowing steadily, reaching €2.3 billion in 2008. Abouta h o it was allocated to improving the energy e-ciency o industrial processes and developing moreecient technologies or industrial application.
Grubb (2004) and Murphy and Edwards (2003)
argue that public sector R&D in energy, with its potential or protability and environmental benets,is ar lower than it should be. Te commercial ailureo earlier large-scale public sector expenditures ontechnologies, such as breeder reactors and syntheticuels, has made governments wary o targeting R&Dto particular energy technologies. But major transi-tions in energy technologies can take decades andentail massive investments in capital equipment andinrastructure that are beyond the reach o most pri-
vate investors.But while government R&D expenditure is
important or reducing energy intensity, it is neitherthe only nor the largest such investment. Private sec-tor R&D expenditure on energy eciency is dicult
to identiy, but it is thought to be substantial (IEA2010d). Equipment suppliers and large energy usersconduct most industrial energy-eiciency R&D –
working to improve product design, eedstock and process technology – because the energy eciencyo production processes strongly inuences competi-tiveness. Because no single innovation – not even ahandul – can improve energy eciency dramatically,R&D oten combines technologies rom dierentsuppliers. Improved energy eciency in production
processes is also requently an unexpected by-producto investments in new process technologies aimed atincreasing capacity, throughput or product quality(Box 2.2).
Diusion o new technologies – best available and best practice technologies. Invention and innovation areollowed by diusion, as new technologies penetrate
0
5
10
15
20
200820052000199519900
5
10
15
20
E n e r g y R & D
e x p e n d i t u r e ( e u r o b i l l i o n s ) P
e r c e n t
Other energy R&DOther energy efficiency R&DIndustry energy efficiency R&DEnergy R&D as share of total R&D (percent)
Figure 2.4
Public sector R&D expenditure on energytechnologies in selected countries, 1990–2008
Public sector R&D has shot up since 2001
Note: Analysis includes Austria, Canada, Denmark, Finland, France, Germany, Italy, Japan, the
Netherlands, New Zealand, Norway, Portugal, Spain, Sweden, Turkey and the United States.
Source: IEA 2010d.
Industiaenegy-efciencyr&Disaottopicamong
eseaces,weteinacademiaotepivatesecto.
OneexampeisaseiesofeseacstudiesatteUni-
vesityofNottingamoneducingteenegyequied
fopneumaticoydauicconveying,oneoftemost
commonmetodsoftanspotingbuksoids.Teeseacassowntatatee-obedeica
pipecaninduceswiandinceaseocatubuence,
usefufoinceasingtetubuentenegyofteow
to ean-pase pneumatic and ydauic conveying
toeducepaticesettementandbockage.Ineay
deveopment,tepipeaseducedteneedtopump
teconveyinguidintotesystematigveocity,ow-
eingeecticityuseasmucas20pecent,depending
onappications.Teswipipeasoteadvantages
ovetaditionaswi-geneationdevices:itisnotintu-
sivetoteowoponetobockages,anditcontains
nomovingpats.Again,tissavesoneecticityuse
asobstuctedpipeinesequieigeconveyinguid
veocity.Tisappicationofteeicapipeasbeen
patentedbyteunivesitybutisnotyetontemaket,
asitisbeingenedbefoecommeciademonstation.
Source: Fokeer, Lowndes and Kingman 2009.
Box 2.2
Industrial energy-eciency R&D case study:decreasing the inlet velocity required orpneumatic and hydraulic conveying

8/2/2019 Unido Full Report eBook
http://slidepdf.com/reader/full/unido-full-report-ebook 59/259
40
T E C hN Ol O GI C A l A ND S T r
U C T Ur A l C hA N GE F Or I ND U S T r I A l E NE r GY E F F I C I E N
C Y
2
“ Faster uptae o best available technology
would greatly reduce energy intensity
and improve markets, reduce costs through scaleand learning economies and compete with othertechnologies until some dominate (Freeman and Soete1997; Grubb 2004). Te many sources and choiceso technologies, the unexpected nature o manyenergy-eciency gains and the ongoing evolution o technological diusion mean that users have a widerange o technological options, each with dierent
eects on industrial energy eciency. Te potentialor industrial energy eciency reects these options.
Best available technology is the most energy-ecient way o producing goods and services that iscommercially viable and in use. It reers to the mostadvanced usable technologies and methods o opera-tion, the way installations that deploy them are builtand operated, and the economic easibility o thetechnologies. Best available technologies come romthe best plant in an industry (Saygin et al. 2010).
Normally the newest technologies in an industry, bestavailable technologies are always changing due to con-tinuous radical and incremental innovation.
Best practice technology, a related concept, ocuseson the best perormers among plants with widely di-used industrial energy-eciency technologies andbusiness practices. In some cases, best available tech-nologies and best practice technologies are identical.But in most cases best practice technology diersin that it considers all the plants that have adopted
energy-ecient technologies, at all times and underall conditions. Saygin et al. (2010) places the top 10 percent o energy-eciency perormers worldwide inthis category.
By denition, the average energy eciency o exist-ing plants is always lower than the best available tech-nology average. Current investments in new equip-ment and best available technology are generally moreecient than previous investments in old equipment.I annual eciency gains rom best available technol-ogy accelerate, or i equipment liespans lengthen, thegap widens. Faster uptake o best available technology
would greatly reduce energy intensity (Box 2.3).Most industrial plants and much energy-intensive
capital stock have long technical lie spans, slowing
the diusion o best available technology. A plantbuilt today could remain in service or decades, retro-tted and reurbished several times. In many develop-ing countries, equipment stays in service even longerbecause capital costs are so much higher than energycosts. Continuously upgrading to best available tech-nology entails retiring equipment earlier or retrot-ting it sooner, although premature replacement might
not be economical (able 2.1). China, or example,closed energy-inecient plants beore the end o their“extended” technical lie to meet ambitious targets orindustrial energy eciency.
Tere can be great dierences, however, in tech-nical perormance across new and similar technolo-gies. Equipment manuacturers oen trade techni-cal quality or price and availability (CERF/IIEC– Asia, 2002). For example, China has emerged as amajor equipment supplier. In many sectors, the cost
o Chinese equipment can be hal that o its Westerncompetitors. But in some cases, the energy eciencyis also lower, and the equipment tends to deteriorateaster because o lower quality materials. While a ullcost assessment should be done to properly measurethe return on investment, or many companies indeveloping countries, with limited access to capital,the upront cost o equipment is generally the over-riding investment criterion.
echnological evolution in selected industrial sectors. Over time, global average industrial energy eciencyand best available technology in speciic sectorsboth improve, sometimes in parallel and sometimesconverging, with typical energy reductions o 20–60
percent (Figure 2.5). Tis implies that innovation andbest available technology uptake must go together.his section ocuses on advances in the majorindustrial sectors.
In chemicals and petrochemicals, the mainbest available technologies are process integration,cogeneration (combined heat and power), recycling and heat recovery. Worldwide, potential savings romthese measures are estimated at 235 million tonnes o oil equivalent a year in nal energy and 290 million in

8/2/2019 Unido Full Report eBook
http://slidepdf.com/reader/full/unido-full-report-ebook 60/259
41
T E C hN Ol O GI C A l A ND S T r
U C T Ur A l C hA N GE F Or I ND U S T r I A l E NE r GY E F F I C I E N
C Y
2
“ The average energy eciency o the motor
stoc lags substantially behind that o motor sales,
implying an opportunity or policy intervention
to expedite uptae o best available technology
primary energy – with the greatest potential savingsin the United States (IEA 2010e).4 In ammonia pro-duction, adopting the best available technology couldhalve energy use. Te best practice technology energyrequirement or the most ecient decile o ammonia
producers is 32 gigajoules (GJ) per tonne o ammo-nia. Revamping less ecient plants could increaseenergy eciency and reduce carbon dioxide emissionsby some 10 percent (IFA 2009).5 Tis calculation o savings based on the use o best practice technology
does not apply, however, to the quarter o the world’sammonia production that originates in China, where
production is coal-based and uses about a third moreenergy than best practice technology. As Chinadevelops natural gas elds in its western regions and
pipelines to population centres in its east, the energyrequired or ammonia production is likely to all.
In the metals sector, the potential energy savingsor iron and steel rom applying today’s best availabletechnology is about 20 percent (4.1 GJ per tonne o
Enegy-usingcapitastockgeneayasaongifespan,
inceasingtetimeagbetweenteintoductionofbest
avaiabetecnoogyand impovementsin teaveage
efciencyoftecapitastock.Consideeecticmotos
(seegue).Teeaeteeintenationaefciency(IE)
standadsfomotos:IE1(standad),IE2(ig)andIE3
(pemium).IE1typicayacieves85–93pecentefciency,
dependingonmotosize.MovingfomIE1toIE2yiedsa2–3pecentagepointefciencygain,andmovingfomIE2
toIE3yiedsanote2pecentagepointgain.Gainsae
agefosmaemotos.
Temoeefcientmotosaegeneaycost-effective
weeenegypicesaeig.Initiacapitacostsaetypi-
cay5–20pecentofifecycecost,andefcientmotos
costony15–30pecentmoetanessefcientmotos.
Butteuptakeasbeensow,suggestingmaketfaiues.
IE3motosavebeenaoundsincebefoe1995,butte
maketsaessaein2010wasstiesstan20pecent.
Andtesaeinteoveamotostockisevensmae,witteaveageenegyefciencyofmotostockagging
substantiaybeindtatofmotosaes.Tisimpiesan
oppotunityfopoicyinteventiontoexpediteuptakeof
bestavaiabetecnoogy.
Average electric motor stock efciency changes slowly
Note: IE3 is the highest international e ciency standard or electric motors.
Source: Brunner 2010.
Box 2.3
Uptae o best available technology is generally slow: the case o energy-ecient motors
0
25
50
75
100
20152010200520001995
M
a r k e t s h a r e ( p e r c e n t )
Motor stock: progress is slowIE3 1–11 percent
IE3
IE2
IE1
IE0
0
25
50
75
100
20152010200520001995
Motor sales: the world is changingIE3 3–23 percent
IE3
IE2
IE1
IE0

8/2/2019 Unido Full Report eBook
http://slidepdf.com/reader/full/unido-full-report-ebook 61/259
42
T E C hN Ol O GI C A l A ND S T r
U C T Ur A l C hA N GE F Or I ND U S T r I A l E NE r GY E F F I C I E N
C Y
2
“ Continuously upgrading to best available
technology entails retiring equipment
earlier or retrotting it sooner
steel). Replacing small-scale blast urnaces promises
the most savings, ollowed by recovering more residualgases and waste heat (Figure 2.6). Energy require-ments per tonne o steel have allen by hal over the
past 50 years or primary steel making rom ore andor steel recycling in electric arc urnaces, reecting large declines in energy use through best availabletechnology. Energy eciency in US electric arc ur-naces increased 1.3 percent a year over 1990–2002,and similar savings have been achieved globally (IEA2007a). Slightly more than hal the improvementcame rom replacing old urnaces; the rest came romretrotting, which is more cost-eective in the shortrun (Worrell and Biermans 2005). For urnaces using recycled scrap, the long-term potential energy savingsis about 3.5 GJ per tonne.
For aluminium, the main opportunities or
energy-eiciency improvements involve replacing old smelter technologies with modern prebake cells,developing process controls to optimize cell operat-ing conditions, improving insulation to reduce heatlosses and reducing electricity use in auxiliary equip-ment, such as compressors and ans. he produc-tion o primary aluminium is electricity intensive:aluminium smelters accounted or some 3.5 percento total global electricity consumption in 2009. Inrecent years, smelter perormance has improvedconsiderably, but considerable scope or energy sav-ings remains (about 15 percent). New world-class
plants can achieve around 13.5 megawatt hours pertonne, a savings o 13 percent over the current worldaverage. Aluminium recycling is extremely energy
Sector and technology 2000 2006 2007 2008 2009 Energy efciency impact
Steel
Continuous casting 83 99 99 99 99 Energy savings o 200 kg coal equivalent pertonne (ce/t) billets produced
Coke dry quenching 6 40 45 50 >70 Energy savings o 100 kg ce/t processed coke
Blast urnace top gasrecovery turbine
50 95 96 99 100 Energy generation o 30 k ilowatt hours per tonne(kWh/t) o pig iron
Coke
Mechanical coke making 72 88 91 96 99 Reduced consumpt ion o coking coal o 170 kgce/t mechanical coke
Aluminium (electrolytic)
Prebaked cell 52 82 83 86 90 9 percent savings (compared with Soderbergcell)
Chemicals
Caustic soda productionmembrane process
25 31 38 50 55 Electricit y savings o 123 kWh/t (compared wi thdiaphragm process)
Cement
Bulk processing 28 39 45 46 46 Net savings o 24 kg ce/t cement rom4.5 percent savings in reduced losses and3.3 million cubic metres savings in timber use orpaper bags (compared with bagged cement)
New suspensionpreheater dry process
12 50 55 63 73 Fuel savings o 40 percent (compared withmechanized vertical shat kilns)
Glass plate
Floating process 57 82 83 83 83 Energy savings o 16 percent
Construction
Replacing clay bricks withnew wall materials
28 46 48 50 52 Energy savings o 40 percent
Source: Wang 2008.
Table 2.1
Examples o best available technology uptae in China: technology diusion as a share o capacity,2000 and 2006–2009 (percent)

8/2/2019 Unido Full Report eBook
http://slidepdf.com/reader/full/unido-full-report-ebook 62/259
43
T E C hN Ol O GI C A l A ND S T r
U C T Ur A l C hA N GE F Or I ND U S T r I A l E NE r GY E F F I C I E N
C Y
2
“ Over time, energy intensity alls, driven
by advances in best available technology
ecient, using less than 10 percent o the electricityrequired or primary smelting. As economies develop,the availability o aluminium scrap or recycling willlikely also increase.
In the non-metallic minerals sector, total poten-tial energy savings in the cement subsector is an esti-mated 2.5 exajoules (EJ) a year, about a quarter o cur-rent energy use. Potential uel savings are greatest incement clinker production. Average thermal energyconsumption per tonne o clinker has allen some 15
percent since 1990. And while the current global aver-age thermal energy intensity is 3.9 GJ per tonne o clinker, actual thermal energy consumption dependson the type o kiln. Ecient dry kilns with preheat-ers use about 3.3 GJ per tonne o clinker, while a wetkiln can use 5.9 GJ–6.7 GJ per tonne (IEA 2009a).
Vertical-sha kilns, with even higher energy needs,are being phased out in China but are still widely usedelsewhere.
In the bricks and ceramics subsector, coupled kilnsand dryers, urnace upgrades and cogeneration tech-nologies oer the greatest potential or improving energy eciency. For glass, these strategies include
developing and using advanced reractory materialsin kilns and new technologies such as oxyuel ring and electric boost that increase production capacity.Te optimal electricity consumption using best avail-able technology is about 2.32 GJ per tonne o moltenglass. Actual consumption, however, is 30 percenthigher because o ineciencies in glass-melting ur-naces, where 40 percent o the energy goes to heating the batch, 30 percent is lost through the urnace struc-ture and 30 percent exits with stack gases (Worrellet al. 2008).
Systems improvements
A system is a set o connected unit operations or pieceso equipment that perorm a service together. Tere is
201020001990198019701960 201020001990198019701960
201020001990198019701960 201020001990198019701960
G i g a j o u l e s o f p r i m a r y e n e r
g y p e r t o n n e o f a m m o n i a
Ammonia production
M e g a w a t t h o u r s p e r t o n n e o f a l u m i n i u m
Aluminium smelting
Crude steel making
Cement and cement clinker making
G i g a j o u l e s o f p r i m a r y
e n e r g y p e r t o n n e o f s t e e l
G i g a j o u l e s o f p r i m a r y e n e r g y p e r t o n n e o f c e m e n t
0
20
40
60
0
2
4
6
8
0
25
50
75
125
100
0
5
10
15
20 Average
Average, blast furnacesand basic oxygen furnaces
Average, scrap andelectric arc furnaces Best available technology,
scrap and electric arc furnaces
Best availabletechnology
Best availabletechnology
Average Best available technology,blast furnaces andbasic oxygen furnaces
Average (gigajoules of primaryenergy per tonne of cement)
Best available technology(gigajoules of primaryenergy per tonne of cement)
Average (gigajoules offuel per tonne of clinker)
Best available technology(gigajoules of fuel pertonne of clinker)
Figure 2.5
Global average energy intensity and best available technology or ammonia, iron and steel,aluminium and cement, 1960–2010
Big drops in energy intensity, but still room or improvement
Source: UNIDO.

8/2/2019 Unido Full Report eBook
http://slidepdf.com/reader/full/unido-full-report-ebook 63/259
44
T E C hN Ol O GI C A l A ND S T r
U C T Ur A l C hA N GE F Or I ND U S T r I A l E NE r GY E F F I C I E N
C Y
2
“ There is growing evidence that systems
optimization and systems upgrading hold
the greatest potential or energy-eciency
gains and environmental benets
growing evidence that systems optimization and sys-tems solutions (systems upgrading) hold the greatest
potential or energy-eciency gains and environmen-tal benets (see, or example, UNIDO 2010a).
Systems optimization. Energy-eicient components
in industrial systems, while important, will not yieldthe expected energy savings i the entire system is not properly designed and operated. Experience shows that while ecient energy components, such as pump, steamand compressed air systems, can raise average eciency2–5 percent, system optimization measures can yield20–30 percent gains – with a payback period o lessthan two years (see, or example, the survey o unisianmanuacturing companies conducted or this study byFokeer 2010). Further gains can be achieved i systemsare optimized in tandem with production processes, orexample, by reducing raw materials or other inputs.
An industrial acility may upgrade processes –change production volumes, schedules or type o prod-uct manuactured – many times during its useul lie.
Te energy-using systems that support these produc-tion patterns might be relatively energy ecient underthe initial production design conditions, but energyeciency can regress as production patterns change.Tus, systems need to be optimized over time as wellas across equipment components.
Globally, the energy-consuming systems with thehighest potential energy savings are motors, compres-sors and steam systems.6 Motor-driven equipment accounts or about 60 percent o manuacturing nalelectricity use and is ubiquitous worldwide. Motorsystems, consisting o drives, pumps and ans, are alargely untapped, cost-eective source o industrialenergy-eciency savings that could be realized withexisting technologies (see Box 2.3). Some 55 percento the electricity used by motor systems (16 percent o total industrial energy consumption) is lost beore themotor systems do any work. Losses can be reduced byusing more ecient motors and variable speed drives,sizing motors appropriately and optimizing motor-driven systems, such as pumps and conveyors.
0
30
60
90
120
150
OtherJapanKorea, Rep.UnitedStates
OECDEurope
CanadaSouth Africa
RussianFederation
BrazilIndiaUkraineChinaWorld0
2
4
6
8
10
I r o n
( p e t a j o u l e s
p e r y e a r )
S t e e l ( g i g a j o u l e s
p e r t o n n e
p e r y e
a r )
Steel finishing Efficiency power generation Switch from open hearth furnace Increased basic oxygen Blast furnace Coke oven Coke dry quenching Specific
improvements from blast furnace gas to basic oxygen furnace furnace gas recovery improvements gas recovery (or advanced wet savingsquenching) potential(steel)
2.0
1.41.4
2.4
2.1
3.63.7
5.3
4.7
6.1
9.0
6.1
4.1
Figure 2.6
Energy savings potential in iron and steel maing, 2006
Small-scale blast urnaces promise better energy eciency
Source: IEA 2009a.

8/2/2019 Unido Full Report eBook
http://slidepdf.com/reader/full/unido-full-report-ebook 64/259
45
T E C hN Ol O GI C A l A ND S T r
U C T Ur A l C hA N GE F Or I ND U S T r I A l E NE r GY E F F I C I E N
C Y
2
“ Motor systems are a largely untapped,
cost-eective source o industrial
energy-eciency savings that could be
realized with existing technologies
Compressed air systems – compressors, drives,air treatment, compressed gas network and the end-use devices driven by compressed air – account or10 percent o industrial consumption o electricity.Compressors lose 80 percent o the mechanical workdone by the motor, and leaks in the air distributionsystems are rampant. Case studies show that savings o up to 50 percent are possible, but these are not being
realized under current market and decision mecha-nisms (Fleiter, Eichhammer and Schleich 2011).
Steam systems account or 35 percent o globalindustrial energy consumption. Tese systems lose anaverage 45 percent o their input heat beore reaching
point o use. In many developing countries, the lossesare substantially larger. For example, in the RussianFederation, most steam systems have no pipeline insu-lation. In China, many small-scale boilers operate withconsiderable excess air and incomplete coal combus-
tion. Experience in well managed industrial acilitiesin OECD countries shows potential energy-eciencygains o about 10 percent rom system eciency meas-ures (able 2.2).
Apart rom plugging leaks, installing cogenera-tion systems may be the best way to reduce energy loss
in steam generation. A traditional system producesheat and power separately, with a typical combinedeciency o 45–60 percent. In a cogeneration system– also known as a combined heat and power system –uel technologies generate power at the point o use,allowing recovery o the heat normally lost in powergeneration. An attractive complementary measureonce steam leaks have been stopped, cogeneration sys-
tems can operate with a rst-law energy eciency7 o 75–90 percent and avoid electricity system distribu-tion losses as well.
Cogeneration is widely applied in the paper, pulpand printing; chemicals and petrochemicals; oil ren-ing; and ood processing sectors, and its share is rising in others. Te economics o cogeneration are sensitiveto the heat to power ratio at the site and to the loadactor o the plant; the most promising opportuni-ties occur in non-stop operations (24 hours a day,
seven days a week). Yet ew countries generate morethan 20 percent o their electricity rom cogeneration.Installed capacity in OECD countries is 174 GW(6 percent o total electricity generation; UNIDO cal-culations rom IEA data). Te estimated global poten-tial or new industrial cogeneration is around 160 GW
System efciency measure
Typical investments(US$ per gigajouleo steam per year)
Typicalsavings
Use in OECDcountries
Use innon–OECDcountries
Steam traps 1 5 50 25
Insulated pipelines 1 5 75 25
Feedwater economizers 10 5 75 50
Reduced excess air 5 2 100 50
Heat transer – – 75 50
Return condensate 10 10 75 50
Improved blowdown 20 2–5 25 10
Vapour recompression 30 0–20 10 0
Flash condensate 10 0–10 50 25
Vent condenser 40 1–5 25 10
Minimized short cycling 20 0–5 75 50Insulated valves and ttings 5 1–3 50 25
– no data available.
Source: IEA 2006a.
Table 2.2
Typical savings rom eciency measures or steam systems (percent unless otherwise indicated)
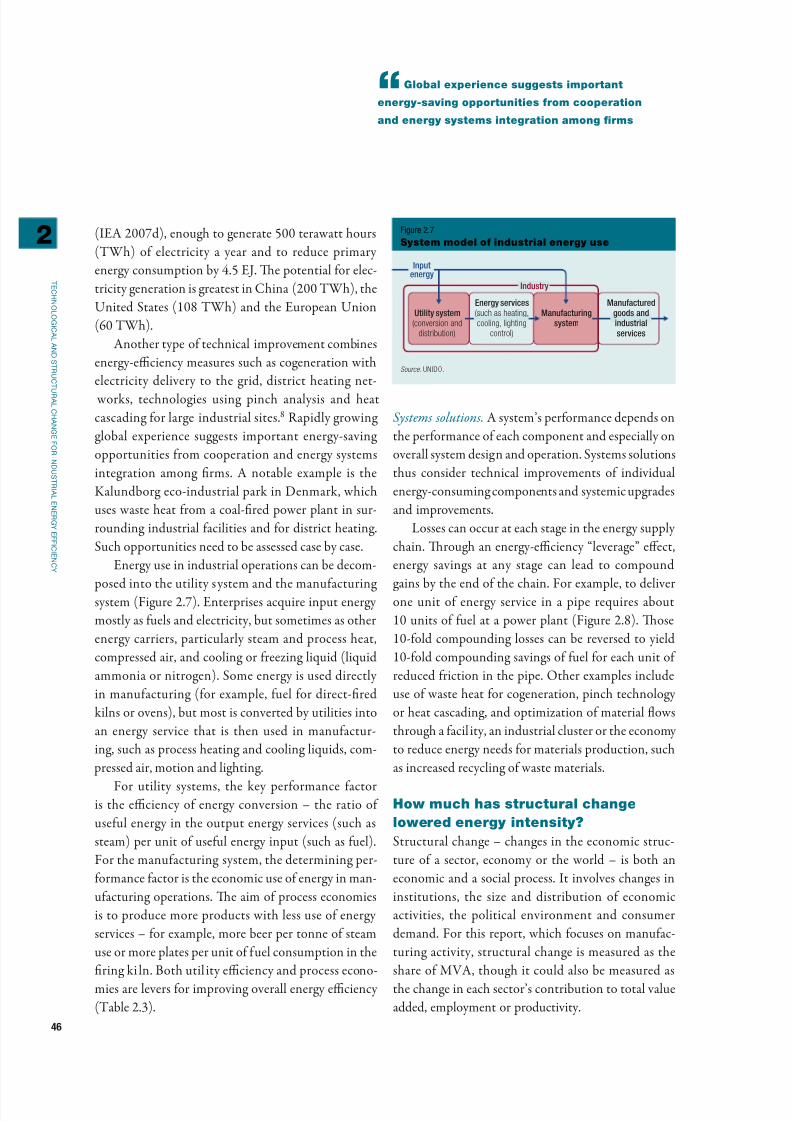
8/2/2019 Unido Full Report eBook
http://slidepdf.com/reader/full/unido-full-report-ebook 65/259
46
T E C hN Ol O GI C A l A ND S T r
U C T Ur A l C hA N GE F Or I ND U S T r I A l E NE r GY E F F I C I E N
C Y
2
“ Global experience suggests important
energy-saving opportunities rom cooperation
and energy systems integration among rms
(IEA 2007d), enough to generate 500 terawatt hours(Wh) o electricity a year and to reduce primaryenergy consumption by 4.5 EJ. Te potential or elec-tricity generation is greatest in China (200 Wh), theUnited States (108 Wh) and the European Union(60 Wh).
Another type o technical improvement combinesenergy-eciency measures such as cogeneration with
electricity delivery to the grid, district heating net- works, technologies using pinch analysis and heatcascading or large industrial sites.8 Rapidly growing global experience suggests important energy-saving opportunities rom cooperation and energy systemsintegration among rms. A notable example is theKalundborg eco-industrial park in Denmark, whichuses waste heat rom a coal-red power plant in sur-rounding industrial acilities and or district heating.Such opportunities need to be assessed case by case.
Energy use in industrial operations can be decom- posed into the utility system and the manuacturing system (Figure 2.7). Enterprises acquire input energymostly as uels and electricity, but sometimes as otherenergy carriers, particularly steam and process heat,compressed air, and cooling or reezing liquid (liquidammonia or nitrogen). Some energy is used directlyin manuacturing (or example, uel or direct-redkilns or ovens), but most is converted by utilities intoan energy service that is then used in manuactur-
ing, such as process heating and cooling liquids, com- pressed air, motion and lighting.For utility systems, the key perormance actor
is the eciency o energy conversion – the ratio o useul energy in the output energy services (such assteam) per unit o useul energy input (such as uel).For the manuacturing system, the determining per-ormance actor is the economic use o energy in man-uacturing operations. Te aim o process economiesis to produce more products with less use o energyservices – or example, more beer per tonne o steamuse or more plates per unit o uel consumption in thering ki ln. Both utility eciency and process econo-mies are levers or improving overall energy eciency(able 2.3).
Systems solutions. A system’s perormance depends onthe perormance o each component and especially onoverall system design and operation. Systems solutionsthus consider technical improvements o individualenergy-consuming components and systemic upgradesand improvements.
Losses can occur at each stage in the energy supplychain. Trough an energy-eciency “leverage” eect,
energy savings at any stage can lead to compoundgains by the end o the chain. For example, to deliverone unit o energy service in a pipe requires about10 units o uel at a power plant (Figure 2.8). Tose10-old compounding losses can be reversed to yield10-old compounding savings o uel or each unit o reduced riction in the pipe. Other examples includeuse o waste heat or cogeneration, pinch technologyor heat cascading, and optimization o material owsthrough a acility, an industrial cluster or the economy
to reduce energy needs or materials production, suchas increased recycling o waste materials.
How much has structural change
lowered energy intensity?
Structural change – changes in the economic struc-ture o a sector, economy or the world – is both aneconomic and a social process. It involves changes ininstitutions, the size and distribution o economicactivities, the political environment and consumerdemand. For this report, which ocuses on manuac-turing activity, structural change is measured as theshare o MVA, though it could also be measured asthe change in each sector’s contribution to total valueadded, employment or productivity.
Utility system(conversion and
distribution)
Energy services(such as heating,
cooling, lighting
control)
Manufacturingsystem
Manufacturedgoods andindustrialservices
Inputenergy
Industry
Figure 2.7
System model o industrial energy use
Source: UNIDO.

8/2/2019 Unido Full Report eBook
http://slidepdf.com/reader/full/unido-full-report-ebook 66/259
47
T E C hN Ol O GI C A l A ND S T r
U C T Ur A l C hA N GE F Or I ND U S T r I A l E NE r GY E F F I C I E N
C Y
2
“ Both utility eciency and process economies
are levers or improving overall energy eciency
O the 22.3 percent decline in global industrialenergy intensity over 1995–2008, 56 percent was dueto changes in industrial structure. Tere has been amajor reduction in the share o energy-intensive pro-cess sectors in global MVA and a large increase in theshare o the machinery sector (rom plant equipmentto consumer electronics and electrical appliances) –rom around 29 percent in 1995 to 44 percent in 2008.
Changes in demand patterns as standards o liv-ing improve account or much o the shi in thestructure o industry. Long-term studies show thatas disposable income grows, so does the demand orcertain products (Schäer 2005). At lower incomes,demand is greatest or basic inrastructure – housing,roads and other services. Tis requires energy-inten-sive inputs like steel rods, aluminium castings, and
Improvement practice
Example in industrial energy efciency
Utility efciency:utility system
Process economies:manuacturing system
Good housekeeping • Identiy and repair leaks in utilitysystems, including compressed air andsteam
• Apply energy management systems•
Conduct preventive maintenance andclean steam traps, cooling tower ans
• Identiy and repair leaks and spills• Apply environmental management
system• Plan production or extended batches
and reduced start-ups/shutdowns• Reduce inventory
Substitute energy carriers • Switch to lower carbon uel (natural gasor biomass)
• Switch to solar process heating
• Replace electric motor drives withmedium- or low-pressure steam drives
• Replace steam humidication with aircooling by ultrasonic humidiers
• Replace compressed air tools with directdriven tools
Better process control • Monitor exhaust gas to improveeciency o boilers and kilns
• Control air intake or compressors
• Use timers and on-o controllers onequipment, lighting, air conditioning
• Control and balance peak load
Equipment modication • Install variable-speed drives or motorsystems
• Insulate hot utility systems• Rationalize utility reticulation systems,
including steam and compressed air
• Remove bottlenecks in the productionline to optimize use o ovens, urnacesand kilns
• Optimize actory layout to reducematerial transer requirements
• Use advanced tank and reactor design
to eliminate stirring• Modiy exhausts to reduce volume and
increase temperature or heat recovery
Technology change • Install energy-ecient energy equipment,including motors, boilers and urnaces
• Use process intensication• Apply green chemistry and engineering
(catalysis, ambient temperature andpressure)
On-site reuse and recovery • Recover waste heat recovery romboilers, urnaces, kilns and other hotequipment
• Recover condensate as boiler eed• Remove moisture rom wet raw materials
entering kiln• Operate kilns on counter-current
• Recover solvents and other combustibleprocess wastes and emissions assupplementary uels
Production o useulby-products
• Use low-grade waste heat or building ordistrict heating
•Desalinate with low-grade waste heat
• Store energy in ground reservoir, phase-change materials
• Switch to cogeneration or trigenerationsystems
Product modication • Not applicable • Optimize dematerialization and productdesign to reduce breakage and cracks
Source: UNIDO.
Table 2.3
Resource-ecient and cleaner production approaches to improving industrial energy eciency
Common improvement practices or industrial energy eciency at the utility and manuacturing levels
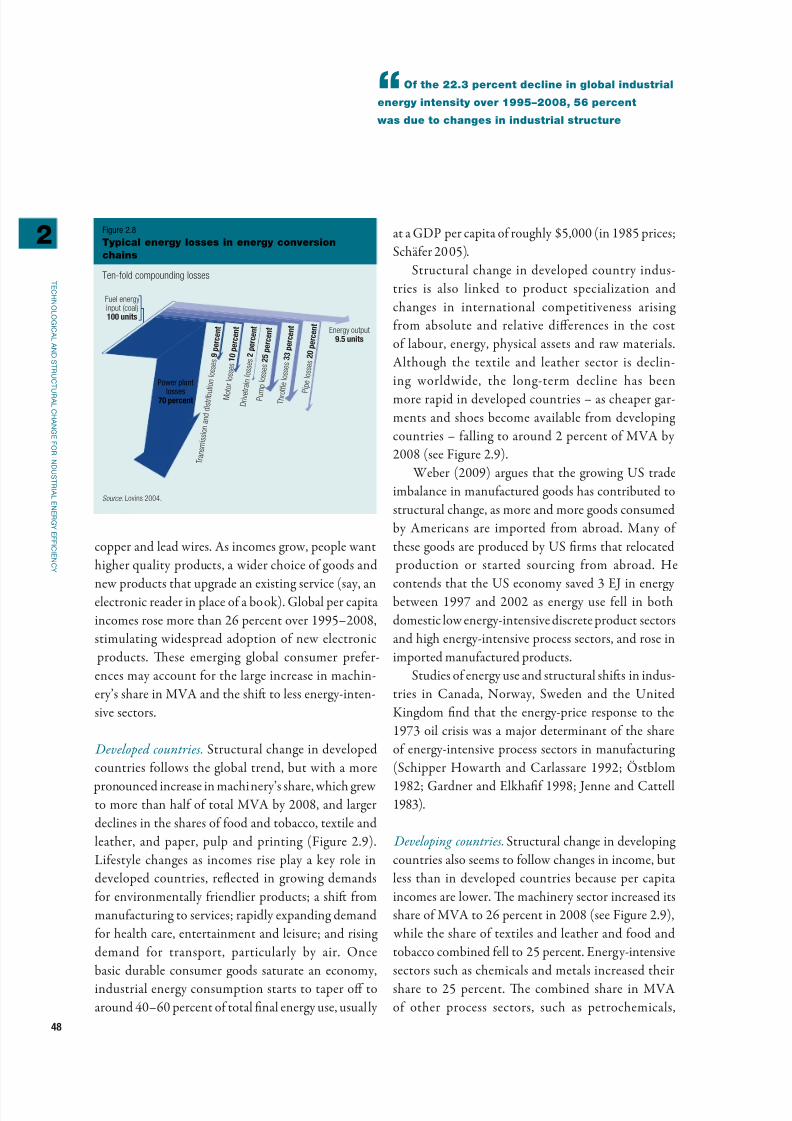
8/2/2019 Unido Full Report eBook
http://slidepdf.com/reader/full/unido-full-report-ebook 67/259
48
T E C hN Ol O GI C A l A ND S T r
U C T Ur A l C hA N GE F Or I ND U S T r I A l E NE r GY E F F I C I E N
C Y
2
“ O the 22.3 percent decline in global industrial
energy intensity over 1995–2008, 56 percent
was due to changes in industrial structure
copper and lead wires. As incomes grow, people want
higher quality products, a wider choice o goods andnew products that upgrade an existing service (say, anelectronic reader in place o a book). Global per capitaincomes rose more than 26 percent over 1995–2008,stimulating widespread adoption o new electronic
products. Tese emerging global consumer preer-ences may account or the large increase in machin-ery’s share in MVA and the shi to less energy-inten-sive sectors.
Developed countries. Structural change in developedcountries ollows the global trend, but with a more pronounced increase in machinery’s share, which grewto more than hal o total MVA by 2008, and largerdeclines in the shares o ood and tobacco, textile andleather, and paper, pulp and printing (Figure 2.9).Liestyle changes as incomes rise play a key role indeveloped countries, reected in growing demandsor environmentally riendlier products; a shi rommanuacturing to services; rapidly expanding demandor health care, entertainment and leisure; and rising demand or transport, particularly by air. Oncebasic durable consumer goods saturate an economy,industrial energy consumption starts to taper o toaround 40–60 percent o total nal energy use, usually
at a GDP per capita o roughly $5,000 (in 1985 prices;Schäer 2005).
Structural change in developed country indus-tries is also linked to product specialization andchanges in international competitiveness arising rom absolute and relative dierences in the costo labour, energy, physical assets and raw materials.Although the textile and leather sector is declin-
ing worldwide, the long-term decline has beenmore rapid in developed countries – as cheaper gar-ments and shoes become available rom developing countries – alling to around 2 percent o MVA by2008 (see Figure 2.9).
Weber (2009) argues that the growing US tradeimbalance in manuactured goods has contributed tostructural change, as more and more goods consumedby Americans are imported rom abroad. Many o these goods are produced by US rms that relocated
production or started sourcing rom abroad. Hecontends that the US economy saved 3 EJ in energybetween 1997 and 2002 as energy use ell in bothdomestic low energy-intensive discrete product sectorsand high energy-intensive process sectors, and rose inimported manuactured products.
Studies o energy use and structural shis in indus-tries in Canada, Norway, Sweden and the UnitedKingdom nd that the energy-price response to the1973 oil crisis was a major determinant o the share
o energy-intensive process sectors in manuacturing (Schipper Howarth and Carlassare 1992; Östblom1982; Gardner and Elkha 1998; Jenne and Cattell1983).
Developing countries. Structural change in developing countries also seems to ollow changes in income, butless than in developed countries because per capitaincomes are lower. Te machinery sector increased itsshare o MVA to 26 percent in 2008 (see Figure 2.9),
while the share o textiles and leather and ood andtobacco combined ell to 25 percent. Energy-intensivesectors such as chemicals and metals increased theirshare to 25 percent. Te combined share in MVAo other process sectors, such as petrochemicals,
Power plantlosses
70 percent
Energy output9.5 units
Fuel energyinput (coal)100 units
T r a n s m
i s s
i o n a n
d d i s
t r i b u
t i o n
l o s s e s
9
p e r c e n
t
M o
t o r l o
s s e s
1 0
p e r c e n
t
D r i v
e t r a i n
l o s s e s
2
p e r c e n
t
P u m p
l o s s e s
2 5
p e r c e n
t
T h
r o t t l e l o
s s e s
3 3
p e r c e n
t
P i p
e l o s s e s
2 0
p e r c e n
t
Figure 2.8
Typical energy losses in energy conversionchains
Ten-old compounding losses
Source: Lovins 2004.

8/2/2019 Unido Full Report eBook
http://slidepdf.com/reader/full/unido-full-report-ebook 68/259
49
T E C hN Ol O GI C A l A ND S T r
U C T Ur A l C hA N GE F Or I ND U S T r I A l E NE r GY E F F I C I E N
C Y
2
“ Structural change in developing
countries also seems to ollow changes in
income, but less than in developed countries
because per capita incomes are lower
Transportequipment
MachineryMetalsNon-metallicminerals
Chemicals andchemical products
PetrochemicalPaper, pulpand printing
Wood andwood products
Textile andleather
Food andtobacco
P e r c e n t
1995–2008
World
Transportequipment
MachineryMetalsNon-metallicminerals
Chemicals andchemical products
PetrochemicalPaper, pulpand printing
Wood andwood products
Textile andleather
Food andtobacco
P e r c e n t
1995–2008
Developed countries
Transportequipment
MachineryMetalsNon-metallicminerals
Chemicals andchemical products
PetrochemicalPaper, pulpand printing
Wood andwood products
Textile andleather
Food andtobacco
P e r c e n t
1995–2008
Developing countries
0
10
20
30
40
50
60
0
10
20
30
40
50
0
10
20
30
Figure 2.9
Share o selected industrial sectors in global manuacturing value added, 1995–2008
Structural change in developed countries generally ollows the global trend
Source: UNIDO 2010g.

8/2/2019 Unido Full Report eBook
http://slidepdf.com/reader/full/unido-full-report-ebook 69/259
50
T E C hN Ol O GI C A l A ND S T r
U C T Ur A l C hA N GE F Or I ND U S T r I A l E NE r GY E F F I C I E N
C Y
2
“ There is enormous potential or improving
energy eciency in all industrial sectors, both
by adopting the best available technologies
and by shiting the technological rontier
non-metallic minerals, and paper, pulp and printing,declined, but the share remains larger than indeveloped countries. Altogether, process sectorsaccounted or 41 percent o MVA in developing economies.
Structural changes in developing countries areheavily inuenced by changes in middle-income andrapidly industrializing economies, as the emerging
middle classes replicate the consumption patternsin developed countries. In Eastern Europe and thecountries o the ormer Soviet Union, 30–40 per-cent o households owned an automobile by themid-1990s, 80 percent a washing machine, and 90
percent a rerigerator (Schäer 2005). In Brazil, shisto a more afuent liestyle and population growthover 1970–1996 contributed to the changing indus-trial structure and energy-use patterns (Wachsmannet al. 2009).
China’s industrial structure, too, reects a largeand growing middle class demanding consumer prod-ucts such as cars. It also reects China’s position as“actory to the world” and its immense inrastructuredevelopment. Exports and investment accounted ormore than 70 percent o GDP in China in the early2000s, and that investment alone accounted or astaggering 43 percent o GDP in 2006 (Kahrl andRoland-Holst 2009). Such investment inuences theindustrial structure as construction increases demand
or cement and steel, and equipment purchases driveup the demand or chemicals and chemical products, petrochemicals, metals and machinery.
As income grows, structural shis in the econo-mies o developing countries will continue to aectindustrial energy intensity, but not in the same
ways. For example, regional climate dierences willaect demand or cooling and heating equipment(Schäer 2005). Countries well endowed with energysources, such as the Russian Federation and some inCentral Asia, wi ll continue to emphasize energy- andmaterial-intensive industries, while countries withlimited space and large populations will developmass transport industries. Low-income developing countries will likely ace an initial stage o structural
change dominated by energy-intensive processindustries.
* * *
Can developing countries use technological changeand ocus on certain sectors to avoid the environmen-tally destructive paths taken by industrial countries
as they developed? Yes, i countries can accelerate thetechnological processes already under way or can shimanuacturing sectors over to “greener pastures.” Asthis chapter demonstrates, there is enormous poten-tial or improving energy eciency in all industrialsectors, both by adopting the best available technolo-gies and by shiing the technological rontier. Whileit may always be necessary to have energy-intensiveindustries globally, individual countries may choosecombinations o sectors with lower energy intensity.
Te International Energy Agency’s (IEA) 2010World Energy Outlook estimates that a reduction inglobal energy intensity o 23 percent over 1980–2008saved 32 percent in energy consumption (5.8 Gtoe;IEA 2010e). Looking orward, IEA (2010a) estimatesseveral scenarios:• A current policies scenario, which takes into
account only policies already ormally adopted andimplemented, anticipates a 28 percent reductionin energy intensity by 2035, or savings o around
6.5 Gtoe in primary energy consumption (2 Gtoerom manuacturing).• A new policies scenario, which assumes imple-
mentation o announced policy commitmentsto reduce greenhouse gas emissions and phaseout ossil energy subsidies, oresees a 34 percentreduction in energy intensity, equivalent to anadditional 1.3 Gtoe in savings over the current
policies scenario.• A 450 scenario, limiting the average global increase
in temperature to 2°C and the concentration o greenhouse gases in the atmosphere to around 450
parts per million o carbon dioxide equivalent, would add 3 Gtoe in savings to the current policiesscenario.

8/2/2019 Unido Full Report eBook
http://slidepdf.com/reader/full/unido-full-report-ebook 70/259
51
T E C hN Ol O GI C A l A ND S T r
U C T Ur A l C hA N GE F Or I ND U S T r I A l E NE r GY E F F I C I E N
C Y
2McKinsey & Company (2007, 2008, 2009) alsoestimates that the growth in global energy demandcould be reduced, rom 2.3 percent a year in the mid-2000s to 0.7 percent a year by 2020 (rom 3.4 percentto 1.4 percent in developing countries), by seizing emerging opportunities to reduce energy intensity.
Improving industrial energy eciency promisesmany well documented environmental, economic and
social benets. But can greater industrial energy e-ciency deliver these benets?
Is a development approach based on industrialenergy eciency sustainable – environmentally, eco-nomically and socially? Chapter 3 examines in detailhow and to what extent industrial energy eciencycan mitigate environmental damage. Chapter 4 shedslight on the protability o improvements in indus-trial energy eciency and on their broader economicand social benets.
Notes
1. Switching to higher quality uel could be anotherdriver, but because the analysis is based on aggre-gate measures o energy consumption, changes inenergy intensity due to uel substitution cannotbe determined (or a discussion on energy qualitysee Cleveland, Kaumann and Stern 2000).
2. Cross-country dierences and long-term trendsin industrial energy intensity are the net result
o a complex mix o causal actors (technologylevel, product mix, comparative advantage inenergy-intensive activities, resource endowment,
population density and climate) that vary consid-erably by country. Similarly, more heavily indus-trial economies will show higher energy intensity
than more service-oriented economies, so a lowerintensity may reect dierent types o economicactivity rather than dierent levels o energy e-ciency within a sector. Tese measurement prob-lems make it dicult to assess the contribution o any one actor to the overall trend.
3. Davis and Caldeira (2010) explore this issue using multiregional input-output analysis to estimate
the carbon embodied in imported and exportedgoods and services.
4. Primary energy is the energy embodied in natu-ral resources beore undergoing any human-madeconversions or transormations; examples are coal,crude oil, sunlight, wind, running water in rivers,
vegetation and uranium.5. Tis percentage reers to member companies o
the International Fertilizer Industry Association.6. Irrespective o whether rst law energy eciency
or exergy eciency is used or the calculation.7. First-law energy eciency is based on the rst law
o thermodynamics, which states that in any closedenergy conversion process, energy can be neithercreated nor destroyed – in other words, any energythat goes in must come out or be accumulated inthe system (See Glossary or more details).
8. Pinch analysis reduces energy consumption inchemical processes by calculating thermodynami-cally easible energy targets (or minimum energy
consumption) and achieving them by optimizing heat recovery systems, energy supply methods and process operating conditions (Kemp 2007). Heat cascading is when heat is used repeatedly in dier-ent applications and its quality (temperature) and
value decrease with successive uses.

8/2/2019 Unido Full Report eBook
http://slidepdf.com/reader/full/unido-full-report-ebook 71/259
52
Industrial development has brought unprecedentedimprovements in standards o living – but at an envi-ronmental cost. Over the years, industrial develop-ment has overexploited natural resources, polluted theair and water, altered the climate and resulted in enor-
mous accumulations o waste rom industrial acilitiesand rom products discarded at the end o their lie ordisplaced by newer models.
Industry does not just contribute to these impacts.It is vulnerable to them as well. Te increased re-quency and intensity o extreme weather events meanthat industry has little choice but to adapt. Mitigating emissions entails increasing energy eciency, switch-ing uels and improving environmental managemento energy equipment and processes. I industry contin-
ues using energy-intensive technologies and deriving its energy rom carbon-intensive sources, the impactson climate and the environment are likely to impedeeconomic and industrial development.
Industrial energy use is a ey lever or
sustainable industrial development
Tus, industrial development must become sustain-able. Tat requires innovative solutions – nationaland global – or minimizing energy consumption,
particularly rom carbon-intensive sources; using resources more eciently; and improving productiv-ity and competitiveness. In tandem with improving energy eciency, industry needs to consider switch-ing energy sources, so that every application uses themost appropriate energy source, which will reducethe environmental impacts o energy use. Optionsinclude switching to uels or energy carriers withlower greenhouse gas intensities (including more useo renewables); expanding the use o heat recovery andrecycling, perhaps by exploiting low-grade heat romenergy and manuacturing processes that would oth-erwise be wasted (or example, by raising low-pressuresteam to drive motor systems); and choosing the rightenergy equipment (or example, replacing compressed
air tools and controls with direct drives and electroniccontrols).
Another complement to increased industrialenergy eiciency is environmental management,because every energy source has environmental
impacts. Minimizing the negative ones means advanc-ing pollution control technologies to reduce or treatcommon emissions rom uel combustion (such as yash, sulphur dioxide and nitrogen oxides). Currenttechnology assessments suggest that achieving deepercuts in carbon dioxide emissions requires carbon cap-ture and storage, which is currently implemented onan industrial scale in only a ew oil elds. Carboncapture and storage works only or large-scale concen-trated carbon dioxide streams such as certain chemi-
cal processes (rening and ammonia, cement, iron andchemical pulp-making). Tere will be trade-os, how-ever. Carbon capture and storage will increase energyuse, especially electricity, and thus reduce overallindustrial energy eciency – indirectly limiting thenet reductions in greenhouse gas.
Increasing industrial energy eciency is thus oneo the oundations or global green industrial devel-opment. By building on proven methods or raising industrial energy eciency, countries begin damp-
ening their environmental impact without slow-ing the growth o their industrial base – reducing air and water pollution, helping businesses improvetheir bottom line and optimizing strained energysystems so that they can continue to meet economicand social needs. Tese environmental, economic andsocial dividends are a “win-win-win” combination or
policy-makers.Chapter 4 reviews the economic and social divi-
dends rom making industry energy more ecient.Tis chapter examines the environmental dividend,looking rst at reducing the environmental impacts o energy use and then at the impacts o materials and
water use on energy eciency. It also considers theneed or better environmental management o energy
Chapter 3
The environmental dividend rom
industrial energy eciency
Section 2 The basis for sustainable wealth creation

8/2/2019 Unido Full Report eBook
http://slidepdf.com/reader/full/unido-full-report-ebook 72/259

8/2/2019 Unido Full Report eBook
http://slidepdf.com/reader/full/unido-full-report-ebook 73/259
54
T hE E NV I r ONME NT A l D I V I D E ND F r OMI ND U S T r I A l E NE r GY E F F I C I E N C Y
3
“ Energy use aects the environment through
emissions, depletion o natural resources,
impacts on nature and landscape, and radiation
though the additional energy to scrub, treat or convert pollutants reduces overall energy eciency. Similarly,switching to cleaner uels can decrease energy e-ciency, so a systems perspective (a lie-cycle assess-ment) is needed to ully consider the environmentalimpacts o energy use.
Energy use aects the environment throughemissions (to air, water and land), depletion o natu-
ral resources, impacts on nature and landscape, andradiation.
Reducing greenhouse gas emissions
Greenhouse gas emissions1 rom human activities havegrown enormously since the Industrial Revolution,rising 70 percent over 1970–2004 alone and 24 per-cent over 1990–2004 (IPCC 2007), with carbondioxide contributing 77 percent o the total in 2004(Figure 3.1; Barker et al. 2007).2
Energy supply is the largest direct source o green-house gas emissions (26 percent), ollowed by indus-try (19 percent), orestry (17 percent), agriculture(14 percent), transport (13 percent) and residential
and commercial buildings (8 percent; see Figure 3.1).Per capita emissions vary widely across economies(Box 3.1).
Te Intergovernmental Panel on Climate Change(IPCC) concluded, in its ourth and most recentassessment, that global climate change is unequivo-cal (IPCC 2007).3 Rising air and ocean temperatures,melting snow and ice and mounting sea levels are
just a ew o the demonstrated impacts. Te warm-ing is a result o changes in atmospheric concentra-tions o greenhouse gases and aerosols, land cover andsolar radiation that have altered the energy balanceo climate systems (the enhanced greenhouse eect;UNEP 2008).
A rise in global mean temperature o morethan 2°C above pre-industrial levels would sharplyincrease risks (IPCC 2007; Smith et al. 2009).Keeping global warming at less than 2°C entails sta-
bilizing atmospheric greenhouse gas concentrationsat around 450 parts per million o carbon dioxideequivalent (CO2-eq).4 Doing that requires at leasthalving global emissions rom current levels by 2050.
Carbon dioxide fromfossil fuel use
57%
Energy supply26%
Industry19%
Forestry
17%
Agriculture14%
Transport13%
Residential and
commercialbuildings
8%
Waste andwastewater
3%
Methane14%
Nitrousoxide8%
Fluorinated greenhouse gases(chlorofluorocarbons,
hydrochlorofluorocarbonsand halons)1%
Emissions by greenhouse gas Emissions by sector
Total emissions =49 gigatonnes of carbon dioxide equivalent
Carbondioxide fromother sources
3%Carbon dioxide from
deforestation anddecay of biomass
17%
Figure 3.1
Global greenhouse gas emissions, by greenhouse gas and sector, 2004
Carbon dioxide emissions account or the largest share o greenhouse gas emissions, and energy supply is the largest source o direct emissions
Source: Barker et al. 2007.

8/2/2019 Unido Full Report eBook
http://slidepdf.com/reader/full/unido-full-report-ebook 74/259
55
T hE E NV I r ONME NT A l D I V I D E ND F r OMI ND U S T r I A l E NE r GY E F F I C I E N C Y
3
“ Emissions have been rising in
emerging maret economies and alling
in more advanced economies
In 2009, fote st time since 1992, tee was no
gowtin gobacabondioxideemissionsfomfossi
fueuse,cementpoductionandcemicaspoduction.
Te2008ceditcuncdovemanydeveopedcounties
intoecessionandedtoa7pecent(800miiontonne)
dopinteicombinedcabondioxideemissions.Tis
decinecompensatedfote continuingstongisein
emissionsindeveopingcounties,sucasCina(9pe-cent)andIndia(6pecent).Tetopsixemittingecono-
miesin2009,togeteaccountingfosometwo-tids
ofcabondioxideemissions,weeCina,teUnited
States, teEU-15,India, terussian Fedeation and
Japan.
Tetop25emittingeconomiesaccountedfomoe
tan80pecentoftotaemissions,witagevaiations
inpecapitaemissionsandemissionspeunitofGDP
(seegue).Emissionsavebeenisinginemegingma-
keteconomiesandfainginmoeadvancedeconomies.
Since1990,pecapitacabondioxideemissionsneaytipedin Cina(fom2.2tonnesto6.1)butdopped13
pecentinteEU-15(fom9.1tonnesto7.9)and12pe-
centinteUnitedStates(fom19.5tonnesto17.2).
Carbon dioxide emissions in the top 25 emitting economies in 1990 and 2009
Source: Olivier and Peters 2010.
Box 3.1
Trends in carbon dioxide emissions
Carbon dioxide emissions per capita
Australia
United States
Canada
Saudi Arabia
Korea, Rep.
Russian Federation
Taiwan Province of China
Netherlands
Germany
Japan
United Kingdom
South Africa
EU-15
Iran
Poland
Spain
Italy
Ukraine
China
France
Mexico
Thailand
Brazil
Indonesia
India
Carbon dioxide emissions per unit of GDP
Tonnes of carbon dioxide per capita
0 5 10 15 20 0 500 1,000 1,500 2,000
Developing economies
1990
2009
Developed economies
1990
2009
Developing economies
1990
2009
Developed economies
1990
2009
Tonnes of carbon dioxide per unit of GDP

8/2/2019 Unido Full Report eBook
http://slidepdf.com/reader/full/unido-full-report-ebook 75/259
56
T hE E NV I r ONME NT A l D I V I D E ND F r OMI ND U S T r I A l E NE r GY E F F I C I E N C Y
3
“ Extracting energy and processing it into uel
are major sources o emissions to land and water
Tis ambitious endeavour must begin now. Majorshis in liestyles, massive investment in energy e-ciency and low-carbon energy supply, and a transor-mation in how land and orests are managed are allon the agenda to avoid an increased risk o irreversi-ble, catastrophic impacts. Industry will have to adaptto greater weather variability, more requent andintense extreme weather events, and greater exposure
to coastal storm surges.Developing countries, more exposed to climate
hazards and less resilient, would be hit hardest bythe economic and social impacts o climate change.Tey are projected to bear some 75–80 percent o the costs o damages induced by climate change(Box 3.2; UNFCCC 2007a). Warming o 2°C could
permanently reduce annual income per capita anestimated 4–5 percent in Arica and South Asia.Te estimated losses or high-income countries are
smaller, dropping the global annual average lossin income per capita to about 1 percent (WorldBank 2010c).
Reducing other emissions
Fossil uel combustion or industrial use and powergeneration emits other pollutants that do not contrib-ute to climate change, including:• Oxides o nitrogen and sulphur, which contribute
to acid rain.• Particulate matter or soot, which damages pulmo-
nary and cardiovascular systems.• Metals, including mercury, arsenic, beryllium,
cadmium and nickel, which pose grave risk to theenvironment and human health.
• Unintended combustion products, including dioxins and urans, which are persistent organic
pollutants.Additional pollutants are emitted in processing,
rening, cleaning, transporting and distributing liq-uid, solid and gaseous uels, including volatile organiccompounds (contributing to photochemical smog
and ozone ormation on the ground) and methaneand carbon dioxide (greenhouse gases; see Box 3.3).Mining and processing ossil and nuclear uels are
Teimpactsofcimatecangewidiffemakedywitin
andacossegions.Asia,foexampe,wiwamabove
tegobameanexceptintesouteast.Pecipitationis
ikeytodeceaseinCentaAsiabutinceaseesewee,
witmoefequentintensepecipitationinSoutandEast
Asia;moefequent,ongeandmoeintenseotspesin
EastAsia;andmetingsnowandiceintehimaayasand
teTibetanPateau,geatyeducingowsinmajoAsian
ives.TeSmaIsandDeveopingStatesaeexpected
toexpeienceesswamingtantegobaaveagebut
inceasingyintensetopicacycones,stomsuges,coa
beacingandoods.
Manyeastdeveopedcountiesaepaticuayvu-
neabetoteimpactsofcimatecange,asevidencedby
pesistentunseasonaweatepattensinAfica.
In Etiopia, cimate vaiabiity is not new, but its
effectsavebeenexacebatedbyumanactivities.Te
mean annua tempeatue as inceased about 1.3°C
since1960, andteannua minimum tempeatueasisenabout2.0°Csince1951.Asaesut,ainsaeaiving
ate,witdiminisedvoumeduingtemainainyseason.
Moeainisfaingduingextemeweateevents(eavy
ains,stoms,dougts),oodingandeodingfetieands
andteateningavests,foodsecuity,jobsandincome.
Extemeweateeventscanwipeoutwoecopsandte
infastuctuefoavesting,stoageandpocessing.
InCameoon,temeanannuatempeatueasisen
0.7°Csince1960,witevengeateinceasesintenot.
Teeaefewecodnigts,especiayatigeatitudes,
somosquitoestive–asevidencedbymaaia’secent
ising pevaence, boosting medicacosts andeduc-
ingpoductivityandquaityofife.Astempeatuesise,
agicutuapoductivityandfoodsecuityaepojected
todecineinaeadymaginaaeas.Dependingonte
cimate scenaio, agicutua poductioncoud decine
$5–$20biionannuayby2100.Wiemeanannuape-
cipitationispojectedtoemainstabe,tesaefaing
duingextemeweateeventsisikeytoise.Aeady,a
agesaeofainisfaingintetaditionaydyseason(DecembetoMac),affectinggowingseasons.
Source: UNFCCC 2007a; UNDP 2008; World Bank 2007.
Box 3.2
Climate change aects regions dierently
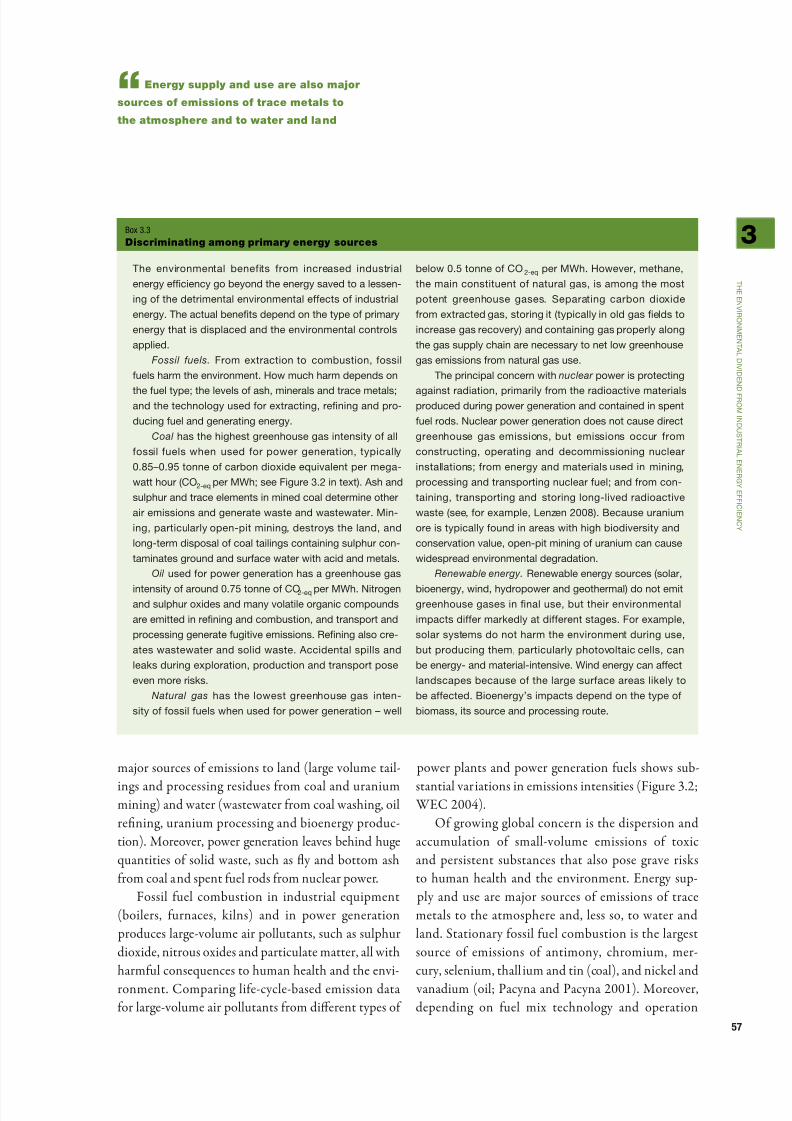
8/2/2019 Unido Full Report eBook
http://slidepdf.com/reader/full/unido-full-report-ebook 76/259
57
T hE E NV I r ONME NT A l D I V I D E ND F r OMI ND U S T r I A l E NE r GY E F F I C I E N C Y
3
“ Energy supply and use are also major
sources o emissions o trace metals to
the atmosphere and to water and land
major sources o emissions to land (large volume tail-ings and processing residues rom coal and uraniummining) and water (wastewater rom coal washing, oilrening, uranium processing and bioenergy produc-tion). Moreover, power generation leaves behind hugequantities o solid waste, such as y and bottom ashrom coal and spent uel rods rom nuclear power.
Fossil uel combustion in industrial equipment(boilers, urnaces, kilns) and in power generation
produces large-volume air pollutants, such as sulphurdioxide, nitrous oxides and particulate matter, all withharmul consequences to human health and the envi-ronment. Comparing lie-cycle-based emission dataor large-volume air pollutants rom dierent types o
power plants and power generation uels shows sub-stantial variations in emissions intensities (Figure 3.2;
WEC 2004).O growing global concern is the dispersion and
accumulation o small-volume emissions o toxicand persistent substances that also pose grave risksto human health and the environment. Energy sup-
ply and use are major sources o emissions o tracemetals to the atmosphere and, less so, to water andland. Stationary ossil uel combustion is the largestsource o emissions o antimony, chromium, mer-cury, selenium, thallium and tin (coal), and nickel and
vanadium (oil; Pacyna and Pacyna 2001). Moreover,depending on uel mix technology and operation
Te envionmenta benefits fom inceased industia
enegyefciencygobeyondteenegysavedtoaessen-
ingoftedetimentaenvionmentaeffectsofindustia
enegy.Teactuabenetsdependontetypeofpimay
enegytatisdispacedandteenvionmentacontos
appied.
Fossil uels. Fom extactionto combustion, fossi
fuesamteenvionment.howmucamdependsontefuetype;teevesofas,mineasandtacemetas;
andtetecnoogyusedfoextacting,eningandpo-
ducingfueandgeneatingenegy.
Coal asteigestgeenousegasintensityofa
fossifueswen used fopowe geneation,typicay
0.85–0.95tonneofcabondioxideequivaent pemega-
wattou(CO2-eqpeMW;seeFigue3.2intext).Asand
supuandtaceeementsinminedcoadetemineote
aiemissionsandgeneatewasteandwastewate.Min-
ing,paticuayopen-pitmining,destoysteand,and
ong-temdisposaofcoataiingscontainingsupucon-
taminatesgoundandsufacewatewitacidandmetas.
Oil usedfopowegeneationasageenousegas
intensityofaound0.75tonneofCO2-eqpeMW.Nitogen
andsupuoxidesandmanyvoatieoganiccompounds
aeemittedineningandcombustion,andtanspotand
pocessinggeneatefugitiveemissions.reningasoce-
ateswastewateandsoidwaste.Accidentaspisand
eaksduingexpoation,poductionandtanspotpose
evenmoeisks.
Natural gas asteowest geenousegas inten-
sityoffossifueswenusedfopowegeneation–we
beow0.5tonneofCO 2-eqpeMW.howeve,metane,
temainconstituentofnatuagas,isamongtemost
potent geenouse gases. Sepaating cabon dioxide
fomextactedgas,stoingit(typicayinodgasedsto
inceasegasecovey)andcontaininggaspopeyaong
tegassuppycainaenecessaytonetowgeenouse
gasemissionsfomnatuagasuse.
Tepincipaconcenwit nuclear poweispotectingagainstadiation,pimaiyfomteadioactivemateias
poducedduingpowegeneationandcontainedinspent
fueods.Nuceapowegeneationdoesnotcausediect
geenouse gasemissions,but emissions occu fom
constucting, opeating and decommissioning nucea
instaations;fomenegyandmateiasusedin mining,
pocessingandtanspotingnuceafue;andfomcon-
taining, tanspotingand stoingong-ivedadioactive
waste(see,foexampe,lenzen2008).Becauseuanium
oeistypicayfoundinaeaswitigbiodivesityand
consevationvaue,open-pitminingofuaniumcancause
widespeadenvionmentadegadation.
Renewable energy. renewabeenegysouces(soa,
bioenegy,wind,ydopoweandgeotema)donotemit
geenousegasesinnause,butteienvionmenta
impactsdiffemakedyatdiffeentstages.Foexampe,
soasystemsdonotamteenvionmentduinguse,
butpoducingtem,paticuaypotovotaicces,can
beenegy-andmateia-intensive.Windenegycanaffect
andscapesbecauseofteagesufaceaeasikeyto
beaffected.Bioenegy’simpactsdependontetypeof
biomass,itssouceandpocessingoute.
Box 3.3
Discriminating among primary energy sources

8/2/2019 Unido Full Report eBook
http://slidepdf.com/reader/full/unido-full-report-ebook 77/259
58
T hE E NV I r ONME NT A l D I V I D E ND F r OMI ND U S T r I A l E NE r GY E F F I C I E N C Y
3
“ Resource depletion is a particular concern
or primary energy rom non-renewable
resources, both ossil and nuclear uels
and maintenance conditions, combustion processes produce such persistent organic pollutants as dioxins
and urans, which are associated with a wide range o harmul health eects.
Slowing down natural resources depletion
Sustainable development depends on saeguarding adequate supplies o natural resources or today andtomorrow. Fossil uels, ores, ood, bres, water andother materials extracted or harvested or industry,agriculture and construction include ecosystem ser-
vices (basic services provided by the natural environ-ment that support human lie). Tese services includea stable climate, resh water and air, assimilationo waste and emissions, pollination and protectionagainst diseases (Hawken, Lovins and Lovins 1999;MEA 2005).
Resource depletion is a particular concern or pri-mary energy rom non-renewable resources, both ossil
and nuclear uels (Ayres 2010). Te ratio o reserves to production (proved reserves divided by current annual production),5 though commonly interpreted as thenumber o years current production levels can be main-tained rom current proved reserves, can be used as a
proxy indicator. At the end o 2010, reserves to pro-duction ratios were 46 or oil, 59 or natural gas and118 or coal (BP 2011). With production expected toincrease to meet soaring global energy demands, theratios would decline. Eventually, production rates areexpected to all as reserves are depleted. But working inthe opposite direction are improvements in energy e-ciency, greater use o non-ossil energy and improvedextraction technology. Discovery o new sources o os-sil uels would also delay resource depletion.
NuclearWindTreeplantation
Hydro,river
Hydro,reservoir
Solarphoto-voltaic
Naturalgas
(combinedcycle)
Heavyfuel oil
CoalLignite NuclearWindTreeplantation
Hydro,river
Hydro,reservoir
Solarphoto-voltaic
Naturalgas
(combinedcycle)
Heavyfuel oil
CoalLignite
NuclearWindTreeplantation
Hydro,river
Hydro,reservoir
Solarphoto-voltaic
Naturalgas
(combinedcycle)
Heavyfuel oil
CoalLignite NuclearWindTreeplantation
Hydro,river
Hydro,reservoir
Solarphoto-voltaic
Naturalgas
(combinedcycle)
Heavyfuel oil
CoalLignite
T o n n e s p e r g i g a w a t t h o u r
Carbon dioxide
K i l o g r a m s p e r g i g a w a t t h o u r
Nitrous oxides
Sulphur dioxide
Particulate matter
K i l o g r a m s p e r g i g a w a t t h o u r
K i l o g r a m s p e r g i g a w a t t h o u r
Minimum Average Maximum
0
250
500
750
1,000
1,250
1,500
0
1,000
2,000
3,000
4,000
5,000
6,000
0
500
1,000
1,500
2,000
2,500
0
250
500
750
1,000
9,800
Figure 3.2
Variability in lie-cycle emissions o principal air pollutants rom electricity generation, 2004
Lie-cycle emissions o large-volume pollutants vary greatly across primary energy sources or electricity generation
Source: WEC 2004.

8/2/2019 Unido Full Report eBook
http://slidepdf.com/reader/full/unido-full-report-ebook 78/259
59
T hE E NV I r ONME NT A l D I V I D E ND F r OMI ND U S T r I A l E NE r GY E F F I C I E N C Y
3
“ New ossil uel reserves are oten
inerior to existing sources, with
higher levels o contaminants
Numerous analysts orecast a peak ollowed bya decline in global oil production within the nextdecade – worrisome, because the world relies almostexclusively on oil as a transport uel (Box 3.4). Oil andoil-derived products are already losing importance asan industrial energy source, a trend likely to accelerate.
As ossil uel reserves in current production sitesare exhausted, production will move to less avour-
able reserves. New oil elds are typically much smallerand located deeper in oceans, urther rom shore orin more ecologically vulnerable areas (such as sensi-tive arctic and maritime environments). An exampleis Petrobras’s recent oil discovery in Brazil’s SantosBasin, located 10 kilometres below the ocean suraceunder dense layers o salt. Extracting the oil will betechnically challenging and economically and envi-ronmentally expensive, likely resulting in higher emis-sions than current industry averages (Ayres 2010).
Te 2010 Deepwater Horizon oil spill in the Gul o Mexico is a stark reminder o the risks and challengesassociated with developing production rom reservesin more demanding environments.
New ossil uel reserves are oen o inerior qualityto existing sources, with higher levels o contaminants.
Tis is maniested in higher levels o carbon dioxide ingas elds (requiring co-development o carbon captureand storage), o sulphur in crude oil and o ash andtrace elements in coal and non-conventional resourcessuch as oil sands. echnology is available to produceand process high-quality uels rom such lower qual-ity reserves, but doing so uses more energy and causesmore pollution.
Energy use also depletes other natural resources.Power stations and energy-intensive industries dependon large volumes o water to discharge residual heatand maintain sae operating conditions. Te heat-absorbing capacity o water bodies (rivers, lakes,coastal zones) is limited by the need to maintain tem-
peratures that can sustain local ecosystems. Bioenergydepends on harvesting biomass, which needs to besustainably cultivated to prevent overharvesting ordeclining soil ertility.
Lessening other environmental impacts
Energy supply and use also aect the environmentthrough physical interventions, mainly large-scalealterations in landscapes or seascapes, to build energyacilities (mines, oil elds, renery and processing
Wit te easiyecoveabe oi esevessinking, te
enegyandcostsofextactingandpocessingoifom
oteesevesaeisingfast.Teenegyetunonenegy
investedfooidiscoveedinte1930sand1940swas
about110(110unitsofenegypoducedfoeveyunitof
enegyusedtopoduceit).Tatvauepungedto23fooi
poducedinte1970sandto8fooidiscoveedintat
decade.Fueequivaentto12.5pecentoftenewoiad
tobeusedtodiscove,di,eneand distibuteit.Fo
deepwateoiandeavyoi,teenegyetunonenegy
investmentisabout10.
Te“endofoi”maynotbejustaoundtecone,
butpeak output may begin faing inas itte as5 –15
yeas,entaiinganunpaaeediskandnanciaman-
agementpobems.Astepeakappoaces,iquidfuepicesandpicevoatiitywiincease,andwitouttimey
mitigation,teeconomic,sociaandpoiticacostswi
beextensive,especiayfodeveopingcounties.hige
oipicestansfeincomefomoiimpotestooiexpot-
esandsoweconomicgowt.Fooiimpotes,ige
piceseducenationaincomebecauseinceasedspend-
ingonoieducestefundsavaiabefootegoodsand
sevices.higeoipicesasoeadtoisingpoduction
costsfogoodsandsevicesandcancontibutetoina-
tionandunempoyment,educedemandandowecapita
investment–causinginteestatestoiseastaxevenues
faandbudgetdecitsincease.Teageteoipice
ikeandteongeitasts,teaseteimpact.
Adaptingtodeciningoipoductionandigepices
wibeadefodeveopingcounties,wicaveaim-
itedabiitytoswitctoatenativefues.higeoipices
can destabiizetade baancesand inceaseination,especiay in counties wit undedeveoped financia
institutions.
Source: Cleveland et al. 1984; Ayres 2010; Hirsh, Bezdeg and Wendling 2005.
Box 3.4
Coping with the anticipated pea in oil production

8/2/2019 Unido Full Report eBook
http://slidepdf.com/reader/full/unido-full-report-ebook 79/259
60
T hE E NV I r ONME NT A l D I V I D E ND F r OMI ND U S T r I A l E NE r GY E F F I C I E N C Y
3
“ Improved materials and water fows
in manuacturing processes are ey levers
or raising industrial energy eciency
plants, wind or photovoltaic arms, and hydropowerdams) and distribution inrastructure (pipelines andterminals). Once a local ecosystem is destroyed, it canseldom be returned to its previous state, though some
progress has been made in restoring ecosystems aermining and in shutting down obsolete plants andinrastructure. And seldom does the harm stay local.Micro-climate and hydrology changes, ecosystem rag-
mentation and degradation, reduced ood security andloss o aesthetic, cultural and heritage values all canextend ar beyond immediately aected areas.
Nuclear and ionizing radiation – primarily romnuclear power plants with their uel supply and waste-uel disposal, but also on a smaller scale rom ossil uelcombustion – pose considerable risks to human healthand ecosystems. Te risks o nuclear radiation includecell death, genetic damage, radiation burn, cancersand reproductive system disorders. Many radioactive
nuclides result rom nuclear reactions in power plants.Some nuclides are short-lived, but others remain unsaeor millennia. Additional nuclear radiation occursthrough the release into the environment o naturallyoccurring radioactive materials rom ossil uel com-bustion. A related concern is ionizing radiation, whichcreates unstable atoms that harm living organisms.
Improving industrial energy eciency
by reducing materials and water use
Much o the environmental impact o materials and water use is determined by the energy required totransorm materials into products; to extract, processand supply materials and water; and to manage theresultant waste streams. All inputs carry hidden owso energy, materials and water in their production, a
process captured in the concept o embodied energy,materials and water.
Improving materials and water fows
As a simplied physical input-output analysis shows,energy and materials and water use are interrelated inindustry. Energy, materials and water carriers entera plant, and (under laws o conservation o mass)equal amounts leave the plant as product or as waste,
efuent or emission. Part o the input is incorporatedin the product, part is consumed in delivering a unc-tion to the (intermediate) product or the process (suchas cleaning) and the rest is dissipated (or wasted). Boththe consumed and dissipated ractions exit as a non-
product output or as emissions to land, water or air.he correlations between process energy con-
sumption and the quality and volume o material
and water use, manuacturing eciency and productspecications dier by industrial enterprise. But ruleso thumb apply to positive or negative correlations.Figure 3.3 shows some common actors contribut-ing to lower process energy requirements and so toimproved industrial energy eciency. For water, lowerconsumption and higher purity are associated withlower energy use, as less water has to be processed(pumped, heated, evaporated, cooled) and treated(such as ltered).
Improved materials and water ows in manuac-turing processes are key levers or raising industrialenergy eciency. An example is the Colombian coilmanuacturing company that changed its manuactur-ing processes to reduce water use and eliminate waste-
water (Box 3.5). Ceramics is another example, withseveral leverage points. One is the quality o the clay
Input energyFuels
• High quality/fit for purpose
Electricity
• Power quality
• Stability of supply
Input materialsProduct
• High quality
• Low volume
Auxiliaries
• High quality/fit for purpose
• Low volume
Non-product outputs• Ability to use, recycle
or recover water, energy
or materials
Manufacturing process• Ambient conditions (temperature, pressure, and the like)
• High yield
• Limited process steps
Input water• Low volume
• High quality/fit
for purpose
Product output• Low volume
• Low weight
• Large product runs
• Product specifications
matching expected use
Figure 3.3
Factors generally contributing to loweringprocess energy requirements
Processes with low throughputs o t-or-purpose inputs have betterindustrial energy eciency
Source: UNIDO.

8/2/2019 Unido Full Report eBook
http://slidepdf.com/reader/full/unido-full-report-ebook 80/259
61
T hE E NV I r ONME NT A l D I V I D E ND F r OMI ND U S T r I A l E NE r GY E F F I C I E N C Y
3
“ By selecting and sourcing materials with
lower embodied energy, industries improve
the energy eciency o their value chains
and its preparation; purer clay mixtures can be bakedat much lower temperatures, reducing energy use byup to 40 percent. A second is product design: some
potteries have trimmed material use by as much as 20 percent per item, with comparable savings in energyconsumption. A third is the material handling system,
which can be improved to reduce stress on products(less breakage) and maximize product throughput inthe oven. Loading increases o 10 percent are typical,translating into similar savings in energy consumption
per item. aking advantage o all three leverage pointscould reduce energy use in ceramics production by upto 55 percent.
Reducing embodied energy, materials and
water
Embodied energy is the cumulative amount o com-mercial energy (ossil, renewable, nuclear) investedto extract, process and manuacture the material or
product and transport it to its point o use (grossenergy requirement). Tis accounting concept sumsthe energy physically embodied in the materials (whichcan be released by reversing the process) and the energyinvested in creating the processing conditions andbringing the materials together (including transport).
hus, even beore input resources reach their point o use, they have already had environmentalimpacts related to the energy used to extract, processand transport them. Embodied energy is thus a proxyor the total environmental impact in supplying theinput to a company. It does not, however, accountor the varying environmental impacts o dierent
primary energy sources (such as ossil or renewable
uels; see Box 3.3). Improving downstream materialsand water eciency can lead to upstream energy sav-ings and lower environmental impacts. For example,treating and transporting potable water can requirerom 2.88 megajoules o energy per cubic metre to17.64, depending on treatment method (Vince et al.2008). Embodied energy is approximately 35.30 mega-
joules per kilogram (MJ/kg) or steel and 218 MJ/kg or primary aluminium (Hammond and Jones 2008).Similarly, the packaging used in transporting materi-
als also has energy use impacts (or example, polypro- pylene has an embodied energy o 95.4 MJ/kg).
By selecting and sourcing materials with lowerembodied energy, industries improve the energy e-ciency o their value chains. Recovering and recycling materials is typically less energy intensive than pro-ducing primary materials, especially or metals, sousing recycled instead o primary materials can yieldenergy savings. For example, embodied energy is 28.8MJ/kg or recycled aluminium and 218 or primary
aluminium (Hammond and Jones 2008).From a lie-cycle perspective, using materials with higher embodied energy can make sense i thatsaves energy in other phases o the product lie-cycle.Consider vehicle weight in the transport sector.Tough light materials have higher embodied energy,using less energy during the use phase yields lie-cycleenergy savings. Lie-cycle assessment shows that aera car has driven 200,000 kilometres, every kilogramo aluminium used in car parts in place o steel saves190–210 MJ o primary energy and reduces green-house gas emissions by 15–16 kg CO2-eq (IAI 2008).
Embodied materials and water (gross materialrequirement and gross water requirement) are thetotal amounts o materials and water used, directly
Aceos Industiaes, a medium-size meta woking
companyinMedein,Coombia,tansfomssteebas
into cois. A $640,000 investment ed to $500,000
inannua savings fom owecemicas, wateand
enegy use; inceased poductivity and impoved
poductquaity.Aceosswitcedfomcemicape-
teatmentusingotcausticsoutionstodymecani-capeteatment,educingwateuseby8,000cubic
metes a yea and tus educing wastewate and
sudge(peviousy60tonnesannuay,disposedofas
azadouswaste).Tecompanywasabetoetieits
boieandstopusinggasandfueoi.Wieeecticity
consumptionose,tenetenegyandgeenousegas
emissionsbenetsemainedsubstantia,atsome400
tonnesofcabondioxideequivaentayea.
Source: CNPML 2005.
Box 3.5
How a Colombian metal woring company savedenergy by reducing wastewater and chemicals

8/2/2019 Unido Full Report eBook
http://slidepdf.com/reader/full/unido-full-report-ebook 81/259
62
T hE E NV I r ONME NT A l D I V I D E ND F r OMI ND U S T r I A l E NE r GY E F F I C I E N C Y
3
“ Slowing the increase in the harmul impacts
o industrial production on the environment
requires boosting industrial energy eciency
and indirectly, to extract, process and manuacturean input (product, good, or water or energy ow) andtransport it to its point o use. Tey include hiddenows without economic value, which can be assumedto have ended up as waste or wastewater upstream inthe supply chain. wo indicators o material ows arematerials intensity per service unit (total materials userelative to a unctional unit o product service) and
materials intensity (materials use relative to a physi-cal unit o use o a material or energy carrier; Rittho,Rohn and Liedtke 2002).
Since materials and water consumption are prox-ies or environmental pressures or a range o impactsassociated with materials and water use, embodiedmaterials and water can be used as indirect proxies o the total environmental impact o the use o materialsand energy. However, doing so ignores the large di-erences in environmental impacts across alternative
materials and dierent water sources as well as the potential or recycling aer use.
Awareness o embodied materials and water hasspurred interest in dematerialization – getting more
valuable product out o the same or ewer mate-rial resources (Geiser 2001; ADB and IGES 2008).Focused initially on reducing the direct and indirect(embodied) materials weight o products, demateriali-zation oers wider benets through lowering embod-ied energy and greenhouse gas emissions. Approaches
include redeveloping or redesigning production pro-cesses and products through light-weighting, reducing waste in production, leasing and sharing goods andequipment, introducing take-back systems and recov-ering end-o-lie goods.
Maing industry more energy ecient
Slowing the increase in the harmul impacts o industrial production on the environment requiresboosting industrial energy eiciency. How mucho a boost is needed to make industry sustainable(both in total environmental impact and per capitaor per unit o economic activity), however, remainsuncertain. With the stakes so high, it would be wiseto err on the side o caution. Te global community
must do as much as possible to reduce environmental pressures. Otherwise, the rapid maniestation o theimpacts o climate change (IPCC 2007), the alarm-ing decline in ecosystem services (MEA 2005) andthe ongoing deposition o heavy metals and othertoxic materials in the environment will only worsen,
while ossil uel production might soon peak, start-ing with oil.
Tere are several entry points or reducing indus-trial energy intensity and total energy requirements(see Chapter 2). One is by using more energy-ecientequipment, process designs and systems. Another is byimproving energy management systems. In addition,optimizing and minimizing materials and water owscan have spin-o benets or energy eciency andoverall productivity.
Te spotlight is on industrial energy eciency indeveloping countries. In 2008, energy-related green-
house gas emissions in developing countries or theirst time exceeded those in developed (Annex I)countries (IEA 2010a), a result o a 2 percent declinein developed countries and a 6 percent increase indeveloping countries.
Taking a lie-cycle perspective
he environmental impacts o industrial energyuse dier across energy sources (see Box 3.3). Directimpacts arise during energy use in industrial processes,
while indirect impacts result rom the production andsupply o the energy used by industry (such as at powerstations in the case o industrial electricity consump-tion). Lie-cycle assessment extends the traditionalocus on production sites and manuacturing pro-cesses to the entire lie-cycle o a product to accountor all environmental, social and economic impacts(Box 3.6).
Reducing greenhouse gas emissions
Te climate eects o greenhouse gas emissions will persist or centuries (Archer and Brovkin 2008).Industry and construction globally contribute almost37 percent o total greenhouse gas emissions romossil uel use and industrial processes, directly rom

8/2/2019 Unido Full Report eBook
http://slidepdf.com/reader/full/unido-full-report-ebook 82/259
63
T hE E NV I r ONME NT A l D I V I D E ND F r OMI ND U S T r I A l E NE r GY E F F I C I E N C Y
3
“ Each process in industrial energy use has
environmental, economic and social impacts that
depend on the type o energy and technology used
life-cyceassessmentquantiesteuseofmateiasand
enegyandtegeneationofwasteandemissionsineac
stageofapoduct’sife-cyce,appyingtesamemet-
odsusedfomateiasandenegyowanaysisandba-
ancesatteunitopeationeve.Mateiasandenegyuse
andwasteandemissionsaesummedandinkedtotei
envionmenta impactcategoies foowing estabised
intenationastandads(ISO14041–14043).Tisesutsincumuativeenvionmentaimpactestimatesfoeaccat-
egoy(sucasesoucedepetion,gobawamingand
ecotoxicity)tatcaninpincipebefuteweigtedand
cacuatedasaggegateenvionmentaindices.
Tefoowinggueappiesife-cyceassessmentto
industiaenegyuse.Industiaenegyuseisintefoe-
gound,indicatingtattedesign,opeationandpefo-
mance ofindustia pocesses ae unde acompany’s
diect contoand ave diect envionmenta impacts.
Tesepocessesequiefuesandenegycaies(eec-
ticity,steam,compessedai),wicaepovidedbyuti-
itysystemsattepant(sucascompessosandboies)
oaesoucedfomenegysuppies.Tefuestoun
teseutiitysystemscomefomenegysuppiesofom
pimayenegycoectedonsite(sucassoaeatingo
cooingandwindpowegeneation).
Teenegysuppysystemfomstebackgound.
Itsopeationandpefomanceaeoutsideteimmedi-
atecontoofanypaticuamanufactuingmandave
indiectupsteamenvionmenta impacts.Te systemcovespimayenegyextaction,poductionof com-
meciafues(petoeumening,gaspocessing,coa
wasing)andenegyconvesiontopoweandsteam.It
asoincudesenvionmentacontosfoteatingwastes
andemissions.Additionaindiectdownsteamenvion-
mentaimpactsmayaisefomteatingodisposingof
teemissionsandwastefomenegyuse.Eacpocess
inindustia enegy useasenvionmenta,economic
andsociaimpactstatdependontetypeofpimay
enegyused,teequiednaenegysevice,tetec-
noogyavaiabeandteassociatedopeation,manage-
mentandpanning.
Lie-cycle o industrial energy use
Cabonfootpinting,aspeciaizedappicationofife-
cyceassessment focusingexcusivey on cabon emis-
sions,isgainingecognitionasameansofquantifyingdiect
andindiectgeenousegasemissions.Itcanbeappiedtocompanies,poducts(incudingenegysuppyoptions)
andconsumptionpattens.TeWodresoucesInstitute,
incoaboationwitteWodBusinessCouncifoSus-
tainabeDeveopment,asdeveopedpotocos,metods
andsecto-speciccacuatostoestimateentepise-eve
cabonemissions(www.ggpotoco.og).CompementingteeffotisteIntenationaOganizationfoStandadiza-
tion’spoduct-evecabonfootpintstandad(ISO14067).
Source: Guinée et al. 2002; UN EP 2005; ISO 1997a,b, 1999a,b.
Box 3.6
Lie-cycle assessment and carbon ootprinting
Upstream indirectenvironmental impacts
Directenvironmental impacts
Downstream indirectenvironmental impacts
Foreground (industry)
Background (upstream
environmental supply)
Primary energyextraction
Fuelproduction
On-site primaryenergy collection
Plant utilitysystems
Manufacturedprocesses
Environmentalmanagement
Environmentalmanagement
Power (andsteam generation)
Background (downstream
environmental management)
Energy emissions and waste (slag, residues)
Energy emissions and waste
Fuels
Renewableenergy Energy carriers (electricity,
steam, compressed air, and the like)
Power/steam

8/2/2019 Unido Full Report eBook
http://slidepdf.com/reader/full/unido-full-report-ebook 83/259
64
T hE E NV I r ONME NT A l D I V I D E ND F r OMI ND U S T r I A l E NE r GY E F F I C I E N C Y
3
“ In 2004, emissions o all greenhouse gases
rom the industrial sector accounted or nearly
25 percent o global greenhouse gas emissions
on-site uel use and processes and indirectly throughemissions rom power generation or industry andconstruction (IEA 2010a).
In 2004, emissions o all greenhouse gases rom theindustrial sector accounted or an estimated 12 giga-tonnes (Gt) CO2-eq, nearly 25 percent o global green-house gas emissions (Bernstein et al. 2007; Figure 3.4).Some 9.9 GtCO2-eq (83 percent) o total industrial
greenhouse gas emissions originated rom energy use,up rom 6 GtCO2-eq in 1971. Direct emissions totalled5.1 GtCO2-eq, and indirect emissions associated withthe generation o electricity and heat and steam bythe power sector but used by industry accounted orthe rest o industrial energy-related emissions in 2004(Bernstein et al. 2007).
Industry also emits carbon dioxide rom non-energy sources (rom chemical and metallurgical
processes), mainly rom cement and lime produc-
tion. hese non-energy carbon dioxide emissions were estimated at 1.7 GtCO2-eq or 2004 (Bernsteinet al. 2007).
Industry emits other greenhouse gases too,including luoroorm rom the manuacture o rerigerant (HCFC-22); peruoro compounds romaluminium smelting and semiconductor process-ing; sulphur hexauoride rom the manuacture o at panel screens (liquid crystal displays) and semi-conductors, magnesium die casting, electric equip-
ment and aluminium melting; and methane andnitrous oxide rom chemical industry sources andood industry waste. Emissions rom these sources
were estimated at 0.4 GtCO2-eq in 2004 (Bernsteinet al. 2007).
In addition to energy supply and use, industryinuences greenhouse gas emissions by using servicesrom other greenhouse gas–emitting sectors. In 2004,transport accounted or emissions o 6.3 GtCO2-eq (13.1 percent o total global emissions; Ribeiro et al.2007). As in 2000, reight transport accounted or anestimated 43 percent o the total energy use and green-house gas emissions rom transport (WBCSD 2001).Industry’s contribution to emissions rom transportand waste management (Bogner et al. 2007) can be
estimated at 2–3 GtCO2-eq a year, raising industry’scontribution to global greenhouse gas emissions to14–15 GtCO2-eq a year, or around 30 percent o globalemissions.
In 2004, seven sectors accounted or 76 percent o global industrial greenhouse gas emissions (Baumert,Herzog and Pershing 2005): chemicals and petro-chemical (23 percent), cement (18 percent), iron and
steel (15 percent), non-errous metals (7 percent),machinery (5 percent), ood and tobacco (5 percent),and paper, pulp and printing (5 percent). Fossil uelcombustion (direct emissions) contributed 49 per-cent; electricity and heat consumption (indirect emis-sions), 35 percent; process carbon dioxide emissions,10 percent; and high–global warming potential gases,6 percent. Many sectors emit greenhouse gases romboth energy and process sources. New process tech-nologies have been applied in some sectors to conserveenergy and minimize process-related greenhouse gasemissions; the chemical sector in India is an example(Box 3.7).
Based on world energy data and production datain key sectors, the International Energy Agency
Direct energy
carbon dioxide
43%
Total emissions =
12 gigatonnes carbon dioxide equivalent
Indirect energy
carbon dioxide
40%
Non-energy
carbon dioxide
14%
Non–carbon dioxide greenhouse gases
3%
Figure 3.4
Breadown o all greenhouse gas emissionsrom the industrial sector, 2004
Energy use caused some 83 percent o industrial greenhouse gas
emissions in 2004
Source: Bernstein et al. 2007.

8/2/2019 Unido Full Report eBook
http://slidepdf.com/reader/full/unido-full-report-ebook 84/259
65
T hE E NV I r ONME NT A l D I V I D E ND F r OMI ND U S T r I A l E NE r GY E F F I C I E N C Y
3
“ In developing countries, manuacturing
and construction contribute nearly hal o
carbon dioxide emissions rom direct uel
combustion and imports o electricity and heat
(IEA 2009c) estimated industry’s direct contribu-tion to global carbon dioxide emissions through os-sil uel use and process emissions at 7.2 Gt in 2006,up rom 6.8 in 2004 (Bernstein et al. 2007 based on
IPCC data). According to the same IEA study, indus-try also caused indirect emissions o 3.4 Gt o carbondioxide in 2006 through electricity supply, lower thanthe more comprehensive IPCC estimate o 4.8 Gtin 2004. In 2006, iron and steel, cement and chemi-cals caused nearly three-quarters o industry’s directcarbon dioxide emissions (Figure 3.5). Te group o OECD countries and China each contributed 34
percent to the direct carbon dioxide emissions romindustry.
he IEA estimated carbon dioxide emissionsrom ossil uel consumption at 29.4 Gt in 2008(IEA 2010a). OECD countries contributed 12.6Gt (43 percent) and non-OECD countries 15.7 Gt(53 percent); the remainder came rom international
marine and aviation bunkers. By economic sector,electricity and heat generation is the largest emit-ter, contributing 41 percent o global emissions (40
percent or OECD countries and 45 percent or
non-OECD countries; Figure 3.6). ransport isthe second largest contributor globally (22 percent)and or OECD countries (27 percent), while indus-try and construction is the second largest in non-OECD countries (26 percent). Globally, industryand construction is the third largest contributor (20
percent). However, when emissions rom electricityand heat generation are allocated to end users, theemission contributions o industry and constructionrise to 37 percent globally (27 percent or OECDcountries and 47 percent or non-OECD countries;IEA 2010a). In developing countries, industry andconstruction thus contribute nearly hal o carbondioxide emissions rom direct uel combustion andimports o electricity and heat.
Ankeswa Industia Estate in Gujaat State, one of
India’scemicacustes,ousesmoetan500smaand
medium-sizecemicapoducessuppyingtepama-
ceutica,veteinay,fetiize,pesticideanddyestuffsectos.
UNIDOsuppotedtecemicaindustiesassociationand
teGujaatCeanePoductionCenteinidentifying,tans-
feingandadaptingceanetecnoogiesappopiatefo
tescaeandtypeofcemicapocesses.Teeexampes:• Aboutadozenindustiesmanufactuebenzoicacid
deivativesbyoxidizingtouenedeivatives.Tepo-
cesseeases281tonnesofnitousoxideannuay,o
77,500tonnesofcabondioxideequivaent(CO 2-eq )a
yea.Anewpocesstecnoogytateiminatesnitous
oxideemissionsasbeendeveoped,basedoncata-
yticoxidation.Itpomisestoeduceemissionsneay
98pecent,to1,762tonnesCO2-eqayea.Moeove,
tenewpocessisessenegyintensive,avoidingfu-
teenegy-eatedcabondioxideemissions,sotat
tenetgeenousegaseductionamountsto88,498
tonnesCO2-eqayea.
• Some40tagetindustiesmanufactuedyes,dugs,
pigments,intemediatesandotecemicas–fo
wicteyuseabout400tonnesofsupuicacid
aday–andpoduceaound2,000tonnesadayof
diuted,spentsupuicacid.Tisacid,neutaized
wit ydated ime o imestone,poduces53,950
tonnesayeaofCO2-eqandamost85,000tonnes
ayea ofsoid wastecontaminated wit oganics,
eavymetasandcoides.Anewpocessecoves
supuicacidfoeusebyindustiesandavoidste
needfodisposainands.Tisnewpocesswoudeducenetgeenousegasemissions41pecent,to
ougy22,108tonnesCO2-eqayea,andtecemi-
caecoveyisanetenegypoduce,poviding1,500
kiowattousadayinsupuspowe.
• hazadouswastegeneatedinteAnkeswaIndus-
tiaEstateisincineated,emittingsupudioxide,
nitogenoxide andtaceamounts ofnitous oxide
andpotentiaysucpesistentoganicpoutantsas
dioxinsandfuans.Fyandbottomasaeasopo-
ducedandequieteatmentandanddisposa.A
newwasteteatmentbasedonpasmatecnoogy
geneatesnopesistentoganicpoutants,educes
uegasesandgeneatesnosecondaysoidwaste.
Supuseecticityandsteamcanbetansfeedto
neigbouingindustiesotegid.
Source: UNIDO 2010b.
Box 3.7
Integrated clean technology solutions in India

8/2/2019 Unido Full Report eBook
http://slidepdf.com/reader/full/unido-full-report-ebook 85/259
66
T hE E NV I r ONME NT A l D I V I D E ND F r OMI ND U S T r I A l E NE r GY E F F I C I E N C Y
3
“ The largest carbon dioxide emitters are iron
and steel and chemicals by sector, and electricity
and heat generation by economic activity
China34%
OECDNorth America
13%OECDEurope
12%
OECDPacific
9%
Economiesin transition
9%
Otherdeveloping
Asia7%
Africa andMiddle East
7%
India5%
Iron and steel30%
Cement26%
Chemicals17%
Aluminium 2%
Pulp and paper 2%
Other23%
Latin America4%
Emissions by sector Emissions by region or country
Total emissions =7.2 gigatonnes of carbon dioxide equivalent
Figure 3.5
Share o direct industrial carbon dioxide emissions rom ossil uel use and industrial processes, bysector and region or country, 2006
Three sectors generate more than 70 percent o industrial carbon dioxide emissions, and China and OECD countries are now on par in industrial emissions
Source: IEA 2009c.
0
10
20
30
Non-OECDOECDWorld0
10
20
30
Non-OECDOECDWorld
B i l l i o n s
o f t o n n e s
o f c
a r b o n
d i o x i d e
Direct emissions(energy carbon dioxide)
B i l l i o n s
o f t o n n e s
o f c
a r b o n
d i o x i d e
Total emissions(energy carbon dioxide after end-use allocation of electricity and heat)
Electricity and heat generationOther energy industriesIndustry and constructionTransportOther sectors
Other energy industriesIndustry and constructionTransportOther sectors
Figure 3.6
Contributions to carbon dioxide emissions rom ossil uel combustion, by economic sector, 2008
Electricity and heat generation and industry and construction are major emitters o carbon dioxide rom ossil uel consumption
Source: IEA 2010a.

8/2/2019 Unido Full Report eBook
http://slidepdf.com/reader/full/unido-full-report-ebook 86/259
67
T hE E NV I r ONME NT A l D I V I D E ND F r OMI ND U S T r I A l E NE r GY E F F I C I E N C Y
3
“ Industry can switch to cleaner
production processes that use less material
and water. And savings are possible in
transport and waste management
The mitigation potential is
substantial
Cross-cutting and industry-wide technologies (suchas ecient motor and steam systems, cogenerationand energy recovery); inter-industry opportunities(such as reuse o waste heat or by-products by otherindustries); process-specic technologies; and mate-rials and products with lower embodied energy can
yield major environmental dividends. Large energysavings are also possible by using ewer raw materi-als and less water. Eorts to boost industrial energyeciency are closely associated with the quantityand quality o raw materials and water used in plantsbecause the energy used in manuacturing is propor-tional to the quantity o these inputs. Industry canswitch to cleaner production processes that use lessmaterial and water. And savings are possible in trans-
port and waste management. Industry emits some 25
percent o greenhouse gases worldwide and is a majoruser o natural resources, so the mitigation potentialis substantial.
* * *
Tis chapter explored how and to what extent indus-trial energy eiciency can mitigate environmentaldamage. Chapter 4 considers the proitability o improvements in industrial energy eciency and their
broader economic and social benets.
Notes
1. Te United Nations Framework Convention onClimate Change covers six direct greenhousegases: carbon dioxide, methane, nitrous oxide,hydrouorocarbons, peruorocarbons and sul-
phur hexauoride.2. Tis chapter uses estimates rom dierent sources
or dierent periods. Estimates dier because o
uncertainties, dierent base years and dierentmethods. Energy statistics (especially on the envi-ronmental impacts) are an evolving science.
3. As public debate over the science, impacts andcosts o climate change have intensiied, theIPCC has come under heightened scrutiny aboutits impartiality regarding climate policy and theaccuracy and balance o its reports. An independ-ent review o the 2007 ourth assessment report(Climate Change 2007 ) ound reason or concerns
about the accuracy and interpretation o somedata, but it concluded that the overall assessment
was well supported by the uncontested evidenceavailable (IAC 2010).
4. Greenhouse gas emissions, weighted by their 100- year global warming potential, are expressed incarbon dioxide equivalents (CO2-eq).
5. Proved reserves are those that geological and engi-neering inormation show have a high (typicallymore than 90 percent) probability o being pro-
duced. Data on the global production and provedreserves o ossil uels are available rom severalsources, including the BP Statistical Review o World Energy (BP 2011).
8/2/2019 Unido Full Report eBook
http://slidepdf.com/reader/full/unido-full-report-ebook 87/259
68
Improving industrial energy eciency is essential orhelping supply-constrained developing and emerg-ing market economies meet rising demand and ordecoupling economic growth and environmental deg-radation. While rms may not be driven exclusively by
prot motives, the market demands that investmentsachieve competitive rates o return.
Investment involves risk and thereore the expecta-tion o returns that will minimally compensate or the
probability o loss. Te higher the anticipated return,the more attractive the investment. Investment can
yield other returns as well, not just economic. Greaterindustrial energy eciency can provide benets tocompanies and societies in the orm o new employ-ment, higher income, and better health, working con-
ditions and quality o lie.Tis chapter examines the underlying econom-
ics o industrial energy-eciency investments roma micro-economic perspective, starting with energycosts at the industry and rm levels. It explores therisks associated with such investments, the nanci-er’s take on these risks compared with those o otherinvestments, and evidence on the protability andother economic and social benets o the investment.Finally, it explores the technical potential or urther
improvements in industrial energy eiciency andnotes that many protable green investment opportu-nities go unrealized.
The importance o energy costs to
businesses
Business prots depend on the dierence betweensales revenues and input costs. Sales revenues can beincreased in the short run by raising output or priceand in the long run by installing new and more pro-ductive capacity. Te ability to modiy output andboost prices depends on the industry’s structure andcompetitive characteristics. In competitive markets,rms tend to be price takers. Costs include capital,labour and intermediate inputs (materials and energy).
Costs can be reduced in the short run by optimiz-ing production methods, using cheaper inputs andimproving materials and energy use eciency and inthe long run by introducing new equipment.
While all costs need to be minimized, managers
have limited time and so ocus on expenses that makeup the largest proportion o total costs.1 Tus, manag-ers are more likely to invest in industrial energy e-ciency when energy constitutes a large share o costs.A rm’s energy costs depend on the energy intensity o the production process, the prices o dierent energycarriers and the eciency with which energy is used in
production and auxiliary operations such as buildingsand warehouses.
Investments in energy-ecient technologies entail
estimating the size and timing o a project’s incomeand outlays and choosing among investment options.Estimates need to actor in technical, environmen-tal, economic and political considerations that varyover time and that are uncertain and diicult tomeasure. In many developing countries, investmentdecisions are constrained by structural deciencies,limited inrastructure, volatile operating conditionsand shortages o physical, human and institutionalresources.
How energy costs vary
Industrial energy costs vary considerably by levelo industrialization, sector and rm. Energy costsinclude the energy used to power production processesand to generate heat, light and power. In principle,energy costs exclude the outlays or ossil uels usedas raw materials in the production process, such asoil and coke eedstock in the petrochemical and steelindustries, but many countries do not report theseseparately.
Which sectors have the highest proportion o energy costs in total input costs (able 4.1)? opping the list are process sectors such as rened petroleum(uels, lubricants, chemical eedstock) and nuclear
Chapter 4
The economic and social dividends
rom industrial energy eciency

8/2/2019 Unido Full Report eBook
http://slidepdf.com/reader/full/unido-full-report-ebook 88/259
69
T hE E C ON OMI C A ND S O C I A l D I V I D E ND S F r OMI ND U S T r I A l E NE r GY E F F I C I E N C Y
4
“ Greater industrial energy eciency can
provide benets to companies and societies in
the orm o new employment, higher income, and
better health, woring conditions and quality o lie
uel, non-metallic minerals (ceramics, cement, glass),basic metals (aluminium, copper, iron, steel), andchemicals and chemical products (ertilizers, plas-tics). Rened petroleum and nuclear uel’s 61.6 per-cent share is way ahead o the others, largely becausethe industry practice is to include raw materials inenergy costs. Ratios in other process sectors average3.9–11.8 percent. Tese sectors share several economiccharacteristics. Tey are capital- and skill-intensiveand pay above-average wages because o the largeinvestments in equipment. Economies o scale andcapacity use are the main determinants o protability,
with plants normally running continuously, 24 hoursa day, 365 days a year. Inputs account or the largest
proportion o production costs. And output tends tobe homogeneous.
By contrast, average energy cost ratios are lower,at 0.7–3.2 percent, or discrete product sectors suchas oce and computing machinery (computers and
peripherals, communication equipment), machineryand equipment (power and machine tools, generaland special purpose, agriculture and industrial equip-ment), electrical machinery (motors, electrical equip-ment, and appliances), radio and television (consumer
Sector All
countriesDevelopedcountries
Developingcountries
Group o largedevelopingcountriesa
Process sectors
Rened petroleum and nuclear uelb 61.6 59.4 70.6 68.4
Non-metallic minerals 11.8 7.2 12.7 6.5
Basic metals 7.3 5.8 8.3 9.9
Chemicals and chemical products 3.9 4.9 3.5 10.0Discrete product sectors
Other transport equipment 3.2 1.3 5.6 2.4
Fabricated metal products 2.4 2.5 2.4 5.1
Machinery and equipment 2.0 1.4 2.7 4.0
Medical and optical instruments 1.8 1.3 3.0 1.7
Electrical machinery and apparatus 1.5 1.7 1.4 2.2
Radio and television 1.4 1.2 1.6 1.3
Motor vehicles 1.1 1.0 1.6 1.2
Oce and computing machinery 0.7 0.6 2.0 0.9
Combined sectors
Rubber and plastic products 5.3 3.4 6.8 7.8
Paper, pulp and printing 3.2 3.6 2.9 4.0
Wood products 3.0 2.4 3.5 4.2
Textile and leather 3.0 2.3 3.3 2.5
Food and tobacco 2.3 1.7 2.5 1.9
Non-specied industry 2.0 1.3 2.8 3.2
Total 12.3 6.1 17.5 8.9
Excluding rened petroleum 3.6 2.5 4.3 4.8
Note: Includes energy costs or 50 countries. For methodological details, see Upadhyaya (2010).
a. Brazil, China, India, the Russian Federation and South Arica.
b. For most countries, includes total energy costs, including energy used or raw materials. Including these costs distorts the energy cost ratios or this sector. All developed countries in the
sample use this method o accounting or energy costs, but ew developing countries do. To make comparisons meaningul, the values or developing countries were recalculated to refect the
energy cost o raw materials.
Source: UNIDO 2010e,.
Table 4.1
Share o energy costs in total industry input costs, by sector, latest available year (percent)

8/2/2019 Unido Full Report eBook
http://slidepdf.com/reader/full/unido-full-report-ebook 89/259
70
T hE E C ON OMI C A ND S O C I A l D I V I D E ND S F r OMI ND U S T r I A l E NE r GY E F F I C I E N C Y
4
“ Topping the list o sectors with the highest
share o energy costs in total input costs are
process sectors such as rened petroleum, non-
metallic minerals, basic metals and chemicals
electronics) and motor vehicles (passenger and com-mercial vehicles, parts, accessories). (However, somesubsectors, such as oundry operations, have highenergy intensity.) Tese sectors produce high-volumeoutput and requently use automated, multistage pro-duction processes. Tey are capital- and skill-inten-sive, equipment accounts or the largest share o pro-duction costs and scale economies are important or
protability.Between the two are combined sectors, which share
the technological and economic characteristics o pro-cess and discrete product sectors. Tese sectors haveaverage energy cost ratios o 2.0–5.3 percent. Teyinclude rubber and plastic products (tyres, build-ing material, consumption plastics), paper, pulp and
printing (cardboard, newspapers and books), wood products (plywood, construction goods and urni-ture), textile and leather (textiles, shoes and clothing)
and ood and tobacco (processed meat and vegetables,dairy products and beverages).
Te group o large developing countries (Brazil,China, India, the Russian Federation and SouthArica) spends the largest share o input costs on energy(4.8 percent), more than all developing countries as a
whole (4.3 percent). Developed countries spend theleast (2.5 percent). Te share o energy costs in totalcosts averages 65 percent higher in developing coun-tries than in developed countries. Such comparisons
also need to consider technological and productiondierences within a sector. For example, Mexico’s steelsector is based on direct reduction o iron ore, whereasthe United States increasingly uses electric urnacesto melt scrap (Ayres 2010). Also, developed countries
produce more nished goods than do developing coun-tries, so the value added is higher. Comparisons alsoneed to consider dierences in labour costs.
How energy prices vary
Tough not as inuential as technological and eco-nomic processes in determining the volume o energyinputs, energy’s share in total costs is also determinedby the price o energy and other inputs. Coal and oil,the main uel sources, are traded internationally, and
power generation technologies are airly standard, sothe price o energy should not vary widely across coun-tries. Yet it does.
ake natural gas. Although prices in the Gul countries are quite similar, prices in Qatar are morethan double those in Saudi Arabia. Te price o gas inrinidad and obago, a major producer and exportero liqueed natural gas, is nearly 7 times that in Saudi
Arabia – Japan and the Republic o Korea pay morethan 10 times as much.
Or consider electricity. he price o electricitysupplied to industries in Europe varies greatly: in2005, Italy paid 14 eurocents per kilowatt hour whileGermany paid 7 (Eurostat n.d.). Although electric-ity prices have tracked rapidly rising uel costs, largedierences persist across countries, even or rms o similar size (Figure 4.1). In the United States in 2008,there were dierences in the price o electricity o up
to 50 percent in the pulp and paper industry and o up to 40 percent between the paper and pulp sectorand the aluminium industry (Koc and Kaplan 2007;IEA 2009c).
Moreover, energy prices dier across sectors even within the same country. In Germany in 2000, theimplicit energy price was 2.5 times greater in themachinery sector than in the ood and tobacco sec-tor (Figure 4.2).2 In Tailand in 2006, the equiva-lent ratio was 10 times higher. In general, in most
countries, energy-intensive sectors pay less per unit o energy consumption.
What accounts or energy price variation?
Both economic and policy actors account or these variations in energy prices. Te economic actors relateto energy supply and demand. Price, or instance, isinuenced by the share o dierent energy sourcesused. It also depends on the load actor o the powergenerator. Energy taris uctuate with the cost o theuels used in the energy mix and other costs associated
with energy production and distribution. Te timing o electricity purchase agreements also aects price,since energy taris or large users are usually governedby long-term electricity contracts.

8/2/2019 Unido Full Report eBook
http://slidepdf.com/reader/full/unido-full-report-ebook 90/259
71
T hE E C ON OMI C A ND S O C I A l D I V I D E ND S F r OMI ND U S T r I A l E NE r GY E F F I C I E N C Y
4
“ Both economic and policy actors account
or the wide variations in energy prices
Natural gas, 2007 Electricity, 2005 and 2009
Korea, Rep.
Japan
United Kingdom
Belgium
Germany
United States
Canada
India
Trinidad and Tobagoa
Russian Federation
Qatar
Iran
Libya
Oman
Saudi Arabia
Slovakia
Germany
Latvia
Hungary
Czech Republic
Bulgaria
Lithuania
United Kingdom
Poland
Croatia
Estonia
Romania
Index (Saudi Arabia = 1) Eurocents per kilowatt hour
0 42 6 8 10 0 642 8 10 12
2005
2009
Figure 4.1
Price dierentials in natural gas and electricity
Big dierences in what countries charge or natural gas and electricity
a. Liqueed natural gas.
Note: Price in selected gas-producing countries.
Source: Saygin et al. 2009.
Note: Includes non-manuacturing rms.
Source: Eurostat.
Germany, 2000 Thailand, 2006
0
100
200
300
0.00
0.03
0.06
0.09
I m p l i c i t e n e r g y p r i c e i n d e x ( f o o d
a n d t o b a c c o =
1 0 0 ) E
n e r g y
c o s t a s
a s h
a r e o f t o t a l i n p u t c o s t ( p e r c e n t )
Implicit energy price indexEnergy costs
0
300
600
900
1,200
0.00
0.04
0.08
0.12
0.16
I m p l i c i t e n e r g y p r i c e i n d e x ( f o o d
a n d t o b a c c o =
1 0 0 ) E
n e r g y
c o s t a s
a s h
a r e o f t o t a l i n p u t c o s t ( p e r c e n t )
Implicit energy price indexEnergy costs
N o n - s p e c i fi e
d ( i n d u s t r y )
T r a n s p o r t e q u
i p m e n t
M a c
h i n e r y
M e t a l
s
N o n - m e t a l l i c m
i n e r a l s
C h e m i c a l s a n d c h e m i c a l p r
o d u c t s
P a p e r , p
u l p a n d p
r i n t i n g
W o o d
a n d w
o o d p r o d u c t s
T e x t i l e a n d
l e a t h e
r
F o o d
a n d t o b a c c o
N o n - s p e c i fi e
d ( i n d u s t r y )
T r a n s p o r t e q u
i p m e n t
M a c
h i n e r y
M e t a l
s
N o n - m e t a l l i c m
i n e r a l s
C h e m i c a l s a n d c h e m i c a l p r
o d u c t s
P a p e r , p
u l p a n d p
r i n t i n
g
W o o d
a n d w
o o d p r o d u c t s
T e x t i l e a n d
l e a t h e
r
F o o d
a n d t o b a c c o
Figure 4.2
Implicit energy prices and energy costs in Germany and Thailand, by sector, 2000 and 2006
Some sectors pay more or energy than others
Source: Adapted rom Upadhyaya (2010).

8/2/2019 Unido Full Report eBook
http://slidepdf.com/reader/full/unido-full-report-ebook 91/259
72
T hE E C ON OMI C A ND S O C I A l D I V I D E ND S F r OMI ND U S T r I A l E NE r GY E F F I C I E N C Y
4
“ Investments in new plants and production
technologies generally result in major savings in
energy consumption and costs as well as gains
in production eciency and product quality
Policy actors aecting energy prices include subsi-dies, taxes and regulations. In many developing coun-tries energy markets are still heavily controlled i notdirectly in government hands. Governments oen useenergy taxes to enhance revenue. In 1987, the Chinesegovernment raised electricity taris by two cents perkilowatt hour (the “two-cent policy”) or all non-residential uses except or some electricity-intensive
industries (Hang and u 2007; Wang, Qiu and Kuang 2009). Te extra revenue went to nance power plantconstruction.
Riss and rewards o investing in
industrial energy eciency
Many industrial energy-ecient improvements are aby-product o investments undertaken or other rea-sons and that improve overall productivity. Investmentsin new plants and production technologies generally
result in major savings in energy consumption andcosts as well as gains in production eciency and prod-uct quality. Te extent o energy savings rom suchinvestments may be dicult to gauge, though there isreason to believe that they can be substantial.
But how do managers decide whether to investin dedicated energy-eciency projects – investments
with the primary purpose o improving energy e-ciency (and hence or which only energy savings arerelevant)? Te company’s energy cost and the complex-
ity o the project are major determining actors.Figure 4.3 classies investment projects on twodimensions: importance o energy costs and projectcomplexity (Kleindorer 2011). Te greater the com-
pany’s relative energy costs (measured as the ratio o energy costs to the total cost o goods sold), the largerthe potential payos and the greater the attentionmanagement is likely to give to saving energy. Projectcomplexity includes operational, technical, organiza-tional and contractual complexity. Te larger the num-ber o external parties (or example, i unique expertiseor equipment is required and is available only romspecialist companies), the more dicult the coordina-tion and the higher the transaction costs.3 For highenergy-cost industries, critical projects are likely to be
more directly aligned with company operations, so thecompany will already have project-relevant expertiseto oversee or implement the project.
Quadrant 1 projects are low energy-cost andhigh-complexity and are rarely implemented becausethe high transaction costs usually exceed the modestenergy savings. An exception could be the bundling byan outside partner o many small projects o similar
technology or exceptionally attractive rates o return.Quadrant 2 projects are high energy-cost and high-
complexity in energy-intensive companies. Te projectsgenerally require multiple organizational providersand sophisticated contracting and nance guarantees.Examples include investments in new kiln technolo-gies in cement companies and uel-switching projectsin pulp and paper plants. Unlike new inrastructure
projects and power plants, whose rate o return maybe guaranteed by the government or by major private
operators (or example, through build, own, operateand transer contracts), these large industrial energy-eciency projects require separate measuring o pro-
ject benets in advance. Contracting against these ben-ets can raise the cost o capital (Box 4.1).
Low
Energy costs as share of company’scost of goods sold (percent)
High
L o w
H i g h
O r g a n i z a t i o n a l a n d c o n t r a c t u a l c o m p l e x i t y o f t h e p r o
j e c t
Internal expertiselacking: need to useexternal suppliers;
verifiable contractualconditions cannot bespecified in advance
Subcontracting ofproject execution requiredbecause of technical
requirements or technologyused; performance-based
contracting essential
Internal expertiseavailable or project hasdemonstrated energy-
efficiency impacts usingknown approaches and
equipment
Large payoffs fromenergy-efficiency projectsusing existing capabilities;
energy efficiency integratedwith strategic plan and
operational metrics for thefocal company
21
43
Figure 4.3
Criteria or maing energy-eciency projectdecisions
Source: Kleindorer 2011.

8/2/2019 Unido Full Report eBook
http://slidepdf.com/reader/full/unido-full-report-ebook 92/259
73
T hE E C ON OMI C A ND S O C I A l D I V I D E ND S F r OMI ND U S T r I A l E NE r GY E F F I C I E N C Y
4
“ Energy-eciency projects need to be
subjected to both nancial and ris analysis
Quadrant 3 projects are low energy-cost and low-complexity and are generally simple and straightorward
with proven technologies and low cost, such as ecientlighting. Implemented by the company or by a local util-ity as part o a demand-side management programme,such projects would include no- and low-cost operationsand maintenance measures that could be implementedinternally. Examples are installing better meters, xing
leaking steam pipes and reducing use o compressedair. Companies can task their engineering and acilitymaintenance divisions to develop portolios o energy-eciency projects to help meet company cost and energytargets. Te central impediment is generally not risk butenergy cost savings too small to appeal to management.
Quadrant 4 products are high energy-cost and low-complexity and may include projects in energy-intensivesectors using internal capabilities to implement proven
technologies, such as using new uel sources in cementor electric power. When these projects are or specicmodular purposes, use existing technology and are pro-
vided by suppliers with a good track record, they arelow in complexity and risk. Projects would typically beone-on-one deals, with major suppliers selling demon-strated solutions and with built-in risk mitigation andnancial guarantees (Box 4.2).
Economic easibility – evaluating a
project’s nancial worth
Any investment decision also has inancial consid-erations. Energy might be a large cost, but all prot-able possibilities or reducing it might already havebeen explored or transaction costs might be too high.Conversely, energy costs might be small, but there couldbe promising investment opportunities or improving
TehigvedCopoation’sTansaoysmanganeseaoy
smeteenegy-efciencypojectinMpumaangaPov-
ince,SoutAfica,iustatesaig-compexitypoject
inaigenegy-intensivecompany.Tepojectwasto
etotTansaoys’vefunaceswitneweecticacfu-
naces,incudingeatedcontoandpeipeasystems.
Tepojectwasexpectedtoeduceeecticityconsump-
tionpetonneofaoypoduced,witsavingsfomowe
eecticityconsumptionandowecabondioxideemis-
sions.(MostofSoutAfica’seecticpowecomesfom
coa-edpants.) Acombinationofsubsidizedenegypices,foeign
excangeiskandpoduction-yieduncetainty,togete
witenegy’scentaityinmanganese aoypoduction,
madetepojectaig-intensity,ig-compexity–and
ig-isk–poject:
• Low electricity prices. Steadyinceasesinsubsidized
eecticitypicesceateduncetaintyovewete
piceswoudcontinuetoise.Picesweepojectedto
emainow,educingteincentivesfosavingeectic
powe.
• High investment cost. Totainitiainvestmentcostfo
etottingavefunaceswasaound$17.5miion.
Annuasavingsineecticityandopeationsandmainte-
nancecostsweepojectedat$2.4miion.Evenifsuc
savingsinenegyandmaintenancecostscontinued,
tepojectwasnotconsideednanciayattactive.
• Uncertainty in market prices and exchange rates.
Wetetepojectinceasesoutputdependsonte
maketpicefotesiicomanganeseaoy,wicwas
sodintogobamaketsatdoa-basedpices.Tis
wasanunsettingpospect,giventeageupfont
investmentcost.
• Uncertainty on yields, technical conditions and main-
tenance costs. FunacesaecentatoTansaoy’s
poductionpocess,addinguncetaintiesinetottingtooteequipment,astisnotawaysguaanteed.
higved eceived additiona funding toug te
KyotoPotoco’sCeanDeveopmentMecanism(wic
aowsig-incomecountiestoinvestinemissioneduc-
tionsindeveopingcountiestomeetteiownemission
eductiontagets),andtepojectwasaunced.Apo-
jectevauationconsevativeyestimatedsavingsofmoe
tan500,000tonnesofcabondioxideoveteifetimeof
tepoject(appoximatey50,000tonnesayeaove10
yeas).Vauedatteowendofexpectedcabondioxide
picesin teEUmaket(aound€15pe caboncedit),
annuacabonevenueswoudamounttoanote$0.6–
$1.0miionayea,enougtodivetepojectsoidyinto
teback.
Source: Kleindorer 2011.
Box 4.1
Weighing a high-complexity–high energy-cost project in South Arica

8/2/2019 Unido Full Report eBook
http://slidepdf.com/reader/full/unido-full-report-ebook 93/259
74
T hE E C ON OMI C A ND S O C I A l D I V I D E ND S F r OMI ND U S T r I A l E NE r GY E F F I C I E N C Y
4
“ Investment riss may vary with the country,
sector, business and technology and over time
energy eciency. Tus, energy-eciency projects needto be subjected to both nancial and risk analysis.
Standard nancial procedures are used to evaluatethe economic easibility o energy-eciency projectsby estimating the net monetary eects o a project’s
costs and benets over its useul lie. Te costs includecapital outlays, operating and maintenance expendi-tures and costs associated with downtime. Te pri-mary benet is lower energy costs, but there may beadditional savings on materials and other inputs, withco-benets such as improved reliability. Tree com-mon evaluation techniques are simple payback, returnon investment and net present value.
Simple payback is the time in years or cumulativecash ow (net benets) to equal the project’s capitalcost. Tis method measures the time it takes a pro-
ject to pay or itsel. For example, or South Arica’sHighveld Corporation’s $17.5 million investmentthat returns $2.4 million a year (see Box 4.1), paybackis 7.5 years. Oen, small projects are evaluated solely
on their initial capital outlays and cost savings. Short payback periods make projects attractive investments,and many rms are reluctant to invest in projects with
paybacks longer than two or three years. However,this cut-o varies widely by company and project size(Brealey, Myers and Allen 2008).
Te more elaborate evaluation methods, returnon investment and net present value, take the time
value o money into account. Tey compare a project’s worth with that o other investments (including no-risk nancial instruments). Return on investment isthe discount rate that equates the value o estimateduture cash ows (net benets) arising rom an invest-ment with the initial capital outlay. Net present valueis the value o the uture cash ows (discounted at aset rate) minus the initial capital outlay. High returnon investment or net present value makes investment
projects attractive. Depending on the company and
the investment size and risk, industrial projects arecommonly required to have returns on investment o 15–30 percent to be considered attractive. HighveldCorporation’s internal rate o return was only 10 per-cent (see Box 4.1), making the project only marginallyattractive (Brealey, Myers and Allen 2008).
The risk actor in industrial energy-
eciency investment decisions
High discount rates or energy-eciency investments
and the rejection o particular energy-ecient tech-nologies may be rational responses to risk. Stringentinvestment criteria are appropriate when there aredoubts about whether a business will survive in com-ing years. Risk may arise rom overall economic trends(ination and interest rates), potential changes in gov-ernment policy, trends in input and output markets(or example, uel and electricity prices), nancing risk(such as the anticipated reaction o capital marketsto increases in borrowing) and technical risks associ-ated with individual technologies (or example, unre-liability; Sorrell et al. 2004). Tese risks might varyby country, sector, business and technology and overtime. Kleindorer (2011) identies three main risk cat-egories: technical, external and business.
TeDongyingSengdongEnegyManagementCom-
pany(DSEMC)inCinainstaspowegeneatosfo
industiacients,sucasCinesesteepantsandcoa
mines,usingwastegasfomteseopeations(tat
woudotewisebeaedoeeasedtoteatmos-
pee)toopeateeecticpowegeneatos.Tepowe
geneatedepsmeetteeecticitydemandoftecompanypovidingtewastegas,wieseingexcess
eecticpoweintotegidgeneatesadditionaev-
enues.Teseae ow-compexityand ig enegy-
intensitypojects.
Teyaeowcompexitybecausepucasingcom-
paniesenjoyone-stopsopping.DSEMCinstaste
geneato,negotiatescontactswitteocaeectic-
itysuppieandopeatestegeneato.Ittenses
teeecticpowegeneatedwittewastegasback
totecompanyatmaked-downpices,seingany
excesstotegid.Watmakestisawin-winindustia
enegy-efciencypojectfoenegy-intensivecompa-
niesisteconvesionofotewisewastedenegyinto
avauedenegysteam.
Source: Kleindorer 2011.
Box 4.2
Weighing a low-complexity–high energy-costproject in China

8/2/2019 Unido Full Report eBook
http://slidepdf.com/reader/full/unido-full-report-ebook 94/259
75
T hE E C ON OMI C A ND S O C I A l D I V I D E ND S F r OMI ND U S T r I A l E NE r GY E F F I C I E N C Y
4
“ While some companies might also be driven
by environmental and social responsibility
concerns, they still need to nd a solid economic
rationale or energy-ecient investments
echnical risk is associated with technology andits relation to the industrial process. Most companies
want to avoid any interruption o the core produc-tion process, unless it can be aligned with a scheduledshutdown. wo dimensions underlie these uncertain-ties: the perceived uncertainty o the technology itsel and the compatibility o the new technology withthe production process. I the new technology is per-
ceived to be unreliable, the risk o breakdowns anddisruptions might outweigh any potential benetsrom reduced energy costs. Such risks are associated
with new and unamiliar technologies, which is whygovernment-unded demonstration programmes aimto increase condence and disseminate inormationand awareness o these technologies. echnical riskis usually higher in developing countries (especiallyleast developed countries) than in developed coun-tries because there is less technical support or new
technologies.External risk is associated with multiple uncertain-
ties about economic trends, government policy, andenergy and other prices – all actors that individualcompanies cannot inuence. Consider a metal work-ing company in Colombia, which switched its ur-naces rom electric power to natural gas in 2001, whengas prices were low (De Simone 2010). Tis changelater became a source o concern as the price o naturalgas was expected to increase about 30 percent by 2011.
Although uncertainty about uture energy pricesis oten perceived as a barrier to energy- eiciencyinvestments, it can also be an incentive. When pricesdo not increase as much as expected (or even decrease),investment earnings all short. But when energy pricesrise, so do costs savings.
Business risk is related to the uncertainties asso-ciated with shiing course. Companies tend to berisk-averse and avoid switching to a new strategy thatis raught with uncertainty (Bremmer et al. 2007).
When a company is doing well, investments may beattractive, but bad results can make a company cutback on investments, particularly non-core invest-ments such as energy eciency. Upper managementmight see the potential or substantial cost reductions
but still give such investments a low priority when
sales volumes all.Te standard approach to energy project valuation
encompasses energy demand estimates, regulatory andmarket scenarios, trends in components contributing to capital costs, operating costs and carbon oset rev-enues, when applicable (Figure 4.4). Te objective isto understand and value nancial returns and to com-
pare project returns and risks relative to a well denedbenchmark case (typically the status quo) over several
years.
Does investment in industrial energy
eciency pay?
Investments need to be protable. While some com- panies might also be driven by environmental andsocial responsibility concerns, they still need to nd asolid economic rationale or energy-eciency invest-ments. Investing in energy eciency needs to be atleast as protable as, i not more protable than, otheroptions.
Strong evidence rom developed countries
A vast literature on energy-eciency measures showsenormous potential or cost savings, but most o thesavings go unrealized, even in developed countries.
Other outcomes(carbon-related,labour-related)
Financial outcomes(costs, Clean Development Mechanism credits,
project net present value, value at risk)
Internal company driversImportance of energy to the company’s cost structure
Internal company capabilities to implement energy-efficiency projects
Available risk transferinstrument and
infrastructure and support
Regulatory and marketdrivers and risks
Demand andcost drivers
Availabletechnologies
External drivers
Figure 4.4
Valuation and ris drivers or energy-eciency projects
Source: Kleindorer 2011.

8/2/2019 Unido Full Report eBook
http://slidepdf.com/reader/full/unido-full-report-ebook 95/259
76
T hE E C ON OMI C A ND S O C I A l D I V I D E ND S F r OMI ND U S T r I A l E NE r GY E F F I C I E N C Y
4
“ A vast literature on energy-eciency
measures shows enormous potential or
cost savings, but most o the savings go
unrealized, even in developed countries
Start with the United States. Early studies bythe US Department o Energy ound that the adop-tion o industrial energy-eicient technologies andrelated managerial practices promoted by their pro-grammes had a payback period o one month to two
years (USDOE 2010). Another early study, reported inNelson (1989) and Nelson and Rosenberg (1993), onindustrial energy-eciency projects in Dow Chemicals
over 1981–1993 showed that 575 audited projects cost-ing less than $200,000 had payback times o less thanone year and yielded an average return on investmento 204 percent and savings o $100 million a year.Although the number o unded projects increased each
year, there was no evidence o saturation. Numerousopportunities were still available with payback times o less than a year. In other words, the low-hanging ruit
was picked, but it grew back. onn and Peretz (2007) provide more recent evidence, reporting that stand-
ard awareness- and capacity-building industrial pro-grammes in the United States promoting energy e-ciency typically identiy up to 30 percent energy savingsin plants. Such programmes are ound to be quite pro-itable or the rms, or job creation and or tax revenues.
Te European experience conrms the US nd-ings. Jochem and Gruber (2007) report that around1,000 large Swiss rms involved in energy-saving learn-ing networks were pocketing around €110,000 innet annual prots per company. In Germany’s Baden-
Württemberg region, such networks had combined netearnings o €450,000 in 2004. A study o energy-e-ciency investments by 70 industrial rms in six OECDcountries (including in ood manuacturing, building materials, steel manuacturing, paper manuacturing,chemicals manuacturing and textile manuacturing companies) ound an average economic payback o 4.2
years and combined net savings o around $28.5 million(Worrell et al. 2001). Payback ell to 1.9 years once thenon-energy benets o the investment were included.
Energy eciency is also protable in
developing countries
A ew studies nd that energy eciency is also pro-itable in developing countries. aylor et al. (2008)
ound that more than 80 percent o 455 WorldBank–nanced projects in 11 developing countriesrecovered their capital cost in 30 months or less. Teaverage energy cost savings was $11 per barrel o oil-equivalent (boe; the discounted present value o thesavings, based on an assumed 10-year investment lie)on an average global price o $60 per barrel or crudeoil in 2007. Savings varied rom less than $3 per boe
or modications o steam thermal systems and $6 perboe or industrial energy recovery to $15 per boe orbetter insulation and windows, $19 per boe or districtheating upgrades and $23 per boe or better lighting systems (the most expensive category).
UNIDO conducted an email survey o 357industrial rms in 25 developing economies, basedon a convenience sample, aimed at obtaining a basicunderstanding o the rationale behind investing inindustrial energy eciency and at illustrating the key
energy-eciency issues conronted by rms.4 O theserms, 261 were ollowed up by email or telephone toexplore their responses in more depth. Face-to-aceinterviews were conducted with representatives o 96 rms in China, Colombia, Nigeria, Peru, unisiaand Viet Nam to probe into the rationale or theirdecisions (UNIDO 2010h). Firms were included inthe survey i they had invested in at least one project
whose aim was to reduce energy use or costs; they were also queried about energy-eciency projects they
had decided not to take on. Investments in energy-eciency projects totalled $613.7 million, and indi- vidual investments ranged rom $100 to $73 million.
Projects were classiied by sector (Figure 4.5),investment type, unctional change and size. Six typeso investment were identied:• Direct equipment replacement (36 percent) related
to switching energy sources (ovens, engines,boilers).
• Waste reuse (14 percent) arising rom the produc-tion process, such as biomass, as a source o energy.May require some small-scale equipment purchase.
• Residual temperature reuse (14 percent) involvesusing hot or cold air or water rom the produc-tion process to provide additional plant cooling or

8/2/2019 Unido Full Report eBook
http://slidepdf.com/reader/full/unido-full-report-ebook 96/259
77
T hE E C ON OMI C A ND S O C I A l D I V I D E ND S F r OMI ND U S T r I A l E NE r GY E F F I C I E N C Y
4
“ A study o 455 World Ban–nanced
projects in 11 developing countries ound
that more than 80 percent recovered their
capital costs in 30 months or less
heating. May require some small-scale equipment purchase.
• Pipes and insulation improvements (13 percent)aimed at reducing temperature or pressure lossrom steam and other pipes (Box 4.3). May requiresome small-scale equipment purchase.
• Better use o inrastructure (12 percent) throughchanges in shi schedules, use o daylight and nat-ural ventilation and similar changes.
• Fuel optimization (11 percent) by reducing the
size o coal chips to raise oven temperatures or bymodiying steam turbine pressure. Te changeoriginates with the uel, not the equipment.Projects were also distributed according to unc-
tional change into two broad types: technologicalreengineering (74 percent o projects) and processreorganization (26 percent); and according to sizeinto three groups: less than $10,000 (27 percent),more than $100,000 (35 percent), and in between (35
percent).In line with practice in developed economies, the
survey ound that more than 90 percent o surveyedirms in developing economies used simple pay-back rules to assess the nancial viability o energy-eciency projects.5 Firms approved projects only i
they had a simple payback o 2–3 years. Te mean pay-back period or 119 projects with data was 23 months(Figure 4.6). Internal rate o return assessments werereserved or larger projects.
As mentioned, however, the payback approach hasdrawbacks (Brealey, Myers and Allen 2008; Leey1996; Remer and Nieto 1995). It neglects both the
income generated aer the payback period has expiredand the time value o money. And though it may bea simple way to assess the protability o individualinvestments, it is not an accurate means o comparing investment alternatives. Doing that requires net pre-sent value or internal rate o return calculations.
Using assumptions or the useul lie o projects o 3, 4, 5 and 10 years, it is possible to determine dierentinternal rates o return rom the reported payback peri-ods and compare them across projects by sector, type o investment, unctional change and size (Gordon 1955;Holland and Watson 1976; Leley 1996; Newnan1969; Sarnat and Levy 1969; Figure 4.7).
For projects with a three-year liespan and noresale value, the estimated mean internal rate o return
Textiles14%
Others12%
Cement12%
Miningand metal
10%
Paper7%
Chemicals12%
Equipmentmanufacturing
7%
Petrochemicals6%
Agroindustries 3%
Pharmaceuticals 2%
Glass and ceramics 2%
Automotive 1%
Food andbeverages
12%
Figure 4.5
Sectoral composition o UNIDO sample oindustrial rms investing in energy eciency,2010
The UNIDO survey o rms investing in energy-eciency projects
covered a wide range o sectors
Source: UNIDO 2010h.
PT.PindoDeiPup&Pape,anIndonesiancompany
witapoductioncapacityof1,465,000tonnespe
yea,poducespotocopypape,speciatypapeand
tissuepape.Te poject, suppoted byteUnited
NationsEnvionmentPogamme,focusedonmacin-
eytatpoducesmainypotocopypapewitapo-
ductioncapacityof240,000tonnespeyea.Tepojectfoundmanysteameaks,steam-tap
eaksanduninsuatedopooyaggedsteampipes.
Tecompany conducted asuveyto ocatea te
steamossesnotaccountedfoandfoowedupwit
aepaicampaign.
Steam osses dopped fom10,199 tonnes pe
montin2003to8,165in2004.Witaninvestment
costof$200,000andannuacostsavingsof$366,192,
tepaybackpeiodwasjustsixmonts.Tecompany
educednatuagasconsumptionby46,000tonnesa
yeaandcabondioxideemissionsby311,000tonnes
ayea.
Source: UNEP 2006.
Box 4.3
Case study: PT. Pindo Deli Pulp & Paperrepairs steam leas

8/2/2019 Unido Full Report eBook
http://slidepdf.com/reader/full/unido-full-report-ebook 97/259
78
T hE E C ON OMI C A ND S O C I A l D I V I D E ND S F r OMI ND U S T r I A l E NE r GY E F F I C I E N C Y
4
“ The data collected by UNIDO suggest a wide
range o protable opportunities to improve
energy eciency in all industrial sectors
was 25 percent, but the rate rose with each additional year o lie, to 37 percent or 4 years, 43 percent or5 years and 50 percent or 10 years. Tese higher rates
compare avourably with average returns in capitalmarkets, which are typically lower over comparabletimerames. Countries with high interest rates tend tohave higher ination, wiping out some o the gains o nancial investments. And while some stock markets
provided attractive returns in some years (2003–2004and 2009, or example), energy-eciency investments
were ar more protable over longer periods.Internal rates o return varied considerably across
sectors and type o investment in the sample. Rates o
return were lower in projects in process sectors, suchas chemicals and cement, than in discrete product sec-tors, such as equipment manuacturing and automo-tive. Making better use o inrastructure, sealing pipesand improving insulation were extremely protable;direct equipment replacement was less so. Projectsinvolving process reorganization, especially when theycost less than $10,000, were highly attractive, withrates o return o up to 125 percent or projects that
would last 10 years. Even or a more realistic projectlietime o three years, rates o return exceeded 100
percent. Paper, ood and beverages, and textile rmshad many projects o this type. By contrast, techno-logical modications costing more than $100,000had ar lower rates o return. Many o these projects
needed to operate or more than ve years to justiythe investment.
Te picture that emerges rom this survey is that
investing in industrial energy eciency is protable,but how protable depends on the project and timehorizon. More protable projects commonly requiresmall investments, involve process reorganization andhousekeeping measures, use existing inrastructurebetter or improve pipes. Tese would t in the low-lowquadrant 3 projects in Figure 4.3: they are not organi-zationally, technically or contractually complex, andthey have a relatively small impact on energy costs andcompany prots. Projects that involve larger invest-
ments and require changing machinery and equip-ment (mainly in process sectors) are less protable andrequire longer periods to mature, though they will
probably have a larger impact on corporate prots.Tese projects would t in the high-high quadrant 2and high-low quadrant 4.
Does this mean that all energy-eciency projectsare protable under normal investment criteria? Clearlynot. Generally speaking, the more organizationally andtechnologically complex a project becomes, the lowerits protability. Many energy-ecient technologies arelikely to remain unprotable or some time, at leastuntil environmental damages are properly priced. Butthe data do suggest a wide range o protable oppor-tunities to improve energy eciency in all industrial
M o n t h s
By functional changeBy sector By type of investment
AverageBetteruse of
infrastructure
Residualtemperature
reuse
Directequipment
replacement
AveragePaperFood andbeverages
CementTextilesChemicals AverageTechnologyreengineering
Processreorganization
0
12
24
36
0
12
24
36
0
12
24
36
Figure 4.6
Paybac period o UNIDO sample o industrial rms investing in energy eciency
Payback periods averaged 23 months in the UNIDO survey o industrial rms investing in energy-eciency projects
Source: UNIDO 2010h.

8/2/2019 Unido Full Report eBook
http://slidepdf.com/reader/full/unido-full-report-ebook 98/259
79
T hE E C ON OMI C A ND S O C I A l D I V I D E ND S F r OMI ND U S T r I A l E NE r GY E F F I C I E N C Y
4
“ For projects with a three-year liespan
and no resale value, the estimated mean
internal rate o return was 25 percent, but
rose with each additional year o lie
P e r c e n t
P e r c e n t
P e r c e n t
P e r c e n t
3 years 4 years 5 years 10 years
3 years 4 years 5 years 10 years
3 years 4 years 5 years 10 years
3 years
By sector and project life
By type of investment and project life
By functional change and project life
By investment size and project lifespan
4 years 5 years 10 years
0
25
50
75
100
125
0
25
50
75
100
0
25
50
75
0
25
50
75
100
125
0
25
50
75
100
125
0
25
50
75
100
125
0
25
50
75
100
125
0
25
50
75
0
25
50
75
0
25
50
75
0
25
50
75
100
0
25
50
75
100
0
25
50
75
100
0
25
50
75
100
125
0
25
50
75
100
125
0
25
50
75
100
125
Chemicals (14) Others (13) Textiles (22) Cement/ Equipment Automotive (4) Metal (14) Food and Paper (12) Total (119)ceramics (15) manufacturing (16) beverages (9)
Better use of infrastructure (14) Pipes and insulation Fuel optimization (12) Waste reuse (12) Residual temperature Direct equipment Total (119)improvements (19) reuse (20) replacement (42)
Process reorganization (20) Technology reengineering (99) Total (119)
Less than $10,000 (30) $10,000–$100,000 (45) More than $100,000 (44) Total (119)
Figure 4.7
Internal rates o return o industrial energy-eciency projects, by expected lietimes
Internal rates o return o energy-eciency projects rise with expected lietimes
Note: Numbers in parentheses are number o projects.
Source: UNIDO 2010h.

8/2/2019 Unido Full Report eBook
http://slidepdf.com/reader/full/unido-full-report-ebook 99/259
80
T hE E C ON OMI C A ND S O C I A l D I V I D E ND S F r OMI ND U S T r I A l E NE r GY E F F I C I E N C Y
4
“ While investments in industrial energy
eciency are aimed primarily at protability, they
generally yield other economic benets as well
sectors. It seems likely that rms in developing coun-tries are unaware o many o these opportunities.
he evidence presented above ocuses on theinsights rom a ew case studies. Does the relationshipbetween investment in energy eciency and prot-ability also hold or a wider, representative sample o rms? o nd out, UNIDO conducted a study using the World Bank enterprise surveys database, which
contains detailed inormation on energy eciency and prots (Cantore 2011a; Cantore and Cali 2011).6 Testudy investigated the relationship between protabil-ity and energy intensity (ratio o energy consumed tototal sales) using a large sample o rms rom 29 devel-oping countries. Aer controlling or rm character-istics such as age and size, the analysis ound an inverserelationship in 27 countries between energy intensityand protability, which was signicant at the 0.05level in 13 o them.7 It also ound an inverse relation-
ship that was signicant in 9 o the 15 manuacturing sectors or which data were available.
Are there other economic benets rom
investments in industrial energy eciency?
While investments in industrial energy eiciencyare aimed primarily at protability, they generally
yield other economic benets. Cleaner, more ecienttechnologies can improve output quality and reducethroughput and waste streams o energy, water, mate-
rials and by-products. For example, switching rom vertical sha kilns in the Chinese cement industrynot only reduced energy intensity but also improved
product quality, thus boosting sales. Companies thatadopt energy-ecient technologies early may also ben-et rom enhanced competitiveness and rst-moveradvantage (Eichhammer and Walz 2011).
Because improvements in energy eciency typi-cally require higher skilled workers and managers,rms also invest in training, which imparts techni-cal skills, raises awareness o the benets o eciencyand best practices and increases worker involvement.Tese and other non-energy benets, such as lowermaintenance costs and increased output, oen boostoverall productivity. Worrell et al. (2003) nd that
more than two-thirds o industrial energy-ecienttechnologies not only save energy but also yield pro-ductivity gains through reduced capital costs orincreased throughput compared with state-o-the-arttechnology.
Examinations o the relationship between totalactor productivity and energy intensity using WorldBank enterprise survey data or 24 developing coun-
tries ound a strong inverse relationship betweenenergy intensity and total actor productivity in 23o the countries, suggesting that energy eciency isaccompanied by innovation and eicient manage-ment o other inputs (Cantore 2011a,b; Cantore andte Velde 2011). Another study o 77 energy-eciency
projects in six OECD countries in a range o indus-trial sectors (including ood, building materials, steel,
paper, chemicals and textiles) ound 224 non-energybenets through reduced material and water use, less
wear and tear, lower labour costs, improved moraleand lower noise levels (Worrell et a l. 2003). Te studyalso ound that in 52 o the 77 industrial energy-eciency investment projects with relevant data, theaverage payback improved rom 4.2 years to 1.9 yearsaer monetizing the co-benets.
here are also important environmental co-benets (see Chapter 3), as the example o a Chineseiron and steel company’s eorts to recover heat andreuse steam illustrates (Box 4.4). Understanding the
ull benets o investing in industrial energy eciencyis vital because incorporating them into cost analysescan result in a more avourable evaluation.
The social dividend
It is well established that economic growth is drivenby improvements in productivity arising rom sus-tained technological change. Productivity gains areconverted into higher prots that can be redistrib-uted as increased wages; invested to expand output,beneting input-providing and output-using sectors;used or developing newer technologies and products;
passed on to consumers in lower prices or translatedinto higher demand or existing goods. Whateverthe transmission mechanism, output and demand

8/2/2019 Unido Full Report eBook
http://slidepdf.com/reader/full/unido-full-report-ebook 100/259
81
T hE E C ON OMI C A ND S O C I A l D I V I D E ND S F r OMI ND U S T r I A l E NE r GY E F F I C I E N C Y
4
“ By reducing resource use, cost-eective
energy-eciency improvements increase
rm and industry productivity, which
leads to an expansion in employment
reinorce each other through multiplier eects in a virtuous cycle o higher growth, employment genera-tion and rising living standards, which is the essenceo development.
Productivity and employment gains
Industrial energy-eiciency gains lead to a simi-lar virtuous circle. By reducing resource use, cost-eective energy-eiciency improvements increaserm and industry productivity, which leads to an
expansion in employment. Te employment impacttakes place directly through the price elasticity o demand, which may result in higher demand or thegoods produced. Tis higher demand aects bothirms investing in industrial energy eiciency andmanuacturers o energy-ecient equipment, whichbenet rom more orders.8 However, there may alsobe short-term employment losses until the impact o renewed demand kicks in, as a recent United NationsEnvironment Programme report on the green econ-omy suggests (UNEP 2011).
Evidence on the impact o energy eiciency onemployment generation is still limited, especially orindustrial energy eciency. A recent study in the USstate o Missouri on the impact o policies to promote
energy-eciency investments, including some in themanuacturing industry, estimated an impact o 8,500net jobs by 2025 over and above the business-as-usualscenario (ACEEE 2011). A similar study or SouthArica, but ocusing on industrial energy eiciency(improvements in speed drives, motors, lighting heatand ventilation), estimated 4,000–60,000 new jobs over2005–2020 in an eciency scenario compared with the
base scenario (Howells, House and Laitner 2005). While the overall impact o industrial energy-
eciency improvements on employment is dicultto assess and might not be large overall, it might belarger among micro- and small enterprises in develop-ing countries. Micro-, small and medium-size manu-acturing rms requently account or most industrialemployment in developing countries and play a lead-ing role in creating jobs, promoting growth and reduc-ing poverty. But these rms also tend to be less energy
ecient and more polluting (per unit o production)than larger rms, and they lack the in-house capacityto resolve their technical problems (Rath 2011). Tus,energy-eciency options might oer them greater
potential or closing their eciency and productivitygaps and engaging in rapid growth.
Greater job security is another social co-benet(Kanbur and Squire 1999). In India, highly polluting and energy-inecient practices in energy-intensivesectors have threatened many rms with closure or
violating pollution standards. Workers would suer job and income losses rom plant closure. Energy-ecient technologies could reduce the risk o lostincome while contributing to higher returns, greatercompetitiveness and reduced business risk. Switching to energy-ecient technologies could also reduce therisk o competitive slippage in domestic and exportmarkets as environmental standards become morestringent (Rath 2011).
Better access to energy
Industrial energy eiciency also has a key role inimproving access to energy. oday, some 2–3 billion
people are excluded rom modern energy services andrely on traditional biomass or cooking and heating;
DagonIon&SteeCo.,ltd.isaCinesestate-owned
integatedsteepant inSijiazuang,te capita of
hebeiPovince.Itpoduces2miiontonnesofcabon
stuctuaoundsteeannuay.Tecompanyuseswaste
eatfomtwoconvetefunacestogeneatesteam.An
enegyassessmentnoticedtatteopeatingpessue
wasmucowetantedesignpessueandtatteesuting ow-pessuesteam coud notbeused and
wasvented.Tepobemwascausedbysteameaks
intepipesandfunaceoods.Tecompanyinvested
$720,000toepacefougasoodstoecoveeatand
eusesteam.Annuasavingsae$900,000,andtepay-
backpeiodwasabout10monts.Steamecoveyof
14,800tonnesayeaasoeducedcabondioxideemis-
sions,anenvionmentabenet.
Source: Zeng and Rong 2010.
Box 4.4
Chinese company secures environmentalco-benets

8/2/2019 Unido Full Report eBook
http://slidepdf.com/reader/full/unido-full-report-ebook 101/259
82
T hE E C ON OMI C A ND S O C I A l D I V I D E ND S F r OMI ND U S T r I A l E NE r GY E F F I C I E N C Y
4
“ In many developing countries, energy
shortages, unreliable and poor quality supply
and ineciencies in use have high economic
costs in materials waste, capacity utilization and
inecient investment in standby equipment
about 1.5 billion people have no access to electricity(AGECC 2010). Access to modern energy services,
particularly or women and girls in low- and middle-income countries, could help sustain industrializationby making possible income-generating activities, thusalso liing many out o poverty. Furthermore, in manydeveloping countries, energy shortages, unreliableand poor quality supply and ineciencies in use have
high economic costs in materials waste, low capac-ity utilization and inecient investment in standbyequipment. Cost-eective improvements in industrialenergy eciency could help control growth in energyuse and waste, redeploy expenditure into energy inra-structure, enable adequate provision o energy servicesat aordable cost and und better energy access.
Improved health outcomes
Tere are also health advantages o greater energy e-
ciency, as shown in the impacts o the change to high-eciency technologies in the brick industry in the
Xuan Quan commune in Hung Yen Province o VietNam (Box 4.5) As highlighted in Chapter 3, greaterenergy eciency reduces the atmospheric emission o damaging substances such as sulphur oxides, nitro-gen oxides, smoke and airborne suspended particu-late matter. Emissions rom burning ossil uels orindustry, transportation and power generation are thelargest sources o urban air pollution, with harmul
eects on health (Rath 2011). Ardestani and Shae-Pour (2009) estimated the health damage rom air
pollution in Iran at 8.4 percent o GDP. Introducing energy-ecient technologies and conservation prac-tices can improve the health and lie expectancy o actory workers, particularly by reducing upper res-
piratory tract illnesses and asthma attacks. Te poorstand to gain the most, because pollution-intensive
industries tend to locate in low-wage areas (Dasgupta,Lucas and Wheeler 1998).
Mills and Roseneld (1996) detail a range o health co-beneits rom energy-eicient technolo-gies. Energy-ecient high-requency electronic bal-last, which prevents ickering in uorescent bulbs,causes ewer headaches and less eyestrain among oce
workers than does standard magnetic ballast. Severalorms o anxiety have been ound to diminish aer ashi to high-requency lighting. Mills and Roseneld
add that exposure to daylight also has positive healthimpacts since an absence o windows is correlated withan increase in transient psychosis and absenteeism byactory workers. Light also aects melatonin levels,
which are related to psychological depression aecting about 5 percent o the population.
High energy-eicient technologies can alsoimprove the indoor environment, comort and saety(Mills and Roseneld 1996). Variable-speed drives andair blowers and energy-ecient urnaces tend to be
Bick-makingisoneoftemostimpotantindustiesin
VietNam.howeve,bickkinstendtobeigyinefcient
andtouse ow-quaity,ig-supucoa,makingbick
poductiononeoftemostenvionmentaydamaging
activitiesinteconstuctionsecto.Bick-makingeads
toigevesofocaaipoutionandgeenousegas
emissions.
Inesponsetogovenment demandstopaseout
inefcientkins,teXuanQuancommuneinhungYen
Povince, weefamiy-scaebick poductionis com-mon,intoducedseveaCinesecoa-andenegy-saving
(45–50pecenteduction)veticasaftbickkinsand
adaptedtemtoocaconditions.Addingcoatotecay
cuttebeakageateamostinaf(fom7 pecentto
4 pecent).
Inadditiontocosteductionsandquaityimpove-
ments,tepojectesutedinseveaco-benets:
• reducedgeenousegasemissionsfommoeef-
cientuseofcoaintekins.
• reducedocaaipoutionfombuningesscoa.
• Anticipateddopinespiatoyinessesfomoweai
poution.• higeincomesfofamiybick-makingms.
Tepojectasbeenepicatedinoteaeas.
Source: GEF 2011.
Box 4.5
Increasing productivity and securing environmental and social co-benets in Viet Nam

8/2/2019 Unido Full Report eBook
http://slidepdf.com/reader/full/unido-full-report-ebook 102/259
83
T hE E C ON OMI C A ND S O C I A l D I V I D E ND S F r OMI ND U S T r I A l E NE r GY E F F I C I E N C Y
4
“ Investing between 2007 and 2030
to achieve current levels o best practice
technology would improve energy eciency
1.2 percent a year and save $365 billion in
costs by 2030, excluding investment costs
quieter than the equipment they replace. Glazed win-dows keep household and actory occupants cooler inhot weather and reduce external noise; double-glazed
windows can protect buildings against re. Ecientlighting technologies such as uorescent lamps andlight-emitting diodes (LEDs) increase the reliabilityo warning signs, thus improving saety. Exhaust-heatrecovery systems provide better ventilation than sys-
tems without heat recovery.
Is there still room or protable
industrial energy-eciency
investments?
Should companies actively seek industrial energy-eciency investments? Studies suggest the answer is
yes, in both developed and developing countries. InSweden, research on energy-management practices inthe pulp and paper and steel industries suggests that
even among these energy-intensive industries, energyinvestments do not seem to be a high priority: only 40
percent o the mills and 25 percent o the oundries were trying to improve energy eciency (Tollanderand Ottosson 2010). A similar study by Worrellet al. (2001) in 11 developing countries shows thaton average, companies implement only 56 percent o the recommendations rom energy audits. Tat sug-gests that there is plenty o room or cost-eectiveimprovements.
UNIDO estimates that industry currently spendsaround $1 trillion a year on energy, 55 percent o it indeveloping countries (Saygin et al. 2010; Saygin andPatel 2010). Energy cost savings rom adopting best
practice technologies (energy intensity in the top 10 percent o plants) in industrial energy-eciency pro- jects could reach $65 billion in developed countriesand $165 billion in developing countries – 23 percento total energy costs and 2 percent o MVA. Investing in best available technology (energy intensity in themost energy-ecient plant in the world) instead could
yield savings o around 30 exajoules (EJ) a year, some27 percent o global energy use by industry (60 per-cent o it in developing countries) and 6 percent o global energy use. Investing between 2007 and 2030
to achieve current levels o best available technology would improve energy eciency 1.2 percent a year andsave $365 billion in costs by 2030, excluding invest-ment costs.
For best available technology, the largest techni-cal improvement potential is in process sectors such as
petroleum rening, iron and steel, non-errous metals,non-metallic minerals (mostly cement), chemical and
petrochemicals, and pulp and paper (able 4.2; Sayginet al. 2010). In some energy-intensive processes, suchas steam crackers and aluminium, investment couldreduce energy use 10–20 percent. Energy savings o some 16.3 EJ a year could be achieved in these sec-tors, the largest share o it in developing economies. Insectors such as aluminium smelting, pulp and paper,and cement production, developing economies haveinvested in modern energy-ecient technologies or areusing alternative uels. But small plants equipped with
old technologies are the norm in most process sectors.Tere is also considerable potential or investment
in discrete product and combined sectors (Saygin etal. 2010). Although absolute energy savings tend to belower than in process sectors, the savings over baselineconsumption are substantial. Savings o up to 2 .5 EJ a
year could be achieved in the textile and ood and bev-erages sectors and o up to 11.2 EJ a year in machinery,transport equipment, wood and other sectors, mostlyin developing countries (Saygin et al. 2010).
he environmental beneits o best availableinvestments are also substantial. Achieving best availa-ble technology would reduce carbon dioxide emissions12–23 percent, or by as much as 1.3 gigatonnes (Gt)o carbon dioxide, a reduction o 12 percent in totalindustry emissions and 4 percent in global emissionsrom 2006 levels (IEA 2009b).
A reerence point or long-term emission reduc-tions is the IEA’s blue scenario, which aims to halveglobal industrial energy-related carbon dioxide emis-sions by 2050 (IEA 2009b). otal direct and indi-rect industrial emissions in 2050 would be 42 per-cent below their 2006 level o 10.6 Gt. Te baselinescenario, reecting energy and climate policies thatare already implemented or planned, contemplates

8/2/2019 Unido Full Report eBook
http://slidepdf.com/reader/full/unido-full-report-ebook 103/259
84
T hE E C ON OMI C A ND S O C I A l D I V I D E ND S F r OMI ND U S T r I A l E NE r GY E F F I C I E N C Y
4
“ The largest technical improvement
potential is in process industries
Sector and product
Technical improvementpotential(percent)
Total savings potential(exajoules per year)
Share of energy costsa (percent)
Carbon dioxidesavings potential
(tonnes ofcarbon dioxide
a year)
Share ofcurrent
emissions(percent)
Developedcountries
Developingcountries
Developedcountries
Developingcountries
Developedcountries
Developingcountries
Process sectors
Petroleum refneries 10–15 70 0.7 4.6 50–60
Chemicals and petrochemicals 0.5 1.8 300 20
Steam cracking(excludingeedstock) 20–25 25–30 0.4 0.3 50–85
Ammonia 11 25 0.1 1.3
Methanol 9 14 0 0.1
Non-errous minerals 0.3 0.7
Aluminaproduction 35 50 0.1 0.5 30 45b 12b
Aluminiumsmelters 5–10 5 0.1 0.2 35–40 35–50
Other aluminium 5–10 5 0.1 0.2 35–40 35–50
Copper smelters 45–50 0 0.1
Zinc 16 46 0 0.1
Iron and steel 10 30 0.7 5.4 10–20 30 350 14
Non-metallic minerals 0.8 2.0
Cement 20 25 0.4 1.8 25–30 50 450 23
Lime 40
Glass 30–35 40 0.4 0.2 7–20
Ceramics 30–50
Combined sectors
Pulp and paper 25 20 1.3 0.3 15–35 80 20
Textile 5–25
Spinning 10 20 0.1 0.3
Weaving 5–10 10–15
Food and beverages 25 40 0.7 1.4 1–10
Other sectors 10–15 25–30 2.5 8.7
Total 15 30–35 7.6 25.1
Excludingeedstock 15–20 30–35 12c
Note: Potential savings based on universal application o best available technologies.
a. Share o total production costs (tot al xed costs and variable costs, including depreciation).
b. All aluminium activities.
c. Includes only chemical and petrochemical, aluminium, iron and steel, and pulp and pa per.
Source: Saygin et al 2010; IEA (2009 b) or emissions gures.
Table 4.2
Technical and economic savings potential arising rom industrial energy-eciency improvements

8/2/2019 Unido Full Report eBook
http://slidepdf.com/reader/full/unido-full-report-ebook 104/259
85
T hE E C ON OMI C A ND S O C I A l D I V I D E ND S F r OMI ND U S T r I A l E NE r GY E F F I C I E N C Y
4
“ Many options or improving industrial energy
eciency in developing countries appear to be
highly protable, even when compared with the
most optimistic returns on nancial investments.
Yet ew o the opportunities are being seized
a doubling o total industrial emissions by 2050.In the blue scenario, direct industrial carbon diox-ide emissions would all 21 percent (rom 7.2 Gt to5.7 Gt). Improved energy eciency could contributean estimated 40 percent o the direct emission reduc-tions required rom industry by 2050, compared
with 30 percent through carbon capture and stor-age, 21 percent through uel switching and 9 percent
through recycling and energy recovery. In addition,indirect emissions would all rom 3.4 Gt in 2006 to0.4 Gt in 2050, with the nearly complete decarboni-zation o the power sector under the blue scenario.
It can be done
here are many options or improving industrialenergy eciency in developing countries. Many appearto be highly protable, even when compared with themost optimistic returns on nancial investments. Te
options cut across all sectors, investment types andtime preerences or returns. Tere are also many co-benets that increase the nancial attractiveness o energy-eciency projects. Te case studies suggestthat, by and large, investing in energy eciency pays.Improving industrial energy eciency, by boosting
protability, contributes to economic sustainability.hus, investing in green industry seems to be
protable in both developed and developing coun-tries. Particularly in developing countries, the poten-
tial or improvement remains considerable, even with-out putting a price on carbon emissions. Yet ew o theopportunities are being seized. What is happening?
Why are rms in developing countries not cashing inon the dividends o green industry and reduced energyuse? Some blame market ailure, while others blameorganizational decision-making. Tese and other pos-sible reasons are the ocus o Chapter 5.
Notes
1. Te ability to make decisions is constrained bycognitive and time limitations (Williamson 1985).
2. Te implicit energy price is the total energy cost per sector (in 2006 US dollars) divided by the sec-tor’s total energy use (measured in kilotonnes o oil equivalent).
3. ransaction costs – inormation, consulting,negotiating, insurance, conict resolution andlegal costs (Sorrell 2007; Williamson 1985) – willbe incurred whether the project is carried out in-
house or through external contractors.4. Bangladesh, Bolivia, Brazil, Chile, China,
Colombia, Ecuador, Ghana, Guatemala, India,Indonesia, Lebanon, Mexico, Mongolia, Nigeria,Panama, Peru, Philippines, South Arica, SriLanka, aiwan Province o China, hailand,unisia, Uruguay and Viet Nam.
5. In a survey o project evaluation techniques usedby 33 Fortune 500 industrial companies in theUnited States in 1991, 64 percent used the pay-
back period to determine the easibility and pro-itability o an energy-eciency project (Remer,Stokdyk and van Driel 1993).
6. World Bank enterprise surveys are conductedregularly in a large number o developing coun-tries. Details o the database are available at www.enterprisesurveys.org/.
7. Tis analysis included some 41,000 observations ormore than 34,000 rms in 15 manuacturing sec-tors over 2000–2005. Control variables included
age, number o workers, value o investment inequipment, ownership (oreign or domestic) and whether the company exported or had ISO90000certiication or good management practices(Cantore 2010; Cantore and te Velde 2011).
8. Paral lel to the expansion o employment andoutput, there may also be increases in demandor energy, which may wipe out initial energy-eciency gains. Tis is reerred to as the reboundeect (van den Bergh 2010, 2011; Sorrell andDimitropoulos 2007). See Box 5.6 or a discus-sion o the rebound eect.

8/2/2019 Unido Full Report eBook
http://slidepdf.com/reader/full/unido-full-report-ebook 105/259
86
I investments in improved industrial energy eciency yield environmental, economic and social benets, what is impeding rms rom seizing these opportu-nities? Economists, assuming that unobserved costs,risks and inconveniences explain why potential gains
are not being realized, are generally sceptical about theexistence o large unexploited potential or protableinvestments in industrial energy eciency. Physicistsand engineers, however, oen see substantial opportu-nities (Jaccard 2009).
Aversion to investment seems to stem rom a com-bination o ailures in the markets or energy-ecientgoods and services and departures rom the rationalbehaviour o orthodox economic theory. Tese orcesoverlap to create barriers to improving energy e-
ciency, including:• Lack o awareness o eciency opportunities.• Diculty borrowing money or energy-eciency
investments.• Inadequate technical know-how.• Disconnection between those responsible or
investing and those operating the equipment.Tis chapter examines potential barriers to indus-
trial energy-eiciency investments rom both pri- vate and social perspectives based on a review o 160
recent studies and 96 UNIDO case studies (UNIDO2010h). It looks at how barriers to energy eciencyarise and how they operate. Summarizing some o theevidence on how the importance o these barriers di-ers across contexts, the chapter concludes that thesebarriers persist despite having been known or years– because inormation is lacking, decision-makers nei-ther make inormed decisions nor benet rom theirchoices, energy prices are ar below their productionand opportunity costs, nancing is unavailable andmany hidden costs are prevalent.
Barriers, ailures and hidden costs
Sorrell, Mallett and Nye (2011, p. 27) dene a bar-rier to industrial energy-eciency investment as a
“mechanism that inhibits a decision or behaviour thatappears to be both energy and economically ecient.”Some barriers arise rom ailures in the technologyand energy services markets, when private marketsdo not provide goods or services at a level that maxi-
mizes economic welare. Most economic theory pos-its that organizations are rational and invest based oncost-benet analysis (or example, selecting equipmentthat maximizes prots or utility based on initial price,
productivity, reliability, running expenses and othercosts). But rational agents do not always considerbroader social benets and costs (or example, howcarbon emissions harm the environment and humanhealth), thus oten overlooking industrial energy-eciency technologies that would be socially desirable
(Arrow and Debreu 1954; Bator 1958; Greenwald andStiglitz 1987).
How can we understand the ailure to makeseemingly rational economic decisions? One way isthrough transaction cost economics, which assumesthat individuals make satisactory rather than opti-mal decisions and rely heavily on routines and ruleso thumb (Furubotn and Richter 1997; Simon 1959;
Williamson 1985). Behavioural economics goes ur-ther, arguing that human decision-making is not just
boundedly rational but systematically biased anderroneous (Kahneman and versky 2000; Piattelli-Palmarini 1994). For example, a loss aversion or a sta-tus quo bias can discourage individuals rom taking on highly cost-eective investments (Samuelson andZeckhauser 1988; Swalm 1966; Taler 1991). A largebody o experimental evidence demonstrates that suchbiases are universal, predictable and largely unaectedby monetary incentives or learning (Kahneman andversky 2000).
o explore economic, organizational and behav-ioural barriers to improving energy eciency, the ol-lowing sections consider market ailures, limitationso human decision-making (bounded rationality) and
various hidden costs.
Chapter 5
Barriers to industrial energy eciency
Section 3 Challenges and opportunities in sustainable industrialization
8/2/2019 Unido Full Report eBook
http://slidepdf.com/reader/full/unido-full-report-ebook 106/259
87
B A r r I E r S T OI ND U S T r I A l
E NE r GY E F F I C I E N C Y
5
“ Many protable industrial energy-
eciency investments go unrealized because
the decision-maer is unaware o the costs
and benets or is unable to get the inormation
needed to invest with condence
Maret ailures
Four types o market ailures inhibit improvements inenergy eciency:• Insucient inormation.• Split incentives.• Energy prices and unreliability o supply.• Limited access to capital.
Insucient inormationMany protable industrial energy-eciency invest-ments go unrealized because the decision-maker isunaware o the costs and benets or is unable to getthe inormation needed to invest with condence.
Insucient inormation. Obtaining inormation onthe energy perormance o various technologies may beexpensive, especially i the equipment is an “experiencegood” (energy savings can be determined only aer
purchase) or “credence good” (perormance is notimmediately evident even aer initial consumption).Energy-eicient equipment will be undervalued i consumers cannot accurately assess the costs andbenets beore purchase.
Most new industrial energy-eciency technologieshave yet to introduce good labelling schemes, so thecost o searching or inormation may be much greaterthan or established technologies. And because indus-trial energy-eciency investments depend on context,
energy and cost savings can sometimes be assessedonly aer installation. Assessment is at times diculteven aer installation because o metering diculties.
Without submetering, or example, the perormanceo control systems, motors and variable-speed drives isdicult to monitor and evaluate. Te net result maybe organizational decision-making that is systemati-cally biased against industrial energy eciency.
Evaluating energy-saving opportunities requiresinormation on the levels and patterns o energy con-sumption and how they compare with benchmarks,on specic energy-saving opportunities (such as ther-mal insulation retrotting) and on the energy con-sumption o new and reurbished buildings, process
plants and purchased equipment – and all three are
oen lacking to some degree. Without knowing whereand how energy is used, companies cannot know
where to look or savings and how to achieve them, sothere is limited incentive to invest in industrial energyeciency. Tese problems, common in all sectors andcountries, are particularly acute in developing coun-
tries, which oen lack the inrastructure necessaryto become inormed about the technological options(UNDP 2000; Box 5.1).
Inormation dissemination and awareness. Despiteresearch and experience identiying protable energy-saving technologies with airly short payback periods,industry may discount energy-eiciency measuresbecause o a lack o awareness and organizationalcapacity (Morris, Barnes and Morris 2011). Limited
public capacity or inormation dissemination makesit more dicult or rms in developing countries toget the inormation they need (Sorrell, Mallett andNye 2011). A Nigerian manager interviewed or thisstudy stated that “awareness about energy use, energy
BennettIndusties,asmaNigeiancompany,fabi-
catesandassembesigtttings,xtuesandacces-
soies.Itsmainsouceofenegyiseecticity,95pe-
centofitsuppiedbyitsowngeneato.Accodingto
Bennett,itsaveageenegycostsaeaound30pe-
centofpoductioncosts,weabovetegobaaveage
of5–10pecent.
Tecompanywantstoinvestinacogeneationpant,usingtewasteeatfomteon-sitegeneation
pantwitinteindustiapocesses.Amanageinte-
viewedfotisepotstatedtatBennett,despitecon-
sideabeeffot,coudnotndaocaexpettodete-
mineteoptimumgeneatosizeandenegy-efciency
possibiities.
like Bennett Industies, manyNigeian compa-
niesknowitteabouttetecnicaoptionsavaiabe
oevenwateecticitycapacityteyneed.Onecon-
sequenceisteovesizingofsef-geneationandote
pants,esutingininefcientopeationonpatoad.
Tus,teeappeastobegeatpotentiafocoecting
geneatodimensionstoneededcapacity.
Source: Masselink 2009.
Box 5.1
Determining energy needs

8/2/2019 Unido Full Report eBook
http://slidepdf.com/reader/full/unido-full-report-ebook 107/259
88
B A r r I E r S T OI ND U S T r I A l
E NE r GY E F F I C I E N C Y
5
“ Limited access to modern technology,
engineering sills and related services urther
constrains developing countries’ capacity
to improve industrial energy eciency
reduction and energy eciency is key. For example, atour company we make all personnel aware o energyconsumption . . . At the plant, we have posters that showhow much energy we used in the last months and what
we planned to use” (Masselink 2010, p. 5). However, healso suggested that this practice is rare and that thereis nowhere to seek support. Many developing countrieslack public and private institutions that provide
inormation on energy use, processes and technologies.As a result, companies remain unaware o cost-eectiveenergy-eciency opportunities (Schleich 2011).
Limited access to modern technology, engineering skills and related services urther constrains develop-ing countries’ capacity to improve industrial energyeciency. For example, management at a unisiantextile company was aware o the potential benetso energy-eciency audits and projects but lacked theskills to take them on (Fokeer 2010). Colombian rms
complain that they can sometimes get inormation onenergy-ecient US equipment but not on Europeanalternatives (De Simone 2010). Wison (Nanjing)Chemical Co., Ltd., a new company, had ew sim-
ple options le to improve energy eciency. Furtherimprovements would require adopting cutting-edgeenergy-ecient technologies and industrial processes,but these are hard or the company to identiy andadopt (Zeng and Rong 2010). Many o the requiredtechnologies must be imported, making technol-
ogy adoption even more dicult, costly and timeconsuming.Many equipment producers in developing coun-
tries know little about industrial energy-eciencyopportunities and have limited access to ecient tech-nologies. A study o motor systems in China oundthat design engineers were “specialized in certainspecic subjects . . . , tend to use existing or old prod-ucts and equipment and are not aware o the latestenergy-ecient products” (EEPC India 2006 quotedby Sorrell, Mallett and Nye 2011, p. 53). In such cases,the inormation decits in production and demandreinorce each other.
A study o small and medium-size enterprisesin India ound that an industrial energy-eciency
technology can be developed and demonstrated ina group o rms and its benets revealed (improved
product quality, uel savings, and environmental per-ormance; Sethi and Ghosh 2008). But or the tech-nology to be adopted on a wide scale, local abricatorsmust have the inormation and skills to produce theequipment according to strict quality standards, andlocal technicians must have the expertise to maintain
and repair the technology – a dicult combination indeveloping countries (Box 5.2).
Another impediment is the lack o credible, third- party verication o claims made or a product orservice. A recent study on energy-management prac-tices in Indian small and medium-size enterprises
Amostteentiesma-scaegassindustyinIndia
isocatedina singeentepisecusteinFiozabad,
neaAga.Untitemid-1990s,tesemsusedta-
ditiona,igenegy-intensitytecnoogiesandope-
atingpactices.TeEnegyandresoucesInstitute
(TErI)inNewDei,suppotedbyteSwissAgencyfo
DeveopmentCoopeation,deveopedandpomoted
industiaenegy-efciencytecnoogiesfotissec-
to,focusingontecoa-edpotfunace.Tepoject
tookonnewugencywentemsweepessuedto
switcfomcoatonatuagas.
In2001,TErIintoducedagas-basedecupeative
potfunacetateducedenegyusebyafoveteta-
ditionacoa-edpotfunaceand30–35pecentoveteconventionagas-edpot funacedeveopedby
ocaentepeneusjustafewyeasbefoe(andadopted
by most coa-ed pot funace ms, wicadno
atenative).Next,TErIstengtenedtecapacitiesof
custe-evesevicepovidestougawaenesscam-
paignsand ands-ontaining,so tat entepeneus
coudsustaintenewtecnoogywitoutdependingon
extenaagencies.Neay60ofte100-oddopeating
potfunacemsinFiozabadaveswitcedtotenew
ecupeativefunace,andtewaste-eatecoveytec-
noogyasinspiedinnovationamongentepeneus
acosstecuste.Otepotfunacemsavesetupocaydesignedeat-ecoveysystemstoimpovete
enegyefciencyofteiconventionafunaces.
Source: Sethi and Ghosh 2008.
Box 5.2
The Firozabad experience with adopting newindustrial energy-eciency technology

8/2/2019 Unido Full Report eBook
http://slidepdf.com/reader/full/unido-full-report-ebook 108/259
89
B A r r I E r S T OI ND U S T r I A l
E NE r GY E F F I C I E N C Y
5
“ When an investment reduces energy costs,
it is protable or the company as a whole but
that might not be clear to individual departments,
so the investment may be overlooed
revealed that a third o the 14 percent that engagedconsultants to study energy use did not implementthe recommendations (Ghosh 2011). Respondentsrom non-implementing rms questioned the consult-ants’ credibility and impartiality, believing that theydid not know enough about how the rms operate.Respondents believed that consultants were tied tocertain equipment manuacturers and promoted that
equipment under the guise o proessional advice.Te study o small and medium-size enterprises
in India reveals several misconceptions about energyaudits. Only 5 percent o surveyed rms had engagedan accredited energy auditor to conduct a ormal audit(Ghosh 2011). Most rms know little about how anaudit could identiy energy-saving measures. Manysmaller rms assumed that an energy audit involvedgovernment ocials and worried about external inter-erence. Others eared legal sanctions. Indian energy
auditors corroborated these ndings (Ghosh 2011).
Split incentives
When departments or companies cannot appropri-ate all the benets o an investment, they are lesslikely to invest. In larger organizations, departmentalaccountability or energy costs may be important. Forexample, i departments are accountable or their ownenergy costs, they benet directly rom any savingsrom investment projects or housekeeping measures.
But i cost savings go to the company as a whole, thedepartmental incentive is diluted (split incentives). When an investment reduces energy costs, it is prot-able or the company as a whole, but that might notbe clear to individual departments, so the investmentmay be overlooked. In such cases, employees might bemaking rational decisions given the incentives they areaware o, but the outcome o their collective actionsmight be suboptimal or the rm as a whole (Goloveand Eto 1996; IEA 2007c; Masselink 2008; Sorrell etal. 2000). Te split incentives problem worsens whenno single department has explicit responsibility ormanaging energy costs – when no one department hasall the inormation needed to manage resource andenergy consumption eectively (Masselink 2009).
Submetering can strengthen incentives to reduceenergy costs. A recent study o energy management
practices in Tai cement and textile industries oundthat changing operational practices was an impor-tant enabler o industrial energy-eciency measures(Hasanbeigi, Menke and du Pont 2010). Submetering and billing individual cost centres or energy use is one
way to motivate change. Whether submetering makes
sense depends on the balance o energy costs, the potential or energy saving, and the investment, sta and operational costs required to set up the submeters(Box 5.3).
Split incentives also inluence equipment pur-chase (Sorrell et al. 2004). Responsibility or capitalcosts might not match responsibility or operating costs, and the transaction costs o reducing operating costs might outweigh the potential savings (Sorrell,Mallett and Nye 2011). A study o energy-ecient
motor systems in China noted that the purchasers o electric motors within a company are generally notthe end-users (Yang 2007). Oen, people withoutthe knowledge, inormation and incentives to mini-mize operating costs are responsible or procuring equipment, and energy management sta might nothave the time to check their decisions. Maintenancesta, too, might have incentives unrelated to run-ning costs, including energy consumption, ocusing instead on minimizing capital costs or repairing ailed
equipment. Consider the Indonesian pulp and paper
A Cinese company povidingcoa miningsuppot
andeseac anddeveopment fomacineyinks
empoyees’yea-endbonusestoteienegyconse-
vationpefomance.Efciencyexpetssuggestedtat
te company aso inkits pesonne poicy(pomo-
tions,saaies)toenegyconsevation.ManyCinese
entepisesavesucpoicies.Empoyeesinhubei
huazongPamaceuticaCo.,ltd.aeeigibefoa
ewadofupto28pecentofenegyexpensesbeowabaseine;teyaepenaizedupto28pecentofenegy
expensesabovetebaseine.
Source: Zeng and Rong 2010.
Box 5.3
Carrots and stics or energy eciency

8/2/2019 Unido Full Report eBook
http://slidepdf.com/reader/full/unido-full-report-ebook 109/259
90
B A r r I E r S T OI ND U S T r I A l
E NE r GY E F F I C I E N C Y
5
“ Firms’ decisions on how much energy to
consume and whether to invest in industrial
energy eciency are heavily infuenced by energy
prices, which rarely refect the environmental
costs o energy consumption, particularly the
costs associated with greenhouse gas emissions
company that contracted out its compressed air supplyto a third party, relying on the contractor to provideenergy consumption data, identiy options and moni-tor savings. But because the contractor’s ee was notdetermined by how much the company reduced itsenergy consumption, the contractor had no incentiveto accurately document savings opportunities (Punte,Repinski and Gabrielsson 2007).
Energy prices and unreliability o supply
Firms’ decisions on how much energy to consumeand whether to invest in industrial energy eciencyare heavily inuenced by energy prices. While tempo-rary energy-price hikes could encourage some energyconservation, the savings will be limited by the long liespans and slow turnover o energy-using equip-ment. However, longer term energy price increases aremore likely to inuence industrial energy-eciency
investments, as rms have more time to develop new products and processes (Gillingham, Newell andPalmer 2009).
Consider utilities. In some developing countries,electric utility companies charge ar more than mar-ginal costs, reaping monopoly proits, because o imperect competition. In other countries, regulatorsmay require utility companies to set prices that pre-clude excessive prots – sometimes to the extent that
prices do not cover the cost o energy supply. In both
cases, electricity pricing aects whether companiesinvest in industrial energy eciency. Energy pricesrarely reect the environmental costs o energy con-sumption, particularly the costs associated with green-house gas emissions. I these negative environmentalexternalities were actored into the price, the num-ber o protable industrial energy-eciency projects
would likely soar.Energy prices also inuence the rate o innova-
tion and diusion o energy-ecient technologies(Anderson and Newell 2004; Hassett and Metcal 1995; Jae, Stavins and Newell 1995). Higher energy
prices are associated with signicantly higher rateso adoption o industrial energy-ecient equipment(Anderson and Newell 2004; Hassett and Metcal
1995; Jae, Stavins and Newell 1995). Empirical esti-mates show that adoption and innovation o energy-ecient technology respond strongly to energy pricechanges (Popp, Newell and Jae 2009).
Tus, subsidizing energy by keeping prices arti-cially low can inate energy consumption, something users recognize. For example, a Nigerian producero electronic parts said that he makes no eort to
become more energy-ecient because prices are so low(Masselink 2009). A subsidy that lowers uel prices toend-users leads to higher demand, encourages waste,
promotes inecient resource use and increases energyconsumption (UNEP 2008). Developing coun-tries account or the bulk o global energy subsidies(Box 5.4).
Many respondents in an industrial energy-eciency study in Asia viewed energy subsidies asa major barrier to energy-eiciency improvements
(UNEP 2006c). Energy costs were not a large enoughshare o total expenditures or companies to place ahigh priority on improving energy eciency. Whenenergy prices are artiicially low, energy-eiciencyinvestments are less protable than they would be attrue cost (Jaccard 2009). Energy the and payment
TeIntenationaEnegyAgencyestimatestatgobasubsidiesfofossifuestotaed$312biionin2009,
witoipoductsaccountingfo40pecent,natua
gasfo27pecentandcoafo2pecent.Ineconomic
vaue,Ianeadswit$66biionayeainenegysub-
sidies,foowedbySaudiAabiawit$35biion,te
russianFedeationwit$34biionandIndiawit$21
biion.Tenextsix–Cina,Egypt,Venezuea,Indone-
sia,teUnitedAabEmiatesandUzbekistan–ave
subsidiesofmoetan$10biioneacayea.
Unde-picingisagestfonatuagas.Consum-
esinnon-OECDcountiespayesstan50pecentof
itstueeconomicvaue.Ianasan82pecentsubsidyongasoine;Venezueaasa 96pecentsubsidyon
diesefue.
Source: IEA 2006b, 2010e.
Box 5.4
Developing countries are the biggest energysubsidizers

8/2/2019 Unido Full Report eBook
http://slidepdf.com/reader/full/unido-full-report-ebook 110/259
91
B A r r I E r S T OI ND U S T r I A l
E NE r GY E F F I C I E N C Y
5
“ Industrial energy-eciency measures
are requently ignored because any
savings that could be realized would not
compensate or the enormous losses
caused by power supply deciencies
evasion oen urther reduce the incentive to conserve(Mallett 2010).
Prudent and well planned removal o subsidies will improve productivity, spur economic growth andboost conservation. Progressively phasing out ossiluel subsidies could cut global primary energy demandan estimated 5 percent by 2020 – equivalent to thecurrent consumption o Japan, the Republic o Korea
and New Zealand combined (IEA 2010e). Phasing them out immediately could reduce global energydemand 5.8 percent by 2020.
Another key barrier to improving industrialenergy eciency in developing countries is unreliableenergy supply, caused in part by inadequate invest-ment as a result o distorted energy prices. Unreliableenergy supplies encourage rms to invest in expen-sive and inecient standby power systems, thus rais-ing energy costs. Moreover, the poor quality o power
supply rom the grid (network surges, requent inter-ruptions) may prevent use o the advanced electroniccontrols that come with many imported technologies.
In Nigeria, some industries receive as little as 4.5hours o power a day, and the highest daily level in anyregion is 12.5 hours (Okaor 2008). Companies’ ownenergy generation accounts or up to 20 percent o installed capacity in Nigeria and 6 percent across sub-Saharan Arica (Steinbuks and Foster 2010). Privategenerating acilities are costly to establish, operate and
maintain, and they drain capital that could go to more productive investments (Okaor 2008; Steinbuks andFoster 2010).
Many developing country governments viewenergy conservation as a luxury and have shown lit-tle interest (Reddy 1991). At the rm level, the ocustends to be more on the supply o power than on thecost o energy. Industrial energy-eciency measuresare requently ignored as a means o reducing produc-tion costs. Any savings that could be realized throughindustrial energy-eciency projects would not com-
pensate or the enormous losses caused by power sup- ply deciencies.
Unreliable power supply impedes the adoptiono industrial energy-eciency measures because in
countries plagued by erratic power supply, rms tendto be less concerned about energy eiciency thanabout access to energy. Tere is a correlation betweeneconomy-wide industrial energy-eciency rates andblackouts. Industrial energy eiciency is generallylower in countries with more power outages than incountries with a reliable power supply (Figure 5.1).For example, Uruguay, with a high level o industrial
energy eciency, averages only 0.29 power outage amonth; Nepal, with a low level, averages 52.
Limited access to capital
o invest in an industrial energy-eciency project,a irm needs unding either rom retained proitsor equity or rom a commercial bank or specializednancial institution. Several actors related to capi-tal market ailures make getting a loan or industrialenergy eciency dicult in developing countries.
One issue is shortalls in technical capacity innancial institutions. Missing or incomplete nancial
0
6
12
18
0
20
40
60
2 0 0 5 P P P $ p e
r k i l o g r a m o
f o i l e q u i v a l e n t
GDP per unit of energy use
Number of power outages
in a typical month
N e p a l
P a k i s t
a n
C a m b o
d i a
N i g e
r i a
C o n g o , D
e m . R e p
. o f
S y r i a
n A r a b R e
p .
B e n i n
L i t h u
a n i a
A r g e
n t i n a
C o l o m
b i a P e r u
P h i l i p p
i n e s
B o l i v i a ,
P l u r
i n a t i o n
a l S t
a t e o f
U r u g
u a y
Figure 5.1
Energy eciency and power supply reliability inselected countries, most recent year available
The higher the energy eciency, the ewer the blackouts
Note: PPP$ is purchasing power parity in international do llars.
Source: World Bank 2010a,b.

8/2/2019 Unido Full Report eBook
http://slidepdf.com/reader/full/unido-full-report-ebook 111/259
92
B A r r I E r S T OI ND U S T r I A l
E NE r GY E F F I C I E N C Y
5
“ Missing or incomplete nancial
and ris insurance marets create high
barriers to industrial energy-eciency
investments in developing countries
and risk insurance markets create high barriers toindustrial energy-eciency investments in develop-ing countries (aylor et. al. 2008). Enterprise studiesstress not only the importance o access to capital toimplement industrial energy-eciency projects butalso the diculties (Sorrell, Mallett and Nye 2011).
Te main problem is that local nancial institu-tions lack the technical capacity and experience to
assess the credit-worthiness o rms and the risks andopportunities o the investments (De Simone 2010).According to India’s Energy and Resources Institute(ERI), many Indian bankers lack the means andknowledge to evaluate industrial energy-eiciencytechnologies or nancing. In many cases, new tech-nologies are perceived as unproven and thus especiallyrisky, despite the absence o any scientic evidence o such risk. Te underlying project risks are thus oenoverestimated (Sethi and Ghosh 2008). Furthermore,
domestic unders oen have limited nancial alterna-tives to oer, and that requently precludes lending orindustrial energy eciency.
Another barrier is access to external capital.Lending or investment is an underdeveloped parto the nancial sector in many developing countries.Oten, irms can borrow only or working capital(running current operations) but not or investing inenergy-ecient capital goods. Procedures or estimat-ing and managing risks and dealing with deaults,
including collecting collateral, are not well estab-lished. As a result, banks charge interest, set collat-eral requirements and expect repayment at rates thatcannot reasonably be met and that make capital tooexpensive.
Small rms have the most diculty getting capitalbecause o higher risks o ensuring repayment, costs tothe lender o establishing credit-worthiness, small sizeo industrial energy-eciency projects, lack o ade-quate security or loans and limited experience in thedomestic nancial sector with assessing loan requestsor industrial energy-eiciency projects (ArquitNiederberger and Spalding-Fecher 2006). SmallBolivian breweries could not switch rom inecient
wood-ired production processes to more eicient
natural-gas-uelled processes because nancial insti-tutions, unable to understand the projects, would notund them (ESMAP 2007). Government constraintson investment nancing are an additional hurdle, astypied by China (Box 5.5).
Energy price volatility can make it even harderto obtain industrial energy eciency–related loans.According to a respondent in the Colombian metal-
working sector, energy price luctuations make it
harder to obtain external nance or energy-eciency projects. hese luctuations introduce additionaluncertainties about the rates o return, increasing
project risk and making banks less likely to lend (DeSimone 2010).
Behavioural and institutional ailures:
bounded rationality
Another set o barriers results rom limitations o human decision-making, or bounded rationality.
Imprecise evaluation methods
Because o constraints on time, attention, resourcesand capacities, optimized analyses give way toimprecise routines – rules o thumb that result in
A study of industia enegy-efciency nancingin
Cinafoundtattegovenmentadbaedendingto
steeandcementcompaniestoceckteexpansion
ofeavyindusty,bockingapatfoenegy-efciency
nance. Testudyasofound tat numeousues
discouagedendingfoenegyefciency.Domestic
banksweenotpemittedtoendatinteestatesofmoetanabout8pecent,encouagingtemtobe
isk-aveseandautomaticayexcudingong-gestation
industia enegy-efciency pojects. limits on te
annuagowtofoansundeminedteeffectiveness
ofongetemgeenoanpogammesfoindustia
enegy-efciencyimpovements.Anotestudyfound
tat because ony two banksweeaowedto ave
bancesinuaaeas,Cineseviageentepises
adimitedaccesstocapita.
Source: Worrell et al. 2001; Chandler and Gwin 2008; Yanjiaa and Chandler 20 09.
Box 5.5
China: policy impediments to nance orinvestments in industrial energy eciency

8/2/2019 Unido Full Report eBook
http://slidepdf.com/reader/full/unido-full-report-ebook 112/259
93
B A r r I E r S T OI ND U S T r I A l
E NE r GY E F F I C I E N C Y
5
“ Imprecise evaluation methods help explain
why companies sometimes decide against
protable energy-eciency investments and
or non-protable production investments
decisions that stray ar rom the theoretical ideal.In organizations, this could mean ocusing on coreactivities, such as the primary production pro-cess, rather than on subordinate concerns, such asenergy use (DeCanio 1993; Sandstad and Howarth1994; Sorrell, Mallett and Nye 2011; Stern 1986).Oen, stringent internal limits are imposed on capi-tal investment, even not nancially optimal. Even
with sophisticated energy-management practices,good inormation and appropriate incentives, time-constrained managers typically ocus only on large
projects, overlooking more modest industrial energy-eciency options.
Imprecise evaluation methods help explain whycompanies sometimes decide against proitableenergy-eciency investments and or less-protable
production investments. Empirical studies nd thatinvestment analysis is requently conducted late
in decision-making and oen to validate decisionsalready made. What determines whether an invest-ment goes ahead is its contribution to the irm’sobjectives – including how much it would contributeto competitive advantage (Sorrell, Mallett and Nye2011). A review o the use o ormal capital budgeting tools or investment decision-making ound that even
when nancial calculations were properly undertaken,they were not ully used (Cooremans 2009). Formalcapital budgeting, which would green-light invest-
ments with the highest net present value, typically played only a partial role.
Internal capital budgeting rules
Internal capital budgeting procedures also discrimi-nate against industrial energy-eiciency projects(Schleich 2011).1 As Chapter 4 details, the rule o thumb or industrial energy-eciency projects is a pay-back period o around two years. Other types o invest-ment do not seem to be subject to similar demands,and there is no obvious rationale or a two-year period.wo years leaves little time to recover capital costsin industrial projects, which requently take muchlonger to yield results. Tis applies as much to smallPeruvian textile companies as to large Colombian
metal producers (De Simone 2010). In addition, using a simple payback rule neglects the time-value o moneyand the expected positive cash ow rom energy costsavings in the longer run. Finally, the non-energybenets o industrial energy eciency are oen over-looked. More ecient urnaces, or example, are morereliable and reduce down time, improving productiv-ity (Worrell et al. 2003).
Concerns about disrupting production
Fear o complexity and disruption also inuences bor-rowing or industrial energy-eciency investments.In many developing countries, corruption, politicalinstability and high ination rates increase invest-ment risks, while national trade and investment poli-cies oen limit inows o oreign capital and technol-ogy. Both uctuating energy prices and high inationrates discourage investments that pay back over a long
period. According to a Colombian auto-parts pro-ducer, energy price uctuations cloud calculations o
payback periods, making industrial energy-eciencyinvestments harder to nance externally (De Simone2010). Companies deal with these uncertainties byrequiring higher rates o return. While this mayappear to be a rational response (Sorrell et al. 2004),overestimating the risks seriously impedes industrialenergy-eciency projects.
Fear o disrupting production and reducing
product quality and sales was the biggest barrier ortwo Vietnamese textile manuacturers considering aswitch to modern productivity and industrial energyeiciency–enhancing machinery (Le 2010). Fearo such risk oen means orgoing energy-eciency
projects that external experts would consider costeective but that rms see as too complicated ortoo disruptive. Tese risk perceptions reinorce thebias towards purchasing technologies with the low-est capital cost even though running costs are higher– encouraging, or example, the purchase o ine-cient, second-hand equipment (Worrell et al. 2001).Economically, the better approach would be to actorthe costs or production interruption into the nan-cial analysis.

8/2/2019 Unido Full Report eBook
http://slidepdf.com/reader/full/unido-full-report-ebook 113/259
94
B A r r I E r S T OI ND U S T r I A l
E NE r GY E F F I C I E N C Y
5
“ At any given time, a technology survey can
nd unexploited energy-eciency opportunities,
even though the opportunities would naturally be
exploited as equipment and structures are renewed
Top-down decision-making
Hierarchical management structures can also impedeinvestments in energy eciency, discouraging sta rom suggesting improvements, even i there are or-mal procedures or doing so (Masselink 2009). In anAsian paper company, or instance, when consultantsidentied simple good housekeeping options that
would reduce costs and save resources, the sta did
not report the suggestions to management becausethey eared negative repercussions (Punte, Repinskiand Gabrielsson 2007). Tis nding lines up withsurvey results showing that small and medium-sizerms in India made decisions on industrial energy-eciency projects primarily through a top-down
process (Ghosh 2011). Projects were much morelikely to be implemented i the rms’ owner avouredthem.
Hidden costsEconomists sometimes argue that when engineerscalculate the gains o implementing industrial energy-eciency technologies, they ail to account or hiddencosts – costs hidden rom the analyst but not romthe organization – and so overstate the gains (Sorrell2009; Sorrell, Mallett and Nye 2011; able 5.1). Manyeconomists argue that hidden costs explain much o the “eciency gap” so oen noted (Jaccard 2009). In
principle, such costs can be quantied and included as
production, management and transaction costs in thetechno-economic easibility analysis, though in prac-tice this is not straightorward.
Hidden production costs
Most hidden costs could be lumped in with produc-tion costs, which should be taken into account whenappraising investment opportunities (Sorrell, Mallettand Nye 2011). But many production costs are site-specic and dicult to estimate, so they are easilyoverlooked. Examples include design ees or large
plant items and civil engineering costs associated withinstalling a cogeneration unit. When production hasto be shut down to install new energy-ecient equip-ment, costs can include orgone sales income.
Another group o production costs concern the weaker perormance o industrial energy-eciencytechnologies along dimensions other than energyconsumption. An energy-eciency production pro-cess might be noisier than the equipment it replaces.Insulating a cavity wall in an old building could resultin moisture build-up, or installing a variable-speeddrive might require extra maintenance or new skills
and tools.
Search costs
Hidden costs are also associated with obtaining, veri-ying and assessing inormation on energy-eciencyopportunities, such as the cost o identiying suppliersand obtaining inormation on price, quality and termso trade. Tese search costs are strongly inuencedby the characteristics o energy service markets andby the nature o energy eciency as a good. Search
costs are determined in part by actors outside a rm’scontrol, such as the existence (or not) o standardizedlabelling schemes and by internal actors, such as com-
pany procedures or gathering inormation and speci-ying, purchasing and procuring the new equipmentor process. Developing country rms may nd it morecostly to improve energy eciency, because an array o economic and political actors oen boost their searchcosts (Sorrell, Mallett and Nye 2011).
Transaction costsOverhead costs o energy management are hidden as well, including or employing specialists and conduct-ing energy audits (Sorrell, Mallett and Nye 2011). Lowlabour costs relative to energy costs (unless energy useis heavily subsidized) in developing countries mightsuggest that the energy-management overhead wouldbe less o a barrier than in developed countries. Tisargument would not hold, however, or tasks requir-ing higher skill levels, typically the case or complexindustrial technologies (Schleich 2011).
Other transaction costs that might be a greaterbarrier in developing countries include the costs oridentiying opportunities, investigating options,appraising the investment and obtaining nancing

8/2/2019 Unido Full Report eBook
http://slidepdf.com/reader/full/unido-full-report-ebook 114/259
95
B A r r I E r S T OI ND U S T r I A l
E NE r GY E F F I C I E N C Y
5
“ In enterprise surveys or this report,
the top-raned barrier to energy-eciency
investments was accessing capital
(Sorrell, Mallett and Nye 2011). A study o smal l glassrms in India ound that they ruled out debt nanceor industrial energy-eciency projects because o
their inability to comply with the numerous ormali-ties required or a bank loan (see Box 5.2).
Premature equipment retirement
Another hidden cost is the early retirement o capitalequipment. Te eciency o equipment and structurestypically increases over time, and as capital stocks arerenewed, rms tend to acquire more ecient equip-ment. Tis means that at any given time, a technol-ogy survey can ind unexploited energy-eiciency
opportunities, even though the opportunities wouldnaturally be exploited as equipment and structures arerenewed in coming years (Jaccard 2009).
Te costs o accelerating this “natural” rate o renewal include not only the incremental capitalcost o more ecient equipment but also some o the ull costs o the old equipment, which likelystill had years o good service. I a rm decides toreplace a piece o equipment at the age o, say, 7
years, even though it could have lasted 12, the over-all cost would include not only the money spent onthe more ecient equipment but also the returnover ve years that the rm could have earned withthe old equipment. I the lost value rom prematureequipment retirement is greater than the net prots
rom acquiring the more ecient device, the rm isnancially worse o (Jaccard 2009). Tis considera-tion is especially important in developing countries,
where the average age o capital equipment is typi-cally much higher.
Rebound eect
Although not precisely a barrier to the adoptiono industrial energy-eiciency improvements, the“rebound eect” is a related behavioural issue thatcan aect such investments (Box 5.6). Improvementsin energy eciency can lead to increased demand orenergy and energy services, lowering the initial gains
rom energy-eiciency investments. he reboundeect is related to the price elasticity o demand. Asthe cost (price) o energy alls as a result o higherenergy eciency, demand rises. In some cases (as inthe case o iron and steel early in the 19th century, orcomputers and semi-conductors in modern times), thehigher demand could even cancel out any energy sav-ings rom eciency gains (Ayres 2010).
How the importance o barriers varies
All these barriers do not aect rms the same way.Some rms might be more sensitive to some types o barriers than to others.
In enterprise surveys or this report, 96 rmsin developing countries (two-thirds large irms
Cost Example
General overhead costso energy management
• Specialists (such as an energy manager).• Energy inormation systems (including gathering energy consumption data, maintaining
submetering systems, analysing data and correcting or infuencing actors, andidentiying aults).
• Energy audits.
Costs involved inindividual technologydecisions
• Project identication, detailed investigation and design and ormal investment appraisal.• Formal procedures or approving capital expenditures.• Specication and tendering or capital works to manuacturers and contractors.•
Additional sta costs or maintenance.• Sta replacement, early retirement or retraining.• Disruptions and inconvenience.
Loss o utility associatedwith energy-ecientchoices
• Problems with saety, noise, working conditions and service quality (such as lightinglevels).
• Extra maintenance and lower reliability.
Source: Sorrell, Mallett and Nye 2011.
Table 5.1
Hidden costs associated with investments in industrial energy eciency

8/2/2019 Unido Full Report eBook
http://slidepdf.com/reader/full/unido-full-report-ebook 115/259
96
B A r r I E r S T OI ND U S T r I A l
E NE r GY E F F I C I E N C Y
5
“ Small rms ace severe liquidity constraints,
and their capital base is usually not strong
enough to nance energy-eciency investments.
Large rms have greater capacity to improve
energy eciency – and stronger incentives
and one-third small) were asked to rank barriers inorder o importance (UNIDO 2010h). Tough nota representative sample, the responses shed light onthe perceived importance o dierent barriers indierent sectors. Te top-ranked barrier to energy-eciency investments was accessing capital. Alsohigh on the list was investment risk – whether aris-ing rom uncertainty about the duration o the pay-back period, technical perormance, uture energy
prices or some other source – combined with limitedcompany savings. Overall, the ndings were consist-ent with those o a study on barriers to the adop-tion o environmentally riendly technologies in the
pulp and paper, textiles, leather, and iron and steel
industries in developing countries (Luken and VanRompaey 2008).
Firm size
Small and medium-size enterprises report more bar-riers to improving industrial energy eciency thando larger rms (Figure 5.2). Operating closer to theedge and unable to aord a capital loss, smaller rmsinvest more careully. Small rms ace severe liquid-ity constraints, and their capital base is usually notstrong enough to nance energy-eciency invest-ments (Worrell and Price 2000). In addition, smallrms are less likely than large rms to have inorma-tion about investment opportunities or the skills or
Someanticipatedbeaviousmaykeepenegyconsump-
tionfomfaingbyasmucaswoudbeexpectedfom
adoptingindustiaenegy-efciencyimpovements.One
iscommonyknownasteeboundeffect.
Wieimpovingenegyefciencycaneduceabso-
uteenegyconsumption,itcanasodiveaeboundin
demandfoenegyandenegysevices,esutinginmoe
modestgainsinenegyefciencyoeveningeateenegyconsumption.Anexampeistedivewoepacesaca
witamoefue-efcientmode,onytotakeadvantageof
itsceapeunningcoststodivefuteandmoeoften.
reboundeffectsaveongbeennegected,butteicon-
sequencescoudbepofound.
Since enegy-efciency impovements educe te
maginacostofenegysevicessucastave,tecon-
sumptionoftosesevicesmaybeexpectedtoincease.
Indeed, impoved industia enegy efficiency causes
beavioua andeconomic esponses – suc asmoe
intenseuseofmoeefcientequipment,e-spendingof
moneysaved,anddiffusionofmoeefcientandteefoe
attactivetecnoogies–tatoffsetsomeoftepedicted
eductioninenegyconsumption.Teenegyebound
canbediect,sucasintakingadvantageofceape
maginacostsofenegysevicesandtenusingmoe
enegyovea,oindiect,sucastougsavingsfom
impovedenegyefciencytateadtoinceasedcon-
sumptionofotegoodsandsevices.
reboundeffectsappyequaytotepoductionside
ofteeconomy,weetepotentiafoageeffectsmay
begeate.Foexampe,owecostenegyseviceswi
substitutefocapitaandabou,offsettingsomeofte
anticipated eductionin enegy consumption. Poduc-
esmay aso usecost savings fom enegy-efciency
impovementstoexpandoutput,inceasingconsumption
ofenegyinputsasweascapita,abouandmateias,
wicasoequiemoeenegy.Ifteenegy-efciency
impovements ae secto-wide,tey can eadto owepoductpices,inceasedconsumptionofteeevant
poducts and fute inceases in enegy consump-
tion.Ateseimpovementswiinceaseteeconomy’s
poductivity–encouagingeconomicgowt,inceased
consumptionofgoodsandsevicesandinceasedenegy
consumption.
rebound effects may be mitigated by gaduay
inceasingcabonandenegytaxesoimposinginceas-
ingystingentcapandtadescemes.Emissioneduc-
tionswinotbeacievedbyefciencyeffotsaonebut
wiequiegeateempasisonateoteevesto
attaincimatemitigationgoas.
Moefundamentay,botanaystsandpoicy-makes
needtoecognizeteimpotanceofsuceffectsandof
takingtemintoaccountinpoicyappaisas.Indeveop-
ingcounties,especiay,itcanbeaguedtatamagina
inceaseinincomewibeusedfogoodsandsevices
tataemoeenegyintensivetanteeconomy’save-
age.Ifso,teeboundeffectmustbetakenseiousyand
additionapoicyinstumentsmigtbeneededtocom-
pensatefoit.
Source: Van den Bergh 2010, 2011; Sorrell and Dimitropoulos 20 07; Jenkins and Saunders 2011.
Box 5.6
The rebound eect

8/2/2019 Unido Full Report eBook
http://slidepdf.com/reader/full/unido-full-report-ebook 116/259
97
B A r r I E r S T OI ND U S T r I A l
E NE r GY E F F I C I E N C Y
5
“ In continuous process sectors, which
typically have high energy intensity, the ris
o interrupting production constitutes a major
barrier to process-related investment
policies to implement them. Smaller rms appear toace higher relative costs in obtaining energy con-sumption data and in comparing their perormance
with sector benchmarks (Sorrell, Mallett and Nye2011).
Large irms have greater capacity to improve
energy eiciency – and stronger incentives. hebarriers they ace dier rom those o smaller rms(Sorrell, Mal lett and Nye 2011). Fear o productioninterruptions was much more o a concern or largerrms, and low energy prices were a greater impedi-ment to energy-eiciency investments than orsmaller rms.
Although large rms considered corporate invest-ment priorities a greater barrier than did smaller rms,the dierence was marginal. his inding becamemore nuanced during the interviews, as large rmsnoted that the importance o the barrier depends onthe scale o the project. An energy-saving improve-ment may require small investments (such as opera-tional and housekeeping improvements, incremental
technological changes and retroitting) or a largeinvestment (replacement equipment and processes).Large investments are generally assessed more strin-gently and less avourably than smaller ones. o makethe improvements more attractive inancially andmore acceptable, companies oten old them intoan existing programme to upgrade equipment and
processes. Tereore, the willingness to pursue these
investments may depend more on other projects in the pipeline than on estimated returns (Sorrell, Mallettand Nye 2011).
Energy intensity o production process
In determining the importance o a particular barrier,the nature and related energy intensity o a rm’s pro-duction process appears to be as relevant as its size – i not more. While production interruptions might bemore important in capital- and energy-intensive sec-
tors such as cement and pulp and paper, sta time con-straints and nancial concerns are oen greater bar-riers in discrete product sectors. Also, because energyconsumption typically accounts or a large share o operations costs in continuous process production,such rms usually already have substantially reducedenergy use (AHAG 2008). Since additional reductionsare more costly, behavioural barriers and government
policies oen become more inuential in determining investment decisions.
In discrete product and combined industry sectors,both large and small rms pay much less attention toenergy eciency than do rms in process industries.Interviews ound that when energy costs account ora small share o a company’s total costs, managementhas little interest in investments to reduce energyconsumption. Te hassle o upgrading technology ormodiying established operations was considered tooset the potential cost savings. But it is importantto distinguish between relative and absolute savings.For example, a Colombian coee producer was spend-ing more than $3 million a year on energy – only 1.4
percent o production costs but clearly a substantialabsolute sum – and potential cost savings were largerelative to the prot margin. (De Simone 2010).
Large firmsSmall and medium-size firms
Low energy costsFinancingdifficulties(external)
Lack of generalmanagerial commitment
Long payback periods
Low profitability
Lack of expertise
Inadequate orinsufficient
governmentpolicies
Fear ofproductioninterruptions
Lack ofinformation
Insufficientinternal capital
Otherinvestmentpriorities
45
40
35
30
25
20
15
10
5
0
Figure 5.2
Percentage o rms mentioning specicbarriers to energy eciency as mostsignicant, 2010
Key barriers or small and medium-size rms are insucient internal
capital and inadequate or insucient government policies
Source: UNIDO 2010h.

8/2/2019 Unido Full Report eBook
http://slidepdf.com/reader/full/unido-full-report-ebook 117/259
98
B A r r I E r S T OI ND U S T r I A l
E NE r GY E F F I C I E N C Y
5
“ The hidden costs o energy management
are an important barrier to energy-eciency
improvements or a majority o rms
In continuous process sectors, which typicallyhave high energy intensity, the risk o interrupting
production constitutes a major barrier to process-related investment. A survey o US cement custom-ers ound that the reliability and continuous opera-tion o the plant are their highest priorities (Coitoet al. 2005). Shutting down a plant to install newequipment can jeopardize the integrity o the kilns.A study o the Swedish pulp and paper sector oundthe same thing (hollander and Ottoson 2008;Figure 5.3).
Perceptions about barriers
Barriers in access to inormation – such as details onthe rm’s energy perormance or opportunities orimproved eciency – are considered much less impor-tant in continuous process industries (Sorrell, Mallettand Nye 2011). A majority o energy-intensive rmssurveyed by UNIDO regularly monitored energy useat both the plant and the individual process levels, and
both managers and engineers considered themselves well inormed about energy-eciency opportunities(UNIDO 2010h). Te culture o energy monitoring and submetering in energy-intensive rms also less-ened the incidence o split incentives. With energyconsumption closely monitored, associated costs canbe more easily assigned to the appropriate depart-ments. Te Swedish pulp and paper industry oundlack o accountability or energy costs to be the leastimportant barrier to energy eciency, largely because
o technically competent sta and the use o sub-metering to allocate energy costs to departments(Tollander and Ottosson 2008).
Economic trends also aect perceptions about bar-riers. Like pulp and paper, the oundry industry inSweden is energy-intensive. It is also more electricity-intensive than other European oundries because o tight environmental controls that motivated a switchto electric urnaces – enabled by the low electric-ity prices beore the market was liberalized. A recent
survey ound that limited access to capital is consid-ered the greatest barrier today (Rohdin, Tollanderand Solding 2007) – which is not the case or largerms in other energy-intensive industries (Tollanderand Ottosson 2008; Hasanbeigi, Menke and du Pont2010). More than two-thirds o the Swedish oundrysample had been in the red the previous three years,and they were reluctant to consider third-party nanc-ing. In this case, dynamic economic conditions seemto have altered the relative importance o the barriers.
In a principal-component analysis o the perceivedbarriers to adoption o industrial energy-eciencytechnologies in 450 manuacturing rms in Moldova,the Philippines, Singapore and Viet Nam, Cantore(2011a) and Cantore and Cali (2011) regressed the
Department or workers notaccountable for energy costs
Conflicts of interest within the mill or company
Uncertainty regarding the company's future
Cost of staff replacement, retirement and retention
Difficulties in obtaining information about theenergy use of purchased equipment
Poor information quality regardingenergy efficiency opportunities
Energy objectives not integrated into operating,maintenance or purchasing procedures
Low priority given to energy management(by the company board)
Lack of submetering
Energy manager lacks influence
Lack of technical skills
Cost of identifying opportunities,analyzing cost effectiveness and tendering
Long decision chains
Other priorities of capital investments
Lack of staff awareness
Lack of budget funding
Possible poor performance of equipment
Lack of access to capital
Slim organization
Lack of time or other priorities
Technology is inapropriate at the mill
Cost of production disruption,hassle or inconvenience
Technical risks such asrisk of production disruption
0 0.2 0.4 0.80.6 1
Degree of importance
(0, least important, to 1, most important)
Figure 5.3
Raning barriers to industrial energy eciencyin the Swedish pulp and paper sector
Technical risks are a big concern in the Swedish pulp and paper sector
Source: Thollander and Ottoson 2008.

8/2/2019 Unido Full Report eBook
http://slidepdf.com/reader/full/unido-full-report-ebook 118/259
99
B A r r I E r S T OI ND U S T r I A l
E NE r GY E F F I C I E N C Y
5
“ Experience with industrial energy-eciency
technology investments increases the probability
o implementing another energy-eciency change
results against the irms’ adoption o industrialenergy-eiciency technologies. Identiied barriersincluded insucient commitment by top manage-ment, lack o expertise in energy eciency, risk o
production interruptions, lack o capital, insui-cient inormation on costs and benets, low market
valuation o industrial energy-eciency investments,inadequate government policies promoting energy
eciency and lack o external drivers, such as manda-tory carbon dioxide emission targets. Adoption wasdened as the probability o investing in industrialenergy eciency within the next ve years. Tree pri-mary conclusions emerged:• For explaining technology adoption, microeco-
nomic conditions, such as possible productioninterruption, top management commitment andlack o internal nance, were more important thanmacroeconomic actors, such as insucient public
inormation, low market valuation or inadequate policies.
• Among microeconomic barriers, lack o commit-ment by upper management is a top concern. Tisaligns with ndings rom the study on barriers inTailand’s textile sector (Hasanbeigi, Menke anddu Pont 2010).
• Experience with industrial energy-eiciencytechnology investments increases the probabil-ity o implementing another energy-eiciency
change.o summarize, the hidden costs o energy man-agement appear to be an important barrier to energy-eciency improvements or a majority o rms, whilethe risk o production disruptions is more importantor energy-intensive rms and diculties accessing capital or smaller rms. Barriers oen overlap or rein-orce one another, and they are strongly inuenced by
context, such as capital market operations and govern-ment promotion o energy eciency .
* * *
All too oen, rms are unaware o the advantages andopportunities rom investing in energy-ecient tech-nologies, especially in developing countries, where
inormation barriers are pervasive. When rms do want to invest, they cannot easily obtain the und-ing needed to buy the new equipment or modiy the
plant. Decision-makers do not always benet directlyrom energy-eciency investments, and estimating the costs, benets and risks o those investments is di-cult. Energy subsidies, common in developing coun-tries, urther undermine the attractiveness o investing in energy eciency, as do broader institutional, eco-nomic and technical conditions. Where energy supply
is unreliable, rms are more concerned with availabil-ity than with eciency. Similarly, small and medium-size industrial rms nd it much harder to get a loanthan do larger rms. And while the barriers to energyeciency are also present in developed countries, theyare more ormidable in developing countries.
What can be done about these barriers, and whoshould do it? What are the appropriate roles o the
public and private sectors? How are developing coun-tries dealing with the barriers? Tese topics are the
ocus o Chapter 6.
Note
1. Internal capital availability also reects priority-setting in companies, which is the terminol-ogy used in various empirical studies, including Schleich and Gruber (2008), hollander andOttosson (2008) and Schleich (2009).

8/2/2019 Unido Full Report eBook
http://slidepdf.com/reader/full/unido-full-report-ebook 119/259
100
Chapter 6
Overcoming barriers to industrial
energy eciency through regulationand other government policies
Chapter 5 identiied barriers inhibiting industrialirms rom investing in cost-eective and sociallydesirable improvements in industrial energy eciency.So the crucial questions, particularly or developing countries, are: How to shrink or overcome the barri-
ers? How to reduce the hidden costs associated withenergy-eciency investments? Which policies andactions are the most eective, economically ecient,administratively easible and politically acceptable toresolve these problems?
Countries that have improved industrial energy e-ciency have achieved this by creating an enabling govern-ance ramework through coordination and cooperationamong stakeholders and through regulatory mandates.Behavioural changes require policies with strong imple-
mentation mechanisms and regular evaluation.his chapter reviews the national policy rame-
work or industrial energy eciency and explores theadvantages and disadvantages o dierent instrumentsor overcoming barriers to greater energy eciency indeveloping countries. Te rst two sections address thelegal and governance structure and the setting or intro-ducing policy measures. Te next our ocus on inor-mation policy, innovation and technology support,and market-based and nancial policy instruments or
improving industrial energy eciency. Te last sectionexamines policy design and implementation considera-tions that are important in developing countries.
Establishing the legal and governance
structure or industrial energy-
eciency policy
Developed and developing countries oen supportindustrial energy eciency through legal measures. A2006 review o policies in Asia ound energy conser-
vation laws in China, India, Japan, Tailand and VietNam (UNEP 2006c). In 2009, Indonesia introducedenergy conservation legislation, while the RussianFederation adopted a new ederal law on increasing energy conservation and eciency (APERC 2010a).
Many Latin American countries link industrialenergy-eciency legislation to electric power promo-tion laws (ECLAC 2010).
At the sector level, energy-eciency initiativescan be mandated through legislation or encouraged
through negotiated agreements. Laws typically coverenergy standards, energy-savings plans, regular report-ing o energy consumption and energy auditing,energy managers or energy-intensive industries, andenergy conservation training and technical assistance.Laws also generally stipulate priorities and include taxincentives and subsidies, as well as penalties or non-compliance (Box 6.1).
Energy-eciency legislation generally establishesgovernment regulatory, implementing and coordi-
nation agencies as well as promotional and supportorganizations. Central responsibility or public man-agement o energy policy oen lies with a dedicatedgovernment body, such as the ministry o energy ora national energy-eciency agency (Box 6.2). Teseagencies need a well dened mandate, strong techni-cal skills and a secure source o unding. A specializeddivision is oen created to encourage energy eciencyby disseminating inormation, implementing techni-cal and policy measures, coordinating engagement o
industry players in policy ormulation and implemen-tation, and serving as a ocal point or industry (Clark2000). Increasingly recognizing the importance o such agencies or ostering energy policies, moredeveloping countries are establishing national energy-eciency agencies (WEC 2010).
O the 37 developing countries whose policies were reviewed or this study, 29 have establishedsuch administrative and regulatory bodies (UNIDO2011).1 hey operate a variety o energy-eiciency
plans and programmes addressing specic technolo-gies, such as lighting and motor systems, or specicenergy-eiciency unctions, such as inormation
provision and nancing. In Brazil, or example, theMinistry o Mines and Energy and its Secretariat

8/2/2019 Unido Full Report eBook
http://slidepdf.com/reader/full/unido-full-report-ebook 120/259
101
OV E r C OMI N GB A r r I E r S T
OI ND U S T r I A l E NE r GY E F F I C I E N C Y T hr O U Ghr E G Ul A T I ONA ND OT hE r G OV E r NME NT P Ol I C I E S
6
“ One o the main policy goals should be
to decouple industrial energy and resource
consumption and negative environmental
impacts rom economic growth
India’s EnegyConsevationActestabisedteBueauof
EnegyEfciencytoimpementteaw.Industymandates
incude:
• Committingtonationaenegyconsevationandef-
ciencyeffotsandpogammes.
• Adeingtoenegystandadsandequipmentabes.
• Appointingenegymanagesandcayingoutman-
datoyenegyauditsinfaciitiesopeatingaboveteenegyconsumptiontesod.
India’sBueauofEnegyEfciencyepotstatmany
measuesaestidifcuttoimpement,sucasgate-
ingdatafombusinessesontepefomanceandenegy
consumptionofenegyuses,ontenumbeofenegy
audits pefomed o on teenegy savingsacieved.
Te Bueau estimates tat just appying te manda-
toyenegy-efciencystandadsandabesfoindustia
macineyandcommeciaappiancesassaved11,689
miionkiowattousayeaoveveyeas.
Japan’s EnegyConsevationlawof1979stipuates
tatenegy-intensiveindustiesmust:
• Submitpeiodicepotsonenegyuse.
• Pepaeandsubmitmedium- andong-tempansfo
acievingenegyconsevationtagets.
• Appointenegyconsevationmanages.
• Use poducts w it mandatoy enegy-efficiency
abeing.
• Monitopogesstougeguafactoyinspections.
In2005,teawwasextendedto13,000ageand
medium-sizeindustiamsandenegy-intensivetans-potationbusinessesandbuidings.Enegy-efciencyand
consevationguideinesweeasoaddedfofuebuning,
eating,cooingandeatconduction,ecoveyandeuse
ofwasteeat,convesionofeattopowe,peventionof
enegyosstougadiation,andconvesionofeectic-
itytopoweandeat.Teawencouagesbusinesses
tocoopeateonage-scaeenegyconsevationinvest-
mentsatindustiacompexes.
Teawasesutedineductionsof2,166tonnesof
cabondioxideemissions(fom52,673in1997to50,507in
2005)andeductionsinenegyconsumptionof832kio-
itesofcudeoiequi vaent(fom17,844to17,012).
Source: Adapted rom UNEP (2006d).
Box 6.1
Energy conservation laws in India and Japan
Tunisia estabised a Nationa Enegy Consevation
Agency(ANME)tosuppotitspoicyofenegysecuity
andindependenceandtoeducetenationaenegybi.
ANMEasmadeitapioitytosensitizecompaniestoteimpotanceofenegyefciency.Itaso:
• requiescompanieswit annuaenegyconsump-
tionsofmoetan800tonnesofoiequivaent(toe)to
conductenegy-efciencyaudits.
• Distibutessubsidiesfoindustiaenegy-efciency
pojects.
• Woks witteSociété Tunisienne de Gestionde
’Enegie and te Société Tunisienne d’Eecticité
&Gaztomanageceditfundsfoindustiaenegy-
efciencypojects.
• Identiesindustiaenegy-efciencyincentives.
• runstainingcousesfoenegymanages.
ANME tackscompaniestat consumemoetan
800 toeayeaandemindstemwenteienegyaudits
aedue.ANMEas designated enegy-auditingms,
wicpepaeappicationsfoindustiaenegy-efciency
subsidiesandoans.
Industia enegy-efficiency pojects ae financedeiteentieybyANMEotouga40–60spitbetween
ANMEandbanks.Teeaeteetypesofgovenment
subsidies:
• Foenegyaudits:70pecentoftecost,upto30,000
dinas.
• Fointangibeinvestment(sucastaining):70pecent
oftecost,upto70,000dinas.
• Fotangibeinvestment(sucasequipment):20pe-
centoftecost,upto500,000dinas.
ANMEcaimsacumuativeenegysavingof676 ki-
otonnes of oiequivaent (ktoe) soey fom industia
enegy-efciencypojectsove2004–2008.Itassesses
te potentia fo enegy savings fo 2008–2011 at
400 ktoe.
Source: UNIDO 2011.
Box 6.2
Tunisia’s National Energy Conservation Agency

8/2/2019 Unido Full Report eBook
http://slidepdf.com/reader/full/unido-full-report-ebook 121/259
102
OV E r C OMI N GB A r r I E r S T
OI ND U S T r I A l E NE r GY E F F I C I E N C Y T hr O U Ghr E G Ul A T I ONA ND OT hE r G OV E r NME NT P Ol I C I E S
6
“ Targets can be powerul instruments or
increasing industrial energy eciency
o Energy and Development Planning oversee the planning, promotion and evaluation o energy-e-ciency activities. Tere are two national implement-ing programmes: the National Electrical EnergyConservation Programme (Procel), coordinated bythe national electricity company (Electrobras), andthe National Programme or Rationalizing the Use o Oil and Natural Gas (Conpet), which includes private
initiatives and draws on the resources o Petrobras, thestate oil company (ECLAC 2010).
Beyond the central government, developing coun-tries have set up specialized local and regional govern-ment bodies to provide more targeted measures and tocollaborate with industry, academia and intermedi-ary institutions, such as energy inormation centres.Support institutions have also been set up, including industry associations, energy conservation centres,national and regional cleaner production centres,
energy research and development (R&D) laboratories,energy technology and inormation centres, clusterdevelopment institutions, and metrology, standards,testing and quality control centres (UNIDO 2011).
Te experiences o countries as diverse as Costa Ricaand the Russian Federation suggest that several capabil-ities are critical to successul implementation o energy-eciency legislation (UNIDO 2011; WEC 2008):• Estimating the savings and impact o energy-
eciency projects.•
Applying the right mix o policy instruments ineach sector (specicity is critical to success).• Developing the institutional and organizational
knowledge and skills or designing and imple-menting policies consistently.
• Rigorously monitoring and enorcing legislation.One concern, particularly in large developing coun-
tries, is the weak coordination among energy-eciencyagencies, with agencies oen working independentlyand towards dierent goals (UNIDO 2011).
Shaping the industrial energy-eciency
policy setting
o be successul, industrial energy-eciency policymust have clearly specied and measurable goals and
an eective ramework or implementing them. Oneo the main policy goals should be to decouple indus-trial energy and resource consumption and nega-tive environmental impacts rom economic growth.Action areas need to be dened, including measur-able and realistic targets, legislation on standardsand labelling, systems o market-based incentives,knowledge and inormation programmes and a con-
ducive institutional environment. Eective policy-making requires eective mechanisms or regularevaluations to determine whether targets and policiesneed to be revised (Mallett, Nye and Sorrell 2011;
Verbeken 2009).
Setting national targets
Many countries in Asia, Europe and Latin Americahave recently incorporated quantitative targets in theirnational energy laws and programmes (Figure 6.1).
argets can be powerul instruments or increas-ing industrial energy eciency. argets have beenexpressed in various ways – or example, as a speci-ed annual rate o energy-eciency improvement, asa percentage improvement over time, as energy savingsin gigawatt hours or millions o tonnes o oil equiv-alent or as a reduction in energy intensity to sometarget value. Most countries target energy-eciencyimprovements (WEC 2010).2
Brazil’s National Energy Plan 2030 aims to
reduce electricity use by 4.5–15.5 gigawatt hoursby accelerating technical progress and industrialenergy-saving initiatives (ECLAC 2010). China’s11th Five-Year Plan stipulated economy-wideimprovements in energy intensity o 20 percentover 2006–2010, with targets and monitoring setat provincial and industry levels. When the target
was grossly undershot in the rst ew years becauseo industry reluctance to comply, the governmentrequired all companies and local and provincialgovernments to submit detailed compliance plansbeyond 2007. Te Five-Year Plan linked institu-tional and individual sta perormance assessmentsto target achievement. And in 2008, energy inten-sity declined 4.2 percent (UNI DO 2011).

8/2/2019 Unido Full Report eBook
http://slidepdf.com/reader/full/unido-full-report-ebook 122/259
103
OV E r C OMI N GB A r r I E r S T
OI ND U S T r I A l E NE r GY E F F I C I E N C Y T hr O U Ghr E G Ul A T I ONA ND OT hE r G OV E r NME NT P Ol I C I E S
6
“ Voluntary energy-eciency agreements
can increase awareness o industrial energy
eciency and engage staeholders
Setting sectoral targets
Industrial energy-eciency targets can be set throughmandatory measures or voluntary agreements withgovernments. Voluntary agreements include targetsto meet specic energy-eciency goals (generally over5–10 years) so that investments can be planned andimplemented (Worrell and Bernstein 2009; Price,
Wang and Yun 2010). Voluntary agreements have been implementedin developed countries since the 1990s (Price, Wang and Yun 2010).3 Successul implementation is typi-cally rewarded with nancial gains or exemption rommandatory measures. Tey tend to receive greater sup-
port rom industry and are more exible and asterto implement than mandatory measures. However,i compliance is low, agreements may be replaced bymandatory alternatives (Price 2005 cited in Worrelland Bernstein 2009; McKinsey & Company 2009).
Setting targets under negotiated agreements involvesassessing the energy-eciency potential o each indus-try and identiying economically easible measuresor improvement. Tis assessment can be made by an
independent third party and used as a basis or the nego-tiation. Rewards and sanctions, such as auditing, bench-marking, monitoring, disseminating inormation andoering nancial incentives, can motivate participation.
Tese agreements can increase awareness o indus-trial energy eciency and engage stakeholders. Severalsuccessully negotiated agreements include elements
that could work in other countries and sectors. Chinaused negotiated agreements in Denmark, Finland andthe Netherlands as models (Box 6.3).
A ew developing countries use voluntary energy-eciency agreements, notably Chile, China, India,Indonesia, Malaysia, Romania, South Arica andTailand. Chile has a wide range o agreements cover-ing mining, metals, chemicals and printing (UNIDO2011). Romania is establishing long-term agreementsin glass, cement and machinery (UNIDO 2011).China initiated the op-1,000 Energy-Consuming Enterprises programme, a major voluntary agreementto achieve its Five-Year Plan (2006–2010) targets toreduce energy consumption per unit o gross domestic
product (Box 6.4).
WorldMiddle East AfricaSouth AmericaNon-OECD AsiaNorth America/Asia OECDEurope
P e r c e n t
Lighting Service Transport Power Industry Residential Final consumption Primary consumption
0
25
50
75
100
Figure 6.1
Breadown o energy-eciency targets incorporated in laws or programmes, by region, 2009
Many countries in Asia, Europe and Latin America have established national quantitative energy-eciency targets
Source: WEC 2010.

8/2/2019 Unido Full Report eBook
http://slidepdf.com/reader/full/unido-full-report-ebook 123/259
104
OV E r C OMI N GB A r r I E r S T
OI ND U S T r I A l E NE r GY E F F I C I E N C Y T hr O U Ghr E G Ul A T I ONA ND OT hE r G OV E r NME NT P Ol I C I E S
6
“ A natural starting point in setting
targets and ormulating policies is to
benchmar the industrial energy eciency
o each sector and to identiy its drivers
he Indian and Indonesian experiences suggestthat voluntary agreements require substantial com-mitments by rms. Te agreements can be dicult toimplement, especially or small and medium-size rms,
unless targets are realistic, guidelines are clear andinormation rom experience is sucient (UNIDO2011). An assessment in Nanjing, Xian and Kelamanyiin China concluded that voluntary agreements can beeective instruments or implementing national poli-cies (Eichhorst and Bongardt 2009). With greater rmownership o the programmes, it became easier to adoptenergy action plans and establish energy action teams.
Benchmarking
A natural starting point in setting targets and ormu-lating policies is to benchmark the industrial energyeciency o each sector and to identiy its drivers byexamining such variables as access to capital, skills,technical perormance and management practices.
Benchmarking requires comparing the energy per-ormance o a plant, process, system or industry withthat o similar acilities producing similar products orto national or international best practice energy use.Te results can be shown in benchmark curves that
plot energy use rom most to least ecient. Tesecurves contain valuable inormation about best prac-tice technologies or use in assessing global energy-
saving potentials (see Chapter 2).By identiying industrial energy-eciency oppor-
tunities and capabilities that need to be developed,benchmarking allows realistic targets to be set and
policies and programmes to be designed and imple-mented. But benchmarking is not easy. Tere aremany diiculties with collecting accurate energydata.
Governments can initiate capacity-building orenergy statistics by setting up entities or energy
benchmarking and ensuring the accuracy o data col-lection and auditing. National statistics oces cantrain company sta to improve measurement and
provide inormation on the potential or industrialenergy-eciency savings.
he Malaysian Government’s NationalProductivity Corporation hosts an e-benchmarking database on energy eiciency, supported by theDepartment o Statistics and prepared in collabora-tion with industrial associations (UNIDO 2011). Te
database covers all manuacturing sectors and includesaudited energy data or more than 5,300 registeredirms in 2003. he database provides plant-levelenergy-eciency data and has led to the identicationo potential energy-eciency savings o 40–45 percentin the cement and rubber industries, some o it requir-ing little investment. While the energy database hashelped many rms improve their energy productivitythrough voluntary action, its useulness will dependon its continuing renement – to provide more disag-gregated, user-riendly and reliable data.
Governments can also support intermediate energyorganizations that are vital in enabling benchmarking
practices by industrial rms. Industry associations andinternational organizations can also develop and apply
In1989,teDutcGovenmentandindustiasectos
negotiatedvountayageementsinvoving90pecent
ofnationaindustiaenegyconsumption.Teyageed
onong-temenegy-efciencytagets,witpaticipat-
ingsectoscommittingtoacievetenationataget
of20 pecentefciencyimpovementby2000.Te
sectosexceededteitagets,acievinganaveage
impovementof22.3pecent.
Tepogamme’ssuccesswasduetoitsabiityto
focusmanagementonow-costefciencyinvestment
options,pe-emptfutueenegyeguation,pepae
egaybindingcontactsandpovidesuppotingpoi-
cies(sucastaxebates,subsidiesandaudits).Foow-
ingtesuccessoftisstpogamme,wicfocused
onpocessefciency,asecondonewasauncedfo
2001–2012,boadeningtefocustoenegymanage-
mentoutsidetepoductionpocess,incudingsus-
tainabeenegyandenegy-efcientpoductdeveop-
ment.Tusfa,moetan900companiesin31sectos
avesignedon,andimpovementsinenegyefciencyaveaveaged2pecentayea.Atidpogammeis
undedeveopment,toununti2020.
Source: UNIDO 200 8a; Nuijen 1998; Kerssemeeckers 2002; Korevaar et al. 1997;
Rietbergen, Farla and Blok 1998; Price and Worrell 2002; SenterN ovem 2008.
Box 6.3
Voluntary agreements on long-term energy-eciency targets in the Netherlands

8/2/2019 Unido Full Report eBook
http://slidepdf.com/reader/full/unido-full-report-ebook 124/259
105
OV E r C OMI N GB A r r I E r S T
OI ND U S T r I A l E NE r GY E F F I C I E N C Y T hr O U Ghr E G Ul A T I ONA ND OT hE r G OV E r NME NT P Ol I C I E S
6
“ Many rms in developed countries have
pursued their own industrial energy-eciency
targets, which are oten supported by governments
standardized methodologies or energy managementand eciency and help countries collect better energydata and develop benchmarking tools and methodolo-gies. Tese collaborative eorts must be extended tosmall and medium-size enterprises, which oen havethe most potential or improvement.
Supporting private initiatives
Many rms in developed countries have pursued theirown industrial energy-eciency targets, setting upenergy management programmes, oen with ambi-tious targets, and hiring energy managers. Tese pro-grammes are oen supported by governments.
he key stages in a corporate energy-eiciency programme include benchmarking, auditing, energy
action plans, progress monitoring and evaluation(Box 6.5). Energy managers decide which measures areimplemented, such as improving monitoring, controland operating practices; signalling the need or timelyrepair and regular maintenance; and estimating costsor these requirements. Eective energy managementin rms typically includes multi-year planning, plant-level perormance goals and tracking, designatedenergy managers, energy management systems, energyauditing and capital allocation.
Te US Government’s Energy Star programmeoers industrial irms energy management guide-lines and supporting tools. Te guidelines includeassessment, benchmarking, energy management
planning and progress evaluation. In 2007, around
TeentepisespaticipatinginCina’sTop-1,000Enegy
ConsumingEntepisespogammeaeinnineenegy-
intensiveindustiasectos(ionandstee,non-feous
metas,cemicas,petoeumandpetocemicas,powe
geneation,constuctionmateias,coamining,pupand
pape,andtexties),wictogeteaccountedfo33pe-
centofnationaenegyconsumptionand47pecentof
industiaenegyconsumptionin2004.Tepogammeseeksto:
• reducegeenousegasemissionsintetop-1,000
enegy-consumingentepisestouganinceasein
enegyefciencyof260miiontonnesofcabondiox-
ideequivaent(CO2-eq ).
• Bencmak against domesticbest pactice fo a
majo poductsand intenationa best pactice fo
some.
• Acieveenegysavingsof100miiontonnesofcoa
equivaentove2006–2010.
Te pogamme invoves sevea nationa goven-
mentdepatments:teDepatmentofNatuaresouces
andEnvionmenta Potection;NationaBueau of Sta-
tistics;OfceofNationaEnegyleadingGoup;Gen-
ea Administation of Quaity Supevision, Inspection
andQuaantine; andState-owned AssetsSupevision
andAdministationCommission.Povincia,distictand
ubanenegy-savingautoitiesandocaautoitieswee
cagedwitoveseeingenegymanagementandepot-
ingwitinentepises.
Basedonanaysesofindustiaenegy-savingpoten-
tiaandteocationofteentepises,teDepatment
of Natua resouces and Envionmenta Potection
assignedte100miiontonnesofcoaequivaentenegy
savingstoindividuapovinces.In2006,tagetspeente-
piseweediscussedandpubised.Taget-settingwas
geneayatop-downpocess,tougteeweeegua
infomationexcanges.Atwo-tiecontactsystemwasestabisedbetweentecentagovenmentandpovin-
ciagovenmentsand betweenpovincia govenments
andcompanies.
Tepogamme,modeedonintenationaexpeience
witvountayageements,acieveditstagets.Buttee
weesomesotcomings:
• Taget-setting was used to meet te time con-
staintsofte11tFive-YeaPanandtusfaiedto
adequateyengageindusty.
• Tagetsweenotsufcientyambitious;geatedetai
in assessing enegy saving potentia fo specific
industiescoudaveesutedinigetagetsfo
enegysavingsandefciency.
• Suppotingpoiciesweesowtocome onine,and
eguatoyesponsibiitiesweeuncea.
• Nosystematicinfomationanddisseminationmetod
wasfomed.
• Monitoingandevauationweeandicappedbyack
oftanspaency,ackofextenaauditingandteuse
ofaggegatedata.
Source: Price, Wang and Yun 2008, 2010; Worrell 2011.
Box 6.4
China’s Top-1,000 Energy Consuming Enterprises programme

8/2/2019 Unido Full Report eBook
http://slidepdf.com/reader/full/unido-full-report-ebook 125/259

8/2/2019 Unido Full Report eBook
http://slidepdf.com/reader/full/unido-full-report-ebook 126/259
107
OV E r C OMI N GB A r r I E r S T
OI ND U S T r I A l E NE r GY E F F I C I E N C Y T hr O U Ghr E G Ul A T I ONA ND OT hE r G OV E r NME NT P Ol I C I E S
6
“ Energy-eciency labels are one o
the easiest and cheapest policy tools and
can lead to large energy savings
o the importance o energy-eiciency improve-ments, according to a study by the State Bank o India(Painuly 2009).
Improving auditing quality requires supporting measures, such as subsidies or audits and training orauditors and company personnel. Implementation o audit recommendations may require the governmentto process data and provide eedback. Experience
shows that governments committed to industrialenergy eiciency can introduce mechanisms thatmake energy audits an eective part o their energystrategies (as in unisia; see Box 6.2).
Using energy-eciency labels
Energy-eiciency labels are one o the easiest andcheapest policy tools and can lead to large energy sav-ings. Labels describe the energy perormance o equip-ment in terms o average energy eciency or con-
sumption or costs, thus enabling consumers to makean inormed purchasing decision. Labels help over-come inormation barriers and encourage the adop-tion o more ecient equipment (Wiel and McMahon2005). Tey include endorsement labels, which certiythat a product meets preapproved criteria; inorma-tion labels, which inorm consumers o a product’s
perormance; and comparative labels, which allowconsumers to compare the perormance o similar
products (Wiel and McMahon 2005; CLASP 2009).
Labelling oen precedes standards by encourag-ing manuacturers to compete based on energy e-ciency and preparing consumers and producers ornew or stricter standards (Nadal 2002). Mandatorylabels can lower the transaction costs associated withassessing energy perormance, such as or electricmotors (Schleich 2011). I clearly designed and accom-
panied by inormation campaigns, mandatory labelscan encourage manuacturers to design more energy-ecient machines and processes (CLASP 2009).
Many countries have adopted labelling schemes,requently in tandem with minimum energy per-ormance standards. For example, the EU EnergyLabelling Directive requires labels on all energy-using
products (WEC 2010). Experience with labelling
in developing countries has been positive, and insome countries, equipment ailing to meet claimedeciency ratings has been stripped o its labels, butthere is room or progress (UNIDO 2011). Labelling schemes in India, Tailand and Malaysia are voluntaryand do not perorm as well as mandatory programmes,
which give users ull comparable inormation. Ghana’slabelling eorts would be more credible with better
testing acilities and equipment. A common problem with lighting and air-conditioning equipment in manydeveloping countries is that nearly all products receivetop ratings. South Arica needs to standardize labelinormation updates to include product and equip-ment technology changes.
Overall, improvements are needed in energy-eciency metrics, product categorization, certica-tion and labelling regulation. Countries with weakborder protection ace the added task o dealing with
unlabelled oreign products and equipment.
Establishing minimum eciency
perormance standards
While labels help transorm the market or high-eiciency equipment, minimum eiciency peror-mance standards aim to reduce the market share o the least ecient models (Fleiter, Eichhammer andSchleich 2011; Nadal 2002). Tey can be an impor-tant source o gains in energy eciency, as in the
case o electric motors, which account or 60–70 per-cent o industrial electricity consumption (Fleiter,Eichhammer and Schleich 2011).
Standards are usually imposed by energy authori-ties, oen through technical regulations that typi-cally prohibit manuacturing, selling and importing non-conorming equipment and appliances. Setting standards or equipment such as boilers, motors, light-ing and space conditioning can boost demand orenergy-ecient equipment and eliminate the leastecient models rom the market. Standards can alsoreduce other ineciencies and losses indirectly relatedto energy, resulting in a cascade eect that drasticallycuts energy intensity (de Almeida, Ferreira and Both2005). Tese standards, used widely in many countries

8/2/2019 Unido Full Report eBook
http://slidepdf.com/reader/full/unido-full-report-ebook 127/259
108
OV E r C OMI N GB A r r I E r S T
OI ND U S T r I A l E NE r GY E F F I C I E N C Y T hr O U Ghr E G Ul A T I ONA ND OT hE r G OV E r NME NT P Ol I C I E S
6
“ While labels help transorm the maret or
high-eciency equipment, minimum eciency
perormance standards aim to reduce the
maret share o the least ecient models
and regions, can also spur competition among manu-acturers to improve the eciency o their equipment(able 6.1).
Brazil’s experience with standards is unique inthat mandatory standards emerged rom a voluntaryagreement. Minimum eciency perormance stand-ards were introduced less as an eciency measure thanas a mechanism or combating electricity shortages.
Te rst product subject to standards was the squir-rel cage three-phase induction electric motor, whichused around 32 percent o Brazil’s electricity supply.Government energy and standards regulatory agenciesand Brazilian manuacturers entered into a voluntaryagreement to sequentially introduce more stringenteciency targets or both standard and high-eciencymotor classes. Implementing the standards not onlysaved energy but also beneted Brazilian motor manu-acturers, since the standards eliminated competition
rom less technically and economically ecient or-eign rms, and made it easier to introduce manda-tory standards or induction motors (ECLAC 2010;Garcia et al. 2007).
Although minimum eiciency perormancestandards are considered cost-eective, they are not
without problems. First, mandates that are not regu-larly updated can orce irms to make production
process decisions that they might not otherwise make( New York imes 2011). Second, the benets needto be weighed against the challenges o implement-ing a new standard, such as engineering costs, slowerdeployment o new technologies and long liespans o existing equipment. Standards can be especially di-
cult to impose on specialized process equipment andare probably not cost eective or low-volume equip-ment (McKinsey & Company 2009).
I regulatory policy orces the early retirement o capital goods, rms might be worse o nancially i the prots associated with the more ecient replace-ment equipment do not oset losses rom retiring capital goods early (Jaccard 2009). Regulatory policyneeds to overcome this disincentive to upgrading equipment (Stern 2006). Conversely, rms could try
merely to meet the mandated minimum standards,even as the standards get outdated, thus discouraging innovation. o prevent this, standards need regularreview and updating to keep up with technological
progress (IEA 2007b; Saidur 2010). Standards shouldencourage industry to continually improve energy
Economy Phasea Pump Fan Chiller R valuesb
Australia ✔
Brazil ✔
Canada ✔
China ✔ ✔ ✔ ✔ ✔
Costa Rica ✔
European Union ✔
Israel ✔ ✔ ✔
Mexico ✔ ✔
New Zealand ✔
Republic o Korea ✔
Taiwan Province o China ✔ ✔
United States ✔
Total 12 3 2 2 1
a. Three-phase electric power systems.
b. A measure o insulation’s ability to resist heat transer.
Source: Adapted rom Brunner (2007).
Table 6.1
Use o minimum eciency perormance standards in selected economies

8/2/2019 Unido Full Report eBook
http://slidepdf.com/reader/full/unido-full-report-ebook 128/259
109
OV E r C OMI N GB A r r I E r S T
OI ND U S T r I A l E NE r GY E F F I C I E N C Y T hr O U Ghr E G Ul A T I ONA ND OT hE r G OV E r NME NT P Ol I C I E S
6
“ Much industrial energy eciency is
achieved by changing how energy is managed
rather than by installing new technologies
eciency. For instance, Australia and China speciytwo perormance levels: the real minimum (whichmust be adhered to) and a likely uture minimum(what industry should expect and prepare or).
Developing energy management systems
standards
Much industrial energy eiciency is achieved by
changing how energy is managed rather than byinstalling new technologies. Energy-eciency com-
ponents in industrial systems will not achieve the projected energy savings i the system is not prop-erly designed and operated (Lovins 2007). Evidencerom national and international programmes showsthat while ecient components might yield minorgains, systems optimization can yield much largergains (20–30 percent), with payback periods o lessthan two years (ECLAC 2010; Garcia et al. 2007).5
Energy management systems, by taking into accountthe entire industrial system, are more eective in opti-mizing industrial systems and monitoring system e-ciency (EEEP 2010).6
Energy management systems include the techni-cal systems, management programmes and trainedsta needed to conduct energy audits, gather energydata, maintain submetering systems, analyse and com-
pare consumption data to trends and benchmarks,correct or inuencing actors, identiy aults and so
on (Sorrell et al. 2004). Energy management systemscan help rms develop an energy use baseline, activelymanage energy costs and document savings or inter-nal and external use (such as greenhouse gas emissioncredits). A good energy management system is vital oridentiying opportunities or sustainable energy sav-ings (Worrell 2011).
An energy management system is typically parto a company-wide energy policy, supported by uppermanagement and energy management sta (Sorrell2009). A successul energy management system starts
with a strong organizational commitment. A studyo urkey’s textile sector suggests that implementing an energy management system company-wide is thebest approach (Ozturk 2005). An approach that has
worked in Malaysia is setting up an energy manage-ment committee and engaging the company head inenergy-eciency eorts (EIB n.d.). Energy manage-ment systems involve costs in wages, consultancy andother ees, so their cost eectiveness varies with therm’s size and energy intensity.
Governments can encourage companies to estab-lish an energy management system by providing
inormation on best practices, issuing standards, pro- viding training in compliance and recognizing or cer-tiying rms that meet the standards. Internationalguidelines on standards are available through therecently established ISO 50001 Energy ManagementSystems and are also available through ISO 14 000Environmental Management Systems, which includessuggestions or continuous improvement in energyeciency. Developed countries with energy manage-ment system standards include Australia, Canada,
Denmark, Germany, Ireland, Republic o Korea,the Netherlands, Sweden, the United Kingdomand the United States. Regional standards havealso been established, such as the European EnergyManagement Standard (EN 16001), introducedin 2009.
Energy management systems are less commonin developing countries. Countries that use theminclude Belarus, China, Ghana, Malaysia, Romania,the Russian Federation, South Arica and Tailand.
Malaysia requires that installations consuming 3million or more kilowatt hours o electricity over sixmonths hire an energy supply manager. Experience
with energy management systems in developing coun-tries, though sparse, suggests that government meas-ures should ocus on the plant level, empower plant
personnel at all levels and involve them in decision-making, encourage individual or team champions o energy management programmes and provide somenancial support (UNIDO 2011).
Developing an inormation policy
Regulatory eorts can also work with public inorma-tion, awareness and training programmes. Inormationand awareness-raising programmes are repeatedly

8/2/2019 Unido Full Report eBook
http://slidepdf.com/reader/full/unido-full-report-ebook 129/259
110
OV E r C OMI N GB A r r I E r S T
OI ND U S T r I A l E NE r GY E F F I C I E N C Y T hr O U Ghr E G Ul A T I ONA ND OT hE r G OV E r NME NT P Ol I C I E S
6
“ Public awareness and education
campaigns can boost industry capability
and willingness to adopt what has been
considered high-cost and -ris technologies
identied as public policy priorities (Schleich 2011).Encouragement through recognition programmeshas also proven eective in helping rms adopt indus-trial energy-eiciency practices and technologies.Developing countries are employing a wide range o these tools (able 6.2).
Lack o awareness o energy-eciency opportuni-ties may stem rom inadequate metering and insu-
cient inormation on energy perormance, reinorcedby weak skills and training. Language barriers andlimited Internet access may exacerbate these problemsin developing countries. Limited knowledge meansthat quick-x options are oen preerred to those thataddress root causes (te Velde 2010).
Raising knowledge and awareness
Public awareness and education campaigns can boostindustry capability and willingness to adopt what has
been considered high-cost and -risk technologies. obe eective, the campaigns must target managementand technical personnel, other stakeholders (such asindustry associations and government departments),the nancial sector (on topics such as the protability
o industrial energy-eciency investment projects)and the community at large – all at the same time.
Inormation campaigns can include workshops,training and seminars, best practice publicationsand mass media (te Velde 2010). Brazil’s experiencesuggests the value o training trainer’s programmesbecause o multiplier eects across irms and the
potential damage inicted by poorly inormed teach-
ers (UNIDO 2011).An assessment o United Nations Environment
Programme (UNEP) activities to encourage cleaner production technologies in ive developing coun-tries (Guatemala, Nicaragua, anzania, Viet Namand Zimbabwe) highlights the importance o rais-ing awareness and educating key players (Ciccozzi,Checkenya and Rodriguez 2003). It notes the impor-tance o educating the nancial sector about the pro-itability o industrial energy-eciency investments.
Te study acknowledges the need or hard data andexamples o successes to persuade stakeholders toadopt energy-ecient technologies.
Engaging key players is critical or successulawareness and education campaigns (UNIDO 2011).Chile actively involves the private sector in its cam-
paigns, to encourage participation. Jordan tries espe-cially to engage top management (Arburas 1989).Costa Rica, Honduras, South Arica and Tailandocus on local communities and youth, while Egypt
uses non-governmental organizations and targetedmedia campaigns. India’s Bureau o Energy Eciencyconcentrates on small and medium-size enterprisesand clusters because o their more limited access toinormation and technology.
Training rm personnel and increasing
absorptive capacity
Several developing countries have national pro-grammes to train managers, technical sta and work-ers in areas such as energy management, energy moni-toring and process control systems, energy auditing,and certication, identication, appraisal and imple-mentation o industrial energy-eiciency projects.Te programmes are airly standard. For instance,
Policy toolNumber ocountries
Awareness and education campaigns 15
Training or rm personnel 8
Enhancement o local absorptivecapacity
10
Recognition programmes 5
Industrial energy-eciency networks 3
Support or energy-eciency researchand development
6
Support or deployment o energy-eciency technologies
2
Technical assistance programmes orindustrial energy eciency
9
Energy-eciency demonstrationprojects
6
International industrial energy-eciencyprogrammes
12
Note: Includes 37 developing countries in Arica, Asia, Eastern Europe and Latin America.
Source: UNIDO 2011.
Table 6.2
Inormation and technology policies applied indeveloping countries, 2010

8/2/2019 Unido Full Report eBook
http://slidepdf.com/reader/full/unido-full-report-ebook 130/259
111
OV E r C OMI N GB A r r I E r S T
OI ND U S T r I A l E NE r GY E F F I C I E N C Y T hr O U Ghr E G Ul A T I ONA ND OT hE r G OV E r NME NT P Ol I C I E S
6
“ Recognition programmes that reward
rms implementing energy-savings
solutions can promote positive perceptions
o industrial energy eciency
in Chile, 19 universities and two engineering asso-ciations provide industrial energy-eciency training (APERC 2010a). In China, such training is especiallyimportant or township and village enterprises, whichtypically rely on low-grade, non-standard technolo-gies. Historically commune-based and non-specialist,these enterprises and their stas are oten under-qualied to operate and maintain new energy-ecient
equipment (Worrell et al. 2001).A rm’s absorptive capacity – its ability to use the
inormation that comes rom interacting with otherrms, users and knowledge providers (Cohen andLevinthal 1990; Giuliani and Bell 2005) – determinesits ability to benet rom the technological knowledgeavailable in global and local networks. Absorptivecapacity is generally low in rms in developing coun-tries, but it can be expanded through training andinormation programmes (Box 6.6). Equipment sup-
pliers provide training or their equipment, sometimesalong with other, generic inormation. Te Japanesegas supplier, Gasunie, or example, provides technicalassistance by supporting process-integration analy-ses, audits and easibility studies (Galitsky, Price and
Worrell 2004). Governments can complement theseeorts and provide training to enterprises or energyconsultancy companies, but as with awareness cam-
paigns, engaging top management is crucial to achiev-ing positive outcomes (UNIDO 2011). In Indonesia
and Viet Nam, national programmes have providedtechnical assistance and trained corporate energyconsultants on the engineering and nancial aspectso industrial energy-eiciency investment projects(USAID 2008; GEF 2004).
Oering recognition and reward
programmes
Recognition programmes (contests, awards, mediaexposure, recognition certicates) reward rms thatimplement industrial energy-eiciency or otherenergy-savings solutions. Tese programmes can beeective motivators and promote positive perceptionso industrial energy eciency by highlighting poten-tial beneits and publicizing successul outcomes.
Pursuing rewards or competitive advantage canembed pursuit o energy eciency in an organiza-tion’s culture (Mallett, Nye and Sorrell 2011). Energy
awards provide a channel or companies to audittheir energy use, identiy possible energy savings andincrease protability.
Recognition programmes can be implemented ina range o contexts. In India, the Ministry o Powerlaunched the annual National Energy ConservationAwards programme, which recognizes industrial rmsthat reduce energy consumption while maintaining
production. Companies submit reports on completedenergy conservation projects, which are reviewed bygovernment oicials. he number o participating rms expanded rom 123 in 1999 to 558 in 2009 andover that period saved 12,113 million kilowatt hourso energy (11.3 million rupees; NECA 2009). SriLanka established a National Energy Eciency Award
TeCinaMotoSystemsEnegyConsevationPo-
gamme, intoduced to assist te govenment in
contoing geenouse gas emissions, pomotes
impovementsinmoto-systemefciencyinfactoies
tougouttecounty.
Eecticmotosystems,usedwideyinCinese
industy to powe fans, pumps, ai compessos,
efigeationcompessos,conveyesandoteequip-ment,accountfomoetanafofCina’seecticity
use.Tus,teyoffeageoppotunitiesfoefciency
gainsandenegysavings(20pecentomoeinmany
appications).
Asapiot,tepogammefocusedonJiangsuand
SangaiPovinces,demonstatingametodoogyfo
estabisingand taininga netwokof moto-system
optimizationexpetsandidentifyingsuitabebusiness
modesfoscainguptotenationaeve.
Tepogammeasbuitastongfoundationfo
nationascae-up.Ittained22engineesinmoto-
system optimization tecniques. And witin two
yeasofcompetingtaining,teseocaexpetsad
tainedmoetan1,000factoypesonne,conducted
38 industia pant assessments and saved neay
40 miionkiowattousofenegy.
Source: UNIDO (www.unido.org/index.php?id=1000786).
Box 6.6
Capacity-building or absorptive capacity

8/2/2019 Unido Full Report eBook
http://slidepdf.com/reader/full/unido-full-report-ebook 131/259
112
OV E r C OMI N GB A r r I E r S T
OI ND U S T r I A l E NE r GY E F F I C I E N C Y T hr O U Ghr E G Ul A T I ONA ND OT hE r G OV E r NME NT P Ol I C I E S
6
“ Governments can acilitate networ building
on industrial energy eciency among rms, sector
specialists, academia, industry associations,
non-prots and other aected groups
in 2010, and Kenya’s Energy Management awards area popular annual event (Sri Lanka SEA 20117; KenyaAssociation o Manuacturers n.d.).
Recognition programmes are an attractive policyoption because the awards are perormance-based;the investment necessary is low; and the potential orstimulating uture energy savings is high. Recognition
programmes can inorm policy-makers o successul
national and regional options, lessons that are re-quently integrated into policy (McKane, Scheihing and Williams 2008).
Publicizing the successes o recognition pro-grammes can motivate companies to comply withindustrial energy-eciency policies and programmes.For example, Japan’s op Runner Programme reliesheavily on the strong cultural inuence o saving ace.Even i standards are voluntary, the incentive to com-
ply is strong because an enterprise’s ailure to do so
will be made public.
Building networks
Governments can acilitate network building onindustrial energy eciency among rms, sector spe-cialists, academia, industry associations, non-protsand other aected groups. Such networks can beespecially important in developing countries, whereindustrial energy eciency is a low priority among senior managers (Ozturk 2005; Worrell and Price
2001). Studies show that projects strongly supportedby leaders are more likely to succeed (Etzkowitz andCarvalho de Mello 2004).
Studies o China’s iron and steel sector suggestthat irms in developed and developing countriesneed to work together to share the risk o adopting advanced industrial energy-eiciency technologies(Worrell 1995). A Global Environment Facility pro-
ject in India ound that more communication wasneeded among private sector players (steel re-rolling mills, domestic equipment manuacturers, tradeand industry associations and others) or uptake o industrial energy-eciency technologies (Verbeken2009). Similarly, stakeholder alliances were oundto be an asset o UNIDO–UNEP clean-production
projects (Ciccozzi, Checkenya and Rodriguez 2003).Agreements were established with local institutionshosting the project training courses, which could thenoer the courses beyond the project’s liespan.
A project run by the Energy Research Instituteat the University o Cape own, South Arica,acilitated networking between rms and organiza-tions with industry expertise in Organisation or
Economic Co-operation and Development (OECD)countries and large South Arican rms (breweries,
pulp and paper companies and mining companies).he networks helped participating South Aricanrms identiy more than 5 million rand in energy-eciency investments, with a payback o less than a
year (Spalding-Fecher 2003).
Promoting new technology and
innovation
Countries can also adopt measures to promote indus-trial energy-eciency innovation based on their eco-nomic structure and growth strategies. Some meas-ures are more suitable or emerging market economies,
which have the potential to develop an indigenoustechnology base, and other measures are more suitableor countries relying primarily on technology transer.It probably does not make economic sense or smaller,less advanced economies to develop their own tech-nology supply chain. (See able 6.2 and Annex 14 or
some o the main technology and innovation policymeasures used by developing countries.)Innovation encompasses several stages: R&D,
practical demonstration, initial commercial applica-tion and diusion o the new technology or processthrough market orces. New technologies are theresult o a complex process o scientiic advances,learning by doing, and directed and spillover eortsin the private and the public sectors (IPIECA 2006).
Industrial energy-eciency innovation diers romother types o innovation. Dominant energy users andequipment suppliers jointly determine the developmento new technology. And transitions in major energytechnologies oen take decades, requiring massive inra-structure investments, even or superior technologies.

8/2/2019 Unido Full Report eBook
http://slidepdf.com/reader/full/unido-full-report-ebook 132/259
113
OV E r C OMI N GB A r r I E r S T
OI ND U S T r I A l E NE r GY E F F I C I E N C Y T hr O U Ghr E G Ul A T I ONA ND OT hE r G OV E r NME NT P Ol I C I E S
6
“ Industrial energy-eciency innovation diers
rom other types o innovation: energy users
and equipment suppliers jointly determine the
development o new technology, and transitions
in major technologies oten tae decades
Encouraging research and development
How can governments promote R&D that acceler-ates reductions in industrial energy intensity? Policy-makers who value technological innovation maydevelop and strengthen national and multinationalstrategic R&D programmes. Governments may ocuson demand pull (achieving improvements througheciency standards and regulations), technology push
(encouraging improvements through R&D unding and technology transer) or, most oen, a combination.
For supply (technology push), public policyoptions to oster innovation include:• Government-unded research. Publicly unded
research centres, including training; publicresearch institutions ocused on energy eciency;and jointly unded industry-government research.
• Subsidized private sector research. Private irmscan have better inormation than the govern-
ment about the commercial easibility o energy-eiciency technologies. Subsidies can take theorm o tax credits or matching unds or research
projects, complemented by subsidies or training scientists and engineers.
• Regulations. Regulations, including legislation onintellectual property rights, can create incentivesto invest in generating new knowledge.Several large developing countries have imple-
mented some o these measures to generate local
capacity in industrial energy eiciency. Nigeria’ssevere shortage o energy prompted the government toestablish the University o Lagos National Centre orEnergy Eciency and Conservation in 2008, whichis responsible or R&D in energy-eciency and -con-servation options and technologies. Following the2010 enactment o the Russian Federation’s energy-eiciency legislation, the country has intensiiedeorts to create an R&D capacity in energy ei-ciency. Te Russian Federation recognizes the roleo a growing number o organizations engaged inresearch on improving energy eciency, such as theCentre or Energy Eciency, the Sustainable EnergyDevelopment Centre and the Institute o EnergyStrategy. Under the 11th Five-Year Plan (2006–2010),
China’s government invested more than $10 billion tosupport hundreds o research projects in energy con-servation, new energy, recycling, clean production,
pollution control, climate change technology, demon-stration and extension (APERC 2006).
Boosting adoption and diusion o energy-
eciency technology
Encouraging adoption and diusion o best availabletechnologies requires considering domestic marketconditions and the technical, managerial and nancialcapacities o domestic industries to take up the tech-nologies. Government actions to encourage technol-ogy adoption and diusion include:• Supporting energy data collection and dissemina-
tion.• raining scientists and engineers.• Introducing regulations to remove inecient pro-
ducers rom the market. Standards or industrialequipment and system optimization can makeit easier or rms to trade o capital and energycosts, but they can also impose limits on productchoice and undesirable costs or adopters.
• Procuring industrial energy-ecient equipment.• Reducing the eective purchase price o new equip-
ment that meets specied criteria. (A drawback isthat these subsidies and tax credits can require large
public expenditures per unit o impact.)•
Facilitating local production or import o high-eciency equipment.• Supporting public-private partnerships to promote
technology centres.• Establishing technical assistance programmes to
inorm enterprises o the opportunities and poten-tial or energy savings, improved access to techni-cal skills and reduced uncertainty about the appro-
priateness o certain technologies.Analysing the costs and benets o these polices
is important but challenging, even in developedcountries. echnology policy successes are dicultto measure because outputs are oten intangible,expected benets o technologies change with condi-tions, and evaluations o these polices make sense only

8/2/2019 Unido Full Report eBook
http://slidepdf.com/reader/full/unido-full-report-ebook 133/259
114
OV E r C OMI N GB A r r I E r S T
OI ND U S T r I A l E NE r GY E F F I C I E N C Y T hr O U Ghr E G Ul A T I ONA ND OT hE r G OV E r NME NT P Ol I C I E S
6
“ Demonstration projects inspire companies
to implement new technologies and create the
condence to replicate them, acilitate sta
training and stimulate ideas or urther innovation
aer a long time (Jae, Newell and Stavins 2004). Teeects, i they can be identied at all, are evident onlyaer several years, a major barrier to increased R&Dand technology diusion. Evidence suggests that suchexpenditures are cost-eective or society as a whole,but successul developments could be copied by coun-tries or rms that have not shared the upront costs(UNIDO 2008b).
wo highly eective technical assistance pro-grammes that eventually became commercialactivities are Argentina’s Energy Study Groups andGhana’s Energy Van Service (ECLAC 2010; EnergyFoundation n.d.). Energy Study Groups, whichemerged rom an agreement between the Nationalechnology University and the Secretariat o Energyin 1985, consist o a proessor with extensive experi-ence in energy issues (the director) and two or threeengineering proessionals who visit industrial rms,
provide energy assessments and help implement solu-tions. Te services were ree at rst, but in 1990 thegroups began to charge a ee. By 2010, more than2,000 companies assisted by the groups had improvedsteam production and distribution systems, ovens anddrying systems, electrical motors, air compressors,rerigeration acilities, air conditioning and ventila-tion equipment, and other equipment and systems.
Under Ghana’s Energy Van Service, provided bythe Energy Foundation since 2004, a van stocked with
energy diagnostic and measuring instruments suchas motor testers, power and combustion eciencygas analysers and ultrasonic leak detectors visits busi-nesses regularly to identiy and estimate energy-saving opportunities. Te services were originally provided atno charge, but several companies have requested per-manent on-site services, which are now available orlease to energy service companies.
Promoting demonstration projects
New technologies, especially i capital intensive,requently require public investment in demonstra-tion projects. ypically, a rst-o-a-kind plant is sev-eral times as expensive per unit o capacity as add-ing a plant aer the technology has been piloted
elsewhere. Tese initial high costs can present a sub-stantial barrier, especially i the technology is lumpy(it cannot be acquired in small increments but mustbe purchased in large, discrete units) and billions o dollars are involved. Egypt and Malaysia have useddemonstration projects extensively in industriessuch as pulp and paper, glass, ood, steel, palm oiland textiles to promote energy-ecient technologies
(UNIDO 2011).Demonstrating technology applications can show
that new technologies need not be prohibitively expen-sive and can generate substantial benets, thus encour-aging adoption by similar companies. Demonstration
projects inspire companies to implement new tech-nologies and create the condence to replicate them,acilitate sta training and stimulate ideas or urtherinnovation. Tus, eectively promoted, such projectshave a large multiplier eect (Hamed and Mahgary
2004).
Taking advantage o international
cooperation
International cooperation can be a major source o new energy-eciency knowledge and technology ordeveloping countries. By participating in internationalresearch groups or taking advantage o oreign techni-cal assistance and technology transer in specializedenergy-eciency elds, countries have tapped state-o-
the-art advances.Te Russian Federation recently sought public and private international cooperation (Soloviev 2009).It signed agreements with the German and FinnishGovernments and with Siemens AG, a major German
power equipment manuacturer. Te German EnergyAgency is advising its local counterpart on the designand implementation o innovative and promising approaches or energy eciency, while the Finnishauthorities provide expertise in technologies or coldclimates. Siemens AG is helping develop a programmeor enhancing energy eciency in Yekaterinburg.
Experience shows that local partners can reap sub-stantial benets rom international cooperation linkedto local policy measures when there has been substantial

8/2/2019 Unido Full Report eBook
http://slidepdf.com/reader/full/unido-full-report-ebook 134/259
115
OV E r C OMI N GB A r r I E r S T
OI ND U S T r I A l E NE r GY E F F I C I E N C Y T hr O U Ghr E G Ul A T I ONA ND OT hE r G OV E r NME NT P Ol I C I E S
6
“ Accurate carbon pricing is a precondition or
creating maret incentives to change consumer
behaviour and promote industrial energy eciency
preparatory activity, when technology is adapted tolocal conditions, when cooperation at the working level is sustained and when public-private partnershipsare given high priority (UNIDO 2011). Egypt’s expe-rience with international cooperation suggests that
programmes that support the entire value chain, rom product conception through nal sales to consumers, yield better energy-eciency results by enabling sys-
temic gains than do piecemeal projects (UNIDO 2011).
Using maret-based policy instruments
Market-based policy instruments capture the spillovereects o an economic agent’s action by internalizing externalities. Instruments include corrective taxes ornegative externalities (such as carbon taxes) and sub-sidies or positive ones (such as carbon emission trad-ing schemes). International schemes o this type wereestablished by the Kyoto Protocol and have since been
replicated regionally and nationally.
Introducing carbon pricing
Industrial rms’ decisions on investing in industrialenergy eciency are distorted when market orces ailto account or greenhouse gas emissions rom carbon-intensive energy sources (market ailure) or whencarbon-intensive energy is subsidized and thus under-
priced. Accurate carbon pricing is a precondition orcreating market incentives to change consumer behav-
iour and promote industrial energy eciency.8
Carbon taxes curb demand or carbon-intensiveenergy by increasing its price. In principle, the taxesshould create an incentive or technical innovation(dynamic eciency) – and also reduce greenhousegas emissions to the point where the marginal cost o additional abatement equals the tax, thus minimiz-ing the cost o reducing emissions (static eciency).9 Carbon taxes provide more choices in the level andmethod o cutting greenhouse gas emissions than dotechnical regulations and product bans. In addition,less administrative work is required to manage taxesthan to establish and enorce regulations, thus sav-ing taxpayer money (Jae, Newell and Stavins 2004;Kosonen and Nicodème 2009).
axes on products and services directly or indi-rectly linked to greenhouse gas emissions generate rev-enue that can go to the government budget or nanceindustrial energy-eciency investment at a lower costthan commercial bank loans (Gillingham, Newell andPalmer 2006). ax revenues can also nance inorma-tion and auditing programmes, lower taxes or indus-tries that meet negotiated energy-eciency targets and
und research on energy-eciency technologies. Teseunds can be administered through private organiza-tions, government agencies or international organi-zations. An example is Sri Lanka’s Pollution Controland Abatement Fund, established by the governmentin 1995 ($5 million) to help industrial rms improveenergy eciency and adopt pollution-reducing meas-ures (Tiruchelvam, Kumar and Visvanathan 2003).Te programmes included technical assistance andcredit.
Energy and carbon taxes are oen complementedby other instruments, such as energy-eciency subsi-dies (see section below on tailoring subsidies), inor-mation campaigns and labelling. axes alone may notsuce to address environmental problems, since thetax rate is an imperect proxy or the externality andis constrained by concerns about impact on incomedistribution and industrial competitiveness (Kosonen
and Nicodème 2009). axes do not address othercommon market ailures either, such as imperect
inormation.Removing direct and indirect subsidies on carbon-intensive energy (such as lower value added taxes) is arst step towards pricing that reects the true cost o energy use. Removing subsidies will increase the priceo carbon-intensive uels and strongly inuence adop-tion o industrial energy-eciency measures becauseo the long lietimes and slow turnover o energy-intensive appliances and capital equipment. Energy-
producing countries with subsidized uel prices wouldalso benet rom removing subsidies: carbon-intensiveenergy sources could be sold at much higher priceson international markets, with positive impacts ongovernment budgets and export earnings, especiallyin an environment o rising energy prices. Whenever

8/2/2019 Unido Full Report eBook
http://slidepdf.com/reader/full/unido-full-report-ebook 135/259
116
OV E r C OMI N GB A r r I E r S T
OI ND U S T r I A l E NE r GY E F F I C I E N C Y T hr O U Ghr E G Ul A T I ONA ND OT hE r G OV E r NME NT P Ol I C I E S
6
“ Removing direct and indirect subsidies on
carbon-intensive energy is a rst step towards
pricing that refects the true cost o energy use
subsidies are removed, the social implications mustbe taken careully into account, with compensating mechanisms introduced as necessary to protect poorand disadvantaged groups.
China, Egypt, India, Indonesia, Malaysia,Romania and the Russian Federation were among the37 developing countries reviewed that have begunremoving subsidies on carbon-intensive energy and
are moving towards carbon pricing (UNIDO 2011).Te approach has or the most part been gradual, andsome evidence in Egypt and Indonesia suggests thatenergy-intensive rms have adjusted to new pricing structures without major production disruptions.aking guidance rom international energy pricesand using dierential pricing to induce energy-ecient behaviour seem to be eective in reduc-ing energy consumption and intensity in China.Enterprises are charged increasingly higher rates
or additional units o electricity to phase out ine-cient enterprises and reduce emissions (Moskovitzet al. 2007). In 2007, the policy was adjusted to allow
provincial authorities to retain the revenue collectedrom the dierential pricing, providing strongerenorcement incentives.
Designing an eective way to remove energy sub-sidies is a major policy challenge. Eliminating thesubsidies can have negative eects where, or example,they promote aordable energy or smaller rms.10
Eliminating or reducing energy subsidies to encourageindustrial energy eciency should be combined withother measures to help vulnerable rms and house-holds (Ayres and Warr 2009). Strategically redirecting subsidies (leveraging the ree-rider eect o energy sub-sidies or rms that would have made energy-eciencyimprovements anyway) can release money or new pro-grammes to support more successul energy-eciencyinvestments and reduce budget outlays.11
Launching emissions trading schemes
Emissions trading schemes are generally a more com- plex market-based approach to industrial energy e-ciency and are unlikely to be a key policy initially ormost developing countries. Tere is potential, however,
or the schemes to be part o the policy ramework o some larger developing economies.
he EU Emissions rading System, a multi-country, multisector climate change mitigation
policy, aims or cost-eective emission reductions.It sets targets or large greenhouse gas emissionsources (including the energy-intensive manuactur-ing industry) and allows trading or emissions below
the targets. It covers more than 10,000 installationsin industrial electricity-generating sectors that arecollectively responsible or nearly hal o EU carbondioxide emissions. But the system has aced severalchallenges. Notably, compliance has been dicult
with the price o emission allowances so volatile(Wara and Victor 2008). Also, as a new scheme, thereare complexities in measurement, reporting and veri-cation, requiring a large, well trained sta and robustlegislative procedures. Tere have also been concerns
about international competitiveness and “carbonleakage,” but only a ew sectors have experienced largecost increases, and most appear to have beneted. Teimpact o the scheme on industrial energy eciencyis dicult to gauge, since the scheme began just a ew
years ago and is ocused on carbon reduction, not e-ciency directly.
Promoting energy saving certicates
A more direct industrial energy-eciency policy, and
one meant to complement the EU Emissions rading System, is the UK Carbon Reduction Commitment,launched in 2010. his mandatory scheme aimsto improve energy eiciency and cut emissions inlarge public and private sector organizations, whichtogether account or some 10 percent o UK emis-sions. Te scheme ranks participants annually on theirenergy-eciency perormance. Te Energy SavingsScheme o New South Wales, Australia, requireselectricity retailers, licensed suppliers and electricity
purchasers to meet energy-savings targets through perormance or the purchase o certicates (NSWGovernment 2010; see Chapter 5).
India has also taken this perormance-basedapproach to industrial energy eciency. In 2010, the

8/2/2019 Unido Full Report eBook
http://slidepdf.com/reader/full/unido-full-report-ebook 136/259
117
OV E r C OMI N GB A r r I E r S T
OI ND U S T r I A l E NE r GY E F F I C I E N C Y T hr O U Ghr E G Ul A T I ONA ND OT hE r G OV E r NME NT P Ol I C I E S
6
“ Subsidies and tax allowances, by
lowering the costs o investing in industrial
energy eciency, are designed to mobilize
investment, prepare or new regulations or
promote energy-ecient technologies
National Mission or Enhanced Energy-Eiciencyannounced the Perorm, Achieve and rade schemeor large energy-intensive industries. Coupled withharsh penalties or non-compliance, the scheme aimsto strengthen incentives or saving energy. It providesopportunities or energy-intensive industries to tradeeiciency achievements above set targets throughEnergy Saving Certicates. Energy savings are cer-
tied, and credits are awarded or reaching bench-marks. Te credits can be traded to industries thatail to meet technical regulations. Launched in April2011, the scheme is too new to evaluate. Te mecha-nism intends to cover about 600 enterprises initially.Baseline energy auditing or these industrial rms hasalready begun (Box 6.7).
Tailoring subsidies and allowing
accelerated depreciation
Subsidies and tax allowances, by lowering the costs o investing in industrial energy eciency, are designedto mobilize investment, prepare or new regulations or
promote energy-ecient technologies by expanding markets. Subsidies can be paid directly rom publicunds to rms investing in energy-ecient technol-ogy or related services, such as audits, or they can be
provided as tax credits and allowances or reductions in value added taxes.
Several countries subsidize energy-ecient equip-
ment to accelerate uptake. Chile reimburses rmsor the cost o hiring energy auditors, covering up to70 percent o consulting ees, with a cap o $10,000(ECLAC 2009). China has earmarked roughly $2 bil-lion or subsidies or 5 o their 10 identied key indus-trial energy-eciency projects (coal industrial boilersor kilns, waste heat recovery/waste power recovery,
petrochemical conservation or substitution, electricalmachinery energy-saving system and energy systemoptimization).
Malaysia has integrated subsidies into a targetedtax scheme or improving industrial energy eciency.Companies that provide energy-eiciency servicesare eligible or a 100 percent corporate income taxexemption or 10 years or a 100 percent investment
tax allowance on qualiying capital expendituresincurred over ve years. Companies that make capitalexpenditures to reduce their energy consumption areeligible or a 100 percent investment tax allowance onthe qualiying expenditure over ve years. Te pack-
age also eatures import duty and sales tax exemptions(APERC 2010a).Tailand has allocated some $4.5 million to sub-
sidizing energy-conservation programmes (APERC2010a). A cost-based tax incentive oers a 125 per-cent tax break on investments improving energy e-ciency. A perormance-based incentive allows com-
panies to deduct 30 percent o the energy savingsrom their taxes up to a ceiling o $60,000. ogether,these incentives have led to estimated savings o $10–$30 million a year (Sinsukprasert 2009). A gov-ernment evaluation ound higher payback in energysaved per dollar invested rom cost-based solutionsthan rom perormance-based ones. unisia has hadsimilar success with cost-based subsidy measures when
India’stotaannuaenegyconsumptionisabout450
miiontonnesofoiequivaent(toe).InApi2011,te
IndianBueauofEnegy-Efciencyeeasedtagetsfo
580industiaunitsin eigt enegy-intensive sectos
(temapowestations,stee,fetiize,cement,aumin-
ium,coakai,papeandtexties).Togete,teseunits
consumeabout200miiontoeayea.Teoveatagets
woudeadtosectowidesavingsofaound5pecentofcuentenegyuse,equivaentto10miiontoe.
Taget-settingwi eventuayead toa maket-
based mecanism aowing businesses tat cannot
eacteitagetstobuyenegyceticatesfombusi-
nessesusingessenegytanteitaget.
Fimsfaiingtocompywibeassessedapenaty
equatotepiceoftesotfa.Penatieswiaccue
tostateteasuies,witeacstateavingadesignated
enfocementagency.
Accoding to te Bueau of Enegy Efficiency,
opeationaguideinesavebeenpepaedbasedon
discussionswittetagetedindusties,andanycon-
censavebeenaayed.
Source: Economic Times 2011.
Box 6.7
Energy saving certicates in India

8/2/2019 Unido Full Report eBook
http://slidepdf.com/reader/full/unido-full-report-ebook 137/259
118
OV E r C OMI N GB A r r I E r S T
OI ND U S T r I A l E NE r GY E F F I C I E N C Y T hr O U Ghr E G Ul A T I ONA ND OT hE r G OV E r NME NT P Ol I C I E S
6
“ Access to nance remains a considerable
barrier in developing countries, despite the fow
o nancial aid to energy-eciency projects
rom multilateral nancial institutions – and
the nancial protability o many projects
targeting energy audits and energy-eciency projects(ANME n.d.; Georgy and Soliman 2007).
Boosting demand
Utility companies are in a unique position to inuenceindustrial energy eciency because o their nancial,organizational and technical capacity and their con-nection to virtually all energy users (UNECE 2010).
Many utility companies are motivated to managedemand because they ace load-capacity limitations,blackouts and unreliable supply. Demand-side man-agement programmes aim to reduce industrial energyconsumption through rebates, loans, subsidizedaudits, ree installation o equipment and energyawareness programmes (Gillingham, Newell andPalmer 2006). Te changes are implemented throughspecialized rms. Tus, while demand-side manage-ment can reduce energy consumption and increase
energy eciency, regulatory mechanisms and gov-ernment support are required to create mandates orincentives or utilities and supporting rms (Violette,2006; Gillingham, Newell and Palmer 2006; WorldBank 2005).
Demand-side management programmes, popularin developing countries, are used mainly to ease theshi rom incandescent bulbs to uorescent lamps andother orms o energy-ecient lighting. Some develop-ing countries, including China, Colombia, Indonesia,
the Philippines, South Arica and Tailand have goneurther and integrated demand-side management programmes into broader national energy saving poli-cies (Tiruchelvam, Kumar and Visvanathan 2003;UNIDO 2011).
Te success o industrial demand-side manage-ment depends on the ownership and structure o energy markets and the systems or monitoring and
veriying energy savings. Experience in South Arica,hailand and Viet Nam reveals several potentialobstacles (World Bank 2002, 2004, 2005). Problemshave included inadequate inormation about eciencyopportunities or end-users, equipment manuactur-ers and service providers; insucient incentives orutilities; unair competition between private sector
companies implementing the programmes; lack o transparency; inconsistent management support;requent stang changes; high project developmentcosts arising rom audit and technical studies requirerequirements; and lack o aordable nancing. Anassessment o demand-side management programmesin Tailand notes the greater success o programmesaimed at households than o programmes encourag-
ing rms to adopt more energy-ecient equipment,largely because o a lack o investment nancing.
Launching nancial instruments
Both the public and private sectors have cratednancing mechanisms to address investment barriersat each stage o technology development: innovation(research and development), demonstration, deploy-ment and diusion (Makinson 2006). Te gaps areconcentrated between the demonstration and the
deployment stages (MacLean et al. 2008; Figure 6.2),so the bulk o public nance and technical coopera-tion addresses the lack o capital and capacity beorethe technology reaches the diusion stage.12
Ensuring access
Access to nance remains a considerable barrier indeveloping countries, despite the ow o nancial aidto energy-eciency projects rom multilateral nan-cial institutions – and the nancial protability o
many projects (Sorrell, Mallett and Nye 2011; Worrell2011; te Velde 2010; Schleich 2011). So loans, oenas special-purpose energy-eiciency unds, are themost common orm o nance (Box 6.8). Other mech-anisms include credit lines, revolving unds, publiclybacked guarantees and project loan acilities. Mosto these nancial instruments are backed by multi-lateral nancial institutions; some include technicalassistance.
O the 37 developing countries in the UNIDO policy review, 21 have established an industrial energy-eiciency inancing mechanism (UNIDO 2011).Te Chinese Government set up a loan programmeor energy conservation in 1980. Te largest energy-eiciency investment programme ever undertaken

8/2/2019 Unido Full Report eBook
http://slidepdf.com/reader/full/unido-full-report-ebook 138/259
119
OV E r C OMI N GB A r r I E r S T
OI ND U S T r I A l E NE r GY E F F I C I E N C Y T hr O U Ghr E G Ul A T I ONA ND OT hE r G OV E r NME NT P Ol I C I E S
6
“ O the 37 developing countries in the UNIDO
policy review, 21 have established an industrial
energy-eciency nancing mechanism
Stage 1R&D
Stage 2Demonstration
Stage 3Deployment
Stage 4Diffusion
Stage 5Commercial maturity
F i n a n c i n g
G a p s
L a r g e
r p r o j e c t s fi n a n c i n g p a c k a g e
Public finance mechanisms Commerical financing mechanisms
Valley of death
Debt-equity gapLack of project development
capacities and capital
High perceived risks
R&D support
Grants
Incubators
Soft loans
Equity
Mezzanine
Debt
Insurance
Carbon
Loan facilities
Credit lines
Guarantees
Public-privateequity funds
Public-privateventure capital funds
Angelinvestors
Venturecapital
Figure 6.2
Technology innovation path and nancing gaps
Source: MacLean et al. 2008.
Teeaeseveatoosfoaddessingiquidityconstaints
and isk tatimpede investment in industia enegy-
efciencyinvestmentsindeveopingcounties.
Credit lines can be offeed at concessiona ates
weemaketatesaeig.Guaanteesooteisk-
saingstuctuesbetweentedeveopmentnanceinsti-
tutionandocacommeciabankscaneduceapoject’s
ceditisk.
Sot loans aeoansatsubsidizedinteestatesfoindustiestatinvestinenegy-efciencytecnoogiesand
equipment.Somesoft oansincudeinteest-feegace
peiodsuntievenuesfomteenegysavingsstatto
ow.Mostnationaandmutinationadeveopmentnance
institutionssetupoanpogammestotenancing
gapsinimmatuenanciamakets.Ceatingdebtnanc-
ingmecanismsisimpotantfodeveopingnewmakets,
especiaysmaenegy-efciencyventues.Concessiona
nancingintefomofinteestatesubsidiesofeespaid
topatnebankscanbeappopiateinmaketswitout
commecianancingofenegy-efciencypojectsand
weebankiquidityisabaie.Coseyeatedtosoftoansae revolving unds, wic
useepaymentofpeviousoanstonancenewoansfo
enegy-efciencypojects.revovingfundscanbepub-
icyfunded(fuyopatiay)andmaybeestabisedin
coopeationwit commeciabanks. Enegy-efciency
pojectsseekingfundingdonotneedtocompeteagainst
moetaditionainvestmentsfobankfunding.Tepubic
fundsaepovidedtocommeciabankswitnointeest
owebeowmaketates,enabingtebankstooffe
beow-maketates.Inetunfoeceivingpubicfunds,
banksmaybeaskedtoassumesomeoaofteiskofepaymentassociatedwitteoans.
Publicly backed guarantees aetee-patycontacts
inwicapubicinstitutionguaanteestocompensatea
endeifteboowedefauts.Teseinstumentsmitigate
tenancingisksassociatedwitmedium-toong-tem
oans.reatedscemesaepatiaceditandpatiaisk
guaantees.Guaanteescemesinbotdeveopedand
deveopingcounties avemobiizedpivateesouces
andfaciitatedaccesstocapita.
Project loan acilities tenancinggapsinmakets
weecommeciainstitutionsaeunabeounwiingto
povidenancing.Ceatedbygovenmentsanddeveop-mentnanciainstitutions,tesefaciitiescanbeeffective
nancemecanismsifcaefuydesigned.
Source: Mostert, Johnson and MacLean 2010; Makinson 2006; MacLean et al. 2008.
Box 6.8
Tools or addressing liquidity constraints and ris in developing countries

8/2/2019 Unido Full Report eBook
http://slidepdf.com/reader/full/unido-full-report-ebook 139/259
120
OV E r C OMI N GB A r r I E r S T
OI ND U S T r I A l E NE r GY E F F I C I E N C Y T hr O U Ghr E G Ul A T I ONA ND OT hE r G OV E r NME NT P Ol I C I E S
6
“ Public nance can leverage and
stimulate commercial nance, but nancial
institutions also need to be educated about
industrial energy-eciency nancing
by a developing country, it commits 7–8 percent o total energy investment to energy eciency, primar-ily in heavy industry. Te programme not only unded
projects that had an average cost o conserved energy well below the cost o new supply, but it also stimu-lated adoption o ecient technologies well beyondthe small pool o project und recipients (Levine andLiu 1990; Liu et al 1994). O the apparent 25 percent
drop in industrial energy intensity in the 1980s, about10 percent can be attributed directly to the eciencyinvestment programme (Sinton and Levine 1994)and a larger amount to unsubsidized eciency invest-ments, eciency improvements incidental to otherinvestments and housekeeping measures (Worrellet al. 2001).
Arican governments have also begun to intro-duce concessional project inance or energy-ei-ciency investments (UNIDO 2011). Te Egyptian
Government set up the Environmental ComplianceOce at the Federation o Egyptian Industries to pro-
vide environmental services to small and medium-sizeenterprises, including access to so loans or indus-trial energy-eciency investments (FEI n.d.). unisiaestablished a National Fund or Energy Conservationin 2005. In South Arica, the public electricity utility,ESKOM, provides concessionary unding or capitalexpenditure and implementation costs or industrialenergy-eciency projects.
Public nance can leverage and stimulate com-mercial nance, but or industrial energy-eciency projects, care is needed to ensure that public nancedoes not deect businesses rom seeking commer-cial nance. Commercial nance has to be the mainsource o energy-eciency nancing. o be eective,
public nancing mechanisms must address both sup- ply and demand constraints, ensure that projects aretechnically viable and nancially protable and leaveroom or local nancial institutions to oer accessibleand aordable nancing (Gielen 2009). Te transac-tion costs o industrial energy-eciency projects arehigh because many are small and technically complex.Financing mechanisms should accompany techni-cal assistance programmes or nanciers and project
developers and implementers. Many nancing mech-anisms or small to medium-scale projects requirenancial intermediaries (Makinson 2006).
Financial institutions also need to be educatedabout industrial energy-eciency nancing (Ghosh2011; UNIDO 2011). Poor communication andadvertising prevent Indian enterprises rom learning about the nancial acilities available or industrial
energy-eiciency projects. Bankers in India otenregard energy-eciency technologies as unproven andthereore risky because they lack the knowledge orresources to appraise them. And developing countrybanks need to avoid overburdening local rms withred tape. Loan applications oen require so manyclearances and certications rom multiple institu-tions (land oces, registration authorities, munici-
pal water and waste disposal authorities, electricitydepartments, pollution control authorities, district
industry centres, credit rating agencies and so on) thatenterprises are deterred rom applying.
Promoting energy service companies
Energy service companies (ESCOs), which provideenergy-management services and creative nancing tools to industrial rms (Vine 2005), are more a pri-
vate initiative than a government policy instrument.hey are discussed here because UNIDO’s 2011
policy review ound that 11 developing countries are
promoting and supporting them as industrial energy-eciency tools. Trough energy perormance con-tracts, ESCOs and rms set the terms or risk-sharing and co-nancing industrial energy-eciency projects.ESCOs design and provide or arrange nancing orthe project (and receive payment based on energy ser-
vices provided by the project), sometimes assume the project perormance risk (by guaranteeing a minimumlevel o energy savings) or the credit risk, and installand maintain the equipment (MacLean et al. 2008).For industrial rms, this approach is an innovative
way to nance large industrial energy-eciency pro- jects without paying cash up ront.
raditional project nancing rules may not applyto energy perormance contracts, which can be treated

8/2/2019 Unido Full Report eBook
http://slidepdf.com/reader/full/unido-full-report-ebook 140/259
121
OV E r C OMI N GB A r r I E r S T
OI ND U S T r I A l E NE r GY E F F I C I E N C Y T hr O U Ghr E G Ul A T I ONA ND OT hE r G OV E r NME NT P Ol I C I E S
6
“ Many policy instruments in developed
countries are suitable benchmars or developing
countries, though design may need to change
to meet national and local conditions
as either on- or o-balance sheet transactions. ESCO payments are linked to a rm’s energy perormance:no energy savings means no payment (Satchwell etal. 2010). Payments are not to exceed savings, andindustrial rms do not make capital investments orcapital commitments to the project. Monthly pay-ments to ESCOs are treated as utility expenses andrecorded as debt. Te payments may vary with the sav-
ings, or the savings can be shared between the ESCOand the rm. Since project nancing is consideredan o–balance sheet transaction, no assets accrue toESCOs, and the rm owns the equipment.
While there have been great expectations orESCOs, experience in both OECD and developing countries shows that the impact o ESCOs in promot-ing and nancing industrial energy eciency has oenbeen limited (Vine 2003; Painuly et a l. 2003). Despiteexceptional overall growth in the United States,
ESCO’s success has been conned largely to the pub-lic sector and much less to commercial and industrialactivities (Goldman et al. 2002; Satchwell et a l. 2010).Many developing countries lack the legal and nan-cial ramework to enorce the complex contractualmodels required or ESCOs (Sarkar and Singh 2010).International ESCOs, while initially eager to operatein developing countries, acknowledge that many pro-spective customers require more time and capacity-building to adequately understand and accept such
models, and customer credit-worthiness and localcredit are not assured (Sarkar and Singh 2010).
Policy design and implementation
considerations or developing
countries
Policy replication, local governance capacity and pol-icy evaluation are all issues that developing countriesshould consider in policy design and implementation.
Policy replication
Te literature on the impacts o industrial energy-eiciency policies shows that developed countriesrely too much on policy tools rom developed coun-tries (Sarkar and Singh 2010). Policies (and policy
evaluations) should reect developing country marketand technological conditions.
Still, many policy instruments in developed coun-tries are suitable benchmarks or developing countries,though design may need to change to meet nationaland local conditions. Developing country policy-makers seeking to replicate policies rom other coun-tries should consider several actors:• National patterns o industrial specialization
(dominant industrial sectors and their energyintensities).
• Characteristics o individual sectors, such asenergy use, international and domestic energy
perormance, main sources o energy losses, poten-tial or energy-eciency improvements, domestictechnological capabilities and technical, manage-rial and nancial capabilities to implement energy-eciency opportunities.
• Alignment o policy instruments with socioeco-nomic eatures (laissez-aire or command-and-control systems) and cultural norms; some coun-tries may need more strict regulatory regimes withormal sanctions while others can rely on norma-tive pressures (WEC 2010).
• Suitability o existing policy rameworks and policy-making records (achievement o policyobjectives, including economic eectiveness andbudgetary impacts).
•
Ability o public administration to assess country-specic aspects and to implement policy measures.
Local governance capacity
Some instruments require sophisticated institutionsand a capable public administration, so countries mayneed to improve administrative capabilities and estab-lish new regulatory institutions. Preparing inorma-tion and building the institutions needed to ormulate,institutionalize and implement industrial energy-e-ciency policies and programmes all have costs, some-thing not always considered in policy measure discus-sions (UNEP 2006a; WEC 2008). Including thesetransaction costs is especially important in develop-ing countries, where markets and institutions are less

8/2/2019 Unido Full Report eBook
http://slidepdf.com/reader/full/unido-full-report-ebook 141/259
122
OV E r C OMI N GB A r r I E r S T
OI ND U S T r I A l E NE r GY E F F I C I E N C Y T hr O U Ghr E G Ul A T I ONA ND OT hE r G OV E r NME NT P Ol I C I E S
6
“ Some instruments require sophisticated
institutions and a capable public administration, so
costs or policy capacity-building in benchmaring
and developing indicators need to be actored in
mature than in developed countries. Any costs or pol-icy capacity-building in benchmarking and developing indicators to measure the eects o energy-eciency
policies, such as industrial plant energy auditing andmonitoring, reporting, verication and evaluation,also need to be actored in.
International organizations can help to col-lect and disseminate inormation or domestic and
international policy benchmarking. he UNIDO(2011) industrial energy-eiciency policy databasedeveloped or this report documents 21 industrialenergy-eciency policy mechanisms in 37 develop-ing economies (see Annex 14). he InternationalEnergy Agency’s (IEA) Energy-eciency Databasedetails some 170 policies and measures introducedlocally, regionally and nationally in 32 countries andthe European Union (IEA 2008c). Te IEA’s WorldEnergy Outlook Policy Database includes 530 entries
or industrial policies and programmes, drawn romother IEA databases (Climate Change MitigationDatabase, Energy-eiciency Database, GlobalRenewable Energy Policies and Measures Database),the European Conerence o Ministers o ransportand contacts in industry and government (IEA2008a). Lessons rom implementing these policiescould accelerate industrial energy-eciency uptake i applied across developed and developing countries.
Policy evaluationTere are numerous approaches to assessing barriers toindustrial energy eciency and identiying policies toovercome them, including orthodox, transaction costand behavioural economics and organizational theory(Montalvo 2008; Sorrell, Mallett and Nye 2011). Andthere is a range o objectives against which to assess
policy impact, including energy use and greenhousegas emissions, social and developmental objectives andtheir economic costs. Instruments such as taxes, eesand penalties can generate revenue, while others suchas subsidies, grants and inormation and awareness
programmes have costs. Studies rigorously evaluating policy eectiveness in developing countries are stilllacking.
Many options
As developing countries continue to industrialize tomeet the needs o growing populations, industrialenergy eciency seems to be a relatively uncontrover-sial area or policy intervention to ensure sustainabledevelopment. It is hard to argue with the success o measures that resonate in both concept (doing more
with the same or the same with less) and practice
(increasing industrial energy eciency to yield tangi-ble benets or most, i not all, stakeholders).
Developing countries have an array o policyoptions, but selecting the right mix is not easy. Mosto the options come with uncertainties or downsides.Rules and regulations can cut greenhouse gas emis-sions substantially, but targets can be unrealistic andlegislation too inexible to adapt to rapidly evolving technological change. A governance structure is indis-
pensable, yet it can also become a source o red tape and
corruption. Inormation and training are crucial ordealing with market ailures and apprising entrepre-neurs o hidden costs, yet the costs o providing themand o identiying who to provide them or are oenoverlooked. echnology and innovation are key driv-ers o industrial energy eciency, but they are beyondthe means and capabilities o all but a ew developing countries and can take a long time to yield returns.Most developing countries will continue to rely on or-eign technologies, but even that requires building local
absorptive capacity. Market-based policies can inducedesired behaviour cost-eectively, yet they involveacute intertemporal trade-os and can sometimes beunpopular. Financial instruments can overcome some
problems o access to capital and lower perceived risk,but they require a sophisticated nancial sector.
Despite the array o policy options to chooseamong, several things seem clear. International policybenchmarking is necessary, as are local adaptation o
policy measures, solid local policy design and imple-mentation capacity, and continuous evaluation o
policy initiatives.Promising areas or advancing developing country
policies are voluntary and negotiated approaches anddirect private sector involvement in implementation.

8/2/2019 Unido Full Report eBook
http://slidepdf.com/reader/full/unido-full-report-ebook 142/259
123
OV E r C OMI N GB A r r I E r S T
OI ND U S T r I A l E NE r GY E F F I C I E N C Y T hr O U Ghr E G Ul A T I ONA ND OT hE r G OV E r NME NT P Ol I C I E S
6
“ Despite the array o policy options,
several things seem clear: international policy
benchmaring is necessary, as are local
adaptation o policy measures, local policy
design and implementation capacity, and
continuous evaluation o policy initiatives
China is one o the ew developing countries using negotiated agreements, based on Danish, Dutch andFinnish models. Involving top management o highenergy-intensity rms in corporate decision-making has led to successul inormation and technological
policies on industrial energy eciency.Small and medium-size enterprises and the nan-
cial sector warrant special attention. Such rms have
a vital role in accelerating industrial growth in devel-oping countries, yet they are considerably less energyecient than their developed country counterparts.ailored policy packages and incentives could helptransorm small and medium-size enterprises intoenergy-eicient engines o growth. he domesticnancial sector, despite making more unds availableor investment in industrial energy-eciency projects,has yet to establish the procedures needed to acili-tate energy-eciency lending. Governments need to
provide the ramework and support to enable thesechanges. Chapter 7 looks at the role o internationalcollective action in encouraging industrial energyeciency.
Notes
1. o accompany this report, UNIDO compiled adatabase o industrial energy-eciency policiesdrawn rom ocial documents and webpages,databases o various international organizations
and the academic literature. Te database is avail-able at http://ieep.unido.org. A list o policies is inAnnex 14.
2. Te World Energy Council (WEC 2010) reportsthat as o 2009, 70 countries (or two-thirds o sur-
veyed countries) had adopted national energy pro-grammes with national and sectoral quantitativetargets or energy-eciency improvements, twiceas many as in 2006. In Europe, some 90 percento countries had adopted targets, up rom 55 per-cent in 2007. Around 60–80 percent o surveyedcountries preer to use targets or energy-eciencyimprovements or energy savings.
3. Te rationale behind voluntary agreements canalso be ethics-governed behaviour or hedging
against imposition o mandatory obligations(UNEP 2006c). Te US Department o Energykeeps a national database o voluntary reduc-tions in greenhouse gas emissions and a nationalinventory o emissions enabling any company to“make public commitments to uture reductions,set goals, and thereby improve its public image”(Gillingham, Newell and Palmer 2006).
4. Energy Star and the US Department o Energy’sindustrial technology programme Save EnergyNow reduced energy intensity 25 percent over10 years (McKinsey & Company 2009).
5. Studies based on empirical observation o posi-tive impacts ollowing adoption o ormal energymanagement systems include Helgerud andSandbakk (2009); Motegi and Watson (2005);and Tollander and Ottosson (2008).
6. Industrial systems such as steam- and motor-
driven systems account or more than 50 percento nal manuacturing energy use. Energy-savings
potential rom cost-eective energy-ecient opti-mization o these systems is estimated at 10–12exajoules o primary energy (Williams 2008).
7. Sri Lanka Sustainable Energy Authority (www.energy.gov.lk/sub_pgs/events_past.html).
8. Higher carbon prices can also result in loweroutput o desired products, higher costs orsuperior energy-ecient equipment and loss o
competitiveness.9. Energy savings rom such an emissions price policycan be assessed by examining the price elasticity o energy demand using a computable general equilib-rium model. Tese modelling exercises point outthat energy-eciency gains, energy conservationand alternative energy sources can generate deepcost-eective emissions cuts (Clarke et al. 2006;
Weyant, de la Chesnaye and Blanord 2006).
10. Te World Bank (2000) has called subsidies orenergy access “a rst priority o energy policiesaimed at alleviating poverty.” Well targeted sub-sidies can create a more inclusive electricity net-
work by helping marginal populations and smallrms overcome barriers to energy access and may
8/2/2019 Unido Full Report eBook
http://slidepdf.com/reader/full/unido-full-report-ebook 143/259
124
OV E r C OMI N GB A r r I E r S T
OI ND U S T r I A l E NE r GY E F F I C I E N C Y T hr O U Ghr E G Ul A T I ONA ND OT hE r G OV E r NME NT P Ol I C I E S
6 help reduce poverty and enhance rural develop-ment (Urban, Benders and Moll 2007).
11. Oen, subsidies are captured by rms and house-holds to help pay or eciency improvements they
were going to make anyway as part o the naturalrate o eciency gain.
12. MacLean et al. (2008) reviewed mechanisms to promote energy-eciency investments in the earlystages o technology development. Te discussionhere ocuses on the public and commercial nanc-ing mechanisms that acilitate demand pull ratherthan technology push.

8/2/2019 Unido Full Report eBook
http://slidepdf.com/reader/full/unido-full-report-ebook 144/259
125
Policy initiatives or industrial energy eciency, to beeective nationally, must be complemented by actionsinternationally. Systemic challenges such as climatechange involve global externalities and public goods,so international collective action must go hand in
hand with domestic action. And as industrial activityshis towards developing countries, they must become
part o international industrial energy-eciency ini-tiatives and coordination to ensure that emerging industrialization processes are sustainable.
In the absence o a global government, binding and voluntary country agreements have been the interna-tional collective response to environmental challenges.Te international governance ramework or industrialenergy eciency consists o so legislation and non-
binding rules, norms and action plans to coordinatestrategies, policies and programmes. Internationalagreements on specic actions and global coordina-tion o domestic policies should benet countries intwo ways – providing domestic initiatives with thestability that comes with international legitimacy, andenabling countries to learn rom each other’s successesand ailures in designing institutions and implement-ing practices (Sugiyama and Ohshita 2006).
his chapter briely addresses mechanisms o
international collective action that support industrialenergy eciency design and implementation in devel-oping countries. Aer discussing the rationale orinternational collective action, it examines our areasor intervention:• Setting international perormance targets and
standards.• Facilitating technological and structural change.• Contributing to international technology transers.• Procuring international nancing.
The rationale or international
collective action
Tis report contends that industrial energy eciencyhas yielded economic, social and environmental
dividends but that ailures in the markets or energy-ecient goods and services and departures rom therational behaviour o orthodox economics have limitedurther gains. Reducing the risks o climate change (a
product o perhaps the worst market ailure ever) is
the purest example o a public good – greenhouse gasemissions rom any one country aect the atmospherein the same way as those rom any other (Stern 2006).Markets also ail to supply inormation to evaluateenergy-saving opportunities. And with internationaltrade in equipment and technology proceeding apace,learning about those opportunities also becomes aglobal challenge. Gathering trustworthy interna-tional inormation can be costly and time consuming – especially or developing countries and their small
and medium-size industrial enterprises – and linking action to energy legislation can be dicult.
Global market ailures call or worldwide coopera-tion. International collective action is the only viablesolution or establishing governance mechanisms orsome global common resources and addressing theailures. Even when collective action results in onlyso commitments, it can establish important princi-
ples, incentives and norms – and increase monitoring and inormation ows (UNEP 2011).
Countries’ motivation to participate in interna-tional collective action, especially or climate change,combines mutual sel-interest and responsible, ethicalbehaviour (Stern 2006). Collective action decisionsshould be reciprocal, as parties expect equal treatmentand can retaliate with equal orce. But custom alsooen plays a role through understandings and agree-ments that are not ormally binding. Respect or inter-national obligations is increasingly based on views o conscientious and collaborative behaviour that is inline with domestic public opinion support.
Research on international collective action showsthat it can succeed where there is:• Suicient mutual sel-interest (Sandler 2004;
Stern 2006).
Chapter 7
International collective action or
industrial energy eciency

8/2/2019 Unido Full Report eBook
http://slidepdf.com/reader/full/unido-full-report-ebook 145/259
126
I NT E r NA T I ONA l C Ol l E C T I V E A C T I ONF Or I ND U S T r I A l E NE r GY E F F I C I E N C Y
7
“ Countries will see direct and indirect economic
benets rom participating in international
collective initiatives or industrial energy eciency
• A common understanding o the problem and arecognized shared threat (Stern 2006; Sandler2004).
• No ree-riding on the eorts o others (Stern2006).
• Agreement by all countries that action cannot suc-ceed without their participation (Stern 2006).
• Leadership by a dominant country (Grasso 2004;
Sandler 2004).• An international institution that provides inor-
mation and acilitates cooperation (Harris 2007;Keohane 1984).
• Flexibility or renegotiating rules and changing the structure o incentives (Barrett 2005).
• Frequent contact and transparency in negotiations(Stern 2006).
• Compensation mechanisms to promote wide par-ticipation and penalties to deter non-compliance
(Barrett 2005).• Selective mechanisms to deal with special groups
(Myatt 2006).International collective action might ace ewer
complications in addressing the barriers to industrialenergy eciency than in addressing those or climatechange or other environmental concerns. Climatechange negotiations are likely to have winners andlosers, at least in the short run, and those expect-ing to win may have incentives dierent rom those
expecting to lose (Cole 2008). So, while emission capstend to divide countries, the need to promote energyeciency is based on common interests and consen-sus in most countries (Sugiyama and Ohshita 2006).Industrial energy eciency involves a wider rangeo economic, social and environmental benets andmore possible combinations – in the short, mediumand long terms – increasing the number o win-winopportunities and thus the potential or internationalagreements.
Countries will see direct and indirect economicbenets rom participating in international collectiveinitiatives or industrial energy eciency (Figure 7.1).In the short run, international cooperation couldsave more energy, and in the long run it could reduce
poverty and spur economic growth. Making interna-tional agreements compatible with country benets
will ensure compliance and generate a credible, lasting ramework (Stern 2006).
One initiative widely perceived as successul isthe Montreal Protocol, which phases out chloro-luorocarbons and hydrochloroluorocarbons
worldwide (Harris 2007; UNEP 2011; see Box 7.1).
It provides pointers or possible international col-lective action on industrial energy eciency. TeMontreal Protocol’s success is built on three actors(Sunstein 2007):• Skillul draing, which allowed or exible solu-
tions and provisions or common but dierenti-ated responsibilities.
• A multilateral und, which helped developing countries comply with the protocol’s control meas-ures, particularly with the incremental costs o
implementation.• A ocus on a narrow range o products or which
substitutes could be developed, providing largebenets to politically inuential players at lowcosts.
Short term Medium and long term
D i r e c t b e n e fi t s
I n d i r e c t b e n e fi t s
• Industrial productivity andlearning improvements
• Resource-efficientinnovation
• Release of resources forexpanding energy access
• Improved human health
• Improved wage andemployment structure
• More equitable incomedistribution (povertyreduction)
• Local and regionaldevelopment
• Higher standards of living
• Inflow of investments,advanced technologiesand managementpractices
• Energy savings andconservation
• Increased profitabilityand internationalcompetitiveness
• Upgraded industrialstructure
• Sustainablemanufacturing production
• Rapid economic growthrates
• Continuous technology-upgrading andemployment generation
Figure 7.1
Economic benets rom participating ininternational collective action in industrialenergy eciency
Source: Adapted rom Stern (2006, p 461).

8/2/2019 Unido Full Report eBook
http://slidepdf.com/reader/full/unido-full-report-ebook 146/259
127
I NT E r NA T I ONA l C Ol l E C T I V E A C T I ONF Or I ND U S T r I A l E NE r GY E F F I C I E N C Y
7
“ International collective action or industrial
energy eciency should be mobilized in two
closely related areas: establishing targets
and standards and monitoring and assessing
indicators and progress towards goals
Setting international targets and
standards
Te diculties reaching international binding agree-ments on industrial energy eciency limit interna-
tional collective action or target-setting and bench-marking. So rm goals and legally binding targetsmight more appropriately all to national energy pro-grammes. But a wide variety o international actorscan encourage those at the national level to set andmeet such targets. International collective action orindustrial energy eciency should be mobilized intwo closely related areas:• Establishing targets and standards: international
institutions can set global or regional goals andglobal standards or each industry.
• Monitoring and assessing indicators and pro-gress towards goals: international institutionshave a key role in measuring and monitoring
progress.
Setting measurable targets
A well established approach to achieving perormanceobjectives, setting measurable targets can determine
priorities and direction, allow comparisons and bench-marking and sharpen the ocus or action. Oen, tar-gets are used to improve perormance, transparencyand accountability and to challenge those or whomthey are set. Yet, they must be realistic and reachable
to stay motivating. o combat climate change withinternational collective action on energy eciency,targets must involve a large element o additionalityover past perormance.
Many international actors recognize that com-mitting to global perormance targets is critical orinternational collective action on energy eciency.Te United Nations Advisory Group on Energy andClimate Change (AGECC) comprises representativesrom business, the UN system, the World Bank and
various research institutions, with broad geographicrepresentation. Recognizing the need or sustainabledevelopment in line with environmental needs, theadvisory group has called or international commit-ments to reduce global energy intensity 40 percent by2030 (AGECC 2010). Meeting this goal entails cut-ting global energy intensity about 2.5 percent a year, orabout twice the historical rate. Such a reduction wouldbe necessary or ensuring universal access to modernenergy services by the target date.
Energy eciency is also pursued through regionalintegration initiatives, some o which set targets. Forinstance, the Sydney Declaration o September 2007o the Asia-Pacic Economic Cooperation (APEC)asks members to increase region-wide energy ei-ciency at least 25 percent by 2030, using 2005 as thebase year. APEC does not prescribe individual action
plans or targets; instead, each member designs its owntargets and initiatives appropriate or its economy.Some members have simply adopted the goal o a25 percent improvement (such as Brunei, Hong Kong SAR China, Tailand and the United States). Others,especially in East Asia, have committed to energy-eciency goals well beyond the 25 percent benchmark(such as Japan, the Republic o Korea, Singapore and
Te MonteaPotoco on Substances tat Depete
teOzonelayeisanintenationateaty,openedfo
signatuein1987,aimedatpotectingteozoneaye
bypasingouttemanufactueofseveasubstances
foundtocontibutetoozonedepetion.Teseincude
seveagoupsofaogenatedydocabonscontain-
ingeitecoineobominetataeusedassovents
oefigeatingagents.TeMonteaPotoco,wicsuppementste1985ViennaConventionfotePo-
tectionof teOzonelaye,adbeenatiedby196
countiesby2011.
UNIDOisoneoftefouimpementingagenciesof
teMonteaPotocoandtodaytopsteistofimpe-
mentingagencies.Byteendof2010,teoganiza-
tionadcompeted1,142pojects(wot$533mi-
ionindisbusements)pasingout70,106tonnesof
potentia ozonedepeting substances.Anote 199
pojectsaebeingimpemented.Amajocaenge
aeadbotfoUNIDOandteMonteaPotocoiste
impementationofnationaosectoahydocoo-
uoocabonPase-outManagementPans(hPMPs),
wicappoactedeveopmentofeiminationpans
oisticay.
Source: UNIDO.
Box 7.1
UNIDO and the Montreal Protocol

8/2/2019 Unido Full Report eBook
http://slidepdf.com/reader/full/unido-full-report-ebook 147/259
128
I NT E r NA T I ONA l C Ol l E C T I V E A C T I ONF Or I ND U S T r I A l E NE r GY E F F I C I E N C Y
7
“ Many countries have used standards
successully as part o regulatory eorts to
mae their industries more energy ecient
aiwan Province o China). Still others have ramedtheir goals in ways not directly comparable to theAPEC goal – by using dierent target years or base
years or by measuring their energy savings in peta- joules (such as Canada, Chile, New Zealand and Peru;APERC 2010b). And some members, such as theRussian Federation, made pledges contingent on emis-sion cuts by other countries or on nancial support.
APEC has probably the most ambitious energy-eciency goal among regional economic communities,but other communities also have set goals. In July 2010,the Association o Southeast Asian Nations set a goalo reducing energy intensity in the region 8 percent by2015, using 2005 as the base year (ASEAN 2010). TeEconomic Community o West Arican States recom-mends that its members’ domestic energy-eciency
programmes dene energy-eciency standards as a rststep towards regional and international harmoniza-
tion (ECOWAS 2003). In 2008, the Southern AricanDevelopment Community released its Protocol onEnergy (SADC 2008), which introduced guidelines ornational energy-eciency eorts and encouraged mem-bers to dene achievable and quantiable reduction tar-gets in commercial and industrial energy intensity.
Designing standards
Closely related to energy-eciency goals and targetsare international standards. Standards, i properly
designed, can help in meeting targets.Many countries have used standards successully as part o regulatory eorts to make their industries moreenergy ecient. For goods and services heavily tradedinternationally, coordinating the design and appli-cation o standards with related norms is cost eec-tive. Stern (2006) points out that such internationalstandards – by dening a set o similar conditions
within larger markets – encourage innovation andcompetition among rms. Tey increase transparencyor consumers and producers as comparable inorma-tion is provided across borders. Tey reduce design and
production costs related to dierentiated compliance.And they help remove trade barriers by harmonizing test protocols or increasing their compatibility.
Standards and labelling schemes can drive envi-ronmental objectives and energy eciency. But theycan also create barriers to market access in devel-oped countries or small and developing country
producers, especially those that lack the technical ornancial capacity to comply. As major impedimentsto their economic development, the barriers coulddiscourage these producers rom engaging in inter-
national collective action. Multilateral dialogue andnegotiations, whenever possible, can ensure environ-mental protection while saeguarding market access(UNEP 2011).
One important venue or addressing these concernsis the International Organization or Standardization(ISO). A network o national standards institutesrom 160 countries, the ISO is the largest developerand publisher o international standards. o reacha consensus and ensure that its standards are widely
adhered to, the ISO oers public access to dras o standards and uses voting and appeals systems. AllISO standards are voluntary agreements, meaning that compliance depends on broad agreement.
For energy eiciency, the ISO ocuses on har-monizing terminology and calculation methods orenergy eciency, energy management standards, bio-uels standards, retrotting and reurbishing stand-ards, and standardized energy-eciency activities orbuildings. For instance, the ISO 50001 energy man-
agement standard establishes a ramework or indus-trial plants, commercial acilities and entire organiza-tions to manage energy more eciently. Tese types o standards help dene, implement and monitor energy-eciency policies at macro and micro levels. Tey alsobring innovative energy-eciency technologies to themarket aster. And they are objective metrics or regu-lations and policy incentives to encourage greater useo innovative technologies.
Monitoring and assessing progress
Eective targets require monitoring progress. Tis isalso true or standards, which risk becoming obsoletei they ail to keep up with technological progress andmore general energy-eciency trends. A challenge in

8/2/2019 Unido Full Report eBook
http://slidepdf.com/reader/full/unido-full-report-ebook 148/259
129
I NT E r NA T I ONA l C Ol l E C T I V E A C T I ONF Or I ND U S T r I A l E NE r GY E F F I C I E N C Y
7
“ To eep increases in industrial energy
consumption to the minimum required to satisy
development needs, uture eciency eorts must
be ambitious: they must double today’s pace
monitoring and assessing progress is that data avail-ability is oen limited in developing countries. Arst step in addressing this concern is initiating andharmonizing eorts to obtain energy-intensity data.Once data are collected, country energy perormancecan be assessed and explained, and cross-country com-
parisons made – to know where progress is consider-able and where it is not. Processes could then be set or
inorming countries on their progress and examining reasons or deviations, positive or negative.
Several international actors have begun monitor-ing progress in regional and global energy eciency:• he United Nations Environment Programme
(UNEP) engages in some target monitoring or industrial energy eiciency. For instance,in Eastern and Central Europe, the EnergyManagement and Perormance-Related EnergySavings Scheme has established energy service
companies, which set energy targets and moni-tor progress or industrial and commercial clients(UNEP 2004). Under the Cleaner ProductionFramework, UNEP, oen together with UNIDO,identies energy-eciency opportunities and car-ries out the associated improvements to reducegreenhouse gas emissions rom industrial enter-
prises in Asia and Eastern Europe (UNEP 2002b).• Te International Energy Agency (IEA), the most
prominent non-UN agency in the eld, works to
enhance policy implementation or energy e-ciency by analysing the potential in Organisationor Economic Co-operation and Development(OECD) countries, identiying and addressing emerging policy challenges and enhancing inter-national cooperation (IEA 2011).
• Te World Energy Council also monitors progresstowards energy-eciency targets. Its network o 94national committees represents more than 3,000member organizations – including governments,industries and expert institutions – with a missionto promote sustainable energy (WEC 2010).
• he International Partnership or EnergyEciency Cooperation also monitors and assessesenergy use activities through its Improving Policies
through Energy Eciency Indicators. It seeks todevelop and implement new methodologies toestablish indicators or measuring and reporting energy eciency and to critique and update meth-odologies that have shortcomings (IPEEC 2011)Several regional economic integration com-
munities also commit to monitoring and evaluat-ing energy-eiciency indicators and progress. he
Economic Community o West Arican StatesExecutive Secretariat reviews and acilitates theimplementation o energy-eciency provisions andsets energy-eciency reporting requirements or itsmember states. Te Southern Arican DevelopmentCommunity asks members to identiy and minimizeconstraints to energy eciency. And the Associationo Southeast Asian Nations has recently agreed toreview its 8 percent energy reduction target so it canconstruct plans to better meet the target and monitor
the region’s progress.
Moving orward
So, a start has been made in establishing internationalcollective action in setting energy-eciency goals andstandards and in measuring energy-eciency indi-cators to monitor progress towards meeting them(and perhaps readjusting them). But or industrialenergy eciency, much remains to be done. Even theAGECC has called only or a general energy-eciency
goal rather than one specically or industry. Givenindustry’s substantial contribution to global energyintensity, credible specic industrial energy-eciencytargets must be ormulated.
Since 1990, global industrial energy intensity hasallen at a cumulative 1.7 percent a year, with most o the gains achieved during the 1990s (see Chapter 1).But to keep increases in industrial energy consump-tion to the minimum required to satisy develop-ment needs, uture eciency eorts must be ambi-tious. Tey must double today’s pace and reach energyintensity reduction rates similar to those in the 1990s.Doubling the industrial energy-intensity reductionrate is consistent with a similar exhortation made atthe global level in the AGECC (2010) report.

8/2/2019 Unido Full Report eBook
http://slidepdf.com/reader/full/unido-full-report-ebook 149/259
130
I NT E r NA T I ONA l C Ol l E C T I V E A C T I ONF Or I ND U S T r I A l E NE r GY E F F I C I E N C Y
7
“ The IDR 2011 recommends an annual target
or industrial energy-intensity improvement o
3.4 percent, or 46 percent overall through 2030
Te IDR 2011 thus recommends an annual targetor industrial energy-intensity improvement o 3.4
percent, or 46 percent overall through 2030. O the134 countries or which data were available or 1990–2008, 98 are reducing energy intensity below thoserates or are even increasing energy intensity. Indeed, in35 countries energy intensity grew at an average cumu-lative rate o 3.1 percent over the period. Tere is con-
siderable scope or raising industrial energy eciencyin these countries, which stand to benet rom sucheorts. Only 33 countries are above the historical levelbut below the desired rate.
Countries that have already reached the targetshould seek a 50 percent reduction in energy intensitybeyond their 1990–2008 rate. During that period,these countries reduced their industrial energy inten-sity an average o 6.5 percent a year. It will be dicultto sustain such a rapid pace or an extended period,
so a more modest, though still substantial, eort maybe warranted. Ultimately, binding industrial energy-intensity targets must be set nationally, and regionaland international actors can introduce the goals andinternational standards.
Many actors, such as IEA and the Latin AmericanEnergy Organization, collect industrial energy-eciency country data and monitor progress. Andthough their expertise is important, an internationalmonitoring and coordination unction is needed to
reap the potential complementarities o disparateactors, limit duplication and eliminate oversight anddata gaps. Such a unction could be mandated to oneagency or several that could be responsible or inorm-ing countries and industries on their progress towardsindustrial energy-eciency goals.
Facilitating technological and
structural change
As Chapters 1 and 2 showed, energy-intensity reduc-tions arise rom technical and structural change
within and across industries – changes that resultrom technological improvements and domestic andinternational movements o capital. Te major drivero technological improvement is innovation, and while
innovation within irms and countries is consider-able, so is the room or international collective action.Tere is also scope or providing inormation and rais-ing awareness o the energy-intensity and energy-con-sumption implications o international and sectoralshis in investment patterns. Tat would allow devel-oping countries to plan or their uture energy demandand pay closer attention to the environmental implica-
tions o their economies’ structural changes. Tis willbe most important or low- and middle-income coun-tries, which need to address industrial energy eciencyupront in their industrialization processes.
International cooperation or innovation in
industrial energy eciency
International collective action helps address the inad-equate breadth and depth o knowledge, which areacute or new technologies. Breadth is the range o
knowledge required or innovation. A broad knowl-edge base involves amiliarity with several knowl-edge domains, allowing exploration o more areasand solutions (Zhang, Baden-Fuller and Mangenatin2007). Because industrial energy-eciency innova-tion involves contributions rom multiple suppliersand large users, breadth is particularly important (seeChapter 2). Depth is analytical sophistication in aspecic subject (Wang and von unzelmann 2000).Deep knowledge involves proound understanding
o causalities, complexities and relations. Breadth anddepth, always matters o degree, are thus pooled indierent proportions – but the harder the task, themore both are needed and the less they are availablelocally. Put simply, larger and more complex innova-tions require a larger and wider, gradually more inter-national and interacting, research community.
International cooperation on research and devel-opment (R&D) can support sharing knowledge,coordinating R&D priorities and pooling risk (Stern2006). Sharing knowledge helps link understanding o the issues with the individuals and teams involvedin research, thus accelerating innovation – or exam-
ple, by adopting a multilateral treaty that oers accessto basic science and technology or industrial energy
8/2/2019 Unido Full Report eBook
http://slidepdf.com/reader/full/unido-full-report-ebook 150/259
131
I NT E r NA T I ONA l C Ol l E C T I V E A C T I ONF Or I ND U S T r I A l E NE r GY E F F I C I E N C Y
7
“ International collective action can
help ensure that the global restructuring
o industry considers energy eciency
eciency. Coordinating R&D priorities is necessarybecause national R&D aims to develop technologiesor local demand, giving competitive and rst-moveradvantages to national economies and local rms.Tis might encourage countries to narrow their ocusto local industry – to avoid sharing knowledge thatmight be useul to other countries – and to developtechnologies dicult to imitate. None o that helps
identiy global solutions or creates the associated tech-nological and market scales. Risk and reward must be
pooled or major R&D investments because the scaleo some technologies to be developed is too large orany one country to take on.
Energy-eciency innovation and R&D are oen perceived as the domains o OECD countries. Butlarge developing countries have been contributing more, so involving their scientists and engineers canbenet everyone (Stern 2006). International coopera-
tion does not have to be strictly developed–developing country interactions. R&D cooperation in clean andenergy-eicient technologies is emerging betweendeveloping countries too. Brazil, India and SouthArica signed a scientic cooperation agreement in2010 or commercial use o solar energy (XinhuaNews Agency 2010). Large developing countries maybe especially well poised to adapt advanced technolo-gies to developing country skills, labour markets andnatural resource endowments.
Tere has been some international R&D coop-eration in such low-carbon technologies as renewablesand in the transer and diusion o clean energy tech-nologies. But ew international eorts ocus exclu-sively on R&D or industrial energy-eciency tech-nologies. Perhaps the only exception, which ocuses onthe ull range o energy technologies, is the IEA’s tech-nology cooperation programme, bringing togethermember and non-member countries in joint technol-ogy development projects. Te idea is to link energyR&D networks and to ensure that policy-makers andother stakeholders (in nance, business, research andso on) are part o the collaboration. By 2010, the IEAhad implemented 42 agreements and more than 1,000
projects in R&D or energy technologies (IEA 2010b).
International cooperation or structural
change
Industrial structures evolve rom change in the equip-ment, machinery and the buildings that house them.Output volumes and structures, input volumes andmixes and the resulting waste ows are driven by add-ing new capital and retiring old capital. Capital turno-
ver is critical in altering energy use across industries
(Davidsdottir 2005). But capital is also internationallymobile: as capital stock becomes obsolete or unprot-able, it is not necessarily replaced in the same place.Factories oen close down in one location and reopenin another, with newer vintages o technology ollowing changing business opportunities and emerging demand.
International collective action can help ensure thatthe global restructuring o industry considers energyeciency. An inormation clearinghouse and inor-mation exchanges can help countries and industries
identiy best available technologies and compare the perormances o technologies under varying condi-tions. International activities would showcase recentadvances and communicate and benchmark experi-ences or developing countries to extract lessons andmake inormed choices.
International coordination can also help deployindustrial energy-eiciency technologies and prac-tices, especially in collaboration with the private sec-tor. Lead multinational rms in global and local value
chains and production networks can speed the uptakeo industrial energy eciency in developing coun-tries. Trough their subsidiaries and buying power in
value chains, they can work with local suppliers (par-ticularly small and medium-size enterprises) to set upincentives and recognition programmes or pursu-ing energy management standards, transer technicalskills, prescribe new technologies and provide nanc-ing options. Te impact could be large.
IBM’s supply chain is among the world’s largest, with more than 30,000 suppliers across the globe. IBMaudits and checks its suppliers’ environmental peror-mance or compliance with its energy-eciency prin-ciples. It has also helped develop the electronic indus-try’s supply chain sustainability practices, codied by

8/2/2019 Unido Full Report eBook
http://slidepdf.com/reader/full/unido-full-report-ebook 151/259
132
I NT E r NA T I ONA l C Ol l E C T I V E A C T I ONF Or I ND U S T r I A l E NE r GY E F F I C I E N C Y
7
“ The ey mechanisms or industrial
energy-eciency technology transers
include international agreements,
multilateral and bilateral agreements, and
inormation exchange partnerships
the Electronics Industry Citizenship Coalition. Incollaboration with other companies, IBM developsand adheres to the Coalition’s Code o Conduct, o
which one concern is industrial energy eciency. Wal-Mart uses energy-sustainability indicators
when selecting its products and service providers. Ithas announced that by collaborating with suppliers it
would make its most energy-intensive products 25 per-
cent more energy ecient in three years. It also hasdeclared that it will reduce its supply chain’s greenhousegas emissions by 20 million tonnes o carbon dioxideequivalent. Outside the United States, Wal-Mart’s goalsor improving the energy eciency o its internationalsupply chain through manuacturing extension part-nerships have been less ambitious. In 2008, it declaredthe goal o helping its top 200 Chinese suppliers become20 percent more energy ecient by 2012. And starting
January 2009, it required Chinese suppliers to con-
orm to Chinese environmental laws, previously oenignored. In addition, Wal-Mart’s audits o its Chinesesuppliers began to ocus more on environmental cri-teria, including greenhouse gas emissions. Wal-Martis introducing similar requirements or its suppliers inother countries in 2011 (Wal-Mart 2008, 2010).
International collective action can organize andreplicate these experiences across countries and indus-tries, raising awareness o their potential. It can address
possible concerns o local rms and governments. It
can expand and adapt programmes to dierent sec-tors and countries. It can replicate programmes incountries where lead multinationals are absent, iden-tiying actors to ll these roles. It can build capacity –
preparing teaching materials, organizing training andacilitating the necessary expertise. And it can involveother multinational corporations in improving indus-trial energy eciency through their value chains whileensuring that they ollow corporate social responsibil-ity principles transparently.
Contributing to international
technology transers
echnology transers are critical or enhanced indus-trial energy eciency and in the global response to
the challenges o climate change. Industrial energy-eciency technologies need to be transerred to devel-oping countries, where energy use is growing asterand innovation is generally slower. Many o thesecountries lag in their capacity to obtain, develop anddeploy innovative climate change and energy-ecienttechnologies (UNIDO 2010b). Adopting industrialenergy-eciency technologies is sometimes hampered
by countries’ lack o access to international best avail-able technologies, because o lack o inormation ortoo small an investment.
For a host country, technology transers in indus-trial energy eciency require acquiring internationallicences, investing in modern equipment, acilitating local spillovers and promoting learning among indus-trial rms. Source countries can increase technical andnancial assistance to improve developing countries’ability to acquire and absorb oreign technologies.
Source countries can also disseminate technologicalknowledge and standards, help solve problems andestablish grants or conducting industrial energy-eciency analyses in developed and developing coun-tries. International collective action could provide aorum or negotiating rules or international technol-ogy transers between source and host countries.
he key mechanisms or industrial energy-eciency technology transers include internationalagreements, multilateral and bilateral agreements
providing ocial development assistance, and inor-mation exchange partnerships. ransers throughthese mechanisms ocus on sharing knowledge andcoordination; R&D, capacity-building and awareness
programmes; hardware, such as machinery and equip-ment; and aid nancing .
International environmental treaties
International environmental treaties generally have acomplex, multidisciplinary and integrated set o solu-tions involving the environment, society, the economy,technology and nance – together with goals and tar-gets and a plan and process to achieve them. Given therole o energy eciency in addressing the challengeso climate change, industrial energy eciency–related

8/2/2019 Unido Full Report eBook
http://slidepdf.com/reader/full/unido-full-report-ebook 152/259
133
I NT E r NA T I ONA l C Ol l E C T I V E A C T I ONF Or I ND U S T r I A l E NE r GY E F F I C I E N C Y
7
“ The Clean Development Mechanism has been
useul or technology transers to developing
countries, allowing them to leverage investment
or acquiring advanced environmentally riendly
and energy-ecient industrial technologies
technology transer arrangements have tended to arisein the context o existing international agreements orcooperation on climate change.
Chapter 34 o Agenda 21 o the United NationsConerence on Environment and Development,adopted in Rio de Janeiro in 1992, outlined an inter-national agreement pertaining to the “transer o environmentally sound technology, cooperation, and
capacity-building.” Its objectives included acilitat-ing access to technological inormation, promoting and nancing appropriate technologies, supporting endogenous capacity-building and promoting long-term technological partnerships (IPCC 1996, 2000).National, regional and international inormationnetworks, collaborative networks o research centres,assessments o relevant technologies, and collabora-tive arrangements and partnerships are just a ew o the activities the agreement proposed to achieve these
ends.Te international environmental protocols, partic-
ularly the Kyoto Protocol, go urther – providing toolsor easing technology transers or emission abatement.he Kyoto Protocol created mechanisms to allowdeveloped countries to use credits rom investmentsin emission reductions in other developed countries,through joint implementation, or in developing coun-tries, through the Clean Development Mechanism(CDM), to oset their own emission reduction com-
mitments (Gupta, irpak and Burger 2007). CDM projects involve all three elements o technology trans-er (so, hard and nancing) and have the advantageo substantial local private or public participation, asthe projects require domestic co-nancing.
Te CDM has been useul or technology trans-ers to developing countries, allowing them to leverageinvestment or acquiring advanced environmentallyriendly and energy-ecient industrial technologiesthat they otherwise would not have available. Tetransers seem, however, to have been limited to airlyestablished technologies, to a ew industrial gas pro-
jects in large enterprises in a ew advanced develop-ing countries (Barías et al. 2005; Gupta, irpak andBurger 2007; Stern 2006).
Multilateral and bilateral agreements
including energy-eciency provisions
Multilateral and bilateral agreements or indus-trial energy-eiciency technology transers can
precede or ollow international treaties. Generally,they ensure that parties are abiding by pacts, thatthere is continuity in activities and that action iscoordinated, particularly where there is no legally
binding commitment. Multilateral organizations, with well established organizational practices and procedures and substantial resources, can supportlarge projects. Bilateral agreements can react quicklyto changing circumstances (Ohshita, Wiel andHeggelund 2006).
Among the most important multilateral organi-zations in transerring energy-ecient technology isthe Global Environment Facility (GEF). A unding mechanism, the GEF seeks new opportunities or
technology transers. In 2008, it started the PoznanStrategic Program to scale up investments in technol-ogy transers and to help developing countries acquireclean, energy-ecient technologies. Te programmeconducts technology needs assessments, demonstratesnew technologies, pilots technology projects anddisseminates GEF experience worldwide. Te GEFis involved with several successes as a acilitator o energy-ecient technology transers (Box 7.2).
Other multilateral and bilateral technology trans-
er programmes include:• he UNIDO and UNEP National Cleaner
Production Centres, which promote cleaner pro-duction and energy-eiciency technologies indeveloping country industry through in-plantdemonstrations, training, inormation dissemina-tion and policy advice (Box 7.3).
• Te US Agency or International Development’sEnergy Eiciency and Renewable Energy pro-gramme, which in 2010 launched an Increasing Energy Eciency programme ocused on develop-ing countries.
• he European Commission’s Global EnergyEiciency and Renewable Energy Fund, estab-lished as a public-private partnership aimed at

8/2/2019 Unido Full Report eBook
http://slidepdf.com/reader/full/unido-full-report-ebook 153/259
134
I NT E r NA T I ONA l C Ol l E C T I V E A C T I ONF Or I ND U S T r I A l E NE r GY E F F I C I E N C Y
7
leveraging public unds or technology transer todeveloping countries and economies in transition.
• Japan’s Ministry o Economy, rade and IndustryGreen Aid Plan, which promotes the introductionand dissemination o cleaner energy technologies
in the industrial sectors o Asian developing coun-tries, targeting energy-ecient technologies andclean coal technologies.he technology transers under multilateral
and bilateral agreements have helped reduce energy
“ Technology transers under multilateral
and bilateral agreements have helped reduce
energy intensity, but challenges remain
TeGobaEnvionmentFaciity(GEF)asdeveopedan
enegy-efciencypogammefoTunisia’sindustiasecto,
fosteingasustainabeindustiaenegy-efciencymaket.
Tepogammeasappovedanaveageof60 pojects
ayea,assavedneay40,000tonnesofoiequivaentin
enegysince2005andasestabisedsixfuyopeationa
enegysevicecompanies.Anditasexceededitstagets:
teesutant$150miioninvestmentinenegyefciencyissixtimesteinitiagoa($25miion),educingcabon
dioxideemissionsby130,000tonnesayea.
InAmenia,teGEFasauncedadisticteating
pojecttoeducegeenousegasemissionsfomeat
andotwatesuppies.Tepojectaimstostengten
tecoectiveoganizationandmanagementofeatand
otwateinbuidings,estuctueandbuidtecapacity
ofdistictcompaniestoimpoveteienegyefciency,
suppotnewdecentaizedsevicepovidestopomote
teuseofatenativeenegy-efciencytecnoogies,and
takestockofessonsfomteseactivitiestoadvancete
sustainabedeveopmentofeatandotwatesevices
inAmenia.Atangibeoutcomeoftepojectasbeen
egisationdeaingwitpefeentiacogeneationfeed-in
taiffs,inceasingpivatesectointeestinpoweandeat
suppypojects.
InCentaAmeica,teGEFasintoducedapo-
gammeoneecticaenegyefciencyinteindustiaand commecia sectos. Te goas incude emoving
baiestoimpementingenegy-efciencymeasuesby
estabisingaeguatoybasefomakettansfomation,
deveopingcapacitiestoimpementenegyefciencyin
sma and medium-size entepises, stengtening te
tecnicaknowedgeofstakeodesanddisseminating
essonsandoteinfomation.Tepojectaseped
tiggeenegy-efciencymaketsinteegionbyendos-
ingenegy-efciencystandadsandabesandpomoting
enegy-efcientequipmentimpots.
Source: GEF 2010.
Box 7.2
The Global Environment Facility’s technology transer projects in selected countries
FoowingteUnitedNationsConfeenceonEnvionment
andDeveopmentatrioin1992,UNIDOandteUnited
NationsEnvionment Pogamme(UNEP)aunced te
NationaCeanePoductionCentes.Tecentesweeset
uptodeivesevicestobusiness,govenmentandote
stakeodesandtoassisttemwitadoptingceane
poductionmetods,pactices,poiciesandtecnoogies.
UNIDOandUNEPincopoatedteessonsfomtecen-
tesinteijointresouceEfcientandCeanePoduc-
tionpogamme,wicsuppotsdecoupingeconomic
deveopmentfomfuteenvionmentadegadationand
esoucedepetion.Tepogammeaimstoimpovete
esoucepoductivityandenvionmentapefomanceof
businessesandoteoganizationsindeveopingcoun-
ties.Tecentespomoteandfaciitateindustiaenegy
efciencyintandemwitpoutionpevention,wateand
mateiaseduction,andenvionmentaysoundandsafe
managementofcemicasandteiwaste.Teenow
aeCeanePoductionCentesosimiapogammesin
neay50 counties.
In2007,anindependentevauationteamfoundtat
tepogammeadbeenigyeffectiveandsustainabe,
puttingceanepoductiononbusinessandgovenment
agendas,tainingpofessionaceanepoductionaudi-
tos,impementingow-andintemediate-costtecnoogy
optionsinassistedcompaniesandtansfeingtecnoogy
andcangingpoicyinseveacounties.Tepogamme
asimpovedbusinesses’esoucepoductivityandenvi-
onmentapefomance.Anditastepotentiatoeduce
enegyandpoutionintensitypeunitofoutputindeve-
opingcountyindusties–educingecoogicafootpints
andimpovingpoductivityandcompetitiveness.
Source: UNIDO 2010d.
Box 7.3
National Cleaner Production Centres

8/2/2019 Unido Full Report eBook
http://slidepdf.com/reader/full/unido-full-report-ebook 154/259
135
I NT E r NA T I ONA l C Ol l E C T I V E A C T I ONF Or I ND U S T r I A l E NE r GY E F F I C I E N C Y
7
“ International independent inormation
networs share inormation, exchange experts,
build capacity, provide technical assistance
and give advice and solve problems related
to specic technologies and processes
intensity, but challenges remain. Stern (2006) con-tends that multilateral organizations such as theGEF would have to scale up urther to deploy moreadvanced technologies eectively, but this wouldrequire signicant institutional changes. Ohshita,
Wiel and Heggelund (2006) argue that bilateraltechnology transers are shaped by the relationsbetween the countries involved, while multilateral
transers need to become aster and more exible.Ohshita (2006) maintains that some bilateral andmultilateral technology transer programmes inAsia have not been sustainable because o donors
pushing technologies into countries beore localconditions were conducive, limited assessment o recipients’ needs and preerences, emphasis on hard
programmes over so ones, oreign technology sup- plier concern about weak intellectual property pro-tection, and ambiguous recipient-country technical
specications.
Inormation exchange partnerships
An emerging orm o international technology trans-er, sometimes part o multilateral agreements andsometimes arising rom personal and institutionalinteractions, is the international independent inor-mation network. Organizations or individuals acquireknowledge by creating networks across countries andorganizations, including governments, industries,
nancial institutions, research institutions and non- prot organizations (Ohshita, Wiel and Heggelund2006). Networks share inormation, exchange experts,build capacity, provide technical assistance and giveadvice and solve problems related to specic tech-nologies and processes.1 Independent networks canalso interact with bilateral, multilateral and regionalorganizations to build on each other’s strengths, workaround political sensitivities (since they are not repre-senting governments), use dedicated experts who havemore exibility than those in government institutions,operate with relatively small budgets and thus accom-
plish more (Ohshita 2006).he United Nations Framework Convention
on Climate Change and the GEF have established
international partnerships among their constituenciesand stakeholders. Other international networks include:• he International Partnership or Energy
Eiciency Cooperation, ormed in 2008 as aninternational orum o developed and developing countries, which aims to promote global coopera-tion in industrial energy eciency and to estab-lish policies or meeting global energy-eciency
challenges.2
• Te Asia-Pacic Partnership on Clean Develop-ment and Climate, which creates a voluntary,non–legally binding ramework or cooperation todevelop and transer cost-eective energy-ecienttechnologies, promotes an enabling environ-ment to assist technology transers and acilitatesnational pollution reduction, energy security andclimate change objectives.
• he Collaborative Labelling and Appliance
Standards Program, ounded in 1999, whichbrought together the Lawrence Berkeley NationalLaboratory, the Alliance to Save Energy and theInternational Institute or Energy Conservation.It has evolved into a global network o standardsand labelling experts, an inormation clearing-house and an aid to donor organizations.
Procuring international nancing
Multilateral and bilateral nancing help get develop-
ing country projects in industrial energy eciency o the ground and leverage private unds, which consti-tute the bulk o nancing or private industrial projects(Hansen, Langlois and Bertoldi 2009). Multilateraland ocial nancing, direct or through implement-ing agencies or local nancial institutions, also usually
provides technical assistance in nancial evaluation toassess industrial energy-eciency projects more accu-rately and without bias (UNIDO 2011).
Te World Bank and other multilateral develop-ment banks are oen commissioned to become trusteeso unds set up or environmental and sustainable devel-opment issues, energy eciency and industrial energyeciency among them. Te banks manage, adminis-ter and disburse unds or industrial energy-eciency
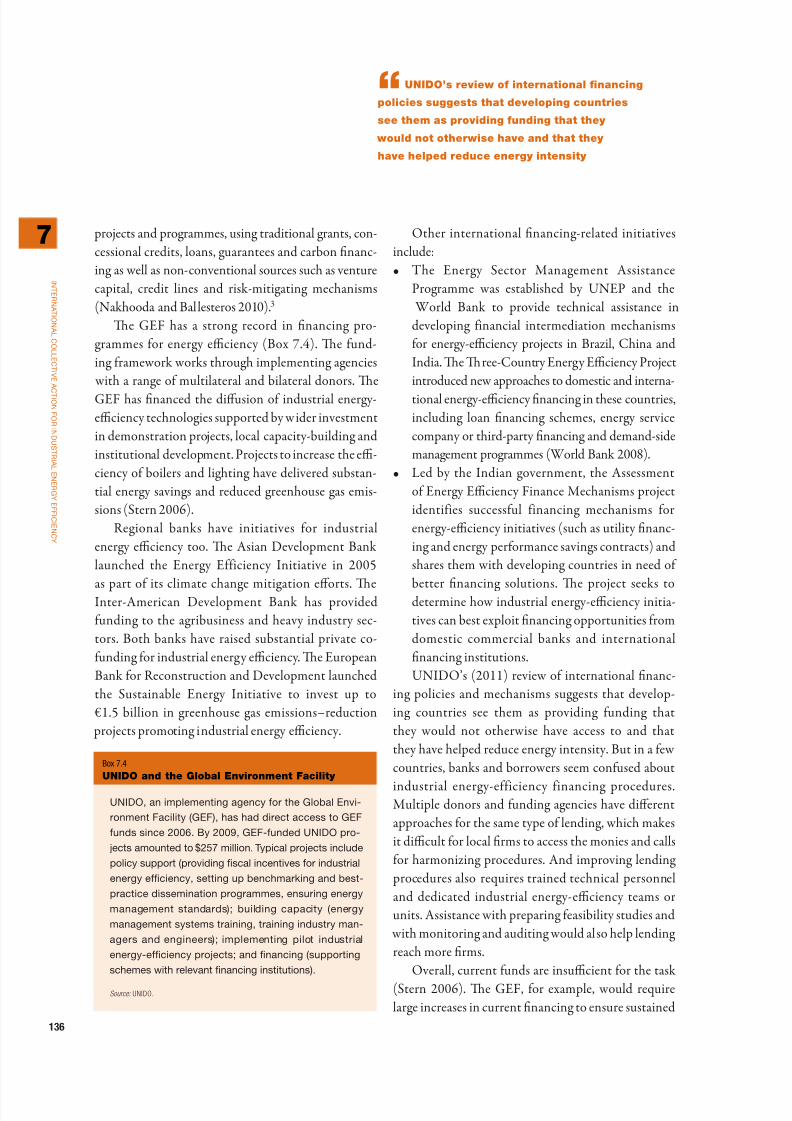
8/2/2019 Unido Full Report eBook
http://slidepdf.com/reader/full/unido-full-report-ebook 155/259
136
I NT E r NA T I ONA l C Ol l E C T I V E A C T I ONF Or I ND U S T r I A l E NE r GY E F F I C I E N C Y
7
“ UNIDO’s review o international nancing
policies suggests that developing countries
see them as providing unding that they
would not otherwise have and that they
have helped reduce energy intensity
projects and programmes, using traditional grants, con-cessional credits, loans, guarantees and carbon nanc-ing as well as non-conventional sources such as venturecapital, credit lines and risk-mitigating mechanisms(Nakhooda and Ballesteros 2010).3
Te GEF has a strong record in nancing pro-grammes or energy eciency (Box 7.4). Te und-ing ramework works through implementing agencies
with a range o multilateral and bilateral donors. TeGEF has nanced the diusion o industrial energy-eciency technologies supported by wider investmentin demonstration projects, local capacity-building andinstitutional development. Projects to increase the e-ciency o boilers and lighting have delivered substan-tial energy savings and reduced greenhouse gas emis-sions (Stern 2006).
Regional banks have initiatives or industrialenergy eciency too. Te Asian Development Bank
launched the Energy Eiciency Initiative in 2005as part o its climate change mitigation eorts. TeInter-American Development Bank has providedunding to the agribusiness and heavy industry sec-tors. Both banks have raised substantial private co-unding or industrial energy eciency. Te EuropeanBank or Reconstruction and Development launchedthe Sustainable Energy Initiative to invest up to€1.5 billion in greenhouse gas emissions–reduction
projects promoting industrial energy eciency.
Other international nancing-related initiativesinclude:• he Energy Sector Management Assistance
Programme was established by UNEP and the World Bank to provide technical assistance indeveloping inancial intermediation mechanismsor energy-eciency projects in Brazil, China andIndia. Te Tree-Country Energy Eciency Project
introduced new approaches to domestic and interna-tional energy-eciency nancing in these countries,including loan nancing schemes, energy servicecompany or third-party nancing and demand-sidemanagement programmes (World Bank 2008).
• Led by the Indian government, the Assessmento Energy Eciency Finance Mechanisms projectidentiies successul inancing mechanisms orenergy-eciency initiatives (such as utility nanc-ing and energy perormance savings contracts) and
shares them with developing countries in need o better nancing solutions. Te project seeks todetermine how industrial energy-eciency initia-tives can best exploit nancing opportunities romdomestic commercial banks and internationalnancing institutions.UNIDO’s (2011) review o international nanc-
ing policies and mechanisms suggests that develop-ing countries see them as providing unding thatthey would not otherwise have access to and that
they have helped reduce energy intensity. But in a ewcountries, banks and borrowers seem conused aboutindustrial energy-eiciency inancing procedures.Multiple donors and unding agencies have dierentapproaches or the same type o lending, which makesit dicult or local rms to access the monies and callsor harmonizing procedures. And improving lending
procedures also requires trained technical personneland dedicated industrial energy-eciency teams orunits. Assistance with preparing easibility studies and
with monitoring and auditing would also help lending reach more rms.
Overall, current unds are insucient or the task(Stern 2006). Te GEF, or example, would requirelarge increases in current nancing to ensure sustained
UNIDO,animpementingagencyfoteGobaEnvi-
onmentFaciity(GEF),asaddiectaccesstoGEF
fundssince2006.By2009,GEF-fundedUNIDOpo-
jectsamountedto$257miion.Typicapojectsincude
poicysuppot(povidingscaincentivesfoindustia
enegyefciency,settingupbencmakingandbest-
pacticedisseminationpogammes,ensuingenegy
management standads); buiding capacity (enegy
managementsystemstaining,tainingindustyman-
ages andenginees);impementing piot industiaenegy-efciencypojects;andnancing(suppoting
scemeswiteevantnancinginstitutions).
Source: UNIDO.
Box 7.4
UNIDO and the Global Environment Facility

8/2/2019 Unido Full Report eBook
http://slidepdf.com/reader/full/unido-full-report-ebook 156/259
137
I NT E r NA T I ONA l C Ol l E C T I V E A C T I ONF Or I ND U S T r I A l E NE r GY E F F I C I E N C Y
7
“ Investing in industrial energy eciency
provides more win-win opportunities and
potentially more scope or building consensus
than does investing in emerging non-carbon
energy or other technological alternatives
market penetration o energy-ecient technologiesover the next 10 years. “Whether it is through GEFor other institutional mechanisms, an expansion inthe scale o unding is required i the deployment o low-carbon technologies is to be supported, and strong legal and regulatory environments and local partner-ships are important in determining success” (Stern2006, p. 13).
Establishing an international
monitoring and coordinating unction
or industrial energy eciency
International collective action and national policiesor industrial energy eciency are two sides o thesame coin. National eorts can be legitimized interna-tionally, while international agreements will succeedonly i implemented wholeheartedly by national gov-ernments and local stakeholders. Complementarities
are exploited to their ullest when international andnational actors collaborate and when countries canbenchmark themselves against others using inter-nationally harmonized rules, targets, standards and
practices. But achieving synergies and internalizing externalities are complex tasks that require bringing national and international interests and objectivesinto a common understanding o the public good.
Establishing an international monitoring andcoordinating unction or industrial energy ei-
ciency would be an important step in that direction.Manuacturing is specialized and requires uniqueexpertise and knowledge. A ast-growing economicactivity, particularly in developing countries, it hasgreat potential to reap energy-eciency gains andreduce greenhouse gas emissions. And investing inindustrial energy eciency provides, at least or now,more win-win opportunities and potentially morescope or building consensus than does investing inemerging non-carbon energy or other technologicalalternatives. Industrial energy eciency may not beexciting in the ght against climate change, but it canbe eective. Yet, only a ew ragmented internationalinitiatives are knocking over the barriers to industrialenergy eciency.
Successes and ailures in international collectiveaction can inorm the design and implementation o an international monitoring and coordinating unc-tion or industrial energy eciency. o be eective,the unction must be ocused, agile, lexible, wellinormed and able to work closely with governmentsand the international private sector, including theirrepresentative associations. Cooperating with multi-
national corporations and international small andmedium-size enterprises, including those rom devel-oping countries, will be critical. Cooperation couldinclude generating data and comparable metrics,achieving energy-eciency targets, enorcing indus-trial energy-eciency targets and standards throughinternational value chains, conducting joint R&D,building capacity, disseminating industrial energy-eciency technologies and acilitating access to inter-national nance. Cooperation would have to take
place under the highest canons o ethics and corpo-rate social responsibility to be credible, legitimate andeective.
An international industrial energy eciency mon-itoring and coordination unction can be envisaged ashaving ve major roles:• Providing leadership and technical support in set-
ting up and monitoring international targets and standards. Tis would involve working not onlyon the scientic basis o targets and monitoring
criteria but also with governments and the privatesector to ensure that targets and standards are real-istic and achievable.
• Supporting data collection and benchmarking.Energy data are available mainly in developedcountries, and even in these countries they arenot as detailed as needed or proper industrialenergy-eiciency analysis and policy design.Benchmarking is required as much at the technol-ogy and process levels as at the policy level. Telong distance to best practice is a major incentiveor governments and rms to do better.
• Disseminating inormation. Freely available data-bases providing comparable technical and eco-nomic inormation – and speciying where and

8/2/2019 Unido Full Report eBook
http://slidepdf.com/reader/full/unido-full-report-ebook 157/259
138
I NT E r NA T I ONA l C Ol l E C T I V E A C T I ONF Or I ND U S T r I A l E NE r GY E F F I C I E N C Y
7 how to nd the desired technologies – would goar in addressing inormation gaps in the develop-ing world. Inormation and knowledge exchangenetworks would suggest what to eed into thosedatabases and advise governments and rms on
possibilities or industrial energy eciency.• Coordinating regulation, targets, standards,
R&D, technology transers and value chain opera-
tions internationally.• Devising innovative mechanisms to address the
challenges o industrial energy-eciency nancenationally and internationally.
Notes
1. Ohshita (2006) argues that knowledge net- works are not only technical but also increasingly
operating in policy-making. Policy developmentcooperation is perceived as an eective use o lim-ited unds in that, by promoting policy action, itcan achieve widespread investments in energy e-ciency and large energy-eciency improvements
with a airly small investment o public unds.2. Te orum includes Australia, Brazil, Canada,
China, the European Union, France, Germany,
India, Italy, the Republic o Korea, Mexico, theRussian Federation, the United Kingdom and theUnited States.
3. Te World Bank Group International FinanceCorporation’s Cleantech Investment Programme
provides venture capital and private equity nanceor innovative energy-eciency company projectsin developing countries.

8/2/2019 Unido Full Report eBook
http://slidepdf.com/reader/full/unido-full-report-ebook 158/259
139
Part BTrends in
manuacturing
and
manuacturedexports, and
benchmaring
industrial
perormance

8/2/2019 Unido Full Report eBook
http://slidepdf.com/reader/full/unido-full-report-ebook 159/259

8/2/2019 Unido Full Report eBook
http://slidepdf.com/reader/full/unido-full-report-ebook 160/259
141
Global manuacturing production is shiing gradu-ally rom developed countries to developing coun-tries, as rms move to benet rom cheaper labour,quality inrastructure, lower social costs and largemarkets in countries like China and India. hese
changes reect greater integration o national econo-mies through trade liberalization, wider availabilityo nancial resources and increased ows o oreigndirect investment. World manuacturing value added(MVA) peaked at $7,390 billion in 2010 (18.2 per-cent o global GDP) aer a sharp drop in 2009 during the global economic and nancial crisis (Figure 8.1).1
MVA’s share in GDP declined rom 17.7 percent in1990 to 16.6 percent in 2010 in developed countriesand rose rom 18.4 percent to 21.5 percent in develop-
ing countries.Globalization o production opens doors or
developing countries, but it also comes with threats.It has made developing countries more vulnerable toglobal shocks, such as the 2008 nancial crisis thatspread rom the United States and resulted in steepdeclines in global employment, demand and trade.Global manuacturing production ell 4.1 percentin 2009, reacting to reduced consumer spending andbusiness investment and primarily aecting devel-
oped countries, but developing countries have alsonot been immune.Tis chapter analyses long-term trends in global
MVA, the eects o the global crisis on manuactur-ing activity and changes in the structure o globalmanuacturing employment. Te ocus is on develop-ing countries.
Manuacturing in developing countries
Over 1990–2010, global MVA grew 2.8 percent annu-ally, rom $4,290 billion to $7,390 bill ion (able 8.1).Developed countries recorded 1.7 percent MVAgrowth but 2 percent GDP growth, highlighting their waning reliance on manuacturing as a sourceo growth and the increased role o services such as
nance, insurance and real estate. In contrast, themanuacturing sector in developing countries hasbeen buoyant, with a remarkable 5.6 percent annualgrowth rate in MVA over 1990–2010, slightly higherthan the 4.8 percent GDP growth rate.
In 1990, developing countries were producing about 20 percent o world GDP (Figure 8.2). By2010, this share had risen to 30 percent. Tis “riseo the rest” may be the dening economic trend o this century (Amsden 2001). Global manuacturing has been shiing rom developed to developing econ-omies even aster, with economies such as China,India and aiwan Province o China building strong manuacturing sectors. In 1990, developed coun-tries accounted or 79.3 percent o global MVA (see
able 8.1). Teir share ell 0.4 percent annually to76.1 percent in 2000 and then 1.2 percent annuallyto 71.6 percent in 2005. Since 2005, the decline intheir share has accelerated to 2.1 percent annually,
Chapter 8
Trends in manuacturing –
beore and ater the globalnancial and economic crisis
20102005200019951990
M a n u f a c t u r i n g v a l u e a d d e d ( 2 0 0 0 U S $ b i l l i o n s )
Developed countries
Developing countries
0
2,000
4,000
6,000
8,000
Figure 8.1
Manuacturing value added, 1990–2010
Manuacturing value added is shiting rom developed to developing
countries
Source: UNIDO 2010g.

8/2/2019 Unido Full Report eBook
http://slidepdf.com/reader/full/unido-full-report-ebook 161/259
142
T r E ND S I NMA N UF A C T Ur I
N G–B E F Or E A ND A F T E r T hE Gl OB A l F I NA N C I A l A ND
E C ON OMI C C r I S I S
8
“ The manuacturing sector in developing
countries has been buoyant, with a
remarable 5.6 percent annual growth rate
in MVA over 1990–2010, slightly higher
than the 4.8 percent GDP growth rate
alling to 64.4 percent in 2010. Te nancial crisis
exacerbated the MVA decline in developed coun-tries, which lost 3.7 percent o MVA share to devel-oping countries in 2009 – the biggest one-year loss inalmost two decades – but MVA continued to grow indeveloping countries.
Tere are sharp variations in manuacturing per-ormance among developing economies and regions.China, India and aiwan Province o China lead thelist, recording the largest surge in their global MVAshares. China increased its share rom 6.7 percent in2000 to 15.4 percent in 2010, becoming the secondlargest manuacturer aer the United States. India,
with an economy ocused more on services, has alsoared well – moving rom 14th place to 9th – with aglobal MVA share o 1.8 percent in 2010.
Accounting or more than hal o developing coun-
try MVA, East Asia and the Pacic remains the largestmanuacturing region by ar, with an MVA o $1,540billion in 2010.2 Almost 75 percent o the region’s pro-duction originates in China. Next are Latin Americaand the Caribbean ($423 billion) and the MiddleEast and North Arica ($229 billion). Sub-SaharanArica’s MVA remains the smallest, at $54 billion in2010, accounting or less than 1 percent o develop-ing country MVA. All developing regions saw theirglobal MVA share increase over 2000–2010, exceptLatin America and the Caribbean, where it declined,and sub-Saharan Arica, where it stagnated. Te leastdeveloped countries, led by Bangladesh, Cambodiaand Myanmar, have consistently gained share in globalMVA since 1995.
Group
Manuacturing valueadded (2000 US$ billions)
Share o manuacturingvalue added (percent)
1990 2000 2010 1990 2000 2010
World 4,290 5,770 7,390 100 100 100
Developed economies 3,400 4,390 4,760 79.3 76.1 64.4
Developing economies 888 1,380 2,630 20.7 23.9 35.6
Region
East Asia and the Pacic 270 639 1,540 6.3 11.1 20.9
Excluding China 154 254 406 3.6 4.4 5.5
Europe 159 111 169 3.7 1.9 2.3
Excluding the Russian Federation 60 60 105 1.4 1.0 1.4
Latin America and the Caribbean 260 339 423 6.1 5.9 5.7
Excluding Brazil 176 243 294 4.1 4.2 4.0
Middle East and North Arica 99 147 229 2.3 2.6 3.1
Excluding Turkey 64 94 150 1.5 1.6 2.0
South and Central Asia 66 104 210 1.5 1.8 2.8
Excluding India 28 39 79 0.7 0.7 1.1
Sub-Saharan Arica 34 40 54 0.8 0.7 0.7
Excluding South Arica 14 17 26 0.3 0.3 0.3Income
High income 123 175 270 2.9 3.0 3.7
Upper middle income 464 540 717 10.8 9.4 9.7
Lower middle income 279 637 1,590 6.5 11.1 21.5
Low income 22 28 56 0.5 0.5 0.8
Least developed countries 12 17 34 0.3 0.3 0.5
Source: UNIDO 2010g.
Table 8.1
Level and share o world manuacturing value added, by region and income group, 1990, 2000 and 2010

8/2/2019 Unido Full Report eBook
http://slidepdf.com/reader/full/unido-full-report-ebook 162/259
143
T r E ND S I NMA N UF A C T Ur I
N G–B E F Or E A ND A F T E r T hE Gl OB A l F I NA N C I A l A ND
E C ON OMI C C r I S I S
8
“ Most o the largest developing economy
manuacturers saw their share in developing
economy MVA all between 2000 and 2010
Largest developing economy manuacturers
Manuacturing in developing economies is highlyconcentrated, with the 15 leading economies account-ing or 83 percent o total production in 2010, up
rom 73.2 percent in 1990. Te increase is attributablemainly to China, which has emerged as a actory tothe world – more than tripling its share o develop-ing countries’ M VA over 1990–2010, to 43.3 percent(Figure 8.3). China also enjoyed aster average growtho MVA than other large developing economy manu-acturers during that period.
Most o the largest developing economy
manuacturers – except China and India – saw theirshare in developing economy MVA all between 2000and 2010. Brazil lost 2.1 percentage points and Mexico3.8. India overtook Mexico and Brazil to become thesecond leading manuacturer among developing econ-omies. Having experienced less o a decline in marketshare, aiwan Province o China remained the ourthlargest manuacturer among developing economies.
Manuacturing value added by
technological category Both developed and developing economies increasedtheir share o medium- and high-technology productsover 1995–2009, with the global share o these productsrising rom 41.3 percent to 55.8 percent (able 8.2).3
Regionally, East Asia and the Pacic had 46 per-cent o its manuacturing production in medium- and
0
20
25
30
35
40
20102005200019951990
P e r c e n t
Manufacturing value added
GDP
Figure 8.2
Developing economies’ share in worldmanuacturing value added and GDP, 1990–2010
Developing economies’ share in world manuacturing value added rose
rom 20 percent in 1990 to 30 percent in 2010
Source: UNIDO 2010g.
1990 2000 2010
China
13.0%China
27.9%
China
43.3%
Others
53.4%
Others
47.1%
Others
38.1%
Brazil
9.4% Brazil
7.0%
Brazil
4.9%
Mexico
7.8%Mexico
7.8%
Mexico
4.0%Taiwan Province
of China
5.2%
Taiwan Province
of China
5.5%
Taiwan
Province
of China
4.8%
India
4.8%
India
5.0%
Russian
Federation
11.1%
Figure 8.3
Share o large manuacturers in developing economy manuacturing value added, 1990, 2000 and 2010
China’s share o developing economy value added has nearly tripled since 1990
Source: UNIDO 2010g.

8/2/2019 Unido Full Report eBook
http://slidepdf.com/reader/full/unido-full-report-ebook 163/259
144
T r E ND S I NMA N UF A C T Ur I
N G–B E F Or E A ND A F T E r T hE Gl OB A l F I NA N C I A l A ND
E C ON OMI C C r I S I S
8
“ Both developed and developing economies
increased their share o medium- and
high-technology products over 1995–2009,
with the global share o these products
rising rom 41.3 percent to 55.8 percent
high-technology activities in 2009, slightly less thanthat o South and Central Asia, at 47.3 percent. Sub-Saharan Arica has the highest share o low-technologyand medium-low technology activities in manuactur-ing, consistently at 75 percent over 1995–2009. WhenSouth Arica is excluded, the share o low-technologyand medium-low technology activities rises to about85 percent.
With globalization, developing economies – particularly in East Asia – have become more inte-grated into global value chains and production net-
works, with accelerated technology transer and bettermarket access. Having started with low-end, low value-added products, economies such as China, Malaysia
and aiwan Province o China have diversied theirmanuacturing production with more technologicallyadvanced products. Tey also engage in more produc-tion activities – rom design to manuacturing, distri-bution and marketing – and invest heavily in educa-tion, research and development, and inrastructure tocatch up with developed countries.
he share o medium- and high-technology
activities in manuacturing in least developed coun-tries ell rom 19.6 percent in 1995 to 16.7 percentin 2009. Although these countries are at the initialstage o industrialization, they need to maintain anddevelop manuacturing capacity in more technologi-cally advanced products, which are more conducive to
Group1995 2000 2005 2009
LT MLT MHT LT MLT MHT LT MLT MHT LT MLT MHT
World 34.5 24.2 41.3 29.2 21.4 49.4 26.0 20.9 53.1 24.2 20.0 55.8
Developed economies 33.3 22.8 43.9 27.2 19.6 53.2 23.3 17.7 59.0 20.7 15.8 63.6
Developing economies 38.3 28.6 33.1 35.6 27.4 37.1 32.0 28.2 39.8 30.1 26.9 43.0
Region
East Asia and the Pacic 35.2 27.8 37.0 32.3 25.5 42.2 29.1 27.6 43.3 27.7 26.2 46.0
Excluding China 39.3 24.9 3 5.8 3 3.7 25.2 41.2 31.0 2 6.0 4 3.0 2 8.6 2 0.9 5 0.5
Europe 37.0 29.7 33.2 37.2 29.3 33.5 35.4 28.5 36.1 35.1 28.5 36.5
Excluding Russian Federation 44.4 25.3 30.3 44.3 25.9 29.8 41.0 25.9 33.1 37.8 26.4 35.9
Latin America and the Caribbean 42.7 27.6 29.7 40.3 27.8 32.0 39.4 27.6 33.0 39.4 27.2 33.3
Excluding Brazil 48.3 25.2 26.5 4 4.7 25.5 2 9.8 4 5.0 2 6.7 28.3 47.7 25.2 27.1Middle East and North Arica 37.2 37.0 25.8 35.6 34.6 29.8 31.0 36.4 32.5 29.1 35.3 35.6
Excluding Turkey 35.7 38.8 25.5 34.4 36.7 28.9 31.0 39.3 29.6 28.6 3 8.4 33.0
South and Central Asia 37.4 26.1 36.5 33.6 26.3 40.1 31.2 25.5 43.4 27.7 25.0 47.3
Excluding India 53.5 24.1 22.4 49.5 25.2 25.3 46.5 26.0 27.5 44.5 26.5 29.0
Sub-Saharan Arica 48.8 27.2 24.1 47.2 28.6 24.2 46.0 28.5 25.5 47.6 28.2 24.2
Excluding South Arica 65.7 20.0 14.3 66.0 20.6 13.4 63.2 22.4 14.4 61.7 23.4 14.9
Income
High income 26.1 34.2 39.7 22.4 31.9 45.7 19.8 34.1 46.1 17.0 27.3 55.8
Upper middle income 40.4 28.8 30.9 38.1 28.6 33.2 36.3 28.7 35.0 36.2 28.5 35.3
Lower middle income 39.1 27.2 33.7 36.0 25.4 38.5 31.0 27.3 41.6 28.9 26.6 44.5
Low income 63.4 17.2 19.4 64.2 16.9 18.9 62.5 16.8 20.7 61.7 17.6 20.7
Least developed countries 67.7 12.7 19.6 69.0 13.1 17.9 69.0 12.8 18.2 71.2 12.1 16.7
Note: Manuacturing value added in 2000 U S dollars. LT is low-technology products; MLT is medium-low technology products; MHT is medium- and high-technology products.
Source: UNIDO 2010.
Table 8.2
Technology composition o manuacturing value added, by region and income group, 1995–2009(percent)

8/2/2019 Unido Full Report eBook
http://slidepdf.com/reader/full/unido-full-report-ebook 164/259
145
T r E ND S I NMA N UF A C T Ur I
N G–B E F Or E A ND A F T E r T hE Gl OB A l F I NA N C I A l A ND
E C ON OMI C C r I S I S
8
“ Radio, television and communication
equipment’s share in manuacturing rose
to 20.7 percent in 2009 as a result o the
surge in demand or electronic goods
long-term growth, less vulnerable to competition andmore adaptable to technological and market trends(Lall 1998).
Value added by industry sector
In 1995, the dominant manuacturing sectors world- wide were ood and beverages (11.8 percent share),
chemicals and chemical products (10 percent) andmachinery and equipment (8.5 percent; able 8.3).By 2000, radio, television and communication equip-ment had surpassed all three, at 13.9 percent. Its sharerose to 20.7 percent in 2009 as a result o the surgein demand or electronic goods (computers, mobile
phones and other electronic devices).
International StandardIndustrial Classifcation
World Developing countries Developed countries
1995 2000 2005 2009 1995 2000 2005 2009 1995 2000 2005 2009
Food and beverages 11.8 10.3 9.9 9.7 15.4 14.4 12.9 12.2 10.8 9.0 8.5 8.1
Tobacco products 1.2 1.1 1.1 1.2 2.8 2.8 2.6 2.4 0.7 0.5 0.4 0.4
Textiles 3.2 2.6 2.3 2.2 5.8 5.3 4.7 4.4 2.4 1.8 1.3 0.9
Wearing apparel and ur 2.8 1.9 1.5 1.4 3.5 3.2 2.9 2.7 2.5 1.5 0.8 0.7
Leather, leather productsand ootwear 0.9 0.7 0.6 0.6 1.6 1.4 1.2 1.2 0.7 0.5 0.3 0.2
Wood products
(excluding urniture) 2.3 2.0 1.7 1.3 1.8 1.6 1.3 1.1 2.4 2.1 1.9 1.4
Paper and paper products 3.4 2.9 2.6 2.3 2.4 2.5 2.2 2.1 3.7 3.1 2.8 2.4
Printing and publishing 5.1 4.4 3.6 2.9 2.3 2.1 1.7 1.4 6.0 5.2 4.4 3.9
Coke, rened petroleumproducts, nuclear uel 4.2 3.7 3.6 3.3 7.7 7.0 6.1 5.0 3.1 2.6 2.5 2.2
Chemicals andchemical products 10.0 9.6 9.9 9.7 10.1 10.9 10.9 11.0 10.0 9.3 9.4 8.8
Rubber and plasticsproducts 3.3 3.1 3.0 2.8 3.4 3.6 3.6 3.5 3.2 3.0 2.7 2.4
Non-metallic mineralproducts 4.5 3.8 3.6 3.4 6.2 5.4 5.1 4.9 4.0 3.3 2.9 2.5
Basic metals 5.7 5.1 5.8 6.1 7.0 7.1 9.5 10.1 5.3 4.5 4.1 3.6
Fabricated metal products 6.5 5.8 5.0 4.5 4.4 4.3 3.9 3.5 7.2 6.2 5.5 5.0
Machinery and equipment 8.5 7.4 6.9 6.6 5.5 4.9 5.4 5.3 9.5 8.1 7.6 7.4
Oce, accounting andcomputing machinery 1.7 3.0 3.1 3.5 1.6 1.7 2.0 2.0 1.8 3.4 3.6 4.4
Electrical machineryand apparatus 4.0 4.1 4.0 4.6 3.3 3.9 4.6 5.7 4.2 4.2 3.8 4.0
Radio, television andcommunication equipment 5.6 13.9 17.7 20.7 4.7 7.2 7.8 10.2 5.9 15.9 22.1 27.1
Medical, precision andoptical instruments 2.2 2.1 2.2 2.2 1.1 1.2 1.5 1.3 2.5 2.4 2.5 2.7
Motor vehicles, trailers andsemitrailers 7.0 7.0 6.9 5.9 4.7 5.1 5.3 4.8 7.7 7.6 7.6 6.6
Other transport equipment 2.3 2.3 2.3 2.6 2.0 2.1 2.4 2.7 2.5 2.3 2.3 2.5
Furniture; manuacturing notelsewhere classied 3.7 3.2 2.7 2.7 2.7 2.3 2.4 2.4 4.1 3.5 2.9 2.8
Total 100 100 100 100 100 100 100 100 100 100 100 100
Note: Value added in 2000 US dollars.
Source: UNIDO 2010.
Table 8.3Industry sector share o manuacturing value added or developing and developed countries,selected years, 1995–2009 (percent)

8/2/2019 Unido Full Report eBook
http://slidepdf.com/reader/full/unido-full-report-ebook 165/259
146
T r E ND S I NMA N UF A C T Ur I
N G–B E F Or E A ND A F T E r T hE Gl OB A l F I NA N C I A l A ND
E C ON OMI C C r I S I S
8
“ The positive growth in developing
countries over 2008–2009 mass sharp
disparities. The economic and nancial crisis
aected each developing region dierently
In developing countries, the leading sectors in 2009 were ood and beverages (12.2 percent); chemicals andchemical products (11 percent); radio, television andcommunication equipment (10.2 percent); and basicmetals (10.1 percent). Te increase in the share o radio,television and communication equipment (up rom 4.7
percent in 1995) reects a shi towards more sophisti-cated products. Even so, developing countries account
or a substantial part o worldwide manuacturing o medium-low technology products in labour-intensivesectors such as textiles (74.7 percent), wearing appareland ur (71.6 percent) and leather, leather products andootwear (77.2 percent; able 8.4), with China leading
in all three and accounting or roughly 60 percent o the total. India (5.7 percent) and Brazil (3.1 percent)ollowed in textiles, Tailand (6 percent) and Brazil(2.8 percent) in wearing apparel and ur and Argentina(7.1 percent) and Brazil (3.2 percent) in leather, leather
products and ootwear.In contrast, developed countries account or
70 percent or more o manuacturing activities in
medium- and high-technology products – such asmachinery and equipment; motor vehicles, trailersand semitrailers; and medical, precision and opticalinstruments. Developed countries thereore appearto retain most high value-added or technologically
International Standard
Industrial Classifcation
Developing countries Developed countries
1995 2000 2005 2009 1995 2000 2005 2009Food and beverages 30.6 33.2 40.4 47.9 69.4 66.8 59.6 52.1
Tobacco products 55.2 61.9 72.2 80.1 44.8 38.1 27.8 19.9
Textiles 43.1 48.1 62.9 74.7 56.9 51.9 37.1 25.3
Wearing apparel and ur 29.7 39.8 60.5 71.6 70.3 60.2 39.5 28.4
Leather, leather products and ootwear 40.5 47.4 66.3 77.2 59.5 52.6 33.7 22.8
Wood products (excluding urniture) 18.8 19.1 23.9 33.7 81.2 80.9 76.1 66.3
Paper and paper products 16.6 19.9 26.4 34.6 83.4 80.1 73.6 65.4
Printing and publishing 10.5 11.2 14.9 17.9 89.5 88.8 85.1 82.1
Coke, rened petro leum products, nuclear uel 42.9 45.2 52.4 57.9 57.1 54.8 47.6 42.1
Chemicals and chemical products 23.9 26.8 34.1 43.0 76.1 73.2 65.9 57.0
Rubber and plastics products 24.6 27.6 37.0 46.7 75.4 72.4 63.0 53.3Non-metallic mineral products 32.1 33.7 43.9 53.7 67.9 66.3 56.1 46.3
Basic metals 29.0 33.0 50.9 63.2 71.0 67.0 49.1 36.8
Fabricated metal products 15.9 17.7 24.0 29.8 84.1 82.3 76.0 70.2
Machinery and equipment 15.3 15.8 24.0 30.3 84.7 84.2 76.0 69.7
Oce, accounting and computing machinery 21.8 13.8 19.9 21.7 78.2 86.2 80.1 78.3
Electrical machinery and apparatus 19.6 22.4 35.5 46.6 80.4 77.6 64.5 53.4
Radio, te lev is ion and communication equipment 19.9 12.4 13.6 18.5 80.1 87.6 86.4 81.5
Medical, precision and optical instruments 11.8 13.3 21.1 23.1 88.2 86.7 78.9 76.9
Motor vehicles, trailers and semitrailers 15.9 17.4 23.8 30.5 84.1 82.6 76.2 69.5
Other transport equipment 19.8 22.0 31.8 39.9 80.2 78.0 68.2 60.1
Furniture; manuacturing not elsewhere classied 16.8 17.1 27.1 34.6 83.2 82.9 72.9 65.4
Total 22.7 24.3 28.7 37.5 77.3 75.7 71.3 62.5
Note: Value added in 2000 US dollars.
Source: UNIDO 2010.
Table 8.4
Developing and developed countries’ share o global manuacturing value added by industry sector,selected years, 1995–2009 (percent)

8/2/2019 Unido Full Report eBook
http://slidepdf.com/reader/full/unido-full-report-ebook 166/259
147
T r E ND S I NMA N UF A C T Ur I
N G–B E F Or E A ND A F T E r T hE Gl OB A l F I NA N C I A l A ND
E C ON OMI C C r I S I S
8
“ Developing countries account or a
substantial part o worldwide manuacturing
o medium-low technology products in labour-
intensive sectors such as textiles, wearing
apparel and leather products and ootwear
complex activities, while outsourcing labour-intensiveand simple activities – as exemplied by a small noteon the back o the iPhone™: “Designed by Apple inCaliornia/Assembled in China.”
Te ve astest growing sectors over 2005–2009 were oce, accounting and computing machinery;radio, television and communication equipment;electrical machinery and apparatus; other trans-
port equipment; and basic metals (able 8.5). Allare medium- and high-technology activities exceptor basic metals, whose growth is likely explained bydemand rom emerging economies such as China andIndia. In 2009, the leading producers in those sec-tors were the United States, China, Japan, Germanyand the Republic o Korea. China was the rst or sec-ond leading manuacturer in the world in 21 o 22industrial sectors (International Standard IndustrialClassication Revision 3). Other developing econ-
omy leaders in global manuacturing include aiwanProvince o China, Brazil and India.
Among developing economies, China has becomethe uncontested leader in all 22 industrial sectors,accounting or more than 50 percent o developing economies’ total MVA in 15 o them. When China isexcluded, Brazil, aiwan Province o China, India andTailand lead in at least one o the ve astest growing sectors. In most o these sectors MVA remains concen-trated, with the leading economy’s share at least twice
that o the ollowing economy. For example, in oce,accounting and computing machinery, hailand’sshare is more than six times that o Brazil, in second
place. Brazil, aiwan Province o China and Mexicoare among the ve leading manuacturers in our o the ve astest growing industrial sectors.
The impact o the 2008–2009
economic and nancial crisis on
manuacturing
Global MVA grew an average 3.1 percent a year over2000–2008, reaching $7,350 billion (able 8.6). Butin 2009, the global recession led to a 4.6 percent drop,to $7,020 billion. Te crisis aected developed coun-tries more, with MVA alling 8.1 percent rom 2008
to 2009. Economic growth in developing countriesslowed to 2.9 percent in 2009, down rom an averageo 6.8 percent a year over the previous eight years.
Te positive growth in developing countries over2008–2009 masks sharp disparities. Te economicand nancial crisis aected each developing regiondierently, through a region-specic mix o channelssuch as trade, remittances, nancial ows, oreign
direct investment and development assistance.Europe was the most aected, with MVA drop-
ping 7.1 percent, despite growth in ve countries,including Bosnia and Herzegovina (5.4 percent)and Croatia (3.5 percent). Te Russian Federation’seconomy contracted sharply (12 percent) as the crisisdepressed oil prices and reversed capital ows.
Latin America and the Caribbean’s MVA ell6 percent rom 2008 to 2009, the largest declineaer Europe’s. MVA contracted at dierent rates in
Argentina (1 percent), Brazil (3.7 percent) and Mexico(more than 10 percent) because o lower exportdemand and capital ight. Mexico’s close commerciallinks with the United States, the centre o the crisis,also contributed to the dramatic drop.
In East Asia and the Pacic, MVA grew 7.7 percentduring the global downturn. Over 2008–2009, someo the highest growth rates were recorded in Cambodia(12.8 percent), China (10.2 percent) and Viet Nam (9.3
percent). By contrast, MVA ell in Malaysia (5.6 per-
cent) and Tailand (1.5 percent) ollowing several yearso growth. Te region’s ratio o exports to GDP wasaround 50 percent in 2008, the highest among devel-oping regions. As a result, East Asian countries wereaected by the crisis primarily through the collapse o
world trade, which led to a scaling down o manuac-turing and mass layos in labour-intensive sectors suchas garments and electronics. Several countries, suchas China, Indonesia and Malaysia, adopted stimulus
packages combining tax cuts and government spend-ing on housing, inrastructure, transportation andindustry. Tese scal measures totalled 4.8 percent o GDP in China. East Asia and the Pacic is now lead-ing the global recovery, with rapid growth oreseen orthe coming years (IMF 2010).

8/2/2019 Unido Full Report eBook
http://slidepdf.com/reader/full/unido-full-report-ebook 167/259
148
T r E ND S I NMA N UF A C T Ur I
N G–B E F Or E A ND A F T E r T hE Gl OB A l F I NA N C I A l A ND
E C ON OMI C C r I S I S
8
“ The ve astest growing sectors over 2005–
2009 were oce, accounting and computing
machinery; radio, television and communication
equipment; electrical machinery and apparatus;
other transport equipment; and basic metals
Industry sector
Averageannualgrowth
rate
World leading economy(share in world MVA)
Leading developing economiesa (share in developing economy MVAa )
Economy 2000 Economy 2009 Economy 2000 Economy 2009
Oce, accountingand computingmachinery(ISIC 30)
9.8
UnitedStates
53 UnitedStates
53 Thailand 21 Thailand 60
Japan 15 China 11 Mexico 21 Brazil 9
UnitedKingdom
6 Japan 9 Brazil 17 Mexico 8
China 4 Germany 7 Malaysia 13 Philippines 5
Germany 4 Republico Korea
6 Philippines 8 Saudi Arabia 4
Radio,television andcommunicationequipment(ISIC 32)
9.4
UnitedStates
61 UnitedStates
62 TaiwanProvince o China
45 TaiwanProvince o China
64
Japan 15 China 12 Malaysia 14 Malaysia 7
China 5 Japan 10 Brazil 7 Turkey 6
TaiwanProvinceo China
3 Republico Korea
5 Mexico 7 Philippines 5
Republico Korea
3 TaiwanProvince o China
4 Philippines 6 Thailand 4
Electricalmachineryand apparatus(ISIC 31)
7.9
Japan 23 China 33 Brazil 19 India 44
UnitedStates
21 Japan 20 India 17 Brazil 15
Germany 13 Germany 10 Mexico 15 Mexico 7
China 8 UnitedStates
10 TaiwanProvince o China
12 TaiwanProvince o China
5
Italy 4 India 5 Turkey 5 Iran, IslamicRep.
4
Other transportequipment(ISIC 35)
7.3
UnitedStates
31 UnitedStates
22 Brazil 44 Brazil 63
Japan 9 China 15 India 19 India 18
United
Kingdom
8 Brazil 14 Taiwan
Province o China
8 Taiwan
Province o China
3
Brazil 6 Japan 7 Mexico 7 Viet Nam 3
France 5 Republico Korea
6 United ArabEmirates
3 Mexico 2
Basic metals(ISIC 27)
5.7
Japan 23 China 48 India 15 India 25
UnitedStates
14 Japan 14 Mexico 14 Brazil 12
China 12 UnitedStates
5 TaiwanProvince o China
13 Mexico 9
Germany 6 Germany 4 Brazil 12 TaiwanProvince o China
8
Republico Korea
4 India 3 Turkey 7 Turkey 7
a. Excluding China.
Note: Value added in 2000 US dollars. ISIC is International Standard Industrial Classication.
Source: UNIDO 2010.
Table 8.5
Leading producers in the ve astest growing industry sectors, 2000 and 2009 (percent)
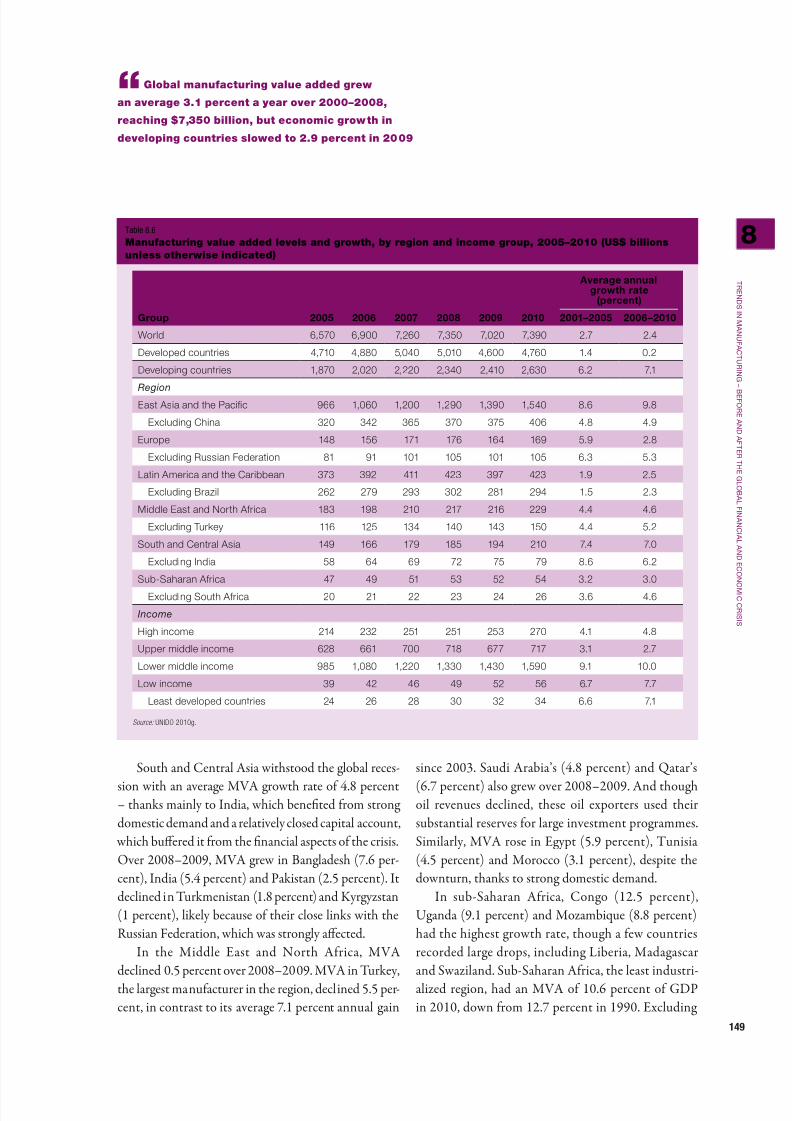
8/2/2019 Unido Full Report eBook
http://slidepdf.com/reader/full/unido-full-report-ebook 168/259
149
T r E ND S I NMA N UF A C T Ur I
N G–B E F Or E A ND A F T E r T hE Gl OB A l F I NA N C I A l A ND
E C ON OMI C C r I S I S
8
“ Global manuacturing value added grew
an average 3.1 percent a year over 2000–2008,
reaching $7,350 billion, but economic growth in
developing countries slowed to 2.9 percent in 2009
South and Central Asia withstood the global reces-sion with an average MVA growth rate o 4.8 percent– thanks mainly to India, which beneted rom strong domestic demand and a relatively closed capital account,
which buered it rom the nancial aspects o the crisis.Over 2008–2009, MVA grew in Bangladesh (7.6 per-cent), India (5.4 percent) and Pakistan (2.5 percent). Itdeclined in urkmenistan (1.8 percent) and Kyrgyzstan(1 percent), likely because o their close links with theRussian Federation, which was strongly aected.
In the Middle East and North Arica, MVAdeclined 0.5 percent over 2008–2009. MVA in urkey,the largest manuacturer in the region, declined 5.5 per-cent, in contrast to its average 7.1 percent annual gain
since 2003. Saudi Arabia’s (4.8 percent) and Qatar’s(6.7 percent) also grew over 2008–2009. And thoughoil revenues declined, these oil exporters used theirsubstantial reserves or large investment programmes.Similarly, MVA rose in Egypt (5.9 percent), unisia(4.5 percent) and Morocco (3.1 percent), despite thedownturn, thanks to strong domestic demand.
In sub-Saharan Arica, Congo (12.5 percent),Uganda (9.1 percent) and Mozambique (8.8 percent)had the highest growth rate, though a ew countriesrecorded large drops, including Liberia, Madagascarand Swaziland. Sub-Saharan Arica, the least industri-alized region, had an MVA o 10.6 percent o GDPin 2010, down rom 12.7 percent in 1990. Excluding
Average annualgrowth rate
(percent)
Group 2005 2006 2007 2008 2009 2010 2001–2005 2006–2010
World 6,570 6,900 7,260 7,350 7,020 7,390 2.7 2.4
Developed countries 4,710 4,880 5,040 5,010 4,600 4,760 1.4 0.2
Developing countries 1,870 2,020 2,220 2,340 2,410 2,630 6.2 7.1
Region
East Asia and the Pacic 966 1,060 1,200 1,290 1,390 1,540 8.6 9.8
Excluding China 320 342 365 370 375 406 4.8 4.9
Europe 148 156 171 176 164 169 5.9 2.8
Excluding Russian Federation 81 91 101 105 101 105 6.3 5.3
Latin America and the Caribbean 373 392 411 423 397 423 1.9 2.5
Excluding Brazil 262 279 293 302 281 294 1.5 2.3
Middle East and North Arica 183 198 210 217 216 229 4.4 4.6
Excluding Turkey 116 125 134 140 143 150 4.4 5.2
South and Central Asia 149 166 179 185 194 210 7.4 7.0
Excluding India 58 64 69 72 75 79 8.6 6.2Sub-Saharan Arica 47 49 51 53 52 54 3.2 3.0
Excluding South Arica 20 21 22 23 24 26 3.6 4.6
Income
High income 214 232 251 251 253 270 4.1 4.8
Upper middle income 628 661 700 718 677 717 3.1 2.7
Lower middle income 985 1,080 1,220 1,330 1,430 1,590 9.1 10.0
Low income 39 42 46 49 52 56 6.7 7.7
Least developed countries 24 26 28 30 32 34 6.6 7.1
Source: UNIDO 2010g.
Table 8.6
Manuacturing value added levels and growth, by region and income group, 2005–2010 (US$ billionsunless otherwise indicated)

8/2/2019 Unido Full Report eBook
http://slidepdf.com/reader/full/unido-full-report-ebook 169/259
150
T r E ND S I NMA N UF A C T Ur I
N G–B E F Or E A ND A F T E r T hE Gl OB A l F I NA N C I A l A ND
E C ON OMI C C r I S I S
8 South Arica, the share drops to 7.8 percent. Withcountries in the region at an early stage o develop-ment, when shares would be expected to rise, this isa disturbing trend. It suggests that the region’s indus-trial base is eroding, a process likely accelerated by thedepletion o much needed resources or investmentsin productive capacity and inrastructure as a resulto the nancial crisis. Sub-Saharan Arica is also likely
to be severely aected through other channels, such aslower remittances, exports revenues and commodities
prices.Despite the crisis, MVA in the least devel-
oped countries grew 6.3 percent over 2008–2009.hree countries in Asia – imor-Leste (13.8 per-cent), Aghanistan (13.6 percent) and Cambodia(12.3 percent) – had double-digit growth. InBangladesh, the largest manuacturer among the leastdeveloped countries, with an MVA share o more than
40 percent o the group total, MVA grew 7.6 percentin 2009. Several countries in sub-Saharan Arica, suchas Ethiopia, ogo and Zambia, also enjoyed MVAgrowth. However, this growth could conceal long-term adverse eects o the crisis on industrialization,due to their edgling manuacturing sectors, increased
international competitive pressures (or example, romChina in low-technology labour-intensive sectors suchas textiles) and vulnerability to external shocks.
“ Despite the crisis, manuacturing value
added in the least developed countries
grew 6.3 percent over 2008–2009
45
55
65
75
2008200520001995199019851980
P e r c e n t
Figure 8.4
Developing countries’ share in worldmanuacturing employment, 1980–2008
Global manuacturing employment has been shiting rom developed to
developing countries
Source: UNIDO 2010.
20082007200620052004200320022001200019991998
0
25
50
75
P e
r c e n t
East Asia and the Pacific
Europe
South and Central Asia
Latin America and the CaribbeanMiddle East and North Africa
Sub-Saharan Africa
Figure 8.5
Share o manuacturing employment in developing countries, by region, 1998–2008
There are sharp regional dierences in the evolution o manuacturing employment in developing countries
Source: UNIDO 2010.

8/2/2019 Unido Full Report eBook
http://slidepdf.com/reader/full/unido-full-report-ebook 170/259

8/2/2019 Unido Full Report eBook
http://slidepdf.com/reader/full/unido-full-report-ebook 171/259
152
T r E ND S I NMA N UF A C T Ur I
N G–B E F Or E A ND A F T E r T hE Gl OB A l F I NA N C I A l A ND
E C ON OMI C C r I S I S
8
“ In developing countries, the largest
manuacturing employers were ood
and beverages; textiles; machinery and
equipment; wearing apparel and ur; and
chemicals and chemical products
here are sharp regional dierences, however,among developing countries (Figure 8.5). Growthin manuacturing employment in East Asia and thePacic was negative over 1998–2001 but then pickedup again, and the region now accounts or nearly two-thirds o manuacturing employment in developing countries. Europe’s share has been declining since2000, ollowing the ruble crisis, which substantially
lowered manuacturing employment in the RussianFederation. Latin America and the Caribbean’s sharehas also declined, while the share remained stable inSouth and Central Asia, the Middle East and NorthArica and sub-Saharan Arica – at generally less than10 percent.
By industry, the top ve manuacturing employersin developed countries over 2001–2008 (employing 47.2 percent o the developed country total) were oodand beverages; machinery and equipment; abricated
metal products; motor vehicles, trailers and semitrail-ers; and rubber and plastics products (able 8.7). Indeveloping countries, the largest manuacturing employers (45.0 percent o the developing countrytotal) were ood and beverages; textiles; machinery
and equipment; wearing apparel and ur; and chemi-cals and chemical products.
Notes
1. Data or 2010 were obtained using “nowcasting”(see Boudt, odorov and Upadhyaya 2009).
2. For the regional classication o countries, seeAnnex 13.
3. Manuactured products can be classied by tech-nological complexity as low-technology, medium-low-technology and medium- and high-technology(see Annex 7 or details). Low- and medium-low-technology products are sometimes called simple
products, while medium- and high-technology products are also complex products. Tere is a highlevel o aggregation in classiying activities using
physical complexity, which may result in combin-ing products rom the same industrial category
but with dierent technological content (see Lall, Weiss and Zhang 2006 or a discussion).
4. In this section, 2007 data on the number o employees was estimated using a second-orderautoregressive model.

8/2/2019 Unido Full Report eBook
http://slidepdf.com/reader/full/unido-full-report-ebook 172/259
153
rade expansion has been central to economic glo-balization. Exports have grown 5.9 percent annuallysince 2004, reaching close to $15,000 billion in 2008,beore dropping in 2009 (able 9.1). Manuacturesmake up the bulk o world trade, consistently
accounting or more than 80 percent o exports since1990.
While developed countries have traditionallydominated world manuactures trade, developing countries’ share has risen steadily – as has their expo-sure to trade shocks (Montalbano 2011).1 Althoughinitially sheltered rom the direct eects o the 2008–2009 nancial and economic crisis, the trade channelhas worked mainly by reducing developing countryexports to developed countries hit hard by the cri-
sis. Developing countries were later aected throughother channels, including remittances, oreign directinvestment and development assistance.
Tis chapter analyses trends in world manuac-tured exports since 1990, the changing roles o devel-oping countries and the eects o the recent nancialand economic crisis on their manuactured exports.
Trends in world manuactured exports
In 2008, world manuactured exports peaked at
$12,095 billion (see able 9.1), growing aster thanboth manuacturing value added and GDP during 2005–2009. rade liberalization, alling transporta-tion costs and increased globalization o production
contributed to the growth (UNCAD 2008).Exports o primary products grew even aster overthe same period, likely uelled by strong demand romast-growing developing countries.
Developed countries’ manuactured exports grew
11.0 percent over 2005–2008, reaching $7,542 billionbeore dropping to $5,792 billion in 2009 becauseo the crisis (able 9.2; see also able 9.4 later in thechapter). In developing countries, manuacturedexports grew 17.3 percent over the same period, to a
peak o $4,554 billion in 2008, and dropped to $3,699billion in 2009.
With growth rates higher than those o devel-oped countries, developing countries’ share in worldmanuactured exports rose rom 20.4 percent in
1992 to 29.4 percent in 2000 and 39 percent in 2009(Figure 9.1). And the trend will likely continue, asdeveloping countries increase their manuacturing
production capacity and more manuacturing activi-ties relocate to these countries to reduce productioncosts.
World manuactured exports are dominated bymedium- and high-technology products such as tel-ecommunications equipment, passenger vehicles,oce machines and medicines. Since 1992, the share
o medium- and high-technology products in worldmanuactured exports has remained above 60 per-cent, with a peak o 64.3 percent in 2000 (Figure9.2).2 Te share has declined since 2000, due mainly
Chapter 9
Manuactured exports trade
Product category 2004 2005 2006 2007 2008 2009
Average annualgrowth, 2004–2009
(percent)
Manuactures 7,382 8,252 9,448 10,845 12,095 9,490 5.2
Primary 1,180 1,449 1,837 1,984 2,653 1,843 9.3
Other 107 114 149 167 217 207 14.1
Total trade 8,669 9,815 11,434 12,997 14,966 11,540 5.9
Source: UN 2011.
Table 9.1
World exports, by product category, 2004–2009 (US$ billions unless otherwise indicated)

8/2/2019 Unido Full Report eBook
http://slidepdf.com/reader/full/unido-full-report-ebook 173/259
154
MA N UF A C T Ur E D E X P Or T S T r A D E
9
“ In developing countries, manuactured
exports grew 17.3 percent over 2005–2008,
to a pea o $4,554 billion in 2008, and
dropped to $3,699 billion in 2009
to the 2.4 percent annual drop in the share o high-technology exports over 2001–2008. Te share o resource-based exports grew 2.9 percent annually overthe period, while the share o low-technology productsremained airly stable.
In 2009, developing countries accounted or35 percent o world exports o medium- and high-technology products.3 Although developed countriesstill account or more than 60 percent o medium- andhigh-technology exports, developing countries havemade inroads, raising the technological complexity o their exports and gaining market share (Figure 9.3). In2009, 54.8 percent o developing country exports weremedium- and high-technology products, up rom 48.6
percent in 1995.
O the 20 most dynamic manuactured products4
(products with the highest annual average growthrates) over 2005–2009, 12 were resource-based orlow-technology products (able 9.3).5 Exports o thetop three products (precious metals, iron ores andoce machines) grew more than 25 percent a yearon average. Te dynamism o resource-based prod-ucts, such as iron, steel, copper and other metallic andnon-metallic minerals, can be explained by the highdemand rom countries such as China and India toeed metal-intensive construction and motor vehicleindustries. Tis trend opens doors or low- and mid-dle-income resource-rich countries that might be ableto exploit the upward pressure on these commodi-ties’ prices. Developing countries’ share in dynamic
Country group 1995 2000 2005 2009
World 4,072 5,149 8,252 9,490
Developed countries 3,086 3,634 5,409 5,792
Developing countries 985 1,514 2,844 3,699
Region
East Asia and the Pacic 667 937 1,736 2,308
Excluding China 534 708 1,013 1,153
Developing Europe 46 125 306 402
Excluding Russian Federation 45 84 214 293
Latin America and the Caribbean 143 246 378 415
Excluding Brazil 108 204 292 318
Middle East and North Arica 68 120 240 335
Excluding Turkey 51 96 173 248
South and Central Asia 38 55 129 181
Excluding India 12 18 42 31
Sub-Saharan Arica 23 32 56 58
Excluding South Arica 6 12 23 22
Income
High-income 438 566 851 983
Upper middle-income 274 475 845 1,005
Lower middle-income 267 456 1,112 1,663
Low-income 7 18 36 48
Least developed countriesa 5 11 19 –
– is not available because about hal the least developed countries have yet to report 2009 data.
Source: UN 2011.
Table 9.2
World manuactured exports, by region and income group, selected years, 1995–2009 (US$ billions)

8/2/2019 Unido Full Report eBook
http://slidepdf.com/reader/full/unido-full-report-ebook 174/259
155
MA N UF A C T Ur E D E X P Or T S T r A D E
9
“ Developing countries’ share in world
manuactured exports rose rom 20.4 percent
in 1992 to 29.4 percent in 2000 and 39 percent
in 2009, and the trend will liely continue
0
25
50
75
100
20092005200019951992
P e r c e n t
Developed countries
Developing countries
Figure 9.1
Developed and developing countries’ share o world manuactured exports, 1992–2009
Developing countries’ share in world manuactured exports rose rom
20.4 percent in 1992 to 39.0 percent in 2009
Source: UN 2011.
–3 –2 –1 1 2 3 4
A v e r a g e c h a n g e i n t h e w o r l d m a r k e t s h a r e o f m e d i u m - a n d
h i g h - t e c h n o l o g y m a n u f a c
t u r e d e x p o r t s ( p e r c e n t )
Average change in the world market share of resource-based and low-technology manufactured exports (pe rcent)
–5
–3
–1
0
1
3
5
7
0
Developing countries(US$1,290 billion)
Developed countries(US$818 billion)
Figure 9.3
Change in world maret share o manuactured exports by technological level, 2004–2009
Although developed countries still account or more than 60 percent o medium- and high-technology exports, developing countries have made inroads
Note: Bubble size indicates the change in the value o manuactured exports (in parentheses) between 200 4 and 2009.
Source: UN 2011.
0
25
50
75
100
20102005200019951992
P e r c e n t
Resource-based
Low-technology
Medium-technology
High-technology
Figure 9.2
Technology composition o manuacturedexports, 1992–2009
Since 1992, the share o medium- and high-technology products in
world manuactured exports has remained above 60 percent
Source: UN 2011.

8/2/2019 Unido Full Report eBook
http://slidepdf.com/reader/full/unido-full-report-ebook 175/259
156
MA N UF A C T Ur E D E X P Or T S T r A D E
9
“ Exports o the top three products (precious
metal ores, iron ores and oce machines) grew
more than 20 percent a year on average
product exports averaged 47.3 percent over 2005–2009, up rom 41.7 percent over 2000–2004. By total
export value, one resource-based product (petroleum products, $986 billion) tops the list in 2009, ollowedby one medium-technology product (ships, $283 bil-lion) and one high-technology product (medicines,$246 billion).
Developing countries’ role in world
manuactured exports
Although developing countries’ overall share o worldmanuactured exports is rising, some countries havea greater inuence than others. China, especially, ischanging the world manuactured exports landscape.Its exports grew an average o 14.6 percent a year over1992–2001 and 27.9 percent over 2002–2008, aer it
joined the World rade Organization.
At 13th place in 1992, China has steadily risen inrank – becoming the global leader in manuactured
exports in 2008, with exports o $1,370 billion and a world market share o 11.3 percent. It is also the topexporter to the European Union, the United Statesand Japan. Increasingly, China is exporting medium-and high-technology manuactured products; theirshare rose rom 28.4 percent in 1992 to 45.5 percentin 2000 and 59.8 percent in 2009. And as the secondlargest importer in the world (with a share o 8.7 per-cent in 2009) – behind the United States (13.1 per-cent) and ahead o Germany (7.4 percent) – China ishelping uel global demand.
East Asia and the Pacic, led by China, accountsor the largest regional share o manuacturedexports rom developing countries, hovering around60 percent since 1998 (Figure 9.4). Europe’s share
SITCRev. 3a Technology category Product
Average annualgrowth, 2005–2009
(percent)2009 value
(US$ billions)
289 Resource-based Precious metals, concentrates 29.0 22.6
281 Resource-based Iron ore, concentrates 27.4 110.2
751 High-technology Oce machines 26.9 83.8
793 Medium-technology Ship, boat, foating structures 17.8 283.4
871 High-technology Optical instruments 17.3 144.6283 Resource-based Copper ores, concentrates 16.9 56.9
691 Low-technology Metallic structures 16.4 95.8
422 Resource-based Fixed vegetable at, oils, other 16.0 54.7
541 High-technology Medicines, excluding group 542 15.5 246.2
525 High-technology Radioactive materials 15.3 25.2
562 Medium-technology Fertilizer, except group 272 15.3 77.6
334 Resource-based Petroleum products 13.9 985.8
61 Resource-based Sugars, molasses, honey 13.0 51.9
897 Low-technology Gold, silverware, jewellery 12.9 131.0
288 Resource-based Nonerrous waste, scrap 12.7 46.6
718 High-technology Other power generating machinery 11.9 34.0
761 Medium-technology Television receivers, other 11.8 170.4
17 Resource-based Meat, oal, prepared, preserved 11.7 31.0
679 Low-technology Tubes, pipes, iron, steel 11.3 141.1
335 Resource-based Residual petroleum products 11.3 51.4
a. Standard Industrial Trade Classication – Revision 3.
Source: UN 2011.
Table 9.3
Top 20 dynamic manuactured exports, 2005–2009

8/2/2019 Unido Full Report eBook
http://slidepdf.com/reader/full/unido-full-report-ebook 176/259
157
MA N UF A C T Ur E D E X P Or T S T r A D E
9
“ East Asia and the Pacic, led by China,
accounts or the largest regional share o
manuactured exports rom developing countries,
hovering around 60 percent since 1998
o manuactured exports has been on the rise, whilethat o Latin America and the Caribbean has allen,rom 16.6 percent in 1999 to 11.2 percent in 2009.Shares o developing country manuactured exportsor the Middle East and North Arica, South andCentral Asia and sub-Saharan Arica have yet to reach10 percent.
Te dynamism and sophistication o a region’sexports show in the evolution o its world marketshares by technological level (Figure 9.5). East Asiaand the Paciic, Developing Europe, the MiddleEast and North Arica, and South and Central Asiaincreased their market shares o world resource-basedand low-technology products over 2004–2009; theirshares o medium- and high-technology productsrose even more. Latin America and the Caribbean’sshare o resource-based and low-technology productsincreased slightly (2 percent a year on average), but itsshare o medium- and high-technology products stag-nated. Sub-Saharan Arica’s share in the world marketor resource-based and low-technology products ell2.8 percent annually over 2004–2009, but its share o
medium- and high-technology products rose 1.6 per-cent per year.
Trends in manuactures trade
between developing countries
rade between developed countries still accounts orthe largest share o world manuactured exports, but
the share ell 8.5 percentage points over 2004–2009,to 40.3 percent. By contrast, manuactured exportsrom developing to developed countries rose 8.8 per-cent a year on average over 2004–2009, and thoserom developed to developing countries rose 10.0
percent a year (Figure 9.6). Exports between develop-ing countries grew even aster over the period, at 14.9
percent a year, reaching $2,247 billion in 2008 beoredropping to $1,871 billion in 2009. Tey accountedor 51.8 percent o developing countries’ manuac-tured exports in 2009, up rom 39.9 percent in 2000.Te share is likely to increase urther as productionragmentation eases, as trade continues to develop andas large countries such as Brazil, China and India growand reinorce their trade ties with other developing
200920082007200620052004200320022001200019991998
East Asia and the Pacific Developing Europe Latin America and the Caribbean Middle East and North Africa South and Central Asia Sub-Saharan Africa
P e r c e n t
0
25
50
75
100
Figure 9.4
Share o developing country manuactured exports, by region, 1998–2009
East Asia and the Pacic, led by China, has the largest regional share o manuactured exports rom developing countries
Source: UN 2011.

8/2/2019 Unido Full Report eBook
http://slidepdf.com/reader/full/unido-full-report-ebook 177/259
158
MA N UF A C T Ur E D E X P Or T S T r A D E
9
“ Manuactured exports rom developing to
developed countries rose 8.8 percent a year on
average over 2004–2009, and those rom developed
to developing countries rose 10 percent a year
–4 –3 –2 –1 1 2 3 4 5
A v e r a g e c h a n g e i n t h e w o
r l d m a r k e t s h a r e o f m e d i u m - a n d
h i g h - t e c h n o l o g y m a n u f a c t u r e d e x p o r t s ( p e r c e n t )
Average change in the world market share of resource-based and low-technology manufactured exports (percent)
South and Central Asia(US$81 billion)
Middle East and North Africa(US$117 billion)
East Asia and the Pacific(US$840 billion)
Sub-Saharan Africa(US$10 billion)
Developing Europe(US$149 billion)
Latin America andthe Caribbean(US$96 billion)
0
–4
–2
0
2
4
6
8
10
12
14
16
18
Figure 9.5
Change in regional share o world manuactured exports by technological level, 2004–2009
Export dynamism and sophistication show in the evolution o regions’ shares o world manuactured exports by technology level
Note: Bubble size indicates the change in the value o manuactured exports (in parentheses) between 20 04 and 2009.
Source: UN 2011.
–6 –4 –2 0 2 4 6 8 10
A v e r a g e g r o w t h r a t e o f m a n u f a c t u r e d e x p o r t s ( p e r c e n t )
Average change in the world market share of manufactured exports (percent)
Developed to developed countries(US$3,770 billion)
0
5
10
15
20
Developing to developing countries(US$1,871 billion)
Developing to developed countries(US$1,738 billion)
Developed to developing countries(US$1,986 billion)
Figure 9.6
Trade patterns between developed and developing countries, 2004–2009
Exports between developing countries grew 14.9 percent a year over 2004–2009
Note: Bubble size indicates the value o manuactures exports in 2009 (in parentheses).
Source: UN 2011.

8/2/2019 Unido Full Report eBook
http://slidepdf.com/reader/full/unido-full-report-ebook 178/259
159
MA N UF A C T Ur E D E X P Or T S T r A D E
9
“ In all regions, developed countries
remain the top trade partners, but their
share is declining. Countries in the same
region are the second largest trade partner
group in all but South and Central Asia
countries. Actively promoting trade with other devel-oping countries might be an attractive strategy ordeveloping countries. One study ound that remov-ing barriers to trade between developing countrieshas the potential to generate annual gains 40 percentlarger than those that would be generated by open-ing up developed countries’ markets (Fugazza and
Vanzetti 2008).
In all regions, developed countries remain the toptrade partners, but their share is declining (Figure 9.7).Countries in the same region are the second largesttrade partner group in all but South and Central Asia,
where trade with East Asia and the Pacic and theMiddle East and North Arica is more important.
ogether, the manuactured exports o the larg-est country in each region – Brazil, China, India,the Russian Federation, South Arica and urkey –accounted or 44.2 percent o the developing coun-
try total in 2009, up rom 33.1 percent in 2003.China, with 50 percent o East Asia and the Pacic’s
0
25
50
75
100
South
Africa
IndiaTurkeyBrazilRussian
Federation
China
P e r c e n t
1997
2003
2009
Figure 9.8
Largest country share in region’smanuactured exports, 1997, 2003 and 2009
Together, the largest countries in each region accounted or 44.2 percent
o total developing country manuactured exports in 2009
Source: UN 2011.
S h a r e
o f e x p o r t s
( p e r c e n t )
East Asia and the Pacific
S h a r e
o f e x p o r t s
( p e r c e n t )
Middle East and North Africa
Europe Latin America and the Caribbean
South and Central Asia Sub-Saharan Africa
0
25
50
75
100
20092005
0
25
50
75
100
20092005
0
25
50
75
100
20092005
0
25
50
75
100
20092005
0
25
50
75
100
20092005
0
25
50
75
100
20092005
East Asia and the Pacific Developing Europe Latin America and the Caribbean Middle East and North Africa South and Central Asia Sub-Saharan AfricaDeveloped
Figure 9.7
Manuactured exports marets, by region, 2005 and 2009
In all regions, developed countries remain the top trade partners, but their share is declining
Source: UN 2011.

8/2/2019 Unido Full Report eBook
http://slidepdf.com/reader/full/unido-full-report-ebook 179/259
160
MA N UF A C T Ur E D E X P Or T S T r A D E
9
“ Beneting rom dynamic intraregional
trade, East Asia and the Pacic accounted or
almost 70 percent o manuactured exports
between developing countries over 2000–2009
manuactured exports in 2009, more than doubled itsshare since 1997 (Figure 9.8). Manuactured exports
were even more concentrated in sub-Saharan Arica, where South Arica accounted or 62.8 percent o theregion’s total, and in South and Central Asia, whereIndia exported 82.5 o the region’s manuacturesin 2009.
Beneting rom dynamic intraregional trade, East
Asia and the Pacic accounted or almost 70 percento manuactured exports between developing coun-tries over 2000–2009 (Figure 9.9). Te region has spe-cialized in products with high value to weight ratios(such as semiconductors and textiles), which are more
prone to ragmentation (Lall, Albaladejo and Zhang 2004); their parts and components are thereore easierto produce in other countries beore nal assembly.rade in parts and components is proportionatelymuch larger in East Asia and the Pacic than else-
where, with China the premier centre o nal assem-bly (Athukorala 2010). Sharing production has alsoallowed some latecomers such as Cambodia and LaoPDR to integrate into production networks and reach
international markets. However, sharing productionmay mask the act that little value is added to manu-actured products. While developing countries’ sharein world exports o oce, accounting and computing machinery was about 62 percent in 2008, their sharein world manuacturing value added o those products
was only 18 percent, suggesting that low value-addedactivities are outsourced to developing countries.
The impact o the economic and
nancial crisis
World manuactured exports grew 13.2 percentannually over 2005–2008, reaching $12,095 billion(able 9.4), with the growth rate in developing coun-tries (17.3 percent) ar greater than that in developedcountries (11.0 percent). For manuactured exports,the astest growing developing regions were Europe,led by the Russian Federation, and the Middle East
and North Arica, led by urkey. Te largest develop-ing countries did especially well (Figure 9.10). Over2005–2008, manuactured exports grew 27.6 per-cent a year in the Russian Federation, 24.6 percent inChina, 24.3 percent in India, 20.2 percent in urkey,19.3 percent in Brazil and 16.4 percent in SouthArica.
Weakly integrated in world inancial markets,developing countries were somewhat sheltered romthe inancial eects o the 2008–2009 crisis, but
they did not escape the subsequent blows to trade.Developing countries were hit hard, abruptly halting the growth in manuactured exports, which dropped18.7 percent, compared with a 23.2 percent drop indeveloped countries.
Developed country imports dropped sharply as aresult o the crisis. US imports rom developing coun-tries ell 18.1 percent in 2009, and EU imports ell22.0 percent. Developing country exports to the threelargest EU markets ell (21.5 percent to the UnitedKingdom, 16.9 percent to Germany and 16.0 percentto France), with harsh eects in developing countries,especially in sub-Saharan Arica.
Manuactured exports rom East Asia and thePacic in 2009 dropped 20.4 percent to the European
0
500
1,000
1,500
2,000
2,500
20092005200019951990
U S $
b i l l i o n s
Other developing regions
East Asia andthe Pacific
Figure 9.9
Manuactured exports between developingcountries, 1990–2009
East Asia and the Pacic accounted or almost 70 percent o
manuactured exports between developing countries
Source: UN 2011.

8/2/2019 Unido Full Report eBook
http://slidepdf.com/reader/full/unido-full-report-ebook 180/259
161
MA N UF A C T Ur E D E X P Or T S T r A D E
9
“ World manuacturing exports reached
$12,095 billion in 2008, with the growth rate
over 2005–2008 in developing countries ar
greater than that in developed countries
Union and 14.5 percent to the United States. Declines were even sharper or Europe, Latin America and theCaribbean, and the Middle East and North Arica.Sub-Saharan Arica was hit hardest, with a 35.7 per-cent plunge in combined exports to the EuropeanUnion and the United States. Combined with all-ing commodity prices, the decline in manuacturedexport revenues has constrained the ability to import
vital production inputs and to mitigate the eects o the crisis. Te largest developing countries also su-ered rom the turmoil, but to varying degrees. Indianexports declined the least by ar (4.9 percent), ol-lowed by China (16.0 percent). Manuactured exports
dropped more than 20 percent in Brazil, the RussianFederation, South Arica and urkey. However, thesecountries are quickly bouncing back, with China’s2010 exports rebounding to their 2008 peaks.
Te least developed countries were less aected bythe drop in EU and US imports.6 Aer expanding 10.3
percent annually since 2004 to $9 billion in 2008, USimports rom these countries shrank 12.9 percent in2009, less than the developing country average declineo 18.1 percent. Bangladesh, the largest country in thegroup, saw their imports by the European Union andthe United States all just 1.7 percent. Others, includ-ing Benin, the Democratic Republic o the Congo and
Average annual growth rate(percent)
Group 2004 2005 2006 2007 2008 2009 2000–2004 2005–2009
World 7,379 8,252 9,448 10,845 12,095 9,490 9.6 5.2
Developed countries 4,974 5,409 6,066 6,890 7,542 5,792 7.9 3.1
Developing countries 2,405 2,844 3,382 3,955 4,554 3,699 14.0 9.0
Region
East Asia and the Pacic 1,468 1,736 2,081 2,446 2,732 2,308 13.7 9.5
Excluding China 910 1,013 1,159 1,278 1,362 1,153 8.9 4.9
Developing Europe 252 306 366 455 575 402 20.4 9.7
Excluding Russian Federation 183 214 258 326 398 293 20.8 9.9
Latin America and the Caribbean 318 378 419 455 534 415 8.9 5.4
Excluding Brazil 250 292 320 344 401 318 7.8 4.9
Middle East and North Arica 218 240 299 359 432 335 17.0 9.0
Excluding Turkey 160 173 222 261 314 248 16.1 9.1
South and Central Asia 100 129 154 171 197 181 16.6 12.6
Excluding India 35 42 49 46 41 31 16.4 –1.8
Sub-Saharan Arica 48 56 64 69 83 58 14.4 3.8
Excluding South Arica 21 23 29 27 32 22 19.8 0.9
Income
High-income 767 851 992 1,102 1,198 983 10.2 5.1
Upper middle-income 715 845 966 1,112 1,318 1,005 12.5 7.1
Lower middle-income 890 1,112 1,380 1,686 1,981 1,663 19.2 13.3
Low-income 32 36 44 55 57 48 25.0 8.1
Least developed countriesa 19 19 22 21 15 – 45.7 –
– is not available; about hal the least developed countries have yet to report 2009 data.
Source: UN 2011.
Table 9.4
World manuactured export levels and growth, by region and income group, 2004–2009 (US$ billionsunless otherwise indicated)

8/2/2019 Unido Full Report eBook
http://slidepdf.com/reader/full/unido-full-report-ebook 181/259
162
MA N UF A C T Ur E D E X P Or T S T r A D E
9
“ Over 2005–2008, manuactured exports
grew 27.6 percent a year in the Russian
Federation, 24.6 percent in China, 24.3 percent
in India, 20.2 percent in Turey, 19.3 percent
in Brazil and 16.4 percent in South Arica
Sudan, suered sharp declines. EU imports rom theleast developed countries dropped 7 percent (to $14.6billion), again less than the 22 percent overall declineor developing countries.
Overall, large developing countries, whose importsrom least developed countries grew an average o 46.5
percent a year over 2004–2008, oer important trade
opportunities. However, the crisis orced large devel-oping countries to cut imports rom least developedcountries 26.9 percent in 2009. Despite the higherthan average imports by major importing countries,the least developed countries are more vulnerable toeconomic shocks because they rely heavily on primary
product exports (Malik and emple 2009). While world manuactures trade dropped 21.5 percent in
2009, primary products trade dropped 30.5 percent.Te accompanying collapse in export revenues is likelyto hurt the least developed countries in the long run,
perhaps jeopardizing years o development progressby aecting investments in productive capacity, inra-structure and social programmes.
Notes
1. Te share o exports in GDP in developing coun-tries rose rom 20.4 percent in 1995 to 33.9 per-cent in 2008.
2. Manuactured exports can be classied by techno-logical complexity as natural resource–based, low-technology and medium- and high-technology(see Annex 8 or details).
3. Tese gures may conceal the act that complexactivities such as design and marketing are still
perormed in developed countries, while assembly
and production activities are carried out in devel-oping countries.
4. By concentrating exports on “dynamic” activities,a country could limit the risk o export marketsaturation rom an increased number o com-
petitors and exploit the potential or long-term productivity growth associated with an export-oriented industrialization strategy (Mayer et al.2003).
5. Geometric means are used to compute the average
growth rates. Te rates are lower than or 2004–2008 because the consequences o the crisis wereelt mainly in 2009.
6. Because o data constraints, analysis o the eectso the nancial crisis on the least developed coun-tries looks only at imports rom countries orgroups o countries, such as the United States andthe European Union.
0
250
500
750
1,000
1,250
2010200520001996
I n d e x ,
1 9 9 6
= 1
0 0
China
South Africa
India
Turkey
Russian Federation
100
Brazil
Figure 9.10
Growth o manuactured exports in selectedlarge developing countries, 1996–2010
The largest developing countries in each region did especially well in
manuactured exports growth
Source: UN 2011.
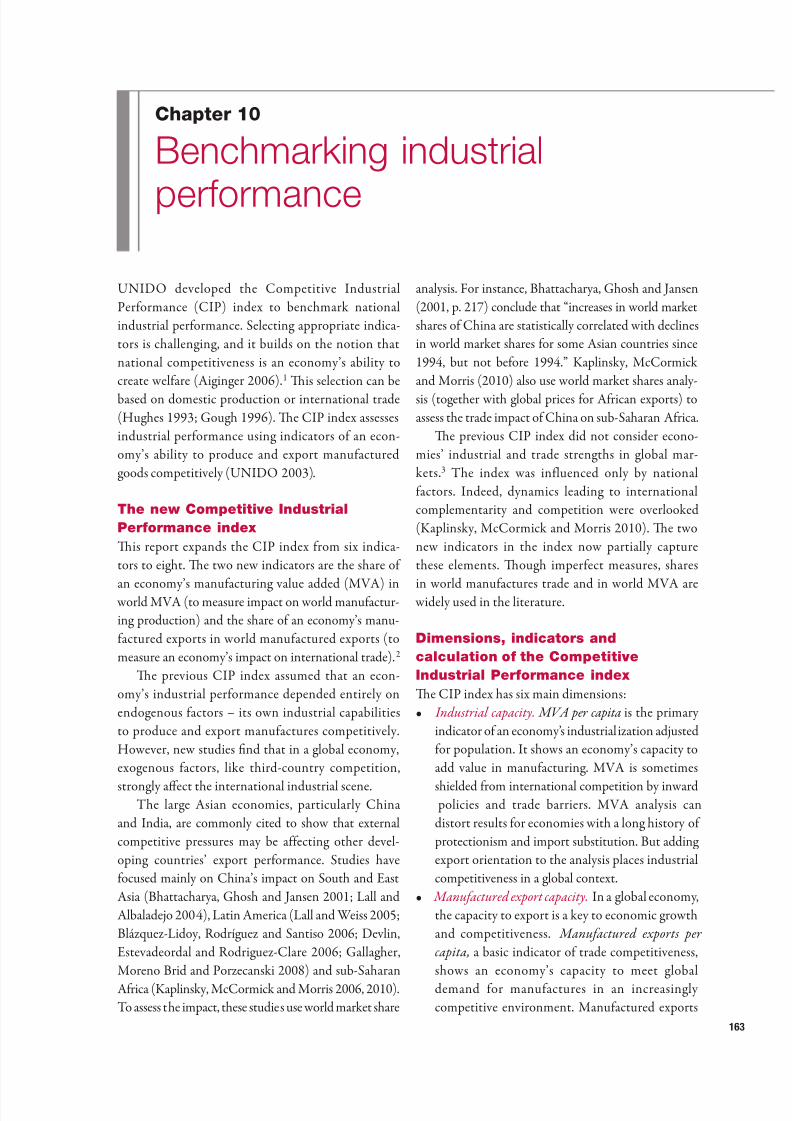
8/2/2019 Unido Full Report eBook
http://slidepdf.com/reader/full/unido-full-report-ebook 182/259
163
Chapter 10
Benchmarking industrial
perormance
UNIDO developed the Competitive IndustrialPerormance (CIP) index to benchmark nationalindustrial perormance. Selecting appropriate indica-tors is challenging, and it builds on the notion thatnational competitiveness is an economy’s ability to
create welare (Aiginger 2006).1 Tis selection can bebased on domestic production or international trade(Hughes 1993; Gough 1996). Te CIP index assessesindustrial perormance using indicators o an econ-omy’s ability to produce and export manuacturedgoods competitively (UNIDO 2003).
The new Competitive Industrial
Perormance index
Tis report expands the CIP index rom six indica-
tors to eight. Te two new indicators are the share o an economy’s manuacturing value added (MVA) in
world MVA (to measure impact on world manuactur-ing production) and the share o an economy’s manu-actured exports in world manuactured exports (tomeasure an economy’s impact on international trade).2
Te previous CIP index assumed that an econ-omy’s industrial perormance depended entirely onendogenous actors – its own industrial capabilitiesto produce and export manuactures competitively.
However, new studies nd that in a global economy,exogenous actors, like third-country competition,strongly aect the international industrial scene.
he large Asian economies, particularly Chinaand India, are commonly cited to show that externalcompetitive pressures may be aecting other devel-oping countries’ export perormance. Studies haveocused mainly on China’s impact on South and EastAsia (Bhattacharya, Ghosh and Jansen 2001; Lall andAlbaladejo 2004), Latin America (Lall and Weiss 2005;Blázquez-Lidoy, Rodríguez and Santiso 2006; Devlin,Estevadeordal and Rodriguez-Clare 2006; Gallagher,Moreno Brid and Porzecanski 2008) and sub-SaharanArica (Kaplinsky, McCormick and Morris 2006, 2010).o assess the impact, these studies use world market share
analysis. For instance, Bhattacharya, Ghosh and Jansen(2001, p. 217) conclude that “increases in world marketshares o China are statistically correlated with declinesin world market shares or some Asian countries since1994, but not beore 1994.” Kaplinsky, McCormick
and Morris (2010) also use world market shares analy-sis (together with global prices or Arican exports) toassess the trade impact o China on sub-Saharan Arica.
Te previous CIP index did not consider econo-mies’ industrial and trade strengths in global mar-kets.3 he index was inluenced only by nationalactors. Indeed, dynamics leading to internationalcomplementarity and competition were overlooked(Kaplinsky, McCormick and Morris 2010). Te twonew indicators in the index now partially capture
these elements. Tough imperect measures, sharesin world manuactures trade and in world MVA are
widely used in the literature.
Dimensions, indicators and
calculation o the Competitive
Industrial Perormance index
Te CIP index has six main dimensions:• Industrial capacity. MVA per capita is the primary
indicator o an economy’s industrialization adjusted
or population. It shows an economy’s capacity toadd value in manuacturing. MVA is sometimesshielded rom international competition by inward
policies and trade barriers. MVA analysis candistort results or economies with a long history o
protectionism and import substitution. But adding export orientation to the analysis places industrialcompetitiveness in a global context.
• Manuactured export capacity. In a global economy,the capacity to export is a key to economic growthand competitiveness. Manuactured exports per capita, a basic indicator o trade competitiveness,shows an economy’s capacity to meet globaldemand or manuactures in an increasinglycompetitive environment. Manuactured exports

8/2/2019 Unido Full Report eBook
http://slidepdf.com/reader/full/unido-full-report-ebook 183/259
164
B E N C hMA r K I N GI ND U S T r
I A l P E r F Or MA N C E
0
“ The previous CIP index assumed that industrial
perormance depended entirely on endogenous
actors – industrial capabilit ies to produce and
export manuactures competitively – however, new
studies nd that in a global economy, exogenous
actors, lie third-country competition, strongly
aect the international industrial scene
show whether national MVA is competitiveinternationally. rade analysis on its own candistort results or countries that have low domesticcapabilities and are used as export platorms bymultinational corporations. MVA also adds totrade analysis by showing the value that domesticcompanies add to exports.
• Impact on world MVA. Te impact o an economy
on world MVA is measured by its share in world MVA, which indicates an economy’s relative perormance and impact in manuacturing.
• Impact on world manuactures trade. An economy’simpact on world manuactured exports is measuredby its share in world manuactured exports, whichshows an economy’s competitive position relativeto others in international markets. Gains in worldmarket share reect more competitiveness; lossessignal deterioration.
• Industrialization intensity. An economy’s indus-trialization intensity is measured by the arithmeticaverage o the share o MVA in GDP and the share o medium- and high-technology activities in MVA. Teshare o MVA in GDP captures manuacturing’s
weight in the economy. Te share o medium- andhigh-technology activities in MVA shows thetechnological complexity o manuacturing. Tis
variable gives a positive weight to medium- andhigh-technology activities since a more complex
structure denotes industrial maturity, exibilityand the ability to move into aster growing activities. However, the measure captures shisacross activities but not upgrades within them,so it misses an important aspect o technologicalimprovement. As an aggregate measure, it doesnot capture ne technological dierences withinthe categories (some low-technology activities caninclude some high-technology activities – and vice
versa). Tese deciencies reect the nature o thedata, but the broad ndings appear to be sound.
• Export quality. Export quality is measured bythe simple arithmetic average o the share o manuactured exports in total exports and the
share o medium- and high-technology products in
manuactured exports. he reasoning is similarto that or industrialization intensity. Te shareo manuactures in total exports captures theimportance o manuacturing in export activity.he share o medium- and high-technology
products in manuactured exports captures thetechnological complexity o exports, along withthe ability to make more advanced products and
move into more dynamic areas o exports.All indicators are normalized as ollows:
X ij – Min(X ij ) I ij = Max(X ij ) – Min(X ij )
where I ij is the index value i or economy j, X ij is theindicator value i or economy j, Min is the smallest
value in the sample and Max is the largest. Te topeconomy in the sample gets the value 1, while the worst
perormer gets the value 0. Te CIP index is calculated
as the arithmetic mean o the normalized values o theindicators. All six dimensions o the index have equal
weight. Each combined indicator in industrializationintensity and export quality also gets equal weight .
Te CIP index relies on a limited number o quan-titative indicators. Te indicators are computed romMVA and population data rom UNIDO’s statisti-cal database and trade data rom the United NationsCommodity rade Statistics Database (Comtrade).Most indicators are easy to compute, but the share
o medium- and high-technology activities in MVAis not, because recent MVA data are not available atthe International Standard Industrial Classication(ISIC) two-digit level o aggregation. Censuses andsurveys are the primary sources o UNIDO’s indus-trial statistics. Te sources generate statistics witha typical lag o two or three years. Te most recentavailable data are used or this indicator, under theassumption that economic structure changes slowly.See Annexes 9–13 or more inormation.
Te CIP index ocuses on industrial perormance,not industrial potential.4 Perormance involves acountry’s actual wealth creation. Potential reers toactors that may ease or impede it, such as the quan-tity and quality o input actors (labour, capital and

8/2/2019 Unido Full Report eBook
http://slidepdf.com/reader/full/unido-full-report-ebook 184/259
165
B E N C hMA r K I N GI ND U S T r
I A l P E r F Or MA N C E
10
“ The our overall leaders in the Competitive
Industrial Perormance index in 2005 and 2009
were Singapore, the United States, Japan and
Germany, with China raning th in 2009
land), institutions (property rights, inancial mar-kets), domestic market size and government policies.Both perormance and potential are important or
policy-making. Te CIP index should be considered a preliminary measure o industrial progress because itexcludes industrial potential (UNIDO 2003).
Raning economies on the
Competitive Industrial Perormanceindex, 2005 and 2009
Te CIP index was computed or 2005 and 2009or the 118 economies with sucient recent data. Inboth years, the our overall leaders were Singapore, theUnited States, Japan and Germany, with Singaporeand Japan trading third and rst in 2009. China wash in 2009; Ireland was h in 2005 (able 10.1).
Te our overall leaders generally are at the topo the individual indicators as well. For example,in 2009, Singapore led in exports per capita and
was third in the share o manuactured exports intotal exports, MVA per capita and industrializationintensity. Japan led in MVA per capita and exportquality and was second in the share o world MVA.Germany was among the top 10 in ve o the six
dimensions.Among the top 20 economies in 2009, three
improved their rankings the most over 2005 – CzechRepublic (+4), Austria (+5) and Slovakia (+7) –thanks largely to growth in MVA per capita and man-uactured exports per capita (able 10.2). Te UnitedKingdom dropped our positions, rom 15th to 19th,reecting a decline on most indicators.
Rank
Economy
CIP index
2005 2009 2005 2009
3 1 Singapore 0.631 0.642
2 2 United States 0.660 0.634
1 3 Japan 0.661 0.628
4 4 Germany 0.598 0.597
6 5 China 0.461 0.557
7 6 Switzerland 0.455 0.513
9 7 Korea, Rep. o 0.438 0.480
5 8 Ireland 0.499 0.479
11 9 Finland 0.411 0.442
8 10 Belgium 0.439 0.442
12 11 Taiwan Province o China 0.401 0.437
10 12 Sweden 0.432 0.430
18 13 Austria 0.368 0.401
21 14 Slovakia 0.322 0.387
13 15 France 0.395 0.384
16 16 Netherlands 0.374 0.378
14 17 Hong Kong SAR China 0.385 0.375
17 18 Italy 0.370 0.361
15 19 United Kingdom 0.383 0.356
24 20 Czech Republic 0.310 0.352
26 21 Slovenia 0.306 0.345
Rank
Economy
CIP index
2005 2009 2005 2009
30 22 Israel 0.286 0.332
25 23 Hungary 0.310 0.328
22 24 Luxembourg 0.316 0.323
27 25 Thailand 0.300 0.320
23 26 Denmark 0.311 0.320
20 27 Malaysia 0.330 0.320
19 28 Canada 0.349 0.309
28 29 Spain 0.293 0.291
29 30 Mexico 0.286 0.286
31 31 Malta 0.266 0.284
34 32 Poland 0.235 0.279
32 33 Philippines 0.262 0.272
38 34 Norway 0.209 0.248
33 35 Turkey 0.237 0.237
35 36 Estonia 0.220 0.234
36 37 Portugal 0.218 0.224
43 38 Iceland 0.187 0.218
47 39 Romania 0.178 0.218
41 40 Lithuania 0.196 0.216
39 41 Costa Rica 0.208 0.215
42 42 India 0.190 0.206
Table 10.1
Ranings on the Competitive Industrial Perormance index, 2005 and 2009
(continued)

8/2/2019 Unido Full Report eBook
http://slidepdf.com/reader/full/unido-full-report-ebook 185/259
166
B E N C hMA r K I N GI ND U S T r
I A l P E r F Or MA N C E
0
“ Among the top 20 economies in 2009,
three improved their ranings the most over
2005 – Czech Republic, Austria and Slovaia
– thans largely to growth in MVA per capita
and manuactured exports per capita
Rank
Economy
CIP index
2005 2009 2005 2009
40 43 Indonesia 0.198 0.203
37 44 Brazil 0.212 0.202
51 45 Jordan 0.167 0.193
49 46 Argentina 0.168 0.192
46 47 Australia 0.180 0.188
62 48 Swaziland 0.152 0.186
45 49 South Arica 0.181 0.184
52 50 Greece 0.166 0.182
58 51 Georgia 0.155 0.179
61 52 Latvia 0.154 0.178
44 53 Cyprus 0.182 0.176
53 54 Bulgaria 0.165 0.176
54 55 Tunisia 0.157 0.175
50 56 El Salvador 0.168 0.175
55 57 Barbados 0.156 0.174
72 58 Viet Nam 0.137 0.17159 59 Morocco 0.155 0.168
64 60 Qatar 0.150 0.168
48 61 New Zealand 0.172 0.161
73 62 Egypt 0.137 0.157
67 63 Pakistan 0.147 0.156
88 64 Kuwait 0.107 0.156
60 65 Bahamas 0.154 0.154
57 66 Russian Federation 0.155 0.154
63 67 Tr inidad and Tobago 0.151 0.151
66 68 Macedonia, Former Yugoslav Rep. o 0.147 0.149
75 69 Bangladesh 0.135 0.145
56 70 Mauritius 0.156 0.144
65 71 Lebanon 0.149 0.144
78 72 Macao SAR China 0.130 0.142
76 73 Jamaica 0.132 0.141
69 74 Colombia 0.140 0.135
68 75 Senegal 0.142 0.134
77 76 Albania 0.132 0.133
71 77 Venezuela, Bol. Rep. o 0.138 0.131
79 78 Botswana 0.128 0.131
80 79 Uruguay 0.123 0.129102 80 Syrian Arab Rep. 0.082 0.128
Rank
Economy
CIP index
2005 2009 2005 2009
70 81 Chile 0.139 0.128
89 82 St. Lucia 0.106 0.127
82 83 Iran, Islamic Rep. o 0.114 0.126
87 84 Moldova, Rep. o 0.111 0.126
98 85 Gambia, The 0.087 0.124
83 86 Palestinian Terr itories 0.114 0.121
90 87 Rwanda 0.106 0.119
93 88 Cambodia 0.102 0.119
92 89 Honduras 0.103 0.118
74 90 Côte d’Ivoire 0.136 0.116
99 91 Oman 0.087 0.115
86 92 Sri Lanka 0.111 0.115
94 93 Fiji 0.101 0.110
91 94 Nepal 0.105 0.108
85 95 Niger 0.111 0.107
96 96 Peru 0.094 0.106100 97 Madagascar 0.086 0.101
105 98 Uganda 0.075 0.100
84 99 Zimbabwe 0.114 0.100
97 100 Kenya 0.092 0.094
101 101 Kyrgyzstan 0.085 0.089
103 102 Cameroon 0.080 0.083
81 103 Nigeria 0.114 0.081
108 104 Ecuador 0.069 0.079
104 105 Paraguay 0.075 0.076
107 106 Eritrea 0.071 0.076
111 107 Bol iv ia,Plurinational State o 0.063 0.073
112 108 Mongolia 0.055 0.070
109 109 Ghana 0.069 0.069
114 110 Tanzania, United Rep. o 0.046 0.068
118 111 Ethiopia 0.017 0.068
110 112 Malawi 0.064 0.059
113 113 Panama 0.048 0.053
116 114 Yemen 0.036 0.044
115 115 Algeria 0.037 0.042
117 116 Gabon 0.034 0.038
106 117 Azerbaijan 0.072 0.03695 118 Sudan 0.095 0.035
Source: UNIDO.
Table 10.1 (continued)
Ran on the revised Competitive Industrial Perormance index, 2005 and 2009

8/2/2019 Unido Full Report eBook
http://slidepdf.com/reader/full/unido-full-report-ebook 186/259
167
B E N C hMA r K I N GI ND U S T r
I A l P E r F Or MA N C E
10
“ Several economies slipped in their Competitive
Industrial Perormance index raning, including
the Russian Federation, Brazil and South Arica
EconomyChangein rank
Kuwait 24
Syrian Arab Republic 22
Swaziland 14
Viet Nam 14
Gambia, The 13
Egypt 11
Latvia 9
Israel 8
Romania 8
Oman 8
Slovakia 7
Georgia 7
St. Lucia 7
Uganda 7
Ethiopia 7
Jordan 6
Bangladesh 6
Macao SAR China 6
Austria 5
Slovenia 5
Iceland 5
Cambodia 5
Czech Republic 4
Norway 4
Qatar 4
Pakistan 4
Ecuador 4
Bolivia,Plurinational State o
4
Mongolia 4
Tanzania, United Rep. o 4
Argentina 3
Jamaica 3
Moldova, Rep. o 3
Rwanda 3
Honduras 3
Madagascar 3
Singapore 2
Korea, Rep. o 2Finland 2
EconomyChangein rank
Hungary 2
Thailand 2
Poland 2
Greece 2
Yemen 2
China 1
Switzerland 1
Taiwan Province o China 1
Lithuania 1
Albania 1
Botswana 1
Uruguay 1
Fiji 1
Cameroon 1
Eritrea 1
Gabon 1
United States 0
Germany 0
Netherlands 0
Malta 0
India 0
Morocco 0
Peru 0
Kyrgyzstan 0
Ghana 0
Panama 0
Algeria 0
Italy –1
Spain –1
Mexico –1
Philippines –1
Estonia –1
Portugal –1
Australia –1
Bulgaria –1
Tunisia –1
Iran, Islamic Rep. o –1
Paraguay –1
Japan –2
Belgium –2
EconomyChangein rank
Sweden –2
France –2
Luxembourg –2
Turkey –2
Costa Rica –2
Barbados –2
Macedonia, Former Yugoslav Rep. o
–2
Malawi –2
Ireland –3
Hong Kong SAR China –3
Denmark –3
Indonesia –3
Palestinian Terr itor ies –3
Nepal –3
Kenya –3
United Kingdom –4South Arica –4
Tr inidad and Tobago –4
Bahamas –5
Colombia –5
El Salvador –6
Lebanon –6
Venezuela, Bol. Rep. o –6
Sri Lanka –6
Malaysia –7
Brazil –7
Senegal –7Canada –9
Cyprus –9
Russian Federation –9
Niger –10
Chile –11
Azerbaijan –11
New Zealand –13
Mauritius –14
Zimbabwe –15
Côte d’Ivoire –16
Nigeria –22Sudan –23
Source: UNIDO.
Table 10.2
Change in ran on the Competitive Industrial Perormance index between 2005 and 2009

8/2/2019 Unido Full Report eBook
http://slidepdf.com/reader/full/unido-full-report-ebook 187/259
168
B E N C hMA r K I N GI ND U S T r
I A l P E r F Or MA N C E
0
“ East Asia and the Pacic is the most
industrialized region, with manuacturing
value added at 31 percent o GDP in 2009
Several economies slipped too, including theRussian Federation (–9), Brazil (–7) and South Arica(–4). India (42) maintained its position.
Developing economies had the largest variationsbetween 2005 and 2009. Gaining were Kuwait (+24),the Syrian Arab Republic (+22), Swaziland (+14),
Viet Nam (+14), Te Gambia (+13) and Egypt (+11).umbling were New Zealand (–13) and, aected by
conict and political instability, Côte d’Ivoire (–16),Nigeria (–22) and Sudan (–23).
At the bottom o the rankings are Mongolia inEast Asia and the Pacic; Algeria, Azerbaijan andYemen in the Middle East and North Arica; Panamain Latin America and the Caribbean; and Sudan andGabon in sub-Saharan Arica.
Industrial perormance o developing
economies by region
Te regional measure o industrial perormance isthe average CIP index o developing economies ineach region. At a regional level in 2009, East Asia andthe Pacic perormed best on the index, ollowed byEurope, the Middle East and North Arica, LatinAmerica and the Caribbean, South and Central Asia,and sub-Saharan Arica. Te 2005 regional rankings
were similar, except that the Middle East and NorthArica was behind Latin America and the Caribbean.
East Asia and the PacicEast Asia and the Pacic is the most industrializedregion, with MVA at 31 percent o GDP in 2009.Gains in MVA per capita have been impressive: rom$476 in 2004 to $678 in 2008 and $724 in 2009,despite the global economic crisis. Led by China, theregion accounted or 20 percent o world MVA in2009. Export perormance is especially remarkable,
with manuactured exports up 18 percent over 2005–2008 and constituting more than 90 percent o theregion’s exports.
Te region’s only change in rank was Tailand’srise rom sixth to h in the region in 2009, ahead o Malaysia, placing it 25th in the world (able 10.3). Itsexports per capita grew 52 percent over 2005–2008,
owing to such vibrant industrial sectors as electricappliances, computer parts and motor vehicles. Despiterising 14 spots in the world ranking, Viet Nam couldnot displace Indonesia, which dropped 3 spots.
Developing Europe
Developing Europe has the third highest MVA percapita, aer Latin America and the Caribbean and
East Asia and the Pacic, but moves to the top whenthe Russian Federation is excluded. Te contributiono manuacturing to its GDP is about 18 percent.hanks to greater integration with the EuropeanUnion and low labour costs, manuactured exportsgrew 25 percent over 2004–2008, surpassing all otherregions. Developing Europe’s strong competitive andexport capacities have propelled it to the top o manu-actured exports per capita.
he small economies o Slovenia, Malta and
Estonia typically lead the CIP index rankings or theregion, mostly through increases in per capita indica-tors (see able 10.3). For example, Slovenia increasedits MVA per capita 20 percent and manuacturedexports per capita 62 percent over 2005–2008, withtrade oriented towards other EU countries, such asAustria, France, Germany and Italy. he RussianFederation maintained its regional position butdropped nine spots globally.
Latin America and the CaribbeanLatin America and the Caribbean had the high-est regional MVA per capita in 2008, at $779, but itdropped to second place in 2009 because o the globaleconomic and nancial crisis. Manuacturing’s contri-bution to GDP dropped rom 16.6 percent in 2000 to14.8 percent in 2009. Te region’s 14 percent annualgrowth in manuactured exports over 2005–2008 wasslower than that o Europe (22.8 percent) and EastAsia and the Pacic (16.8 percent).
Mexico, Costa Rica and Brazil were the top three perormers in the region in 2005 and 2009, ranking 30th, 41st and 44th globally on the 2009 CIP index(see able 10.3). Mexican exports are developing rap-idly, with a strong contribution rom the automotive
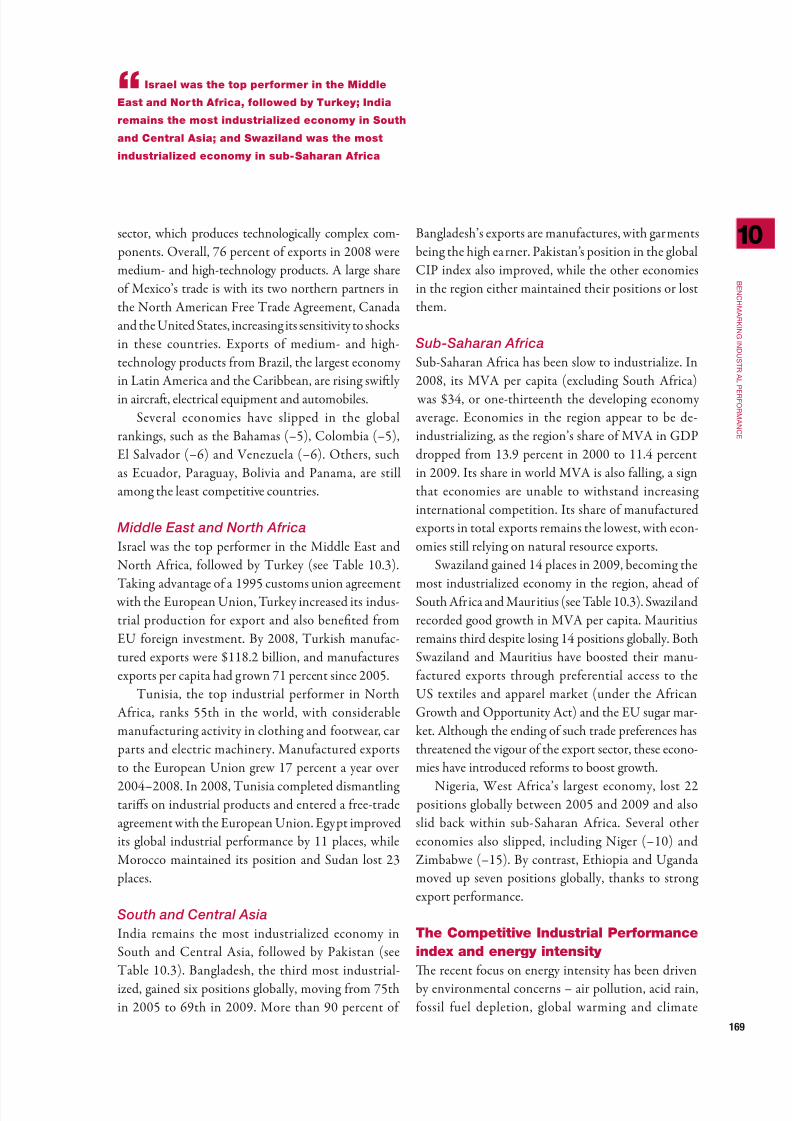
8/2/2019 Unido Full Report eBook
http://slidepdf.com/reader/full/unido-full-report-ebook 188/259
169
B E N C hMA r K I N GI ND U S T r
I A l P E r F Or MA N C E
10
“ Israel was the top perormer in the Middle
East and North Arica, ollowed by Turey; India
remains the most industrialized economy in South
and Central Asia; and Swaziland was the most
industrialized economy in sub-Saharan Arica
sector, which produces technologically complex com- ponents. Overall, 76 percent o exports in 2008 weremedium- and high-technology products. A large shareo Mexico’s trade is with its two northern partners inthe North American Free rade Agreement, Canadaand the United States, increasing its sensitivity to shocksin these countries. Exports o medium- and high-technology products rom Brazil, the largest economy
in Latin America and the Caribbean, are rising swilyin aircra, electrical equipment and automobiles.
Several economies have slipped in the globalrankings, such as the Bahamas (–5), Colombia (–5),El Salvador (–6) and Venezuela (–6). Others, suchas Ecuador, Paraguay, Bolivia and Panama, are stillamong the least competitive countries.
Middle East and North Arica
Israel was the top perormer in the Middle East and
North Arica, ollowed by urkey (see able 10.3).aking advantage o a 1995 customs union agreement
with the European Union, urkey increased its indus-trial production or export and also beneted romEU oreign investment. By 2008, urkish manuac-tured exports were $118.2 billion, and manuacturesexports per capita had grown 71 percent since 2005.
unisia, the top industrial perormer in NorthArica, ranks 55th in the world, with considerablemanuacturing activity in clothing and ootwear, car
parts and electric machinery. Manuactured exportsto the European Union grew 17 percent a year over2004–2008. In 2008, unisia completed dismantling taris on industrial products and entered a ree-tradeagreement with the European Union. Egypt improvedits global industrial perormance by 11 places, whileMorocco maintained its position and Sudan lost 23
places.
South and Central Asia
India remains the most industrialized economy inSouth and Central Asia, ollowed by Pakistan (seeable 10.3). Bangladesh, the third most industrial-ized, gained six positions globally, moving rom 75thin 2005 to 69th in 2009. More than 90 percent o
Bangladesh’s exports are manuactures, with garmentsbeing the high earner. Pakistan’s position in the globalCIP index also improved, while the other economiesin the region either maintained their positions or lostthem.
Sub-Saharan Arica
Sub-Saharan Arica has been slow to industrialize. In
2008, its MVA per capita (excluding South Arica) was $34, or one-thirteenth the developing economyaverage. Economies in the region appear to be de-industrializing, as the region’s share o MVA in GDPdropped rom 13.9 percent in 2000 to 11.4 percentin 2009. Its share in world MVA is also alling, a signthat economies are unable to withstand increasing international competition. Its share o manuacturedexports in total exports remains the lowest, with econ-omies still relying on natural resource exports.
Swaziland gained 14 places in 2009, becoming themost industrialized economy in the region, ahead o South Arica and Mauritius (see able 10.3). Swazilandrecorded good growth in MVA per capita. Mauritiusremains third despite losing 14 positions globally. BothSwaziland and Mauritius have boosted their manu-actured exports through preerential access to theUS textiles and apparel market (under the AricanGrowth and Opportunity Act) and the EU sugar mar-ket. Although the ending o such trade preerences has
threatened the vigour o the export sector, these econo-mies have introduced reorms to boost growth.Nigeria, West Arica’s largest economy, lost 22
positions globally between 2005 and 2009 and alsoslid back within sub-Saharan Arica. Several othereconomies also slipped, including Niger (–10) andZimbabwe (–15). By contrast, Ethiopia and Ugandamoved up seven positions globally, thanks to strong export perormance.
The Competitive Industrial Perormance
index and energy intensity
Te recent ocus on energy intensity has been drivenby environmental concerns – air pollution, acid rain,ossil uel depletion, global warming and climate

8/2/2019 Unido Full Report eBook
http://slidepdf.com/reader/full/unido-full-report-ebook 189/259
170
B E N C hMA r K I N GI ND U S T r
I A l P E r F Or MA N C E
0
“ East Asia and the Pacic perormed
best on the CIP Index in 2009, ollowed by
Europe, the Middle East and North Arica,
Latin America and the Caribbean, South and
Central Asia, and sub-Saharan Arica
Region and economy 2005 2009
East Asia and the Pacifc
Singapore 1 1
China 2 2
Taiwan Province o China 3 3
Hong Kong SAR China 4 4
Thailand 6 5
Malaysia 5 6
Philippines 7 7
Indonesia 8 8
Viet Nam 9 9
Macao SAR China 10 10
Cambodia 11 11
Fiji 12 12
Mongolia 13 13
Developing Europe
Slovenia 1 1
Malta 2 2
Poland 3 3
Estonia 4 4
Romania 6 5
Lithuania 5 6
Latvia 9 7
Bulgaria 7 8
Russian Federation 8 9
Macedonia, Former Yugoslav Rep. o 10 10
Albania 11 11
Moldova, Rep. o 12 12
Latin America and the Caribbean
Mexico 1 1
Costa Rica 3 2
Brazil 2 3
Argentina 4 4
El Salvador 5 5
Barbados 6 6
Bahamas 7 7
Trinidad and Tobago 8 8
Jamaica 12 9
Colombia 9 10
Venezuela, Bolivarian Rep. o 11 11
Uruguay 13 12
Chile 10 13
Region and economy 2005 2009
St. Lucia 14 14
Honduras 15 15
Peru 16 16
Ecuador 18 17
Paraguay 17 18
Bolivia, Plurinational State o 19 19
Panama 20 20
Middle East and North Arica
Israel 1 1
Turkey 2 2
Jordan 4 3
Georgia 6 4
Cyprus 3 5
Tunisia 5 6
Morocco 7 7
Qatar 8 8
Egypt 10 9
Kuwait 12 10
Lebanon 9 11
Syrian Arab Republic 15 12
Palestinian Territories 11 13
Oman 14 14
Yemen 18 15
Algeria 17 16
Azerbaijan 16 17
Sudan 13 18
South and Central Asia
India 1 1
Pakistan 2 2
Bangladesh 3 3
Iran, Islamic Rep. o 4 4
Sri Lanka 5 5
Nepal 6 6
Kyrgyzstan 7 7
Sub-Saharan Arica
Swaziland 3 1
South Arica 1 2
Mauritius 2 3
Senegal 4 4
Botswana 6 5
Gambia, The 12 6
Table 10.3
Ran o developing economies on the Competitive Industrial Perormance index, by region,2005 and 2009

8/2/2019 Unido Full Report eBook
http://slidepdf.com/reader/full/unido-full-report-ebook 190/259
171
B E N C hMA r K I N GI ND U S T r
I A l P E r F Or MA N C E
10
“ Economies with low energy intensity,
such as Germany, Japan and the United States,
are also the best industrial perormers
change. Increased competitive pressure, high andunstable energy prices and tightening environmentalregulations also make energy intensity a key issue orindustrial competitiveness.
o explore the relationship between industrial perormance and energy intensity, the CIP index wasregressed on manuacturing energy intensity or 104economies in 2008.5 Te results suggest that energyintensity is inversely correlated with industrial peror-mance (Figure 10.1).6
Economies with low energy intensity, such asGermany, Japan and the United States, are also thebest industrial perormers. Energy costs as well asenergy-conserving technologies may explain energy
eciency in these economies. Japan, the best indus-trial perormer in 2005, leads in energy-saving tech-nologies in steel, cement and reneries, thus soen-ing the impact on production o low energy-resourceendowments and price volatility o imported energysources. Japan plans to increase energy eiciency
Region and economy 2005 2009
Rwanda 10 7
Côte d’Ivoire 5 8
Niger 9 9
Madagascar 13 10
Uganda 15 11
Zimbabwe 8 12
Kenya 11 13
Cameroon 14 14
Region and economy 2005 2009
Nigeria 7 15
Eritrea 16 16
Ghana 17 17
Tanzania, United Rep. o 19 18
Ethiopia 21 19
Malawi 18 20
Gabon 20 21
Source: UNIDO.
Table 10.3 (continued)
Ran o developing economies on the Competitive Industrial Perormance index, by region,2005 and 2009
0 2 4 6 8
C o m p e t i t i v e I n d u s t r i a l P e r f o r m a n c e i n d e x
Energy intensity (tonnes of oil equivalent per $1,000 MVA)
MongoliaGhana
Nigeria
Gabon
Qatar
RussianFederation
India Iran, Islamic Rep. ofIndonesiaBrazil
Turkey
PanamaSri Lanka Algeria
Mexico
United KingdomTaiwan Province of China
Sweden
Korea, Rep.
ChinaGermany
United States
Japan
Singapore
Azerbaijan0.00
0.25
0.50
0.75
1.00Developing economiesDeveloped economiesPredicted
Figure 10.1
Lining the Competitive Industrial Perormance index with manuacturing energy intensity, 2008
Source: UNIDO; IEA 2010d.

8/2/2019 Unido Full Report eBook
http://slidepdf.com/reader/full/unido-full-report-ebook 191/259
172
B E N C hMA r K I N GI ND U S T r
I A l P E r F Or MA N C E
0
“ There are large variations in industrial
perormance and energy intensity, with economies
such as China and Singapore having relatively
high industrial perormance and low energy
intensity, and others such as Ghana, Mongolia
and Nigeria having relatively low industrial
perormance and high energy intensity
30 percent by 2030 and is investing heavily in innova-tive technologies to maintain its lead in this eld.
here are large variations in industrial peror-mance and energy intensity, with economies such asChina and Singapore having relatively high industrial
perormance and low energy intensity, and others suchas Ghana, Mongolia and Nigeria having relatively lowindustrial perormance and high energy intensity.
Developing economies generally all into one o threegroups, with India (CIP index o 0.20 and energyintensity o 1.12) as a “threshold” in Figure 10.1.Indeed, the vertical (1.12) and horizontal (0.2) linesthrough India’s coordinates in the gure divide thegraph area into our zones; there are no economies inthe upper right quadrant o the graph.
Economies such as Gabon and Nigeria, withenergy intensity higher than India’s, typically havelower industrial perormance. heir relatively low
levels o industrialization leave considerable roomor energy-eciency improvements as they developtheir industrial sector. In addition, economies in thebottom right quadrant o the graph such as Iran andQatar are oil-producing economies that subsidizeoil. Since energy price is a key determinant o energyintensity, subsidies may provide strong disincentivesor energy savings.
Several economies with energy intensity lowerthan India’s have higher industrial perormance,
including Indonesia, Mexico and urkey (upperle quadrant in Figure 10.1). In this second group,economies such as Singapore and aiwan Provinceo China have energy intensity and industrial per-ormance comparable to those o developed econo-mies. Finally, a third group, which includes Algeria,Panama and Sri Lanka, has low energy intensity andlow industrial perormance (bottom le quadrant),suggesting that other actors may also play a role inexplaining industrial perormance (although notinvestigated here).
Large developing economies such as Brazil, Chinaand India rank in the top hal in industrial peror-mance (6th, 40th and 43rd, respectively) and energyintensity.7 Te Russian Federation is in the bottom
hal in industrial perormance and the top hal inenergy intensity. In 2008, those our economies wereamong the top six energy consumers in the world,likely due to increased production o energy-intensive
products (such as iron, cement and steel) to cope with rapid inrastructure growth – in housing andin metal-intensive industries such as motor vehicles.However, these economies are also improving their
energy eciency.An interesting question is whether the causal
relationship runs rom industrial perormance toenergy eciency, the other way around or in bothdirections. Most developed economies cluster at thetop or industrial perormance and the bottom orenergy intensity, indicating greater energy-eciencymaturity than developing economies. Te averageenergy intensity o developed economies in the sam-
ple is 0.26 tonne o oil equivalent per $1,000 MVA,
less than a quarter the average or developing econ-omies (1.17 tonnes o oil equivalent). By economy,Ireland and Switzerland have the lowest energyintensity, at 0.07 tonne o oil equivalent per $1,000MVA; Iceland, the highest (0.94 tonne o oil equiva-lent). As noted in Chapter 2, total industrial energyintensity tends to be high at early stages o indus-trialization but decreases at later stages o industri-alization due to technological improvements in theuse o energy, structural changes away rom energy-
intensive sectors, production shis towards moreskill-intensive industries and increasing use o high-quality uels. Tis view suggests that a higher indus-trialization stage and perormance precedes lowerenergy intensity. But this may be explained by theact that most developed economies industrialized
without the current environmental concerns andconstraints, beore moving rom “brown” to “green”industries.
he current situation is dierent. Economiesmight have to choose deliberate policies to lowerenergy intensity in order to promote industrial per-ormance. At the rm level, lower energy intensity,resulting rom reduced use o a costly input (energy),might save money and increase productivity, and

8/2/2019 Unido Full Report eBook
http://slidepdf.com/reader/full/unido-full-report-ebook 192/259

8/2/2019 Unido Full Report eBook
http://slidepdf.com/reader/full/unido-full-report-ebook 193/259

8/2/2019 Unido Full Report eBook
http://slidepdf.com/reader/full/unido-full-report-ebook 194/259
175
Annexes

8/2/2019 Unido Full Report eBook
http://slidepdf.com/reader/full/unido-full-report-ebook 195/259
176
Te data span 1990–2008 and cover as many econo-mies as possible, subject to data availability, or indus-try as a whole and are disaggregated by manuacturing sector (International Standard Industry Classication[ISIC] 15–37). he economies were classiied by
UNIDO region and income.Real-value manuacturing value added data were
obtained rom UNIDO’s International Yearbook o Industrial Statistics 2010 and presented in 2000 USdollars. INDSA 2 ISIC Revision 3 was the primarysource o value added data. Te Index o IndustrialProduction was also obtained rom Revision 3 and wasused to convert the nominal value-added data into real
values in 2000 US dollars or any year X, as ollows:
VA yrX = VA 2000 × IIP yrX
IIP 2000 where VA 2000 and IIP 2000 are the 2000 (base year) value added and Index o Industrial Production. Forany other year, the value added and Index o IndustrialProduction are reerred to by VA yrX and IIP yrX.
Industrial energy consumption data or bothaggregated and disaggregated levels came rom theIEA databases o extended energy balances or OECDand non-OECD countries (IEA 2010c).
While UNIDO’s manuacturing value added
data are reported according to ISIC Revision 3, IEA’senergy data are reported according to a classicationcloser to Revision 2. Annex 3 matches sector dataor energy and manuacturing value added to enable
cross-database comparisons. Tree problem areas wereidentied:• Manuacturing sector coke, reined petroleum
products and nuclear uel (ISIC code 23) was notlisted under the industry sector classication o
IEA data. It was listed under “transormation andenergy.” Te dierence between the two is that theenergy sector reports energy used as uel to powerthe manuacturing process, while the transorma-tion sector reports ossil uels used as raw mate-rial input to a manuacturing process. According to the denition o energy intensity used in thisreport (the unit o energy consumed [as uel] perunit o value added produced), only energy sectorand nal consumption need to be included. Fossil
uel use as raw material input and eedstock use inthe petrochemical sector were thus not included inthe energy consumption gures.
• Blast urnace in the energy sector has been allo-cated to the iron and steel sector. Coke ovensrom the energy sector were allocated hal andhal to iron and steel (ISIC code 27) and to coke,rened petroleum products and nuclear uel (ISICcode 23).
• Te IEA data treat recycling as part o the manu-
acturing sector and include energy consumptionby the recycling sector under “non-speciied.”However, no value added data were available orthe recycling sector in INDSA 2.
Annex 1
Energy intensity data
and methodology

8/2/2019 Unido Full Report eBook
http://slidepdf.com/reader/full/unido-full-report-ebook 196/259
177
Te INDSA 2 ISIC Revision 3 dataset or 2010is used or value added (UNIDO 2010) and theInternational Energy Agency (IEA) Extended WorldEnergy Balances or 2009 is used or energy consump-tion (IEA 2010c). O the initial 64 economies 62 were
investigated by Cantore and Fokeer (2010). o beselected, economies had to:• Be covered by IEA and INDSA data.• Have at least ve years o data available in the IEA
and INDSA datasets.• Have data or at least 5 o 11 IEA sectors. As the
analysis includes structural composition, countriesor which this component is relevant were chosen.Te data were then cleaned by eliminating rom
the dataset sectors o economies with inconsistencies
(or example, a sector with 0 or value added and a positive value or energy consumption) and outliers.Sectors with temporally inconsistent data were alsoexcluded (or example, 0 value or the periods 0 . . . t –1and a positive value at time t ).
Te rst step was to calculate energy intensity oreach economy as a ratio o energy consumption (intonnes o oil equivalent, toe) to value added. Energyintensity is expressed as toe per $1,000 manuacturing
value added (in 2000 international dollars).
Next, the Fisher Ideal Index technique wasapplied, based on the Laspeyres and Paasche Indices.Te Laspeyres Index is expressed as ollows:
Lstr =∑iS i,t I i,0 and Le =
∑iS i,0 I i,t∑iS i,0Ii,0 ∑iS i,0 I i,0
where Lstr is the Laspeyres structural eect, Le is theLaspeyres energy eciency, S is the share o sector i intotal value added in time t and I is energy intensity o sec-tor I in time t. Te Paasche Index is expressed as ollows:
P str =∑iS i,t I i,t and P e =
∑iS i,t I i,t∑iS i,0Ii,t ∑iS i,t I i,0
where P str is the Paasche structural eect and P e is thePaasche energy-eciency component.
Te overall Fisher Ideal Index is calculated as ollows: FII = ( Lstr × P str)
× ( Le × P e )
where the Fisher structural eect, SR, is ( Lstr × P str),and the Fisher technical energy-eciency eect, EC, is ( Le × P e )
.o express the total change in energy intensity as
the sum o the structural eect and the Fisher energy-eiciency eect (instead o a product), log meanDivisia Index was applied as ollows:
Annex 2
Decomposition data
and methodology

8/2/2019 Unido Full Report eBook
http://slidepdf.com/reader/full/unido-full-report-ebook 197/259
178
Annex 3
Energy and manuacturing
value added sector data
Sector used or analysis Energy data
Manuacturing value added data(International Standard IndustrialClassifcation Revision 3)
Food and tobacco Food and tobacco (FOODPRO) 15 (ood and beverages)
16 (tobacco) Texti le and leather Texti le and leather (TEXTILES) 17 (textiles); 18 (wear ing apparel;
dressing and dyeing o ur); 19 (dressingo leather; manuacture o luggage,handbags, saddlery, harness andootwear)
Wood and wood products Wood and wood products (WOODPRO) 20 (wood and o products o wood andcork, except urniture; manuacture o articles o straw and plaiting materials)
Paper, pulp and printing Paper, pulp and printing (PAPERPRO) 21 (paper and paper products);22 (publishing, printing and reproductiono recorded media)
Petrochemicals Petroleum reneries (EREFINER)
Nuclear industry (ENUC)
50-percent coke ovens (ECOKEOVS)
23 (coke, rened petroleum products,nuclear)
Chemicals and chemical products Chemical and petrochemical romindustry sector (CHEMICAL)
Patent uel plants (EPATFUEL)
Charcoal production plants(ECHARCOAL)
24 (chemicals and chemical products)
Non-metallic minerals Non-metallic minerals (NONMET) 26 (other non-metallic mineral products)
Metals Non-errous metals (NONFERR)
Iron and steel (IRONSTL)
Blast urnaces (EBLASTFUR)
50-percent coke ovens (ECOKEOVS)
27 (basic metals)
Machinery Machinery (MACHINE) 28 (abricated metal products,except machinery and equipment);29 (machinery and equipment n.e.c.);
30 (oce, accounting and computingmachinery); 31 (electrical machinery andapparatus n.e.c.); 32 (radio, televisionand communication equipment andapparatus)
Transport equipment Transport equipment (TRANSEQ) 34 (motor vehicles, trailers and semi-trailers); 35 (other transport equipment)
Non-specied industry Non-specied industry (INONSPEC) 25 (rubber and plastics products);33 (medical, precision and opticalinstruments, watches and clocks);36 (urniture; manuacturing n.e.c.).
Source: UNIDO.
Table A3.1
Correspondence between energy data and manuacturing value added data by sector

8/2/2019 Unido Full Report eBook
http://slidepdf.com/reader/full/unido-full-report-ebook 198/259
179
Annex 4
Economies included in the
energy-intensity analysis
Developedeconomies
Developing economies
High incomeUppermiddle income
Lowermiddle income Low income
Australia* Bahrain Algeria Albania Bangladesh
Austria* Brunei Darussalam Argentina* Angola Benin
Belgium* Croatia* Belarus Armenia* Cambodia
Canada* Cyprus* Bosnia and Herzegovina Azerbaijan* Congo, Dem. Rep. o
Czech Republic* Estonia* Botswana Bolivia, PlurinationalState o
Ethiopia
Denmark* Hong Kong SAR China Brazil* Cameroon Eritrea
Finland* Israel* Bulgaria* China* Ghana
France* Kuwait Chile* Congo Haiti
Germany* Malta Colombia* Côte d’Ivoire* Kenya
Greece* Oman Costa Rica* Ecuador Korea, Dem. People’sRep. o
Hungary* Qatar Cuba Egypt Kyrgyzstan*
Iceland Saudi Arabia Dominican Rep. El Salvador Mozambique
Ireland* Singapore Gabon* Georgia Myanmar
Italy* Slovenia* Jamaica Guatemala Nepal
Japan* Taiwan Province o China*
Kazakhstan* Honduras Senegal
Korea, Rep. o* Trinidad and Tobago Lebanon India* Tajikistan
Luxembourg United Arab Emirates Latvia* Indonesia* Tanzania, United Rep. o
Netherlands* Libyan Arab Jamahiriya Iran, Islamic Rep. o Togo
New Zealand* Lithuania* Jordan Uzbekistan
Norway* Macedonia, Former Yugoslav Rep. o*
Moldova, Rep. o* Viet Nam
Portugal* Malaysia Mongolia YemenSlovakia* Mexico* Morocco* Zambia
Spain* Namibia Nicaragua Zimbabwe
Sweden* Panama Nigeria
Switzerland* Peru Pakistan
United Kingdom* Poland* Paraguay
United States* Romania* Philippines*
Russian Federation* Sri Lanka
Serbia Sudan
South Arica* Syrian Arab Rep.
Turkey* Thailand*
Uruguay Tunisia* Venezuela, Bol. Rep. o* Turkmenistan
Ukraine*
* Meets the criteria or decomposition analysis.
Source: UNIDO.
Table A4.1
All economies, by income group

8/2/2019 Unido Full Report eBook
http://slidepdf.com/reader/full/unido-full-report-ebook 199/259
180
E C ON OMI E S I N C l UD E D I N
T hE E NE r GY -I NT E N S I T Y A NA l Y S I S
A4
East Asia andthe Pacifc
DevelopingEurope
Latin Americaand theCaribbean
Middle Eastand North
AricaSouth andCentral Asia
Sub-Saharan Arica
BruneiDarussalam
Albania Argentina* Algeria Azerbaijan* Angola
Cambodia Bosnia andHerzegovina
Bolivia,PlurinationalState o
Armenia* Bangladesh Benin
China* Bulgaria* Brazil* Bahrain India* Botswana
Hong Kong SARChina
Belarus Chile* Cyprus* Kazakhstan* Cameroon
Taiwan Provinceo China*
Croatia* Colombia* Egypt Kyrgyzstan* Congo
Indonesia* Estonia* Costa Rica* Georgia Nepal Congo, Dem. Rep. o
Korea, Dem.People’s Rep. o
Latvia* Cuba Iran, IslamicRep. o
Pakistan Côte d’Ivoire*
Malaysia Lithuania* Dominican Rep. Israel* Sri Lanka Eritrea
Mongolia Macedonia, Former Yugoslav Rep. o*
Ecuador Jordan Tajikistan Ethiopia
Myanmar Malta El Salvador Kuwait Turkmenistan Gabon*
Philippines* Moldova, Rep. o* Guatemala Lebanon Uzbekistan Ghana
Singapore Poland* Haiti Libyan ArabJamahiriya
Kenya
Thailand* Romania* Honduras Morocco* Mozambique
Viet Nam Russian Federation* Jamaica Oman Namibia
Serbia Mexico* Qatar Nigeria
Slovenia* Nicaragua Saudi Arabia Senegal
Ukraine* Panama Sudan South Arica*
Paraguay Syrian Arab Rep. Tanzania, UnitedRep. o
Peru United ArabEmirates
Togo
Trinidad and Tobago
Tunisia* Zambia
Uruguay Turkey* Zimbabwe
Venezuela,Bol. Rep. o*
* Meets the criteria or decomposition anal ysis.
Source: UNIDO.
Table A4.2
Developing economies, by region

8/2/2019 Unido Full Report eBook
http://slidepdf.com/reader/full/unido-full-report-ebook 200/259
181
Annex 5
Industrial energy intensity
Economy 1990 2000 2008
Albania 1.202 0.556 0.204
Algeria 0.473 0.535 0.750
Angola 6.906 8.457 2.629
Argentina 0.295 0.333 0.281
Armenia 2.327 0.900 1.440
Australia 0.521 0.494 0.435
Austria 0.214 0.190 0.167
Azerbaijan 5.082 8.046 2.667
Bahrain 3.315 1.601 1.484
Bangladesh 0.287 0.281 0.350
Belarus 2.788 1.564 0.771
Belgium 0.384 0.376 0.298
Benin 2.143 1.675 1.776Bolivia,Plurinational State o
0.723 0.957 0.791
Bosnia and Herzegovina 7.184 1.191 0.833
Botswana 0.962 0.089 0.194
Brazil 0.580 0.658 0.680
Brunei Darussalam 0.127 0.117 0.962
Bulgaria 1.863 1.913 1.055
Cambodia 0.515a 0.266 0.156
Cameroon 0.651 0.663 0.375
Canada 0.484 0.367 0.365
Chile 0.261 0.402 0.360
China 2.218 0.801 0.791
Colombia 0.412 0.577 0.484
Congo 1.217 1.938 1.347
Congo, Dem. Rep. o 4.758 19.049 17.736
Costa Rica 0.300 0.155 0.196
Côte d’Ivoire 0.997 0.896 2.091
Croatia 0.389 0.395 0.313
Cuba 1.647 0.861 0.844
Cyprus 0.350 0.570 0.425
Czech Republic 1.433 0.726 0.364
Denmark 0.140 0.125 0.129
Dominican Republic 0.405 0.288 0.211
Ecuador 0.558 0.856 0.510
Economy 1990 2000 2008
Egypt 1.215 0.712 0.655
El Salvador 0.256 0.240 0.239
Eritrea 6.441b 1.852 3.898
Estonia 2.934 0.612 0.436
Ethiopia 1.989 2.238 3.275
Finland 0.565 0.426 0.306
France 0.230 0.193 0.179
Gabon 1.731 1.936 2.532
Georgia 2.075 0.945 0.386
Germany 0.197 0.149 0.129
Ghana 4.975 5.096 5.185
Greece 0.341 0.365 0.238
Guatemala 0.365 0.436 0.247Haiti 0.614 1.620 1.947
Honduras 0.890 0.590 0.313
Hong Kong SAR China 0.084 0.229 0.403
Hungary 1.051 0.381 0.252
Iceland 0.463 0.596 0.937
India 2.022 1.474 1.117
Indonesia 0.787 0.699 0.702
I ran, Islamic Rep. o 2.124 1.694 1.467
Ireland 0.143 0.087 0.071
Israel 0.163 0.109 0.062
Italy 0.226 0.199 0.200Jamaica 0.309 0.703 0.978
Japan 0.123 0.110 0.087
Jordan 0.829 0.806 0.481
Kazakhstan 4.760 4.291 3.378
Kenya 2.932 3.172 2.932
Korea, Dem. People’sRep. o
5.930 6.131 4.419
Korea, Rep. o 0.436 0.341 0.235
Kuwait 1.410 1.961 0.701
Kyrgyzstan 4.921 1.872 2.324
Latvia 0.829 0.570 0.460
Lebanon 0.065 0.465 0.288
Libya 1.039 1.668 1.387
Table A5.1
Industrial energy intensity by economy, 1990, 2000 and 2008 (tonnes o oil equivalent per US$1,000o manuacturing value added)
(continued)

8/2/2019 Unido Full Report eBook
http://slidepdf.com/reader/full/unido-full-report-ebook 201/259
182
I ND U S T r I A l E NE r GY I NT E N S I T Y
A5
Economy 1990 2000 2008
Lithuania 1.416 0.377 0.248
Luxembourg 1.241 0.459 0.399
Macedonia, Former Yugoslav Rep. o 0.685 0.916 0.899
Malaysia 0.537 0.478 0.492
Malta 0.038c 0.057 0.075
Mexico 0.416 0.242 0.304
Moldova, Rep. o 1.945 1.492 1.361
Mongolia 13.167 10.692 7.268
Morocco 0.416 0.384 0.356
Mozambique 8.191 4.822 3.177
Myanmar 4.589 2.182 1.245
Namibiad 0.045a 0.035 0.010
Nepal 0.560 0.799 0.898
Netherlands 0.297 0.281 0.221
New Zealand 0.456 0.367 0.461
Nicaragua 0.884 0.595 0.517
Nigeria 6.366 6.636 4.433
Norway 0.403 0.430 0.325
Oman 1.691 1.136 1.214
Pakistan 1.309 1.224 0.953
Panama 0.176 0.541 0.416
Paraguay 1.066 1.246 1.291
Peru 0.375 0.439 0.335
Philippines 0.400 0.407 0.363
Poland 2.747 0.709 0.342
Portugal 0.374 0.364 0.313
Qatar 1.735 2.333 2.305
Romania 4.439 1.895 1.095
Russian Federation 2.607 2.798 1.885
Saudi Arabia 0.787 0.867 0.660
Senegal 0.985 1.019 0.968
Economy 1990 2000 2008
Serbia 1.152 1.119 1.551
Singapore 0.089 0.076 0.051
Slovakia 0.986 0.763 0.281
Slovenia 0.326 0.296 0.216
South Arica 1.198 0.964 0.803
Spain 0.288 0.270 0.256
Sri Lanka 0.785 0.719 0.664
Sudan 10.600 6.312 3.878
Sweden 0.452 0.304 0.206
Switzerland 0.081 0.080 0.070
Syrian Arab Rep. 1.179 3.169 0.992
Taiwan Province o China 0.289 0.291 0.193
Tajikistan 1.597 1.523 1.041
Tanzania, United Rep. o 3.541 4.074 3.801
Thailand 0.688 0.524 0.478
Togo 4.691 7.976 6.302
Trinidad and Tobago 3.881 3.135 3.251
Tunisia 0.791 0.510 0.320
Turkey 0.360 0.378 0.219
Turkmenistan 8.036 0.745 0.639
Ukraine 6.926 8.688 3.280
United Arab Emirates 3.375 1.773 1.134
United Kingdom 0.172 0.170 0.152
United States 0.302 0.225 0.175
Uruguay 0.160 0.236 0.253
Uzbekistan 1.295 7.365 6.272
Venezuela, Bol. Rep. o 0.970 0.777 0.710 Viet Nam 1.118 0.937 0.928
Yemen 1.442 1.344 1.503
Zambia 7.335 6.972 5.177
Zimbabwe 1.491 1.222 2.121
a. Data are or 1995.
b. Data are or 1992.
c. Data are or 1991.
d. Data are or non-specied industry only.
Source: UNIDO 2010e,; IEA 2010c.
Table A5.1 (continued)
Industrial energy intensity by economy, 1990, 2000 and 2008 (tonnes o oil equivalent per $1,000 omanuacturing value added)

8/2/2019 Unido Full Report eBook
http://slidepdf.com/reader/full/unido-full-report-ebook 202/259
183
Annex 6
How Competitive Industrial
Perormance index rankings changewhen new indicators are added
wo additional indicators were added to theCompetitive Industrial Perormance index: the shareo an economy’s manuacturing value added in worldmanuacturing value added, which measures theimpact o an economy in world manuacturing pro-
duction, and the share o an economy’s manuacturedexports in world manuactured exports, which meas-ures an economy’s ability to capture more rom inter-national trade.
With the addition o the new indicators, Chinarose 23 positions (rom 29th to 6th) compared withits position using the old methodology, ollowed bythe Russian Federation (19 positions, rom 76th to57th), the United States (9 positions, rom 11th to2nd), India (8 positions) and Italy (8 positions). Te
main losers were Slovenia (–7), Luxembourg (–6),Austria (–6) and Slovakia (–6).
Small economies are avoured when only per capitaindicators are used, while large economies are avoured
when world market shares are used (Figures A6.1 and
A6.2). Including these indicators penalized smallexport-oriented economies such as Slovenia, Austriaand Slovakia and avoured large economies suchas China, India, Brazil, the United States and theRussian Federation (able A6.1).
Overall, a third o the economies have no changein ranking, while almost three-ourths moved two
positions or ewer. Tere is almost no change at thebottom, and the lowest 25 economies moved at mostone position.
0 50 100 150
R a n k
i n g b y m a n u f a c t u r i n g v a l u e a d d e d p e r c a p i t a
Ranking by share in global manufacturing value added
Ireland
Singapore
SwitzerlandUnited States
Japan
Germany Luxembourg AustriaUnited Kingdom
France
Slovenia Australia
Czech Republic
Argentina
CyprusCosta RicaChileBrazil
El Salvador
China Russian FederationColombia
BarbadosBulgaria
Iran, Islamic Rep.
IndonesiaMorocco
Ecuador
Albania Gabon
BotswanaSri Lanka BoliviaCameroon Algeria
India CambodiaBangladesh Azerbaijan
Uganda
Ethiopia
0
50
100
150
Figure A6.1
Small and large economy bias, manuacturing value added, 2005
Source: UNIDO.

8/2/2019 Unido Full Report eBook
http://slidepdf.com/reader/full/unido-full-report-ebook 203/259
184
h OW C OMP E T I T I V E I ND U S T r I A l P E r F Or MA N C E I ND E X r A NK I N G S C hA N GE WhE NNE WI ND I C A T Or S A r E A D D E D
A6
Economy Old Revised Dierence
China 29 6 23
Russian Federation 76 57 19
United States 11 2 9
Italy 25 17 8
India 50 42 8
France 18 13 5
United Kingdom 20 15 5
Canada 24 19 5
Brazil 41 37 4
Argentina 53 49 4
Venezuela, Bol. Rep. o 75 71 4
Germany 7 4 3
Spain 31 28 3
Mexico 32 29 3
Tunisia 57 54 3
Iran, Islamic Rep. o 85 82 3
Kuwait 91 88 3
Japan 3 1 2
Indonesia 42 40 2
Australia 48 46 2
Economy Old Revised Dierence
Turkey 34 33 1
Poland 35 34 1
Morocco 60 59 1
Chile 71 70 1
Nigeria 82 81 1
Sri Lanka 87 86 1
Oman 100 99 1
Algeria 116 115 1
Belgium 8 8 0
Korea, Rep. o 9 9 0
Thailand 27 27 0
Portugal 36 36 0
Norway 38 38 0
Greece 52 52 0
Trinidad and Tobago 63 63 0
Viet Nam 72 72 0
Albania 77 77 0
Macao SAR China 78 78 0
Botswana 79 79 0
Uruguay 80 80 0
Table A6.1
Impact o changes in the Competitive Industrial Perormance index methodology on the ranings, 2005
0 50 100 150
R a n k i n g
b y e x p o r t s
p e r c a p i t a
Ranking by share in world exports
0
50
100
150
Singapore
Ireland LuxembourgSwitzerland
Austria
Germany
SloveniaCzech Republic
France
United Kingdom
Japan
United States
Botswana
Australia Cyprus
Chile Costa Rica
Bulgaria
Barbados
GabonRussian Federation
ArgentinaChinaEl Salvador
Brazil
Morocco
Indonesia Sri Lanka AlgeriaColombia
Azerbaijan Albania
CambodiaIran, Islamic Rep.Bolivia
IndiaBangladesh
Cameroon
UgandaEthiopia
Figure A6.2
Small and large economy bias, manuactured exports, 2005
Source: UNIDO.

8/2/2019 Unido Full Report eBook
http://slidepdf.com/reader/full/unido-full-report-ebook 204/259
185
h OW C OMP E T I T I V E I ND U S T r I A l P E r F Or MA N C E I ND E X r A NK I N G S C hA N GE WhE NNE WI ND I C A T Or S A r E A D D E D
A6
Economy Old Revised Dierence
Honduras 92 92 0
Cambodia 93 93 0
Fiji 94 94 0
Sudan 95 95 0
Peru 96 96 0
Kenya 97 97 0
Gambia, The 98 98 0
Kyrgyzstan 101 101 0
Syrian Arab Rep. 102 102 0
Cameroon 103 103 0
Paraguay 104 104 0
Uganda 105 105 0
Azerbaijan 106 106 0
Eritrea 107 107 0
Ecuador 108 108 0
Ghana 109 109 0
Malawi 110 110 0Bolivia, PlurinationalState o 111 111 0
Mongolia 112 112 0
Panama 113 113 0
Tanzania, United Rep. o 114 114 0
Gabon 117 117 0
Ethiopia 118 118 0
Hong Kong SAR China 13 14 –1
Denmark 22 23 –1
Czech Republic 23 24 –1
Cyprus 43 44 –1
South Arica 44 45 –1
Barbados 54 55 –1
Mauritius 55 56 –1
Swaziland 61 62 –1
Lebanon 64 65 –1
Macedonia, Former Yugoslav Rep. o 65 66 –1
Pakistan 66 67 –1
Senegal 67 68 –1
Colombia 68 69 –1
Zimbabwe 83 84 –1
Niger 84 85 –1
Economy Old Revised Dierence
Moldova, Rep. o 86 87 –1
St. Lucia 88 89 –1
Rwanda 89 90 –1
Nepal 90 91 –1
Madagascar 99 100 –1
Yemen 115 116 –1
Singapore 1 3 –2
Taiwan Province o China 10 12 –2
Netherlands 14 16 –2
Philippines 30 32 –2
Estonia 33 35 –2
Costa Rica 37 39 –2
Lithuania 39 41 –2
Romania 45 47 –2
New Zealand 46 48 –2
Jordan 49 51 –2
Bulgaria 51 53 –2Georgia 56 58 –2
Bahamas 58 60 –2
Latvia 59 61 –2
Qatar 62 64 –2
Bangladesh 73 75 –2
Jamaica 74 76 –2
Palestinian Territories 81 83 –2
Ireland 2 5 –3
Switzerland 4 7 –3
Malaysia 17 20 –3
Malta 28 31 –3
Iceland 40 43 –3
El Salvador 47 50 –3
Egypt 70 73 –3
Hungary 21 25 –4
Israel 26 30 –4
Sweden 5 10 –5
Finland 6 11 –5
Côte d’Ivoire 69 74 –5
Austria 12 18 –6
Slovakia 15 21 –6
Luxembourg 16 22 –6
Slovenia 19 26 –7
Source: UNIDO.
Table A6.1 (continued)
Impact o changes in the Competitive Industrial Perormance index methodology on the ranings, 2005
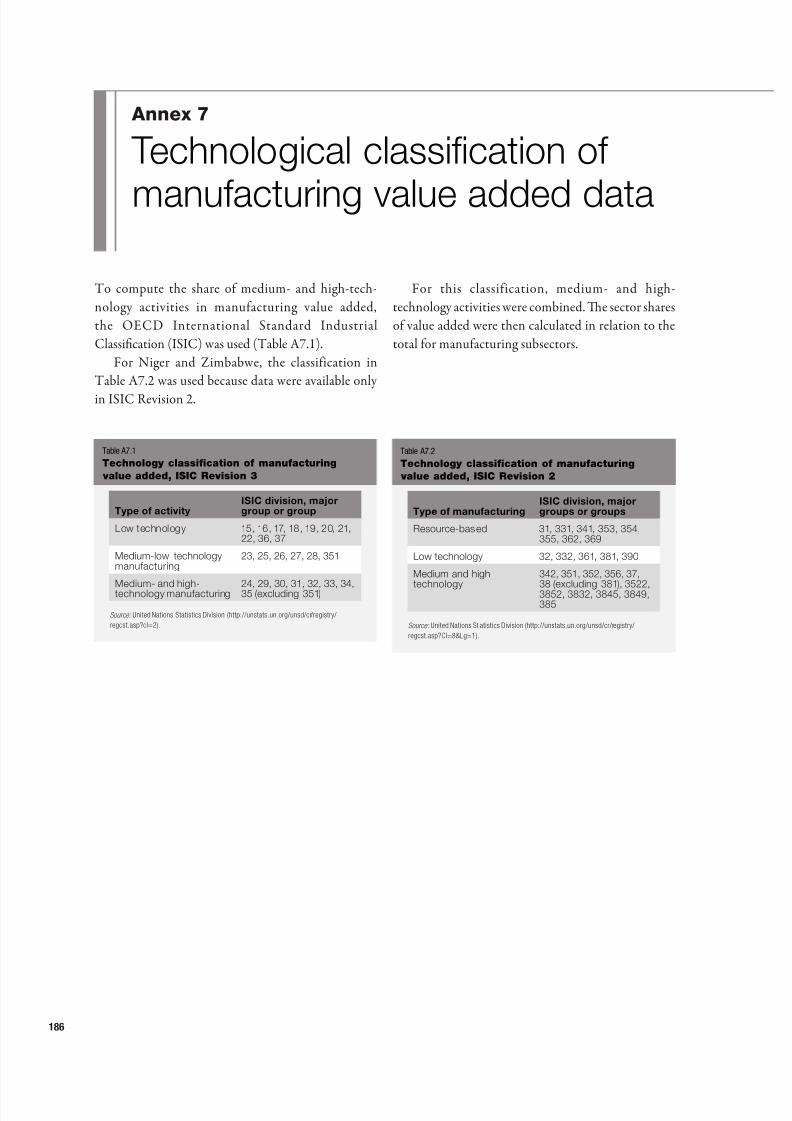
8/2/2019 Unido Full Report eBook
http://slidepdf.com/reader/full/unido-full-report-ebook 205/259
186
o compute the share o medium- and high-tech-nology activities in manuacturing value added,the OECD International Standard IndustrialClassication (ISIC) was used (able A7.1).
For Niger and Zimbabwe, the classiication in
able A7.2 was used because data were available onlyin ISIC Revision 2.
For this classiication, medium- and high-technology activities were combined. Te sector shareso value added were then calculated in relation to thetotal or manuacturing subsectors.
Annex 7
Technological classication o
manuacturing value added data
Type o manuacturingISIC division, majorgroups or groups
Resource-based 31, 331, 341, 353, 354,355, 362, 369
Low technology 32, 332, 361, 381, 390
Medium and hightechnology
342, 351, 352, 356, 37,38 (excluding 381), 3522,3852, 3832, 3845, 3849,385
Source: United Nations St atistics Division (http://unstats.un.org/unsd/cr/registry/
regcst.asp?Cl=8&Lg=1).
Table A7.2
Technology classication o manuacturing value added, ISIC Revision 2
Type o activityISIC division, majorgroup or group
Low technology 15, 16, 17, 18, 19, 20, 21,22, 36, 37
Medium-low technology
manuacturing
23, 25, 26, 27, 28, 351
Medium- and high-technology manuacturing
24, 29, 30, 31, 32, 33, 34,35 (excluding 351)
Source: United Nations Statistics Division (http://unstats.un.org/unsd/cr/registry/
regcst.asp?cl=2).
Table A7.1
Technology classication o manuacturing value added, ISIC Revision 3

8/2/2019 Unido Full Report eBook
http://slidepdf.com/reader/full/unido-full-report-ebook 206/259
187
Te technological classication o trade is based on theStandard International rade Classication (SIC),Revision 3.
Annex 8
Technological classication
o international trade data
Type o export SITC sections
Resource-based 016, 017, 023, 024, 035, 037, 046, 047, 048, 056, 058, 059, 061, 062, 073, 098, 111, 112,122, 232, 247, 248, 251, 264, 265, 281, 282, 283, 284, 285, 286, 287, 288, 289, 322, 334,335, 342, 344, 345, 411, 421, 422, 431, 511, 514, 515, 516, 522, 523, 524, 531, 532, 551,592, 621, 625, 629, 633, 634, 635, 641, 661, 662, 663, 664, 667, 689
Low technology 611, 612, 613, 642, 651, 652, 654, 655, 656, 657, 658, 659, 665, 666, 673, 674, 675, 676,677, 679, 691, 692, 693, 694, 695, 696, 697, 699, 821, 831, 841, 842, 843, 844, 845, 846,848, 851, 893, 894, 895, 897, 898, 899
Medium technology 266, 267, 512, 513, 533, 553, 554, 562, 571, 572, 573, 574, 575, 579, 581, 582, 583, 591,593, 597, 598, 653, 671, 672, 678, 711, 712, 713, 714, 721, 722, 723, 724, 725, 726, 727,728, 731, 733, 735, 737, 741, 742, 743, 744, 745, 746, 747, 748, 749, 761, 762, 763, 772, 773,775, 778, 781, 782, 783, 784, 785, 786, 791, 793, 811, 812, 813, 872, 873, 882, 884, 885
High technology 525, 541, 542, 716, 718, 751, 752, 759, 764, 771, 774, 776, 792, 871, 874, 881, 891
Source: UN 2011.
Table A8.1Technology classication o exports, SITC Revision 3

8/2/2019 Unido Full Report eBook
http://slidepdf.com/reader/full/unido-full-report-ebook 207/259
188
Annex 9
Data clarications or the
Competitive IndustrialPerormance index, by indicator
2005
Indicator and economy Year used
Share o medium- and high-technology activities in
manuacturing value added Algeria 1996
Argentina 2002
Bahamas 1998
Bangladesh 1998
Barbados 1997
Boliv ia, Plur inational State o 2001
Botswana 1997
Cambodia 2000
Cameroon 2002
Côte d’Ivoire 1997
El Salvador 1998
Fiji 2004
Gabon 1995
Gambia, The 1995
Ghana 2003
Honduras 1996
Jamaica 1996
Kuwait 2001
Lebanon 1998
Malawi 2001
Nepal 2002
Niger 2002
Nigeria 1996
Pakistan 2001
Panama 2001
Paraguay 2002
Rwanda 1999
Senegal 2002
Sri Lanka 2001
St. Lucia 1997
Sudan 2001
Swaziland 1995
Indicator and economy Year used
Switzerland 2003
Syrian Arab Rep. 1995
Taiwan Province o China 1996
Thailand 2002
Uganda 2000
Venezuela, Bol. Rep. o 1998
Viet Nam 2000
Zimbabwe 1995
Exports per capita
Cambodia 2004
Eritrea 2003
Kuwait 2004
Nepal 2003
Nigeria 2003
Share o manuactured exports in total exports
Cambodia 2004
Eritrea 2003
Kuwait 2004
Nepal 2003
Nigeria 2003
Share o medium- and high-technology activities in manuactured exports
Cambodia 2004
Eritrea 2003
Kuwait 2004
Nepal 2003
Nigeria 2003
Share in world manuactured exports
Cambodia 2004
Eritrea 2003
Kuwait 2004
Nepal 2003
Nigeria 2003
Table A9.1
Data years used or computing the Competitive Industrial Perormance index

8/2/2019 Unido Full Report eBook
http://slidepdf.com/reader/full/unido-full-report-ebook 208/259
189
D A T A C l A r I F I C A T I ON S F Or T hE C OMP E T I T I V E I ND U S T r I A l P E r F Or MA N C E I ND E X
,B Y I ND I C A T Or
A92009
Indicator and economy Year used
Manuacturing value added per capita
Macao SAR China 2008
Share o manuacturing value added in GDP
Macao SAR China 2008
Share in world manuacturing value added
Macao SAR China 2008
Share o medium- and high-technology activities in manuacturing value added
Albania 2008
Algeria 1996
Argentina 2002
Australia 2006
Austria 2007
Azerbaijan 2008
Bahamas 1998
Bangladesh 1998
Barbados 1997
Belgium 2007
Botswana 1997
Brazil 2007
Bulgaria 2008
Cambodia 2000
Cameroon 2002
Canada 2007
Chile 2006
China 2007
Colombia 2005
Costa Rica 2008
Côte d’Ivoire 1997
Cyprus 2008
Czech Republic 2007
Denmark 2007
Ecuador 2007
Egypt 2006
El Salvador 1998
Eritrea 2008
Estonia 2008
Ethiopia 2008
Fiji 2004
Indicator and economy Year used
Finland 2007
France 2007
Gabon 1995
Gambia, The 1995
Georgia 2008
Germany 2007
Ghana 2003
Greece 2007
Honduras 1996
Hong Kong SAR China 2008
Hungary 2007
Iceland 2005
India 2007
Indonesia 2007
Iran, Islamic Rep. o 2005
Ireland 2007
Israel 2006
Italy 2007
Jamaica 1996
Japan 2007
Jordan 2008
Kenya 2007
Korea, Rep. o 2006
Kuwait 2001
Kyrgyzstan 2007
Latvia 2008
Lebanon 1998
Lithuania 2008
Luxembourg 2007
Macao SAR China 2006
Macedonia, Former Yugoslav Rep. o 2007
Madagascar 2006
Malawi 2001
Malaysia 2007
Malta 2008
Mauritius 2007
Mexico 2006
Moldova, Rep. o 2008
Mongolia 2008
Table A9.1 (continued)
Data years used or computing the Competitive Industrial Perormance index
(continued)

8/2/2019 Unido Full Report eBook
http://slidepdf.com/reader/full/unido-full-report-ebook 209/259
190
D A T A C l A r I F I C A T I ON S F Or T hE C OMP E T I T I V E I ND U S T r I A l P E r F Or MA N C E I ND E X
,B Y I ND I C A T Or
A9
Indicator and economy Year used
Morocco 2008
Nepal 2002
Netherlands 2007
New Zealand 2007
Niger 2002
Nigeria 1996
Norway 2006
Oman 2007
Pakistan 2006
Palestinian Territories 2008
Panama 2001
Paraguay 2002
Peru 2007
Philippines 2006
Poland 2007
Portugal 2007
Rica 2008Romania 2008
Russian Federation 2008
Rwanda 1999
Senegal 2002
Singapore 2008
Slovakia 2007
Slovenia 2008
South Arica 2008
Spain 2007
Sri Lanka 2008
St. Lucia 1997
Sudan 2001
Swaziland 1995
Sweden 2007
Switzerland 2007
Syrian Arab Rep. 1995
Taiwan Province o China 1996
Tanzania, United Rep. o 2007
Thailand 2006
Trinidad and Tobago 2006
Tunisia 2006
Turkey 2006
Uganda 2000
United Kingdom 2007
Indicator and economy Year used
United States 2007
Uruguay 2007
Venezuela, Bol. Rep. o 1998
Viet Nam 2000
Yemen 2006
Zimbabwe 1995
Exports per capita
Bangladesh 2007
Cambodia 2008
Cameroon 2006
Eritrea 2003
Gabon 2006
Georgia 2008
Ghana 2008
Iran, Islamic Rep. o 2006
Mongolia 2007
Niger 2008St. Lucia 2008
Swaziland 2007
Syrian Arab Rep. 2008
Share o manuactured exports in total exports
Bangladesh 2007
Cambodia 2008
Cameroon 2006
Eritrea 2003
Gabon 2006
Georgia 2008
Ghana 2008
Iran, Islamic Rep. o 2006
Mongolia 2007
Niger 2008
St. Lucia 2008
Swaziland 2007
Syrian Arab Rep. 2008
Share o medium- and high-technology activities in manuactured exports
Bangladesh 2007
Cambodia 2008
Cameroon 2006Eritrea 2003
Gabon 2006
Table A9.1 (continued)
Data years used or computing the Competitive Industrial Perormance index

8/2/2019 Unido Full Report eBook
http://slidepdf.com/reader/full/unido-full-report-ebook 210/259

8/2/2019 Unido Full Report eBook
http://slidepdf.com/reader/full/unido-full-report-ebook 211/259
192
Annex 10
Components o the Competitive
Industrial Perormanceindex by economy
Economy
Manuacturing value
added per capita(2000 US$)
Share o manuacturing
value added in GDP(percent)
Share o worldmanuacturing
value added(percent)
2005 2009 2005 2009 2005 2009
Albania 202 295 13.29 16.27 0.01 0.01
Algeria 133 135 6.25 6.13 0.07 0.07
Argentina 1,393 1,622 17.20 16.44 0.82 0.93
Australia 2,389 2,608 10.33 10.45 0.74 0.79
Austria 4,584 5,077 18.25 19.74 0.58 0.61
Azerbaijan 50 69 4.19 2.95 0.01 0.01
Bahamas 1,097 972 6.76 5.75 0.01 0.00
Bangladesh 63 82 15.70 17.28 0.15 0.19
Barbados 338 290 3.64 3.12 0.00 0.00
Belgium 3,912 3,814 16.31 15.30 0.62 0.57
Bolivia, Plurinational State o 140 161 13.22 13.52 0.02 0.02
Botswana 152 167 3.46 3.86 0.00 0.00
Brazil 594 594 15.00 13.71 1.69 1.66
Bulgaria 331 373 15.73 15.10 0.04 0.04
Cambodia 80 111 19.62 22.69 0.02 0.02
Cameroon 139 146 20.56 20.54 0.04 0.04
Canada 3,939 3,236 15.46 12.72 1.93 1.54
Chile 989 982 17.30 16.21 0.25 0.24
China 492 754 34.11 35.70 9.82 14.45
Colombia 370 408 16.83 14.24 0.25 0.28
Costa Rica 998 1,006 22.16 19.95 0.07 0.07
Cyprus 1,002 998 7.67 7.21 0.01 0.01
Czech Republic 1,780 2,246 26.55 30.13 0.28 0.33
Côte d’Ivoire 107 98 19.17 17.35 0.03 0.03
Denmark 3,963 3,705 12.54 12.01 0.33 0.29
Ecuador 211 248 13.26 14.33 0.04 0.05
Egypt 291 353 17.71 18.09 0.32 0.39
El Salvador 510 509 23.16 22.63 0.05 0.05
Eritrea 12 9 7.24 6.33 0.00 0.00
Estonia 1,105 1,073 17.77 17.49 0.02 0.02
Ethiopia 6 8 4.95 4.39 0.01 0.01Fiji 266 274 11.59 12.94 0.00 0.00
Finland 6,463 6,839 24.55 25.95 0.52 0.52
Table A10.1
Indicators o industrial perormance by economy, 2005 and 2009

8/2/2019 Unido Full Report eBook
http://slidepdf.com/reader/full/unido-full-report-ebook 212/259
193
C OMP ONE NT S OF T hE C OMP E T I T I V E I ND U S T r I A l P E r F Or MA N C E I ND E X B Y E C ON OMY
A10
Share omedium- and
high-technologyproduction in
manuacturing
value added(percent)
Manuactured
exports per capita(US$)
Share omanuacturedexports in total
exports(percent)
Share o worldmanuactured
exports(percent)
Share omedium- and
high-technologyproducts in
manuactured
exports(percent)
2005 2009 2005 2009 2005 2009 2005 2009 2005 2009
16.98 14.09 190 276 91.14 82.00 0.01 0.01 10.38 6.82
11.28 11.28 239 263 17.05 20.28 0.10 0.10 1.75 0.66
19.32 19.32 571 739 56.04 54.41 0.27 0.31 32.44 42.36
22.48 23.01 2,293 3,115 47.24 45.05 0.56 0.69 34.02 25.67
41.56 44.28 12,401 13,645 90.91 90.81 1.25 1.21 60.05 59.50
11.95 7.33 216 260 41.43 15.23 0.02 0.02 21.95 12.92
2.43 2.43 547 1,411 65.28 81.81 0.00 0.01 65.49 46.55
20.20 20.20 57 76 93.42 91.76 0.11 0.11 3.98 4.34
38.11 38.11 1,115 991 90.84 91.74 0.00 0.00 27.35 40.30
43.52 42.02 28,380 31,073 90.45 90.26 3.58 3.44 56.14 56.45
5.05 5.05 98 225 32.08 41.83 0.01 0.02 7.81 2.84
28.64 28.64 2,317 1,667 96.29 93.39 0.05 0.03 4.35 6.18
33.10 34.97 459 494 73.68 64.63 1.04 1.02 48.16 40.24
26.97 28.34 1,173 1,589 80.48 73.97 0.11 0.13 28.47 35.32
0.26 0.26 153 223 74.85 75.23 0.03 0.03 1.14 3.38
11.01 11.01 35 54 29.25 28.07 0.01 0.01 5.10 2.88
38.20 38.37 7,684 5,914 72.01 65.47 3.00 2.09 59.05 58.03
23.06 15.41 1,288 1,374 52.61 44.95 0.25 0.25 11.31 10.63
41.61 40.70 550 860 95.04 96.29 8.76 12.18 57.67 59.77
20.71 20.71 219 260 46.56 37.44 0.12 0.13 37.94 38.41
17.00 18.15 1,243 1,053 75.21 74.06 0.07 0.05 60.24 61.75
9.66 12.13 1,635 1,329 89.18 85.92 0.02 0.01 60.99 50.08
38.93 35.74 7,064 10,060 93.78 92.62 0.87 1.08 64.11 67.62
14.99 14.99 212 213 54.68 41.49 0.05 0.04 36.40 25.02
35.31 36.73 11,613 13,096 79.33 81.21 0.76 0.75 55.71 53.41
8.45 6.31 151 230 20.03 22.80 0.02 0.03 18.62 19.07
28.55 25.72 84 182 64.68 58.85 0.07 0.15 11.76 27.59
19.13 19.13 468 475 91.49 88.16 0.04 0.04 14.66 16.60
9.85 11.96 1 1 38.88 38.88 0.00 0.00 20.62 20.62
20.88 29.07 5,289 6,783 91.81 90.36 0.09 0.09 47.79 41.38
6.26 7.73 1 2 9.90 12.45 0.00 0.00 1.52 44.051.83 1.83 685 572 81.24 77.65 0.01 0.01 5.61 8.77
43.40 51.21 11,763 10,455 95.25 94.11 0.75 0.58 57.43 57.48
(continued)

8/2/2019 Unido Full Report eBook
http://slidepdf.com/reader/full/unido-full-report-ebook 213/259
194
C OMP ONE NT S OF T hE C OMP E T I T I V E I ND U S T r I A l P E r F Or MA N C E I ND E X B Y E C ON OMY
10
Economy
Manuacturing valueadded per capita
(2000 US$)
Share o manuacturingvalue added in GDP
(percent)
Share o worldmanuacturing
value added(percent)
2005 2009 2005 2009 2005 2009
France 3,291 2,989 13.94 12.60 3.05 2.65
Gabon 188 187 4.40 4.31 0.00 0.00
Gambia, The 15 16 4.71 4.47 0.00 0.00
Georgia 123 185 12.62 15.30 0.01 0.01
Germany 5,090 5,250 21.44 21.72 6.40 6.17
Ghana 25 27 8.79 8.35 0.01 0.01
Greece 1,385 1,610 9.96 10.65 0.23 0.26
Honduras 184 277 17.66 19.81 0.02 0.03
Hong Kong SAR China 938 724 3.19 2.27 0.10 0.08
Hungary 1,287 1,266 21.92 21.55 0.20 0.18
Iceland 3,627 4,134 10.06 11.44 0.02 0.02
India 80 99 14.13 13.74 1.38 1.69
Indonesia 258 295 28.07 27.08 0.89 1.00
Iran, Islamic Rep. o 306 363 16.01 16.74 0.32 0.38
Ireland 7,774 6,560 25.95 22.98 0.49 0.42
Israel 2,899 3,143 14.55 13.97 0.30 0.32
Italy 3,221 2,894 16.63 15.29 2.87 2.43
Jamaica 382 292 11.71 8.10 0.02 0.01
Japan 8,608 7,929 22.12 20.71 16.75 14.45
Jordan 344 401 16.76 16.86 0.03 0.04
Kenya 43 46 10.05 10.19 0.02 0.03
Korea, Rep. o 3,854 4,562 28.86 29.43 2.81 3.16
Kuwait 1,516 2,208 7.85 10.35 0.06 0.09
Kyrgyzstan 46 50 14.64 13.30 0.00 0.00
Latvia 601 541 11.92 10.87 0.02 0.02
Lebanon 643 627 12.58 9.87 0.04 0.04
Lithuania 939 993 19.34 19.40 0.05 0.05
Luxembourg 4,686 4,500 9.09 8.37 0.03 0.03
Macao SAR China 775 1,064 3.52 2.90 0.01 0.01
Macedonia, Former Yugoslav Rep. o 305 345 16.13 15.98 0.01 0.01
Madagascar 26 27 11.21 11.08 0.01 0.01
Malawi 15 17 10.60 9.70 0.00 0.00
Malaysia 1,412 1,390 32.39 27.92 0.55 0.54
Malta 1,492 1,387 14.83 13.16 0.01 0.01
Mauritius 773 787 17.52 16.10 0.01 0.01
Table A10.1 (continued)
Indicators o industrial perormance by economy, 2005 and 2009

8/2/2019 Unido Full Report eBook
http://slidepdf.com/reader/full/unido-full-report-ebook 214/259
195
C OMP ONE NT S OF T hE C OMP E T I T I V E I ND U S T r I A l P E r F Or MA N C E I ND E X B Y E C ON OMY
A10
Share omedium- and
high-technologyproduction in
manuacturingvalue added
(percent)
Manuacturedexports per capita
(US$)
Share omanuacturedexports in total
exports(percent)
Share o worldmanuactured
exports(percent)
Share omedium- and
high-technologyproducts in
manuacturedexports
(percent)
2005 2009 2005 2009 2005 2009 2005 2009 2005 2009
46.56 47.48 6,354 6,583 90.94 90.52 4.70 4.32 66.03 65.46
5.39 5.39 652 685 16.60 14.93 0.01 0.01 7.95 10.65
9.63 9.63 2 23 65.23 62.05 0.00 0.00 18.96 52.78
21.01 17.26 157 291 81.08 84.86 0.01 0.01 40.67 48.92
57.16 58.84 10,781 11,818 94.82 93.35 10.80 10.27 72.52 71.33
18.76 18.76 48 31 35.31 19.61 0.01 0.01 8.11 18.10
12.03 12.82 1,213 1,358 79.24 77.27 0.16 0.16 36.38 38.35
7.16 7.16 91 144 48.00 40.82 0.01 0.01 21.12 27.79
30.23 28.80 39,858 41,716 96.38 93.19 3.41 3.23 65.35 70.37
53.11 54.36 5,576 7,178 93.67 91.99 0.68 0.75 75.85 78.44
14.18 14.18 3,934 4,337 38.04 32.88 0.01 0.01 42.64 51.29
39.41 34.13 77 124 87.84 88.17 1.06 1.57 22.60 28.86
32.98 32.72 244 304 64.35 61.91 0.67 0.76 33.17 30.60
39.63 39.63 100 133 11.97 14.79 0.08 0.10 26.34 25.15
51.91 51.27 24,440 24,136 95.71 95.68 1.23 1.13 57.37 56.63
53.56 57.76 5,375 6,420 96.54 96.25 0.44 0.48 38.74 59.66
37.11 37.29 5,897 6,293 95.37 93.94 4.19 3.91 54.04 54.85
18.77 18.77 538 443 95.35 92.48 0.02 0.01 4.31 19.09
53.94 54.63 4,366 4,133 98.18 96.72 6.77 5.57 82.34 78.71
22.15 24.34 611 789 79.29 78.14 0.04 0.05 37.33 50.63
11.44 5.21 56 56 58.14 49.76 0.02 0.02 15.14 25.69
54.27 55.12 5,801 7,246 97.66 96.76 3.37 3.71 75.34 75.80
8.00 8.00 4,361 7,424 40.60 42.67 0.15 0.23 9.19 18.89
2.08 4.76 56 49 44.84 26.90 0.00 0.00 20.72 34.55
14.99 23.78 2,011 2,543 90.70 83.39 0.06 0.06 23.22 38.15
10.83 10.83 386 561 82.79 67.50 0.02 0.02 33.43 39.50
16.41 23.92 3,178 4,148 90.90 85.78 0.13 0.15 35.64 38.28
11.47 16.49 24,354 23,899 91.57 90.55 0.13 0.12 39.13 40.51
3.55 3.55 5,127 1,882 98.00 95.43 0.03 0.01 10.54 25.77
14.11 12.71 891 835 88.96 85.89 0.02 0.02 20.18 18.08
3.03 3.28 28 40 68.07 77.13 0.01 0.01 8.85 9.98
9.24 9.24 9 13 25.33 16.38 0.00 0.00 18.74 18.85
47.38 46.12 4,702 4,849 86.35 85.11 1.46 1.40 72.30 64.48
35.34 47.00 5,541 5,101 92.65 92.77 0.03 0.02 74.92 76.92
3.32 2.98 1,514 1,265 94.12 91.75 0.02 0.02 21.22 8.66
(continued)

8/2/2019 Unido Full Report eBook
http://slidepdf.com/reader/full/unido-full-report-ebook 215/259
196
C OMP ONE NT S OF T hE C OMP E T I T I V E I ND U S T r I A l P E r F Or MA N C E I ND E X B Y E C ON OMY
10
Economy
Manuacturing valueadded per capita
(2000 US$)
Share o manuacturingvalue added in GDP
(percent)
Share o worldmanuacturing
value added(percent)
2005 2009 2005 2009 2005 2009
Mexico 1,022 911 16.78 15.17 1.62 1.42
Moldova, Rep. o 71 66 15.13 12.57 0.00 0.00
Mongolia 26 37 4.58 5.24 0.00 0.00
Morocco 225 241 14.51 13.34 0.10 0.11
Nepal 18 19 7.68 7.18 0.01 0.01
Netherlands 3,295 3,329 13.19 12.71 0.82 0.78
New Zealand 2,242 1,769 14.71 11.94 0.14 0.11
Niger 11 10 6.62 5.60 0.00 0.00
Nigeria 18 23 4.11 4.48 0.04 0.05
Norway 3,781 4,117 9.34 9.82 0.27 0.28
Oman 699 670 7.04 7.53 0.03 0.03
Pakistan 103 123 17.21 18.81 0.25 0.30
Palestinian Territories 111 104 11.10 12.00 0.01 0.01
Panama 315 336 7.12 5.94 0.02 0.02
Paraguay 193 183 14.22 12.76 0.02 0.02
Peru 355 446 14.81 14.99 0.15 0.18
Philippines 247 258 22.09 21.07 0.32 0.34
Poland 960 1,351 18.39 21.25 0.56 0.73
Portugal 1,621 1,546 14.59 13.97 0.26 0.24
Qatar 1,958 2,628 5.98 5.35 0.02 0.03
Romania 297 353 13.16 13.20 0.10 0.11
Russian Federation 461 444 18.96 15.80 1.01 0.89
Rwanda 25 17 9.98 5.62 0.00 0.00
Senegal 60 54 11.95 10.41 0.01 0.01
Singapore 6,785 6,996 26.04 23.76 0.45 0.45
Slovakia 1,961 2,987 41.44 36.38 0.16 0.23
Slovenia 2,717 3,005 23.75 23.41 0.08 0.09
South Arica 550 572 16.39 15.59 0.40 0.40
Spain 2,346 2,178 14.95 13.66 1.55 1.39
Sri Lanka 146 176 14.07 13.68 0.04 0.05
St. Lucia 221 199 4.65 4.19 0.00 0.00
Sudan 32 34 6.92 5.90 0.02 0.02
Swaziland 335 460 24.11 28.83 0.01 0.01
Sweden 6,392 6,110 21.25 19.93 0.88 0.80
Switzerland 6,780 7,384 19.39 19.60 0.77 0.79
Syrian Arab Rep. 148 194 11.77 14.26 0.04 0.06
Table A10.1 (continued)
Indicators o industrial perormance by economy, 2005 and 2009

8/2/2019 Unido Full Report eBook
http://slidepdf.com/reader/full/unido-full-report-ebook 216/259
197
C OMP ONE NT S OF T hE C OMP E T I T I V E I ND U S T r I A l P E r F Or MA N C E I ND E X B Y E C ON OMY
A10
Share omedium- and
high-technologyproduction in
manuacturingvalue added
(percent)
Manuacturedexports per capita
(US$)
Share omanuacturedexports in total
exports(percent)
Share o worldmanuactured
exports(percent)
Share omedium- and
high-technologyproducts in
manuacturedexports
(percent)
2005 2009 2005 2009 2005 2009 2005 2009 2005 2009
39.67 39.59 1,675 1,700 81.71 81.18 2.12 1.95 75.16 76.89
6.89 9.84 220 262 78.20 75.86 0.01 0.01 10.32 23.37
5.24 5.31 212 452 51.48 62.93 0.01 0.01 3.09 1.91
26.89 28.86 290 343 78.95 78.68 0.11 0.12 27.62 33.17
12.12 12.12 22 22 87.02 71.70 0.01 0.01 9.18 20.80
41.46 38.61 16,163 18,862 87.69 85.78 3.20 3.27 59.88 55.94
16.51 16.50 2,754 2,905 52.66 51.09 0.14 0.13 30.37 27.28
28.15 28.15 19 25 62.16 73.98 0.00 0.00 21.96 5.10
33.44 33.44 4 17 2.48 5.15 0.01 0.03 74.87 34.73
28.54 30.24 5,593 7,139 25.90 28.97 0.31 0.36 46.10 56.13
15.84 16.75 672 2,309 9.58 26.28 0.02 0.07 38.82 40.07
25.23 24.57 90 86 88.84 83.32 0.17 0.15 8.72 11.25
1.89 1.51 78 107 86.93 88.83 0.00 0.00 19.65 17.67
5.60 5.60 65 48 21.89 20.60 0.00 0.00 11.26 15.17
12.87 12.87 74 116 26.44 23.33 0.01 0.01 13.38 14.73
12.93 14.44 307 451 48.95 48.19 0.10 0.14 5.31 6.19
38.87 45.27 466 391 95.61 92.96 0.48 0.38 81.48 79.59
27.42 31.57 2,003 3,146 87.41 88.85 0.93 1.26 54.41 59.17
18.14 20.69 3,133 3,521 94.85 93.42 0.40 0.40 43.74 40.77
22.09 17.44 3,257 10,121 11.06 22.58 0.03 0.09 63.06 34.58
25.01 32.79 1,208 1,738 94.79 92.97 0.32 0.39 33.68 54.10
23.36 25.47 635 769 41.37 40.01 1.11 1.14 27.57 26.47
27.43 27.43 9 13 54.82 51.73 0.00 0.00 16.06 36.02
29.75 29.75 87 109 69.24 70.02 0.01 0.01 31.57 20.41
76.99 75.03 49,784 53,536 97.49 96.67 2.61 2.56 72.75 69.29
36.05 48.43 5,501 9,711 94.77 94.38 0.36 0.55 55.79 65.82
35.72 45.06 8,241 10,213 92.19 91.86 0.20 0.22 59.93 64.20
23.44 21.60 677 743 69.11 67.71 0.39 0.38 47.57 46.51
29.68 30.88 3,835 4,176 87.67 86.18 2.02 1.97 61.02 58.18
10.49 12.11 242 257 76.53 71.43 0.06 0.05 7.80 8.16
7.83 7.83 290 810 73.49 83.31 0.00 0.00 28.15 34.60
9.19 9.19 106 8 87.03 3.38 0.05 0.00 2.68 15.57
0.03 0.03 1,067 905 94.11 92.94 0.01 0.01 16.92 29.75
50.51 50.02 12,977 12,772 95.61 94.47 1.42 1.24 61.22 57.98
53.47 62.23 16,580 21,241 94.01 92.86 1.49 1.69 67.16 69.52
21.52 21.52 88 364 25.83 52.39 0.02 0.06 16.48 25.06
(continued)

8/2/2019 Unido Full Report eBook
http://slidepdf.com/reader/full/unido-full-report-ebook 217/259
198
C OMP ONE NT S OF T hE C OMP E T I T I V E I ND U S T r I A l P E r F Or MA N C E I ND E X B Y E C ON OMY
10
Economy
Manuacturing valueadded per capita
(2000 US$)
Share o manuacturingvalue added in GDP
(percent)
Share o worldmanuacturing
value added(percent)
2005 2009 2005 2009 2005 2009
Taiwan Province o China 4,192 5,101 25.28 26.19 1.45 1.68
Tanzania, United Rep. o 24 28 7.30 7.32 0.01 0.02
Thailand 895 1,004 35.91 37.35 0.86 0.93
Trinidad and Tobago 684 898 7.34 8.47 0.01 0.02
Tunisia 412 476 17.21 17.19 0.06 0.07
Turkey 917 950 27.11 20.31 1.02 1.04
Uganda 25 25 9.21 6.91 0.01 0.01
United Kingdom 3,683 3,330 13.63 12.06 3.38 2.91
United States 5,604 5,334 15.28 14.83 25.56 23.70
Uruguay 1,162 1,296 17.86 14.46 0.06 0.06
Venezuela, Bol. Rep. o 864 915 17.37 16.22 0.35 0.37
Viet Nam 118 171 22.42 26.15 0.15 0.22
Yemen 29 29 5.33 5.17 0.01 0.01
Zimbabwe 41 33 9.49 9.61 0.01 0.01
Source: UNIDO 2010g; UN 2011.
Table A10.1 (continued)
Indicators o industrial perormance by economy, 2005 and 2009

8/2/2019 Unido Full Report eBook
http://slidepdf.com/reader/full/unido-full-report-ebook 218/259
199
C OMP ONE NT S OF T hE C OMP E T I T I V E I ND U S T r I A l P E r F Or MA N C E I ND E X B Y E C ON OMY
A10
Share omedium- and
high-technologyproduction in
manuacturingvalue added
(percent)
Manuacturedexports per capita
(US$)
Share omanuacturedexports in total
exports(percent)
Share o worldmanuactured
exports(percent)
Share omedium- and
high-technologyproducts in
manuacturedexports
(percent)
2005 2009 2005 2009 2005 2009 2005 2009 2005 2009
44.08 44.08 8,069 8,435 97.18 96.24 2.22 2.05 70.29 71.45
3.72 1.42 10 27 23.57 40.46 0.00 0.01 15.39 20.44
41.96 46.16 1,521 1,973 88.32 83.73 1.16 1.35 61.88 59.56
36.31 39.38 4,564 3,156 62.87 46.45 0.07 0.04 20.68 24.28
9.83 9.32 884 1,158 85.12 84.60 0.11 0.13 31.41 39.64
25.10 28.97 911 1,143 91.67 87.00 0.81 0.92 40.73 42.29
10.59 10.59 8 25 27.00 52.84 0.00 0.01 28.92 31.38
43.68 41.50 5,299 4,636 87.36 86.39 3.87 2.99 67.37 63.52
48.08 49.33 2,621 2,625 89.89 86.04 9.52 8.62 73.64 67.81
10.67 13.68 477 626 46.63 39.11 0.02 0.02 17.38 22.62
34.28 34.28 774 706 37.34 35.69 0.25 0.21 14.85 4.91
20.26 20.26 206 406 54.18 64.22 0.21 0.38 21.44 25.61
3.30 3.89 29 36 10.77 13.71 0.01 0.01 20.56 22.25
30.55 30.55 48 65 45.40 39.30 0.01 0.01 28.87 15.46

8/2/2019 Unido Full Report eBook
http://slidepdf.com/reader/full/unido-full-report-ebook 219/259
200
Annex 11
Indicators o the Competitive
Industrial Perormance index byregion and income group
Group 2005 2006 2007 2008 2009
World 1,086 1,127 1,172 1,174 1,107
Developed countries 4,918 5,072 5,209 5,152 4,712
Developing countries 354 377 411 429 437Region
East Asia and the Pacic 519 563 634 678 724
Excluding China 587 619 652 652 654
Europe 546 577 638 655 613
Excluding the Russian Federation 689 782 878 911 894
Latin America and the Caribbean 714 740 766 779 721
Excluding Brazil 784 828 857 871 797
Middle East and North Arica 422 449 467 474 459
Excluding Turkey 284 303 315 325 326
South and Central Asia 90 99 106 107 111
Excluding India 117 127 135 138 142
Sub-Saharan Arica 80 81 83 83 81
Excluding South Arica 33 33 33 34 35
Income
High income non-OECD 3,124 3,385 3,612 3,560 3,559
Upper middle income 695 726 762 774 721
Lower middle income 278 301 337 361 387
Low income 48 52 55 58 61
Least developed countries 36 38 40 42 43
Source: UNIDO 2010g.
Table A11.1
Manuacturing value added per capita, 2005–2009 (2000 US$)

8/2/2019 Unido Full Report eBook
http://slidepdf.com/reader/full/unido-full-report-ebook 220/259
I ND I C A T Or S OF T hE C OMP
E T I T I V E I ND U S T r I A l P E r F Or MA N C E I ND E X B Y r E GI ON
A ND I N C OME Gr O UP
201
A11
Group 2005 2006 2007 2008 2009
World 18.2 18.3 18.5 18.4 18.0
Developed countries 17.3 17.4 17.5 17.3 16.5
Developing countries 21.3 21.0 21.4 21.5 21.8
Region
East Asia and the Pacic 29.8 29.3 30.1 30.5 31.4
Excluding China 23.6 22.9 23.0 22.6 23.5
Europe 18.3 17.9 18.3 17.8 17.5
Excluding the Russian Federation 17.5 18.5 19.4 19.2 19.2
Latin America and the Caribbean 16.1 15.9 15.7 15.5 14.8
Excluding Brazil 16.7 16.5 16.3 16.2 15.4
Middle East and North Arica 16.5 15.2 15.2 15.1 14.8
Excluding Turkey 12.2 12.3 12.3 12.3 12.2
South and Central Asia 14.7 15.1 15.1 14.7 14.8
Excluding India 16.0 16.6 16.8 16.9 17.0
Sub-Saharan Arica 12.3 12.0 11.9 11.7 11.4
Excluding South Arica 8.6 8.3 8.2 8.1 8.1
IncomeHigh income non-OECD 16.6 16.2 16.4 16.0 16.8
Upper middle income 17.6 16.9 16.9 16.6 16.0
Lower middle income 26.5 26.5 27.2 27.5 27.9
Low income 13.9 14.1 14.5 14.6 15.0
Least developed countries 11.3 11.3 11.4 11.3 11.4
Source: UNIDO 2010g.
Table A11.2
Share o manuacturing value added in GDP, 2005–2009 (percent)

8/2/2019 Unido Full Report eBook
http://slidepdf.com/reader/full/unido-full-report-ebook 221/259
202
I ND I C A T Or S OF T hE C OMP
E T I T I V E I ND U S T r I A l P E r F Or MA N C E I ND E X B Y r E GI ON
A ND I N C OME Gr O UP
11
Group 2005 2006 2007 2008 2009
World 100 100 100 100 100
Developed countries 72.7 71.8 70.5 69.2 66.7
Developing countries 27.3 28.2 29.5 30.8 33.3
Region
East Asia and the Pacic 14.8 15.4 16.7 17.7 20.0
Excluding China 4.9 4.9 5.0 5.0 5.3
Europe 1.9 1.9 2.0 2.1 2.0
Excluding the Russian Federation 0.9 1.0 1.1 1.1 1.1
Latin America and the Caribbean 5.5 5.5 5.5 5.6 5.5
Excluding Brazil 3.8 3.9 3.9 3.9 3.8
Middle East and North Arica 2.2 2.3 2.3 2.3 2.4
Excluding Turkey 1.2 1.2 1.2 1.2 1.3
South and Central Asia 2.2 2.3 2.4 2.4 2.7
Excluding India 0.8 0.8 0.8 0.9 0.9
Sub-Saharan Arica 0.6 0.6 0.6 0.6 0.7
Excluding South Arica 0.2 0.2 0.2 0.2 0.3
IncomeHigh income non-OECD 2.6 2.7 2.8 2.7 2.9
Upper middle income 9.3 9.3 9.4 9.5 9.3
Lower middle income 15.0 15.7 16.9 18.1 20.5
Low income 0.4 0.5 0.5 0.5 0.6
Least developed countries 0.3 0.3 0.3 0.3 0.3
Source: UNIDO 2010g.
Table A11.3
Share o manuacturing value added in world manuacturing value added, 2005–2009 (percent)

8/2/2019 Unido Full Report eBook
http://slidepdf.com/reader/full/unido-full-report-ebook 222/259
203
I ND I C A T Or S OF T hE C OMP
E T I T I V E I ND U S T r I A l P E r F Or MA N C E I ND E X B Y r E GI ON
A ND I N C OME Gr O UP
A11
Group 2005 2006 2007 2008 2009
World 53.1 54.4 55.4 56.3 55.8
Developed countries 59.0 61.0 62.3 63.7 63.6
Developing countries 39.8 40.3 41.6 42.5 43.0
Region
East Asia and the Pacic 43.3 43.6 45.2 45.8 46.0
Excluding China 43.0 42.9 48.7 50.4 50.5
Europe 36.1 36.4 37.3 37.7 36.5
Excluding the Russian Federation 33.1 33.7 34.8 36.1 35.9
Latin America and the Caribbean 33.0 33.5 34.0 34.8 33.3
Excluding Brazil 28.3 29.1 28.9 28.5 27.1
Middle East and North Arica 32.5 31.9 32.4 33.6 35.6
Excluding Turkey 29.6 29.2 29.4 30.5 33.0
South and Central Asia 43.4 43.6 44.2 45.0 47.3
Excluding India 27.5 27.2 27.7 28.3 29.0
Sub-Saharan Arica 25.5 25.8 25.9 26.3 24.2
Excluding South Arica 14.4 14.1 14.3 14.9 14.9
IncomeHigh income non-OECD 46.1 47.0 54.5 55.6 55.8
Upper middle income 35.0 35.4 35.9 36.6 35.3
Lower middle income 41.6 41.9 42.7 43.5 44.5
Low income 20.7 20.2 20.3 20.6 20.7
Least developed countries 18.2 17.3 17.0 17.0 16.7
Source: UNIDO 2010.
Table A11.4
Share o medium- and high-technology production in manuacturing value added, 2005–2009 (percent)

8/2/2019 Unido Full Report eBook
http://slidepdf.com/reader/full/unido-full-report-ebook 223/259
204
I ND I C A T Or S OF T hE C OMP
E T I T I V E I ND U S T r I A l P E r F Or MA N C E I ND E X B Y r E GI ON
A ND I N C OME Gr O UP
11
Group 2005 2006 2007 2008 2009
World 1,356 1,535 1,740 1,917 1,490
Developed countries 5,650 6,302 7,120 7,755 5,927
Developing countries 534 629 725 824 665
Region
East Asia and the Pacic 938 1,115 1,301 1,442 1,209
Excluding China 1,887 2,131 2,319 2,440 2,040
Europe 1,077 1,294 1,607 2,028 1,466
Excluding the Russian Federation 1,815 2,193 2,771 3,329 2,622
Latin America and the Caribbean 726 803 861 1,000 767
Excluding Brazil 884 969 1,029 1,187 929
Middle East and North Arica 458 585 697 880 639
Excluding Turkey 332 458 532 695 502
South and Central Asia 78 91 98 109 102
Excluding India 81 93 76 51 44
Sub-Saharan Arica 99 113 116 138 98
Excluding South Arica 40 52 44 51 38
IncomeHigh income non-OECD 14,065 16,276 17,762 19,239 15,537
Upper middle income 932 1,055 1,203 1,406 1,075
Lower middle income 309 380 457 530 444
Low income 56 69 82 83 71
Least developed countries 34 41 35 22 13
Source: UN 2011.
Table A11.5
Manuactured exports per capita, 2005–2009 (current US$)

8/2/2019 Unido Full Report eBook
http://slidepdf.com/reader/full/unido-full-report-ebook 224/259
205
I ND I C A T Or S OF T hE C OMP
E T I T I V E I ND U S T r I A l P E r F Or MA N C E I ND E X B Y r E GI ON
A ND I N C OME Gr O UP
A11
Group 2005 2006 2007 2008 2009
World 86.0 84.7 85.5 83.2 84.2
Developed countries 89.3 88.8 88.7 87.4 87.5
Developing countries 79.9 78.0 80.2 76.8 79.2
Region
East Asia and the Pacic 92.6 92.3 92.7 91.8 92.1
Excluding China 90.9 90.1 89.9 88.1 88.2
Europe 62.5 66.4 62.1 61.4 63.3
Excluding the Russian Federation 89.2 88.6 89.1 88.7 88.4
Latin America and the Caribbean 66.8 62.8 67.7 61.9 61.9
Excluding Brazil 65.0 60.1 66.7 59.9 61.1
Middle East and North Arica 59.7 54.8 58.4 51.5 57.1
Excluding Turkey 47.1 43.9 46.9 40.7 47.1
South and Central Asia 64.5 66.2 86.6 86.0 86.7
Excluding India 38.7 41.3 86.4 78.4 77.7
Sub-Saharan Arica 61.7 37.9 41.2 39.6 41.0
Excluding South Arica 52.2 23.7 24.1 21.5 23.7
IncomeHigh income non-OECD 92.0 87.6 88.2 85.7 87.3
Upper middle income 67.2 66.4 67.3 63.7 65.5
Lower middle income 85.5 83.1 87.5 84.2 86.6
Low income 53.7 52.7 57.6 53.9 56.0
Least developed countries 61.0 62.8 60.4 33.6 24.6
Source: UN 2011.
Table A11.6
Share o manuactured exports in total exports, 2005–2009 (percent)

8/2/2019 Unido Full Report eBook
http://slidepdf.com/reader/full/unido-full-report-ebook 225/259
206
I ND I C A T Or S OF T hE C OMP
E T I T I V E I ND U S T r I A l P E r F Or MA N C E I ND E X B Y r E GI ON
A ND I N C OME Gr O UP
11
Group 2005 2006 2007 2008 2009
World 100 100 100 100 100
Developed countries 66.9 65.5 64.9 63.8 62.3
Developing countries 33.1 34.5 35.1 36.2 37.7
Region
East Asia and the Pacic 21.5 22.5 23.0 23.1 24.8
Excluding China 12.5 12.5 12.0 11.5 12.4
Europe 3.1 3.2 3.5 3.9 3.6
Excluding the Russian Federation 1.9 2.0 2.2 2.4 2.4
Latin America and the Caribbean 4.5 4.4 4.2 4.4 4.4
Excluding Brazil 3.5 3.3 3.1 3.3 3.3
Middle East and North Arica 1.9 2.2 2.3 2.6 2.5
Excluding Turkey 1.1 1.3 1.4 1.6 1.5
South and Central Asia 1.5 1.6 1.5 1.5 1.8
Excluding India 0.4 0.4 0.3 0.2 0.2
Sub-Saharan Arica 0.6 0.6 0.6 0.7 0.6
Excluding South Arica 0.2 0.3 0.2 0.2 0.2
IncomeHigh income non-OECD 9.4 9.5 9.2 9.0 9.3
Upper middle income 10.0 10.0 10.0 10.6 10.4
Lower middle income 13.3 14.5 15.4 16.2 17.5
Low income 0.4 0.5 0.5 0.4 0.5
Least developed countries 0.2 0.2 0.2 0.1 0.1
Source: UN 2011.
Table A11.7
Share in world manuactured exports, 2005–2009 (percent)
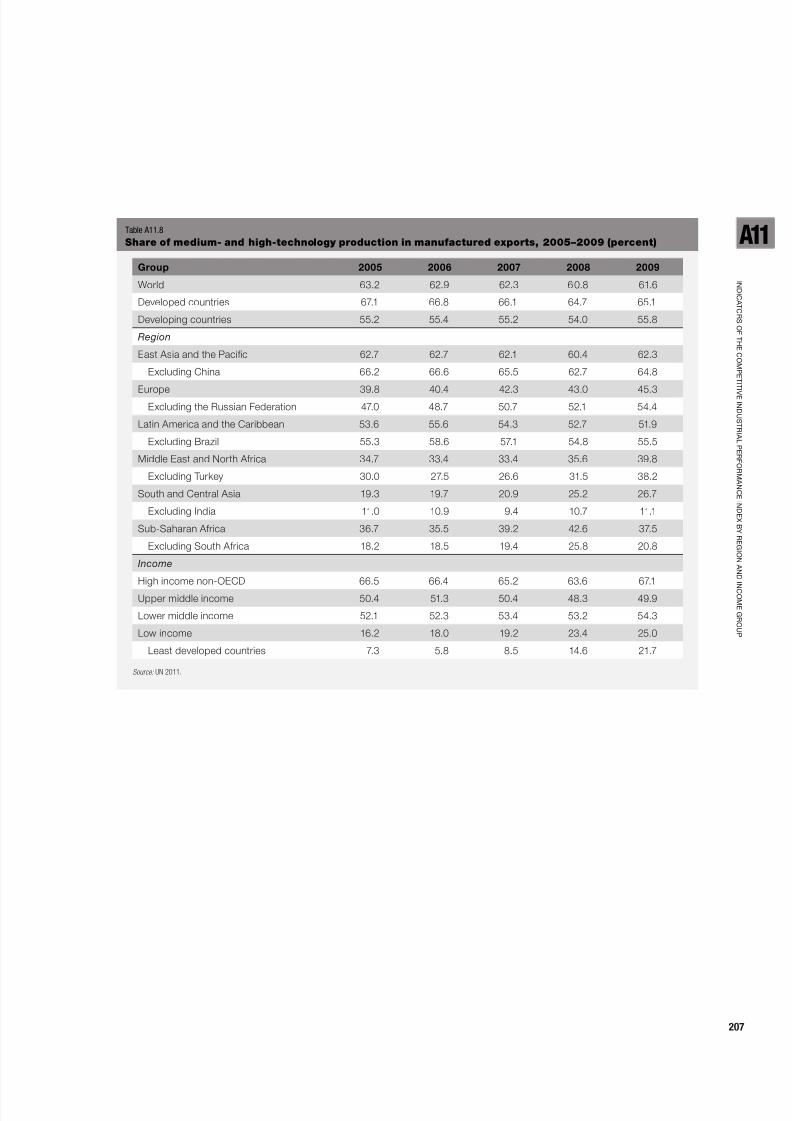
8/2/2019 Unido Full Report eBook
http://slidepdf.com/reader/full/unido-full-report-ebook 226/259
207
I ND I C A T Or S OF T hE C OMP
E T I T I V E I ND U S T r I A l P E r F Or MA N C E I ND E X B Y r E GI ON
A ND I N C OME Gr O UP
A11
Group 2005 2006 2007 2008 2009
World 63.2 62.9 62.3 60.8 61.6
Developed countries 67.1 66.8 66.1 64.7 65.1
Developing countries 55.2 55.4 55.2 54.0 55.8
Region
East Asia and the Pacic 62.7 62.7 62.1 60.4 62.3
Excluding China 66.2 66.6 65.5 62.7 64.8
Europe 39.8 40.4 42.3 43.0 45.3
Excluding the Russian Federation 47.0 48.7 50.7 52.1 54.4
Latin America and the Caribbean 53.6 55.6 54.3 52.7 51.9
Excluding Brazil 55.3 58.6 57.1 54.8 55.5
Middle East and North Arica 34.7 33.4 33.4 35.6 39.8
Excluding Turkey 30.0 27.5 26.6 31.5 38.2
South and Central Asia 19.3 19.7 20.9 25.2 26.7
Excluding India 11.0 10.9 9.4 10.7 11.1
Sub-Saharan Arica 36.7 35.5 39.2 42.6 37.5
Excluding South Arica 18.2 18.5 19.4 25.8 20.8
IncomeHigh income non-OECD 66.5 66.4 65.2 63.6 67.1
Upper middle income 50.4 51.3 50.4 48.3 49.9
Lower middle income 52.1 52.3 53.4 53.2 54.3
Low income 16.2 18.0 19.2 23.4 25.0
Least developed countries 7.3 5.8 8.5 14.6 21.7
Source: UN 2011.
Table A11.8
Share o medium- and high-technology production in manuactured exports, 2005–2009 (percent)

8/2/2019 Unido Full Report eBook
http://slidepdf.com/reader/full/unido-full-report-ebook 227/259
208
Annex 12
Summary o world trade, by
region and income group
Group 2005 2006 2007 2008 2009
World 9,815 11,434 12,997 14,966 11,540
Developed countries 6,055 6,831 7,767 8,627 6,616
Developing countries 3,761 4,603 5,230 6,339 4,924Region
East Asia and the Pacic 1,875 2,261 2,640 2,975 2,507
Excluding China 1,113 1,293 1,422 1,545 1,308
Europe 462 525 689 880 607
Excluding the Russian Federation 240 291 366 450 336
Latin America and the Caribbean 561 663 671 859 668
Excluding Brazil 444 528 516 666 519
Middle East and North Arica 551 724 828 1,131 758
Excluding Turkey 477 639 723 1,002 657
South and Central Asia 217 258 232 281 239
Excluding India 117 138 87 102 69
Sub-Saharan Arica 94 171 169 212 144
Excluding South Arica 48 120 105 138 90
Income
High income non-OECD 1,106 1,358 1,491 1,725 1,318
Upper middle income 1,264 1,468 1,670 2,092 1,549
Lower middle income 1,321 1,689 1,968 2,412 1,968
Low income 70 89 100 111 89
Least developed countries 34.0 40.9 41.2 47.1 34.7
Source: UN 2011.
Table A12.1
Total exports, 2005–2009 (US$ billions)
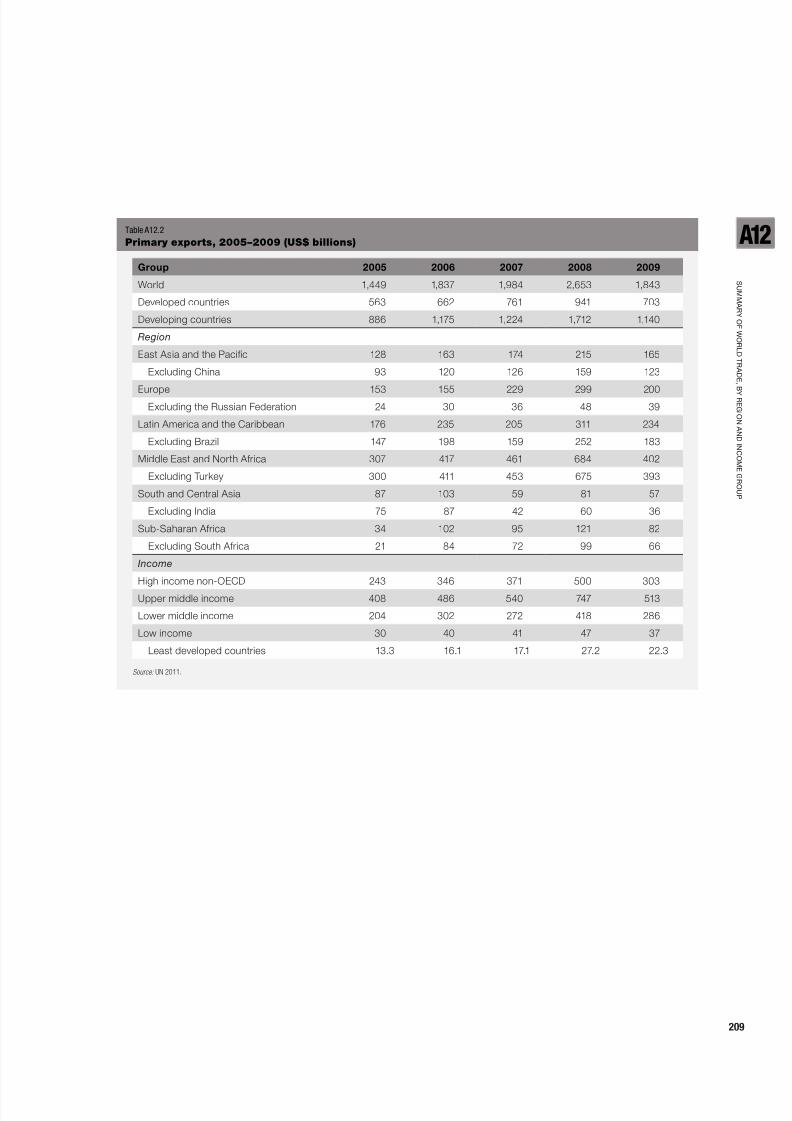
8/2/2019 Unido Full Report eBook
http://slidepdf.com/reader/full/unido-full-report-ebook 228/259
S UMMA r Y OF W Or l D T r A
D E ,B Y r E GI ONA ND I N C OME Gr O UP
209
A12
Group 2005 2006 2007 2008 2009
World 1,449 1,837 1,984 2,653 1,843
Developed countries 563 662 761 941 703
Developing countries 886 1,175 1,224 1,712 1,140
Region
East Asia and the Pacic 128 163 174 215 165
Excluding China 93 120 126 159 123
Europe 153 155 229 299 200
Excluding the Russian Federation 24 30 36 48 39
Latin America and the Caribbean 176 235 205 311 234
Excluding Brazil 147 198 159 252 183
Middle East and North Arica 307 417 461 684 402
Excluding Turkey 300 411 453 675 393
South and Central Asia 87 103 59 81 57
Excluding India 75 87 42 60 36
Sub-Saharan Arica 34 102 95 121 82
Excluding South Arica 21 84 72 99 66
IncomeHigh income non-OECD 243 346 371 500 303
Upper middle income 408 486 540 747 513
Lower middle income 204 302 272 418 286
Low income 30 40 41 47 37
Least developed countries 13.3 16.1 17.1 27.2 22.3
Source: UN 2011.
Table A12.2
Primary exports, 2005–2009 (US$ billions)

8/2/2019 Unido Full Report eBook
http://slidepdf.com/reader/full/unido-full-report-ebook 229/259
210
S UMMA r Y OF W Or l D T r A
D E ,B Y r E GI ONA ND I N C OME Gr O UP
12
Group 2005 2006 2007 2008 2009
World 1,592 1,863 2,175 2,622 1,973
Developed countries 979 1,122 1,302 1,527 1,153
Developing countries 613 742 873 1,095 820
Region
East Asia and the Pacic 204 248 299 377 296
Excluding China 141 171 204 261 201
Europe 110 135 161 211 141
Excluding the Russian Federation 57 66 81 99 72
Latin America and the Caribbean 118 126 146 187 149
Excluding Brazil 87 87 99 129 102
Middle East and North Arica 108 143 168 198 139
Excluding Turkey 96 132 153 177 123
South and Central Asia 45 57 66 84 67
Excluding India 9 12 9 12 9
Sub-Saharan Arica 28 33 32 38 28
Excluding South Arica 15 21 18 18 12
IncomeHigh income non-OECD 159 204 240 290 209
Upper middle income 264 302 357 465 339
Lower middle income 181 227 264 326 262
Low income 9 9 12 14 11
Least developed countries 7.9 9.2 6.5 7.6 4.8
Source: UN 2011.
Table A12.3
Resource-based manuactured exports, 2005–2009 (US$ billions)

8/2/2019 Unido Full Report eBook
http://slidepdf.com/reader/full/unido-full-report-ebook 230/259
211
S UMMA r Y OF W Or l D T r A
D E ,B Y r E GI ONA ND I N C OME Gr O UP
A12
Group 2005 2006 2007 2008 2009
World 1,501 1,700 1,981 2,184 1,720
Developed countries 801 890 1,032 1,133 867
Developing countries 700 810 949 1,051 853
Region
East Asia and the Pacic 444 527 629 704 575
Excluding China 201 216 237 249 204
Europe 76 85 104 118 82
Excluding the Russian Federation 63 72 90 102 72
Latin America and the Caribbean 61 62 64 69 53
Excluding Brazil 48 48 51 54 42
Middle East and North Arica 52 61 73 86 69
Excluding Turkey 24 30 33 39 33
South and Central Asia 58 66 68 62 64
Excluding India 27 30 30 18 18
Sub-Saharan Arica 8 10 11 12 9
Excluding South Arica 3 3 6 6 3
IncomeHigh income non-OECD 159 169 184 188 151
Upper middle income 162 177 203 225 172
Lower middle income 358 437 530 609 505
Low income 22 27 32 30 25
Least developed countries 9.2 11.4 12.8 5.5 2.0
Source: UN 2011.
Table A12.4
Low-technology manuactured exports, 2005–2009 (US$ billions)

8/2/2019 Unido Full Report eBook
http://slidepdf.com/reader/full/unido-full-report-ebook 231/259
212
S UMMA r Y OF W Or l D T r A
D E ,B Y r E GI ONA ND I N C OME Gr O UP
12
Group 2005 2006 2007 2008 2009
World 3,228 3,649 4,265 4,724 3,558
Developed countries 2,424 2,696 3,121 3,374 2,492
Developing countries 805 953 1,144 1,351 1,066
Region
East Asia and the Pacic 455 533 641 738 613
Excluding China 267 291 324 351 291
Europe 103 126 165 212 148
Excluding the Russian Federation 81 102 135 168 123
Latin America and the Caribbean 149 176 191 214 157
Excluding Brazil 117 141 150 165 129
Middle East and North Arica 62 76 97 120 98
Excluding Turkey 36 45 57 72 63
South and Central Asia 20 24 27 37 32
Excluding India 6 6 6 6 3
Sub-Saharan Arica 16 18 22 30 19
Excluding South Arica 3 3 3 6 3
IncomeHigh income non-OECD 223 251 285 307 256
Upper middle income 297 348 408 485 354
Lower middle income 281 349 444 551 449
Low income 4 5 7 8 7
Least developed countries 1.3 1.3 1.6 1.7 1.7
Source: UN 2011.
Table A12.5
Medium-technology manuactured exports, 2005–2009 (US$ billions)

8/2/2019 Unido Full Report eBook
http://slidepdf.com/reader/full/unido-full-report-ebook 232/259
213
S UMMA r Y OF W Or l D T r A
D E ,B Y r E GI ONA ND I N C OME Gr O UP
A12
Group 2005 2006 2007 2008 2009
World 1,931 2,236 2,424 2,565 2,239
Developed countries 1,205 1,359 1,435 1,509 1,280
Developing countries 726 877 989 1,056 960
Region
East Asia and the Pacic 633 772 877 912 824
Excluding China 405 480 513 504 456
Europe 17 20 25 34 31
Excluding the Russian Federation 12 18 21 30 27
Latin America and the Caribbean 50 55 54 64 55
Excluding Brazil 42 45 42 51 45
Middle East and North Arica 17 19 20 28 30
Excluding Turkey 15 18 18 24 27
South and Central Asia 6 8 10 15 17
Excluding India 0 0 3 3 3
Sub-Saharan Arica 3 4 3 3 3
Excluding South Arica 0 3 0 0 0
IncomeHigh income non-OECD 310 369 393 414 367
Upper middle income 122 139 144 143 140
Lower middle income 292 367 449 495 448
Low income 2 3 3 5 5
Least developed countries 0.2 0.3 0.4 0.5 0.5
Source: UN 2011.
Table A12.6
High-technology manuactured exports, 2005–2009 (US$ billions)

8/2/2019 Unido Full Report eBook
http://slidepdf.com/reader/full/unido-full-report-ebook 233/259
214
Annex 13
Country and economy groups
East Asia and the Pacifc
American Samoa Hong KongSAR China
Malaysia Norolk Island Thailand
Australia Indonesia Marshall Islands Northern Mariana
Islands
Timor-Leste
Brunei Darussalam Japan Micronesia,Federated States o
Palau Tokelau
Cambodia Johnston Island Mongolia Papua New Guinea Tonga
China Kiribati Myanmar Philippines Tuvalu
Cook Islands Korea, Dem.People’s Rep. o
Nauru Pitcairn Vanuatu
Fiji Korea, Rep. o New Caledonia Samoa Viet Nam
French Polynesia Lao People’sDem. Rep.
New Zealand Singapore Wallis and FutunaIslands
Guam Macao SAR China Niue Solomon Islands
Developing Europe
Albania Denmark Iceland Malta San Marino
Andorra Estonia Ireland Moldova, Rep. o Serbia
Austria Faeroe Islands Isle o Man Monaco Slovakia
Belarus Finland Italy Netherlands Slovenia
Belgium France Latvia Norway Spain
Bosnia andHerzegovina
Germany Liechtenstein Poland Sweden
Bulgaria Gibraltar Lithuania Portugal Switzerland
Channel Islands Greece Luxembourg Romania Ukraine
Croatia Holy See Macedonia, Former Yugoslav Rep. o
Russian Federation United Kingdom
Czech Republ ic Hungary
Latin America and the Caribbean
Anguilla Cayman Islands Falkland Islands(Malvinas)
Martinique St. Kitts and Nevis
Antigua and Barbuda Chile French Guiana Mexico St. Lucia
Argentina Colombia Grenada Montserrat St. Vincent andGrenadines
Aruba Costa Rica Guadeloupe Netherlands Antilles Suriname
Bahamas Cuba Guatemala Nicaragua Trinidad and Tobago
Barbados Dominica Guyana Panama Turks and CaicosIslands
Belize Dominican Republic Haiti Paraguay US Virgin Islands
Bolivia, Plurinational
State o
Ecuador Honduras Peru Uruguay
Brazil El Salvador Jamaica Puerto Rico Venezuela,Bol. Rep. o
British Virgin Islands
Table A13.1
Countries and economies by region, and largest developing economy in each region

8/2/2019 Unido Full Report eBook
http://slidepdf.com/reader/full/unido-full-report-ebook 234/259
C O UNT r Y A ND E C ON OMY
Gr O UP S
215
A13
Middle East and North Arica
Algeria Egypt Kuwait Palestinian Territories Tunisia
Armenia Georgia Lebanon Qatar Turkey
Azerbaijan Iraq Libya Saudi Arabia United Arab Emirates
Bahrain Israel Morocco Sudan Western Sahara
Cyprus Jordan Oman Syrian Arab Rep. Yemen
North AmericaBermuda Canada Greenland St. Pierre and
MiquelonUnited States
South and Central Asia
Aghanistan India Kyrgyzstan Pakistan Turkmenistan
Bangladesh Iran, Islamic Rep. o Maldives Sri Lanka Uzbekistan
Bhutan Kazakhstan Nepal Tajikistan
Sub-Saharan Arica
Angola Congo, Dem. Rep. o Guinea Mozambique Sierra Leone
Benin Congo Guinea-Bissau Namibia Somalia
Botswana Côte d’Ivoire Kenya Niger South Arica
Burkina Faso Djibouti Lesotho Nigeria Swaziland
Burundi Equatorial Guinea L iberia Reunion Tanzania,United Rep. o
Cameroon Eritrea Madagascar Rwanda Togo
Cape Verde Ethiopia Malawi St. Helena Uganda
Central Arican Rep. Gabon Mali São Tomé andPríncipe
Zambia
Chad Gambia, The Mauritania Senegal Zimbabwe
Comoros Ghana Mauritius Seychelles
Note: Bold type denotes the largest developing country in each region.
Source: UNIDO, based on UN Statistics classication.
Table A13.1 (continued)
Countries and economies by region, and largest developing economy in each region

8/2/2019 Unido Full Report eBook
http://slidepdf.com/reader/full/unido-full-report-ebook 235/259
216
C O UNT r Y A ND E C ON OMY
Gr O UP S
13
High-income OECD
Australia Finland Ireland Netherlands Spain
Austria France Italy New Zealand Sweden
Belgium Germany Japan Norway Switzerland
Canada Greece Korea, Rep. o Portugal United Kingdom
Czech Republic Hungary Luxembourg Slovakia United States
Denmark Iceland
High-income non-OECD
Andorra Cayman Islands Greenland Malta San Marino
Antigua and Barbuda Channel Islands Guam Monaco Saudi Arabia
Aruba Croatia Hong KongSAR China
Netherlands Antilles Singapore
Bahamas Cyprus Isle o Man New Caledonia Slovenia
Bahrain Equatorial Guinea Israel Northern MarianaIslands
Taiwan Provinceo China
Barbados Estonia Kuwait Oman Trinidad and Tobago
Bermuda Faeroe Islands Liechtenstein Puerto Rico United Arab Emirates
Brunei Darussalam French Polynesia Macao SAR China Qatar US Virgin Islands
Upper middle income
Algeria Costa Rica Latvia Namibia Seychelles
Argentina Cuba Lebanon Palau South Arica
Belarus Dominica Libyan ArabJamahiriya
Panama St. Kitts and Nevis
Bosnia andHerzegovina
Dominican Rep. Lithuania Peru St. Lucia
Botswana Fiji Macedonia, Former Yugoslav Rep. o
Poland St. Vincent and theGrenadines
Brazil Gabon Malaysia Romania Suriname
Bulgaria Grenada Mauritius Russian Federation Turkey
Chile Jamaica Mexico Samoa Uruguay
Colombia Kazakhstan Montenegro Serbia Venezuela, BolivarianRep. o
Table A13.2
Countries and economies by income group and least developed countries

8/2/2019 Unido Full Report eBook
http://slidepdf.com/reader/full/unido-full-report-ebook 236/259
217
C O UNT r Y A ND E C ON OMY
Gr O UP S
A13
Lower middle income
Albania Côte d’Ivoire Iran, Islamic Rep. o Nicaragua Sudan
Angola Djibouti Iraq Nigeria Swaziland
Armenia Ecuador Jordan Palestinian Territories Syrian Arab Rep.
Azerbaijan Egypt Kiribati Pakistan Thailand
Belize El Salvador Lesotho Papua New Guinea Timor-Leste
Bhutan Georgia Maldives Paraguay Tonga
Bolivia, PlurinationalState o
Guatemala Marshall Islands Philippines Tunisia
Cameroon Guyana Micronesia, FederatedStates o
São Tomé andPríncipe
Turkmenistan
Cape Verde Honduras Moldova, Rep. o Solomon Islands Ukraine
China India Mongolia Sri Lanka Vanuatu
Congo Indonesia Morocco
Low income
Aghanistan Congo, Dem. Rep. o Korea, Dem. People’sRep. o
Myanmar Togo
Bangladesh Eritrea Kyrgyzstan Nepal Tanzania, UnitedRep. o
Benin Ethiopia Lao People’s Dem.Rep.
Niger Uganda
Burkina Faso Gambia, The Liberia Rwanda Uzbekistan
Burundi Ghana Madagascar Senegal Viet Nam
Cambodia Guinea Malawi Sierra Leone Yemen
Central Arican Rep. Guinea-Bissau Mali Somalia Zambia
Chad Haiti Mauritania Tajikistan Zimbabwe
Comoros Kenya Mozambique
Least developed countries
Angola Comoros Kiribati Myanmar Sudan
Aghanistan Congo, Dem. Rep. o Lao People’s
Dem. Rep.
Nepal Tanzania,
United Rep. o
Bangladesh Djibouti Lesotho Niger Timor-Leste
Benin Equatorial Guinea Liberia Rwanda Togo
Bhutan Eritrea Madagascar Samoa Tuvalu
Burkina Faso Ethiopia Malawi São Tomé andPríncipe
Uganda
Burundi Gambia, The Maldives Senegal Vanuatu
Cambodia Guinea Mali Sierra Leone Yemen
Central Arican Rep. Guinea-Bissau Mauritania Solomon Islands Zambia
Chad Haiti Mozambique Somalia
Source: UNIDO based on World Bank classication (http://data.worldbank.org/about/country-classications/country-and-lending-groups).
Table A13.2 (continued)
Countries and economies by income group and least developed countries

8/2/2019 Unido Full Report eBook
http://slidepdf.com/reader/full/unido-full-report-ebook 237/259
218
Annex 14
Industrial energy eciency
policy measures
Country
Inormation policies Institutional, regulatory and legal policies
A w a r e n e s s
a n d e d u c a t i o n
c a m p a i g n
T r a i n i n g o r f r m
p e r s o n n e l
E n e r g y
m a n a g e m e n t
s y s t e m s
G o v e r n m e n t
a g e n c y o r e n e r g y
e f c i e n c y
T e c h n i c a l
a s s i s t a n c e
N e t w o r k b u i l d i n g
D e v e l o p m e n t o
c o d e s ,
s t a n d a r d s ,
p r o d u c t l a b e l l i n g
E l i m i n a t i o n o
e n e r g y s u b s i d i e s
M a n d a t o r y e n e r g y -
e f c i e n c y t a r g e t s
a n d e n e r g y a u d i t s
V o l u n t a r y
a g r e e m e n t s o n
e n e r g y e f c i e n c y
D e m a n d - s i d e
m a n a g e m e n t
p r o g r a m m e s
R e c o g n i t i o n
p r o g r a m m e s
Argentina ✔ ✔ ✔ ✔
Bolivia ✔ ✔ ✔
Brazil ✔ ✔ ✔ ✔ ✔
Chile ✔ ✔ ✔ ✔
China ✔ ✔ ✔ ✔ ✔ ✔ ✔ ✔
Colombia ✔ ✔ ✔ ✔
Costa Rica ✔ ✔
DominicanRep. ✔
Ecuador ✔
Egypt ✔ ✔ ✔ ✔ ✔ ✔ ✔
Ethiopia
Ghana ✔ ✔ ✔ ✔ ✔
Guatemala ✔
Honduras ✔ ✔ ✔
India ✔ ✔ ✔ ✔ ✔ ✔ ✔ ✔ ✔ ✔ ✔
Indonesia ✔ ✔ ✔ ✔ ✔ ✔ ✔ ✔ ✔
Liberia ✔
Malaysia ✔ ✔ ✔ ✔ ✔ ✔ ✔
Mexico ✔ ✔ ✔ ✔ ✔
Moldova ✔ ✔
Mozambique
Nigeria ✔ ✔
Peru ✔ ✔ ✔
Philippines ✔ ✔ ✔ ✔ ✔ ✔ ✔
Romania ✔ ✔ ✔ ✔ ✔
RussianFederation ✔ ✔ ✔ ✔ ✔ ✔
Senegal
South Arica ✔ ✔ ✔ ✔ ✔ ✔
Tanzania
Thailand ✔ ✔ ✔ ✔ ✔ ✔ ✔ ✔
Tunisia ✔ ✔ ✔ ✔
Turkey ✔ ✔ ✔ ✔ ✔ ✔
Uganda
Ukraine ✔
Venezuela ✔ ✔ ✔ ✔
Viet Nam ✔ ✔ ✔ ✔ ✔ ✔ ✔
Zambia
15 8 10 29 9 3 21 7 13 10 12 5
Source: Ocial documentation and websites. See http://ieep.unido.org.
Table A14.1
Industrial energy eciency policy measures in selected developing countries

8/2/2019 Unido Full Report eBook
http://slidepdf.com/reader/full/unido-full-report-ebook 238/259
I ND U S T r I A l E NE r GY E F F I C I E N C Y P Ol I C Y ME A S Ur E S
219
A14
Financial and investment policies Technology policies
S u b s i d i e s
E n e r g y - e f c i e n c y
u n d s a n d l o w -
i n t e r e s t l o a n s
E n e r g y s e r v i c e s
c o m p a n i e s
I n t e r n a t i o n a l
f n a n c i n g o r
i n d u s t r i a l e n e r g y
e f c i e n c y
I n d u s t r i a l
e n e r g y - e f c i e n c y
r e s e a r c h a n d
d e v e l o p m e n t
D e m o n s t r a t i o n
c a m p a i g n s
F a c i l i t a t i n g
d e p l o y m e n t o
i n d u s t r i a l e n e r g y
t e c h n o l o g i e s
E n h a n c i n g l o c a l
a b s o r p t i v e
c a p a c i t y
I n t e r n a t i o n a l
c o o p e r a t i o n
✔ ✔
✔ ✔
✔ ✔ ✔
✔ ✔ ✔ ✔ ✔ ✔
✔
✔
✔ ✔
✔
✔ ✔ ✔ ✔
✔
✔
✔ ✔
✔ ✔ ✔ ✔ ✔ ✔
✔ ✔ ✔ ✔
✔ ✔ ✔ ✔ ✔ ✔ ✔ ✔ ✔
✔ ✔
✔ ✔
✔
✔ ✔ ✔
✔
✔ ✔
✔ ✔ ✔ ✔ ✔
✔ ✔ ✔ ✔ ✔ ✔
✔ ✔
✔
✔ ✔ ✔ ✔ ✔
✔ ✔ ✔ ✔
✔ ✔ ✔ ✔ ✔ ✔
✔
✔ ✔
✔ ✔ ✔ ✔ ✔
✔
8 18 11 21 6 6 2 10 12

8/2/2019 Unido Full Report eBook
http://slidepdf.com/reader/full/unido-full-report-ebook 239/259

8/2/2019 Unido Full Report eBook
http://slidepdf.com/reader/full/unido-full-report-ebook 240/259
221
ACEEE (American Council or an Energy-Eicient
Economy), 2009. Barriers to Energy Eciency Invest-
ments and Energy Management in the U.S. Indus-
trial Sector. Available at <http://aceee.org/act-sheet/
barriers-energy-eiciency-investments-and-energy-
managemen>.———, 2011. Missouri’s Energy Eciency Potential: Oppor-
tunities or Economic Growth and Energy Sustainability.
Report Number E 114, August, Washington, DC.
ADB (Asian Development Bank), and IGES (Institute
or Global Environmental Strategies), 2008. oward
Resource-Ecient Economies in Asia and the Pacic:
Reduce, Reuse and Recycle. Manila.
AHAG (Ad-Hoc Advisory Group on IC Energy E-
ciency), 2008. IC or Energy Eciency. Brussels: Euro-
pean Commission, Directorate-General or Inorma-tion Society and Media.
AGECC (he Secretary-General’s Advisory Group on
Energy and Climate Change), 2010. Energy or a Sus-
tainable Future: Summary Report and Recommenda-
tions. New York: United Nations.
Aiginger, K., 2006. Competitiveness: From a Dangerous
Obsession to a Welare Creating Ability with Positive
Externalities. Journal o Industry, Competition and
rade, 6(2), pp. 161–177.
Amsden, A.H., 2001. Te Rise o “ the Rest:” Challenges to theWest om Late-Industrializing Economies. New York:
Oxord University Press.
Anderson, S., and Newell, R., 2004. Inormation Programs
or echnology Adoption: Te Case o Energy-Eciency
Audits. Resource and Energy Economics, 26(1), pp. 27–50.
Ang, B.W., and Zhang, F.Q., 2000. A Survey o Index
Decomposition Analysis in Energy and Environmental
Studies. Energy, 25(12), pp. 1149–1176.
ANME (unisian National Agency or Energy Conser-
vation), n.d. Energy Eciency in the Industrial Sector .
Available at <www.anme.nat.tn/index.asp?pId=157>.
APERC (Asia Pacic Energy Research Centre), 2006.
APEC Energy Demand and Supply Outlook 2006: Pro-
jections to 2030, Economy Review. okyo.
———, 2009. Peer Review on Energy Eciency in Vietnam:
Final Report . okyo. Available at <www.ieej.or.jp/
aperc/PREE/PREE_Vietnam.pd>.
———, 2010a. Compendium o Energy Eciency Policies o
APEC Economies. okyo. Available at <www.ieej.or.jp/
aperc/CEEP/CEEP-all.pd>.———, 2010b. Pathways to Energy Sustainability: Meas-
uring APEC Progress in Promoting Economic Growth,
Energy Security, and Environmental Protection. Execu-
tive Summary. okyo.
Arburas, R., 1989. Energy Conservation Policies in Jordan,
1985–1988. Energy Policy, 17(6), pp. 591–598.
Archer, D., and Brovkin, V., 2008. Te Millennial Atmos-
pheric Lietime o Anthropogenic CO2. Climatic
Change, 90(3), pp. 283–297.
Ardestani, M., and Shae-Pour, M., 2009. EnvironmentallyCompatible Energy Resource Production – Consump-
tion Pattern (Case Study: Iran). Environment, Develop-
ment and Sustainability, 11(2), pp. 277–291.
Arquit Niederberger, A., and Spalding-Fecher, R., 2006.
Demand-Side Energy Eciency Promotion under the
Clean Development Mechanism: Lessons Learned and
Future Prospects. Energy or Sustainable Development,
10(4), pp. 45–58.
Arrow, K.J., and Debreu, G., 1954. Existence o an Equilib-
rium or a Competitive Economy. Econometrica, 22(3), pp. 265–290.
ASEAN (Association o Southeast Asian Nations), 2010.
ASEAN Plan o Action or Energy Cooperation 2010–
2015. Available at <www.asean.org/22675.pd>.
ASHRAE (American Society o Heating, Rerigerat-
ing and Air-Conditioning Engineers), 1997. RP-351:
Energy Audit Input Procedures and Forms. Atlanta,
GA.
Athukorala, P., 2010. Production Networks and rade Pat-
terns in East Asia: Regionalization or Globalization?
Asian Economic Papers, 10(1), pp. 65–95.
Ayres, R.U., 1998. echnological Progress: A Proposed
Measure. echnological Forecasting and Social Change,
59(3), pp. 213–233.
Reerences

8/2/2019 Unido Full Report eBook
http://slidepdf.com/reader/full/unido-full-report-ebook 241/259
222222
r e F e r e n C e s
———, 2010. I Industrial Energy Eciency Pays, Why Is
It Not Happening? Background paper prepared or the
2011 Industrial Development Report . Vienna: United
Nations Industrial Development Organization.
Ayres, R.U., urton. H., and Casten, ., 2006. Energy E-
ciency, Sustainability and Economic Growth. Energy,
32(5), pp. 634–648.
Ayres, R.U., and Warr, B., 2009. Te Economic Growth
Engine: How Energy and Work Drive Material Prosper-ity. Cheltenham, UK: Edward Elgar Publishing.
Baker, R., Barker, A., Johnston, A., and Kohlhaas, M.,
2008. Te Stern Review: An Assessment o Its Method-
ology. Productivity Commission Sta Working Paper.
Melbourne: Commonwealth o Australia.
Barías, J.L., Browne, J., Sanhueza, E., Silsbe, E., Winkle-
man, S. and Zegras, C., 2005. Getting on rack: Find-
ing a Path or ransportation in the CDM. Manitoba,
Canada: International Institute or Sustainable Devel-
opment. Available at <www.iisd.org/climate/global/ctp.asp>.
Barker, ., Bashmakov, I., Bernstein, L., Bogner, J.E., Bosch,
P.R., Dave, R., Davidson, O.R., Fisher, B.S., Gupta, S.,
Halsnæs, K., Heij, G.J., Kahn Ribeiro, S., Kobayashi,
S., Levine, M.D., Martino, D.L., Masera, O., Metz, B.,
Meyer, L.A., Nabuurs, G.-J., Najam, A., Nakicenovic,
N., Rogner, H.-H., Roy, J., Sathaye, J., Schock, R.,
Shukla, P., Sims, R.E. H., Smith, P. irpak, D.A., Urge-
Vorsatz, D., and Zhou, D., 2007 . echnical Summary.
In Climate Change 2007: Mitigation o Climate Change.Contribution o Working Group III to the Fourth Assess-
ment Report o the Intergovernmental Panel on Climate
Change, eds. Metz, B., Davidson, O.R., Bosch, P.R.,
Dave, R., and Meyer, L.A. Cambridge, UK: Cambridge
University Press.
Barrett, S., 2005. Environment and Statecra: Te Strategy
o Environmental reaty-Making . Oxord, UK: Oxord
University Press.
Bator, F.M., 1958. Te Anatomy o Market Failure. Quar-
terly Journal o Economics, 72(3), pp. 351–379.
Baumert, K., Herzog, ., and Pershing, J., 2005. Navigating
the Numbers: Greenhouse Gas Data and International
Climate Policy. Washington, DC: World Resources
Institute.
Bernstein, L., Roy, J., Delhotal, K.C., Harnisch, J., Mat-
suhashi, R., Price, L., anaka, K., Worrell, E., Yamba,
F., and Fengqi, Z., 2007: Industry. In Climate Change
2007: Mitigation o Climate Change. Contribution o
Working Group III to the Fourth Assessment Report o the
Intergovernmental Panel on Climate Change, eds. Metz,
B., Davidson, O.R., Bosch, P.R., Dave, R., and Meyer,
L.A. Cambridge, UK: Cambridge University Press.
Bhattacharya, A., Ghosh, S., and Jansen, W.J., 2001. Hasthe Emergence o China Hurt Asian Exports? Applied
Economics Letters, 8(4), pp. 217–221.
Birner, S., and Martinot, E., 2005. Promoting Energy-E-
cient Products: GEF Experience and Lessons or Mar-
ket ransormation in Developing Countries. Energy
Policy, 33(14), pp. 1765–1779.
Blázquez-Lidoy, J., Rodríquez, J., and Santiso, J., 2006.
Angel or Devil? China’s rade Impact on Latin Ameri-
can Emerging Markets. Working Paper 25. Paris:
OECD Development Centre.Bogner, J., Abdelrae Ahmed, M., Diaz, C., Faaij, A.,
Gao, Q., Hashimoto, S., Mareckova, K., Pipatti, R.,
and Zhang, ., 2007. Waste Management. In Climate
Change 2007: Mitigation o Climate Change. Contri-
bution o Working Group III to the Fourth Assessment
Report o the Intergovernmental Panel on Climate
Change, eds. Metz, B., Davidson, O.R., Bosch, P.R.,
Dave, R., and Meyer, L.A. Cambridge, UK: Cambridge
University Press.
Boudt, K., odorov, V., and Upadhyaya, S., 2009. Nowcast-ing Manuacturing Value Added or Cross-Country
Comparison. Statistical Journal o the IAOS , 26(1–2),
pp. 15–20.
BP, 2011. Statistical Review o World Energy. London.
Available at <www.bp.com/assets/bp_internet/
globalbp/globalbp_uk_english/reports_and_publica-
tions/statistical_energy_review_2011/SAGING/
local_assets/pd/statistical_review_o_world_energy_
ull_report_2011.pd>.
Brealey, R.A., Myers, S.C., and Allen, F. 2008. Principles
o Corporate Finance. 9th edition. New York: McGraw
Hill/Irwin.
Bremmer, J., Ravensbergen, P. Dueck, ., Kempkes, F., and
Verstegen, J., 2007. Herkennen en Spiegelen. Barrieres

8/2/2019 Unido Full Report eBook
http://slidepdf.com/reader/full/unido-full-report-ebook 242/259
223
r e F e r e n C e s
en kennishiaten bij energiebesparing in de glastuinbouw.
Report 3.07.01. Te Hague, the Netherlands: Agricul-
tural Economics Research Institute.
Brunner, C., 2007. Ecient Electric Motor Systems in Indus-
try. IEA Deployment o Demand Side echnologies,
8–9 October, Paris.
———, 2010. Ecient Electric Motor Systems. International
Developments. Presentation at the Austrian National
Ecient Motors Conerence, 2 March, Vienna.Bulgaria, Republic o, 2004. Energy Eciency Act. Soa.
Available at <www.mi.government.bg/eng/norm/
rdocs/mdoc.html?id=190688>.
Cantore, N., 2010. Social Preerences and Environmental
Kuznets Curve in Climate Change Integrated Assess-
ment Modeling. International Journal o Global Envi-
ronmental Issues, 10(1–2), pp. 123–142.
———, 2011a. Synthesis: Energy Eciency in Developing
Countries or the Manuacturing Sector . WP 15/2011.
Vienna: United Nations Industrial DevelopmentOrganization.
———, 2011b. Factors Aecting Energy Eciency Adop-
tion in the Manuacturing Sector in Developing Coun-
tries. In Synthesis: Energy Eiciency in Developing
Countries or the Manuacturing Sector , ed. Cantore, N.
WP 15/2011. Vienna: United Nations Industrial
Development Organization.
Cantore, N., and Cali, M., 2011. Protability and Energy
Eciency: A Firms Fixed Eect Approach. In Synthesis:
Energy Eciency in Developing Countries or the Manu- acturing Sector , ed. Cantore, N.. WP 15/2011. Vienna:
United Nations Industrial Development Organization.
Cantore, N, and Fokeer, S., 2011. A Decomposition Analy-
sis o Energy Intensity or Developing Countries. In
Synthesis: Energy Eciency in Developing Countries
or the Manuacturing Sector , ed. Cantore, N.. WP
15/2011. Vienna: United Nations Industrial Develop-
ment Organization.
Cantore, N., and te Velde, D.W., 2011. Promoting Energy
Eciency in Developing Countries – New Evidence
Based on Firm Analysis. In Synthesis: Energy Eciency
in Developing Countries or the Manuacturing Sector ,
ed. Cantore, N.. WP 15/2011. Vienna: United Nations
Industrial Development Organization.
CERF (Civil Engineering Research Foundation)/IIEC
(International Institute o Energy Conservation) Asia,
2002. Study o Pumps and Fans Market in China.
Washington, DC.
Chandler, W., and Gwin, H., 2008. Financing Energy E-
ciency in China. Washington, DC: Carnegie Endow-
ment or International Peace.
Chenery, H., Robinson, S., and Syrquin, M., 1986. Industri-
alization and Growth. A Comparative Study. New York:Oxord University Press.
Ciccozzi, E., Checkenya, R., and Rodriguez, A.V., 2003.
Recent Experiences and Challenges in Promot-
ing Cleaner Production Investments in Develop-
ing Countries. Journal o Cleaner Production, 11(6),
pp. 629–638.
Clark, A., 2000. Demand-Side Management Investment in
South Arica: Barriers and Possible Solutions. Energy
or Sustainable Development, 4(4), pp. 27–35.
Clarke, L., Wise, M., Placet, M., Izaurralde, R.C., Lurz, J.P.,Kim, S.H., Smith, S.J., and Tomson, A.M., 2006. Cli-
mate Change Mitigation: An Analysis o Advanced ech-
nology Scenarios. PNNL-16078. Richland, WA: Pacic
Northwest National Laboratory.
CLASP (Collaborative Labeling and Appliance Stand-
ards Program), 2009. Energy-Eiciency Labels and
Standards: An Overview. Washington, DC. Available
at <www.clasponline.org/GB2ndEdition/Chapter2/
Chapter2.htm>.
Cleveland, C., Costanza, R., Hall, C.A.S., and Kaumann,R., 1984. Energy and the US Economy: A Biophysical
Perspective. Science, 255(4665), pp. 890–897.
Cleveland, C.J., Kaumann, R.K., and Stern, D.I., 2000.
Aggregation and the Role o Energy in the Economy.
Ecological Economics, 32(2), pp. 301–317.
CNPML (Centro Nacional de Producción Más Limpia),
2005. Sustainable Industrial Production Stories 2005:
Aceros Industriales. Medellín, Colombia. Available at
<www.lineadecreditoambiental.org/html/archivos/
Aceros%20Industriales%20Colombia%20-%20Ingles.
pd>.
Cohen, W.M., and Levinthal D.A., 1990. Absorptive
Capacity: A New Perspective on Learning and Innova-
tion. Administrative Science Quarterly, Special Issue:

8/2/2019 Unido Full Report eBook
http://slidepdf.com/reader/full/unido-full-report-ebook 243/259
224224
r e F e r e n C e s
echnology, Organizations, and Innovation, 35(1), pp.
128–152.
Coito, F., Powell, F., Worrell, E., Price, L., and Friedman,
R., 2005. Case Study o the Caliornia Cement Indus-
try. Proceedings o the 2005 ACEEE Summer Study on
Energy Eciency in Industry. West Point, NY.
Cole, D.H., 2008. Climate Change and Collective Action.
Bloomington, IN: Indiana University Maurer School
o Law, Indiana University School o Public and Envi-ronmental Aairs, and Indiana University Blooming-
ton Workshop in Political Teory and Policy Analysis.
Compton, M., 2011. Industrial Energy Eciency in Devel-
oping Countries – A Background Note. WP 03/11.
Vienna: United Nations Industrial Development
Organization.
Cook, E., 1971. Te Flow o Energy in an Industrial Society.
Scientic American, 225(3), pp. 135–142.
———, 1972. Man, Energy, Society. San Francisco, CA:
WH Freeman and Company.Cooremans, C., 2009. Te Role o Formal Capital Budget-
ing Analysis in Corporate Investment Decision-Making:
A Literature Review. Summer Study 2009. Stockholm:
European Council or an Energy Ecient Economy.
Dasgupta, S., Lucas, R.E.B., and Wheeler, D., 1998. Small
Manuacturing Plants, Pollution and Poverty: New Evi-
dence om Brazil and Mexico. Policy Research Working
Paper 2029. Washington, DC: World Bank.
Davidsdottir, B., and Ruth, M., 2004. Capital Vintage
and Climate Change Policies: Te Case o US Pulpand Paper. Environmental Science and Policy, 7(3), pp.
221–233.
———, 2005. Pulp Nonction: Regionalized Dynamic
Model o the U.S. Pulp and Paper Industry, Journal o
Industrial Ecology, 9(3), pp. 1–21.
———, 2008. Changing Stocks and Flows in Industrial Eco-
systems. Northampton, MA: Edward Elgar Publishing.
Davis, S., and Caldeira, K., 2010. Consumption-Based
Accounting o CO2 Emissions. Proceedings o the
National Academy o Sciences o the United States o
America, 107(12), pp. 5687–5692.
de Almeida, A.., Ferreira, F.J..E., and Both, D., 2005.
echnical and Economic Considerations in the Appli-
cation o Variable-Speed Drives with Electric Motor
Systems. IEEE ransactions on Industry Applications,
41(1), pp. 188–199.
De Beer, J.G., 1998. Potential or Industrial Energy-
Eciency Improvement in the Long erm. PhD Tesis.
Utrecht University, Utrecht, the Netherlands.
De Simone, G., 2010. Industrial Energy Eciency in Colom-
bian and Peruvian Companies. Background paper
prepared or the 2011 Industrial Development Report.
Vienna: United Nations Industrial DevelopmentOrganization.
DeCanio, S.J., 1993. Barriers within Firms to Energy-E-
ciency Investments. Energy Policy, 21(9), pp. 906–914.
Devlin, R., Estevadeordal, A., and Rodriguez-Clare, A.,
eds., 2006. Te Emergence o China: Opportunities and
Challenges or Latin America and the Caribbean. Wash-
ington, DC: Inter-American Development Bank and
the David Rockeeller Center or Latin American Stud-
ies, Harvard University.
Doms, M.E., and Dunne, ., 1998. Capital AdjustmentPatterns in Manuacturing Plants. Review o Economic
Dynamics, 1(2), pp. 409–429.
ECLAC (Economic Commission or Latin America and
the Caribbean), 2009. Energy Eciency in Latin Amer-
ica and the Caribbean: Situation and Outlook. Project
document. Santiago. Available at <ww w.eclac.org/pub-
licaciones/xml/2/39412/lcw280i.pd>.
———, 2010. Energy Eciency in Latin America and the
Caribbean: Situation and Outlook. Santiago.
Economic imes, 2011. India to Set Energy Eciency ar- gets or Industries. 11 January. Available at <http://
articles.economictimes.indiatimes.com/2011-01-11/
news/28429961_1_energy-eciency-industrial-units
-industrial-sectors>.
ECOWAS (Economic Community o West Arican States),
2003. ECOWAS Energy Protocol A/P4/1/03. Available
at <www.comm.ecowas.i nt/sec/en/protocoles/WA_
EC_Protocol_English-_DEFINIIF.pd>.
EEEP (Equipment Energy Eiciency Program), 2010.
Improving the Energy Eciency o Industrial Equip-
ment . Barton, Australia. Available at <www.energyrat-
ing.gov.au/library/pubs/201009-indust-equip.pd>.
EEPC (Engineering Export Promotion Council) India,
2006. Market Survey Report on China Motor Systems.

8/2/2019 Unido Full Report eBook
http://slidepdf.com/reader/full/unido-full-report-ebook 244/259
225
r e F e r e n C e s
Engineering Export Bulletin, 8(42), pp. 6–15. Available
at <http://eepcindia.org/bulletin/b20061018/FI0842.
pd>.
EIB (Energy Inormation Bureau), Malaysia, n.d. Energy
Eciency: Cases on Energy Savings in Manuacturing.
Available at <http://eib.org.my/index.php?page=article
&item=98,107,109,110>.
Eichhammer, W., and Walz, R., 2011. Industrial Energy
Eiciency and Competitiveness. WP 05/2011. Vienna: United Nations Industrial Development
Organization.
Eichhorst, U., and Bongardt, D., 2009. owards Coopera-
tive Policy Approaches in China: Drivers or Voluntary
Agreements on Industrial Energy Eciency in Nan-
jing. Energy Policy, 37(5), pp. 1855–1865.
Elkington, J., 1998. Te ‘riple Bottom Line’ or 21st Century
Business. In Companies in a World o Confict: NGOs,
Sanctions and Corporate Responsibility, ed. Mitchell, J.
London: Te Royal Institute o International Aairs.Ellingson, M., and Hunter, L., 2010. Compendium o Best
Practices: Sharing Local and State Successes in Energy
Eciency and Renewable Energy om the United States .
Vienna: Renewable Energy and Energy Eciency Part-
nership; Washington, DC: Alliance to Save Energy;
Washington, DC: American Council On Renewable
Energy.
Energy Foundation, n.d. Energy Van Service. Available at
<www.ghanae.org/services/energyvan.htm>.
Enevoldsen, M.K., Ryelund, A.V., and Andersen, M.S.,2007. Decoupling o Industrial Energy Consumption
and CO2 Emissions in Energy-Intensive Industries in
Scandinavia. Energy Economics, 29(4), pp. 665–692.
Etzkowitz, H., and Carvalho de Mello, J., 2004. Te Rise
o a riple Helix Culture: Innovation in Brazilian Eco-
nomic and Social Development. International Journal
o echnology Management and Sustainable Develop-
ment, 2(3), pp. 159–171.
EU (European Union), 1996. Council Directive 96/61/EC
o 24 September 1996 Concerning Integrated Pollution
Prevention and Control . Brussels.
Eurostat, 2010. Energy Statistics. Available at <http://epp.
eurostat.ec.europa.eu/portal/page/portal/energy/data/
main_tables>.
FEI (Federation o Egyptian Industries), n.d. Environmen-
tal Compliance Oce and Sustainable Development
Supporting Small and Medium Enterprises. Available at
<www.eco-ei.org>.
Fleiter, ., Eichhammer, W., and Schleich, J., 2011. Energy
Eciency in Electric Motor Systems: echnical Poten-
tials and Policy. WP 11/2011. Vienna: United Nations
Industrial Development Organization.
Fokeer, S., 2010. Industrial Energy Eciency in uni- sian Companies. Background paper prepared or the
2011 Industrial Development Report. Vienna: United
Nations Industrial Development Organization.
Fokeer, S., Lowndes, I., and Kingman, S., 2009. An Experi-
mental Investigation o Pneumatic Swirl Flow Induced
by a Tree-Lobed Helical Pipe. International Journal o
Heat and Fluid Flow, 30(2), pp. 369–379.
Foxon, ., Makuch, Z., Mata, M., and Pearson, P., 2004.
Innovation Systems and Policy-Making Processes or the
ransition to Sustainabil ity. In Governance or Industrial ransormation: Proceedings o the 2003 Berlin Coner-
ence on the Human Dimensions o Global Environmental
Change, eds., Jacob, K., Binder, M., and Wieczorek, A.
Berlin: Environmental Policy Research Centre.
Freeman, C., and Soete, L., 1997. Te Economics o Indus-
trial Innovation. Cambridge, MA: MI Press.
Fugazza, M. and Vanzetti, D., 2008. A South-South Sur-
vival Strategy: Te Potential or rade among Develop-
ing Countries. World Economy, 31(5), pp. 663–684.
Furubotn, E.G., and Richter, R., 1997. Institutions and Eco-nomic Teory: Te Contribution o the New Institutional
Economics. Ann Arbor, MI: University o Michigan Press.
Galitsky, C., Price, L., and Worrell, E., 2004. Energy E-
ciency Programs and Policies in the Industrial Sector in
Industrialized Countries. LBNL-54068. Berkeley, CA:
Lawrence Berkeley National Laboratory.
Gallagher, K., Moreno Brid, J.C., and Porzecanski, R.,
2008. Te Dynamism o Mexican Exports: Lost in
(Chinese) ranslation? World Development, 36(8), pp.
1365–1380.
Garcia, A.G.P., Szklo, A.S., Schaeer, R., and McNeil,
M.A., 2007. Energy-Eciency Standards or Electric
Motors in Brazilian Industry. Energy Policy, 35(6), pp.
3424–3439.

8/2/2019 Unido Full Report eBook
http://slidepdf.com/reader/full/unido-full-report-ebook 245/259
226226
r e F e r e n C e s
Gardner, D.., and Elkha, M.A.., 1998. Understanding
Industrial Energy Use: Structural and Energy Intensity
Changes in Ontario Industry. Energy Economics, 20(1),
pp. 29–41.
GEF (Global Environmental Facility), 2004. Vietnam:
Promoting Energy Conservation in Small and Medium
Scale Enterprises: Responses to GEF Council Comments.
Washington, DC.
———, 2010. Good Practices and Lessons. Mitigation: Energy Eciency. Washington, DC. Available at <www.thege.
org/ge/node/2202>.
———. 2011. Improving Small Scale Brick Kiln Eciency,
Viet Nam. GEF Small Grant Project. Washington, DC.
Available at <http://sgp.undp.org/download/SGP_
VietNam.pd>.
Geiser, K., 2001. Materials Matter: owards a Sustainable
Materials Policy. Cambridge, MA: MI Press.
Georgy, R.Y., and Soliman, A.., 2007. Energy Eciency
and Renewable Energy: Egypt National Study. Mediter-ranean and National Strategies or Sustainable Devel-
opment. Priority Field o Action 2: Energy and Climate
Change. Sophia Antipolis, France: Plan Bleu. Available
at <www.planbleu.org/publications/atelier_energie/
EG_National_Study_Final.pd>.
Ghosh, D., 2011. Approach to Energy Eciency among
Micro, Small and Medium Enterprises in India: Results
o a Field Survey. WP 08/2011. Vienna: United Nations
Industrial Development Organization.
Gielen, D., 2009. Design o a Financing Instrument or Energy Eciency and Renewables in Indian SMEs.
Vienna: United Nations Industrial Development
Organization.
Gillingham, K., Newell, R., and Palmer, K., 2006. Energy
Eciency Policies: A Retrospective Examination. Annual
Review o Environment and Resources, 31, pp. 161–192.
———, 2009. Energy Eciency Economics and Policy.
Annual Review o Resource Economics, 1, pp. 597–620.
Giuliani, E., and Bell, M., 2005. Te Micro-Determinants
o Meso-Level Learning and Innovation: Evidence
rom a Chilean Wine Cluster. Research Policy, 34(1):
pp. 47–68.
Goldman, C.A., Osborn, J.G., Hopper, N.C., and Singer,
.E., 2002. Market rends in the U.S. ESCO Industry:
Results om the NAESCO Database Project. Berkeley,
CA: Lawrence Berkeley National Laboratory.
Golove, W.H., and Eto, J.H., 1996. Market Barriers to Energy
Eciency: A Critical Reappraisal o the Rationale or Pub-
lic Policies to Promote Energy Eciency. LBNL-38059.
Berkeley, CA: Lawrence Berkeley National Laboratory.
Gordon, M.J., 1955. Te Payo Period and the Rate o
Prot. Te Journal o Business, 28(4), pp. 253–260.
Gough, I., 1996. Social Welare and Competitiveness. New Political Economy, 1(2), pp. 209–232.
Grasso, M., 2004. Climate Change: Te Global Public Good .
Department o Economics Working Paper 75. Bicocca,
Italy: University o Milan.
Greenwald, B., and Stiglitz, J.E., 1987. Keynesian, New
Keynesian and New Classical Economics. Oxord Eco-
nomic Papers, 39(1), pp. 119–133.
Grubb, M., 2004. echnology Innovation and Climate
Change Policy: An Overview O Issues and Options.
Keio Economic Studies, 41(2), pp. 103–132.Guinnée, J.B., Gorrée, M., Heijungs, R., Huppes, G.,
Kleijn, R., de Koning, A., van Oers, L., Wegener
Sleeswijk, A., Suh, S., Udo de Haes, H.A., de Bruijn, H.,
van Duin, R., and Huijbregts, M.A.J., 2002. Handbook
on Lie Cycle Assessment: Operational Guide to ISO
Standards. Dordrecht, the Netherlands: Kluwer Aca-
demic Publishers.
Gupta, S., irpak, D.A., and Burger, N., 2007. Policies,
Instruments and Co-operative Arrangements. In
Climate Change 2007: Mitigation. Contribution o Working Group III to the Fourth Assessment Report o
the Intergovernmental Panel on Climate Change, eds.
Metz, B., Davidson, O.R., Bosch, P.R., Dave, R., and
Meyer, L.A. Cambridge, UK: Cambridge University
Press.
Hamed, M. and Mahgary, Y., 2004. Outline o a National
Strategy or Cleaner Production: Te Case o Egypt.
Journal o Cleaner Production, 12(4), pp. 327–336.
Hammond, G.P., and Jones, C.I., 2008. Inventory o Car-
bon and Energy. Version 1.6a. Bath, UK: University o
Bath, Sustainable Energy Research eam.
Hang, L., and u, M., 2007. Te Impacts o Energy Prices
on Energy Intensity: Evidence rom China. Energy Pol-
icy, 35(5), pp. 2978–2988.
8/2/2019 Unido Full Report eBook
http://slidepdf.com/reader/full/unido-full-report-ebook 246/259
227
r e F e r e n C e s
Hansen, S., Langlois, P., and Bertoldi, P., 2009. ESCOs
around the World: Lessons Learned in 49 Countries. Lil-
burn, GA: Fairmont Press.
Harris, P.G., 2007. Collective Action on Climate Change:
Te Logic o Regime Failure. Natural Resources Jour-
nal, 47(1), pp. 195–224.
Hasanbeigi, A., Menke, C., and du Pont, P., 2010. Barriers
to Energy Eciency Improvement and Decision-Mak-
ing Behaviour in Tai Industry. Energy Eciency, 3(1), pp. 33–52.
Hassett K.A., and Metcal, G.E., 1995. Energy ax Cred-
its and Residential Conservation Investment: Evidence
rom Panel Data. Journal o Public Economics, 57(2), pp.
201–217.
Hawken, P., Lovins, A., and Lovins, L.H., 1999. Natural
Capitalism: Creating the Next Industrial Revolution.
Boston, MA: Little, Brown and Company.
Helgerud, H.E., and Sandbakk, M., 2009. Energy Eciency
in the Food and Drink Industry: Te Road to Bench-marks o Excellence. Summer Study 2009. Stockholm:
European Council or an Energy Ecient Economy.
Hirsh, R.L., Bezdeg, R ., and Wendling, R., 2005. Peaking
o World Oil Production and its Mitigation. American
Institute o Chemical Engineering Journal, 52(1), pp.
1–6.
Holland, F.A., and Watson, F.A., 1976. Payback Period,
Discounted Cash Flow Rate o Return and Added
Value or Manuacturing Processes. Engineering and
Process Economics, 1(4), pp. 293–299.Holliday, C., Schmidheiny, S., and Watts, P., 2002. Walk-
ing the alk: Te Business Case or Sustainable Develop-
ment . Sheeld, UK: Greenlea Publishing.
Howells M., House J., and Laitner J., 2005. Beyond the
Baseline – Large Scale Climate Friendly Development.
Paper presented at the Annual Meeting o the Interna-
tional Energy Workshop, 5–7 July, Kyoto, Japan.
Hughes, K.S., 1993. Te Role o echnology, Competition
and Skill in European Competitiveness. European Com-
petitiveness. Cambridge, UK: Cambridge University
Press.
IAC (Inter Academy Council), 2010. Climate Change
Assessments: Review o the Processes and Procedures o the
Intergovernmental Panel on Climate Change . New York.
IAI (International Aluminum Institute), 2008. Improving
Sustainability in the ransport Sector through Weight
Reduction and Application o Aluminium. London.
IEA (International Energy Agency), 2006a. Energy ech-
nology Perspectives: Scenarios & Strategies to 2050 . Paris.
———, 2006b. World Energy Outlook 2006 . Paris.
———, 2007a. Climate Change 2007: Mitigation o Cli-
mate Change. Contribution o Working Group III to
the Fourth Assessment Report o the Intergovernmental Panel on Climate Change, eds., Metz, B., Davidson,
O.R., Bosch, P.R., Dave, R. and Meyer, L.A. Cam-
bridge, UK: Cambridge University Press.
———, 2007b. Experience with Energy Eciency Regula-
tions or Electrical Equipment . IEA Inormation Paper.
Paris.
———, 2007c. Mind the Gap—Quantiying Principal-Agent
Problems in Energy Eciency. Paris.
———, 2007d. racking Industrial Energy Eciency and
CO 2 Emissions. Energy Indicators. Paris.———, 2008a. Energy Eciency Policies and Measures.
Paris. Available at <www.iea.org/testbase/pm/index_
e.asp>.
———, 2008b, Energy echnology Perspectives 2008–Sce-
narios and Strategies to 2050 . Paris.
———, 2008c. World Energy Outlook Policy Database. Avail-
able at <www.iea.org/extbase/pm/?mode=weo>.
———, 2008d. Deploying Renewables: Principles or Eec-
tive Policies. Paris.
———, 2009a. Cement echnology Roadmap 2009: Carbon Emissions Reductions up to 2050 . Paris.
———, 2009b. Energy echnology ransitions or Industry:
Strategies or the Next Industrial Revolution. Paris.
———, 2009c. Key Energy Statistics 2009. Paris.
———, 2010a. CO 2 Emissions om Fuel Combustion. Paris.
———, 2010b, Energy echnology Perspectives 2010: Sce-
narios and Strategies to 2050 . Paris.
———, 2010c. Extended World Energy Balances. IEA
World Energy Statistics and Balances. Paris.
———, 2010d. RD&D Database 2010 . Paris.
———, 2010e. World Energy Outlook 2010 . Paris.
———, 2011. IEA & Business: Partnering to Deliver Results.
Paris. Available at <http://www.iea.org/publications/
ree_new_Desc.asp?PUBS_ID=2280>.

8/2/2019 Unido Full Report eBook
http://slidepdf.com/reader/full/unido-full-report-ebook 247/259
228228
r e F e r e n C e s
IFA (International Fertilizer Industry Association), 2009.
Energy Eciency and CO 2 Emissions in Ammonia Pro-
duction 2008–2009. Summary Report. Paris.
IISI (International Iron and Steel Institute), 1998. Energy
Use in the Steel Industry. Brussels.
IMF (International Monetary Fund), 2010. Regional Eco-
nomic Outlook or Asia and the Pacic . Washington,
DC.
IPCC (Intergovernmental Panel on Climate Change),1996. Special Report on Methodological and echnologi-
cal Issues in echnology ranser . Geneva.
———, 2000. Methodological and echnological Issues
in echnology ranser . Available at <www.grida.
no/publications/other/ipcc_sr/?src=/climate/ipcc/
tectran/035.htm>.
———, 2007. Summary or Policy Makers. In Climate
Change 2007: Synthesis Report, eds. Pachauri, R.K., and
Resinger, A. Cambridge, UK: Cambridge University
Press.IPEEC (International Partnership or Energy Eciency
Cooperation), 2010. International Partnership or
Energy Eciency Cooperation Holds First Global Policy
Meeting. Available at <www.newenergyworldnetwork.
com/renewable-energy-news/by-technology/energy
-eiciency/international-partnership-or-energy
-eiciency-cooperation-holds-irst-global-policy
-meeting.html>.
———, 2011. Improving Policies through Energy Eciency
Indicators (IPEEI). Available at <www.ipeec.org>.IPIECA (International Petroleum Industry Environmental
Conservation Association), 2006. Increasing the Pace o
echnology Innovation and Application: Enabling Cli-
mate Change Solutions. Summary Workshop Report,
27–28 September, Washington, DC.
ISO (International Oce o Standardization), 1997a. ISO
14040 Environmental Management—Lie Cycle Assess-
ment—Principles and Framework. Geneva.
———, 1997b. ISO 14041 Environmental Management—
Lie Cycle Assessment—Goals and Scope Denition and
Inventory Analysis. Geneva.
———, 1999a. ISO 14042 Environmental Management—
Lie Cycle Assessment—Lie Cycle Impact Assessment .
Geneva.
———, 1999b. ISO 14043 Environmental Management—
Lie Cycle Assessment—Lie Cycle Interpretation.
Geneva.
Jaccard, I., 2009. Paradigms o the Costs o Energy E-
ciency and Teir Policy Implications. Background paper
prepared or the 2011 Industrial Development Report
2011. Vienna: United Nations Industrial Development
Organization.
Jae, A.B., Newell, R.G., and Stavins R.N., 2004. A ale o wo Market Failures. echnology and Environmental
Policy. Ecological Economics, 54(2–3), pp. 164–174.
Jae, A.B., Stavins, R.G., and Newell, R.N., 1995. Dynamic
Incentives o Environmental Regulations: Te Eects
o Alternative Policy Instruments on echnology Di-
usion. Journal o Environmental Economics and Man-
agement, 29(3), pp. 43–63.
Jenkins H., and Saunders H., 2011. Does Energy Eciency
Lead to Increased Energy Consumption? Making It , 6,
pp. 10–14. Jenne, C.A., and Cattell, R.K., 1983. Structural Change
and Energy Eciency in Industry. Energy Economics,
5(2), pp. 114–123.
Jochem, E., and Gruber, E., 2007. Local Learning-Networks
on Energy Eciency in Industry—Successul Initiative in
Germany. Amsterdam: Elsevier.
———, 2010. Impacts and Challenges o a Growing Rela-
tionship between China and Sub-Saharan Arica. In
Te Political Economy o Aica, ed. Padayachee, V. Lon-
don: Routledge.Kahneman D., and versky, A., eds., 2000. Choices, Values
and Frames. New York: Cambridge University Press
and the Russell Sage Foundation.
Kahrl, F., and Roland-Holst, D., 2009. Growth and struc-
tural change in China’s energy economy. Energy, 34(7),
pp. 894–903.
Kanbur, R., and Squire, L., 1999. Te Evolution o Tink-
ing about Poverty: Exploring the Interactions. Paper
presented at the Symposium on Future o Development
Economics in Perspective, 13–14 May, Dubrovnik,
Croatia.
Kaplinsky, R., McCormick, D., and Morris, M., 2006. Te
Impact o China on Sub-Saharan Aica. Agenda-set-
ting paper prepared or the Institute o Development

8/2/2019 Unido Full Report eBook
http://slidepdf.com/reader/full/unido-full-report-ebook 248/259
229
r e F e r e n C e s
Studies, Department or International Development,
Brighton, UK.
———, 2010. Impacts and Challenges o a Growing Rela-
tionship between China and Sub-Saharan Arica. In
Te Political Economy o Aica, ed. Padayachee, V. Lon-
don: Routledge.
Kemp, I.C., 2007. Pinch Analysis and Process Integration—
A User Guide on Process Integration or the Ecient Use
o Energy. Amsterdam: Elsevier.Kenya Association o Manuacturers, n.d. Energy Manage-
ment Awards. Available at <ww w.kam.co.ke/ema/>.
Keohane, R.O., 1984. Aer Hegemony: Cooperation and
Discord in the World Political Economy. Princeton, NJ:
Princeton University Press.
Kerssemeeckers, M., 2002. Te Dutch Long-term Voluntary
Agreements on Energy Eciency Improvement in Indus-
try. Utrecht, the Netherlands: Ecoys.
Kleindorer, P.R., 2011. Risk Management or Energy E-
ciency Projects in Developing Countries. WP 06/2011. Vienna: United Nations Industrial Development
Organization.
Koc, E., and Kaplan E., 2007. An Investigation on Energy
Consumption in Yarn Production with Special Re-
erence to Ring Spinning. Fibres & extiles in Eastern
Europe, 15(4), pp. 18–25.
Korevaar, E., Farla, J., Blok, K., and Schulte Fischedick, K.
1997. A Preliminary Analysis o the Dutch Voluntary
Agreements on Energy Eiciency Improvement: he
Energy Eciency Challenge. Proceedings rom the 1997European Council or an Energy Ecient Economy
Summer Study Conerence, 9–14 June, Splinderův
Mlýn, Czech Republic.
Kosonen, K., and Nicodème, G.J.A., 2009. Te Role o Fiscal
Instruments in Environmental Policy. Working Paper
2719. Munich: CESio Group.
Krarti, M., 2000. Energy Audit o Building Systems: An
Engineering Approach. Mechanical and Aerospace
Engineering Series. Boca Raton, FL: CRC Press.
Krausmann, S., Fischer-Kowalski, M., Schandl, H., and
Eisenmenger, N., 2008. Te Global Sociometabolic
ransition: Past and Present Metabolic Proles and
their Present rajectories. Journal o Industrial Ecology,
12(5–6), pp. 637–656.
Lall, S., 1998. Exports o Manuactures by Developing
Countries: Emerging Patterns o rade and Location.
Oxord Review o Economic Policy, 14(2) pp. 54–73.
Lall, S., and Albaladejo, M., 2004. China’s Competitive
Perormance: A Treat to East Asian Manuactured
Exports? World Development, 32(9), pp. 1441–1466.
Lall, S., Albaladejo, M., and Zhang, J., 2004. Mapping
Fragmentation: Electronics and Automobiles in East
Asia and Latin America. Oxord Development Studies, 32(3), pp. 407–432.
Lall, S., and J. Weiss, 2005. People’s Republic o China’s
Competitive Treat to Latin America: An Analysis
or 1990–2002. Oxord Development Studies, 33(2),
163–194.
Lall, S., Weiss, J., and Zhang, J., 2006. Te “Sophistication”
o Exports: A New Measure o Product Characteristics.
Working Paper 123. Queen Elizabeth House, Univer-
sity o Oxord, Oxord, UK.
Lawrence Berkeley National Laboratory, EnvironmentalEnergy echnologies Division, International Energy
Studies, n.d. Industrial Energy Use Analysis. Berkeley,
CA. Available at <http://ies.lbl.gov/node/387>.
Le, H.V., 2010. Industrial Energy Eciency in Vietnam-
ese Companies. Background paper prepared or the
2011 Industrial Development Report . Vienna: United
Nations Industrial Development Organization.
Leley, F., 1996. he Payback Method o Investment
Appraisal: A Review and Synthesis. International Jour-
nal o Production Economics, 44(3), pp. 207–224.Lempert, R.J., Popper, S.W., Resetar, S.A., and Hart, S.L.,
2002. Capital Cycles and the iming o Climate Change
Policy. Arlington, VA: Pew Center on Global Climate
Change.
Lenzen, M., 2008. Lie Cycle Energy and Greenhouse Gas
Emissions o Nuclear Energy: A Review. Energy Con-
version and Management, 49(8), pp. 2178–2199.
Levine, M.D., and Liu, X., 1990. Energy Conservation Pro-
grams in the People’s Republic o China. Berkeley, CA:
Lawrence Berkeley National Laboratory.
Levine, M.D., Price, L., Zhou, N., Fridley, D., Aden, N.,
Lu, H., McNeil, M., Zheng, N., Qin, Y., and Yowar-
gana, P., 2010. Assessment o China’s Energy-Saving and
Emission-Reduction Accomplishments and Opportunities

8/2/2019 Unido Full Report eBook
http://slidepdf.com/reader/full/unido-full-report-ebook 249/259
230230
r e F e r e n C e s
During the 11th Five-Year Plan. Berkeley, CA: Law-
rence Berkeley National Laboratory.
Linares, P., and Labandeira, X., 2010. Energy Eciency:
Economics and Policy. Journal o Economic Surveys,
24(3), pp. 573–592.
Liu N., and Ang, B.W., 2007. Factor Shaping Aggregate
Energy Intensity rend or Industry: Energy Intensity
versus Product Mix. Energy Economics, 29(4), 2007, pp.
609–635.Liu, Z., Sinton, J.E., Yang, F., Levine, M.D., and ing,
M.K., 1994. Industrial Sector Energy Conservation Pro-
grams in the People’s Republic o China during the Sev-
enth Five-Year Plan (1986–1990). Berkeley, CA: Law-
rence Berkeley National Laboratory.
Lovins, A.B, 2004. Energy Eciency, axonomic Over-
view. Encyclopedia o Energy, 2, pp. 383–401.
———, 2007. Public Lectures in Advanced Energy Eciency:
2. Industry . Palo Alto, CA: Stanord University, School
o Engineering. Available at <www.rmi.org/rmi/Stanord+Energy+Lectures>.
Luken, R., and Van Rompaey, F., 2008. Drivers or and
Barriers to Environmentally Sound echnology Adop-
tion by Manuacturing Plants in Nine Developing
Countries. Journal o Cleaner Production, 16(1), pp.
67–77.
MacLean, J., an, J., irpak, D., Sonntag-O’Brien, V., and
Usher, E., 2008. Public Finance Mechanisms to Mobilise
Investment in Climate Change Mitigation. New York:
United Nations Environment Programme, SustainableEnergy Finance Initiative.
Makinson, S., 2006. Public Finance Mechanisms to increase
investment in Energy Eciency. New York: United
Nations Environment Programme, Basel Agency or
Sustainable Energy.
Mallett, A., Nye, S., and Sorrell, S., 2011. Policy Options
to Overcome Barriers to Industrial Energy Eciency in
Developing Countries. WP 13/2011. Vienna: United
Nations Industrial Development Organization.
Malik, A., and emple, J.R.W., 2009. Te Geography o
Output Volatility. Journal o Development Economics,
90(2), pp. 163–178.
Masselink, D.J., 2008. Barriers to Investments in Energy
Saving echnologies – Case Study or the Industry.
Petten, the Netherlands: Energy Research Centre o
the Netherlands.
———, 2009. Industrial Energy Eciency in Nigerian Com-
panies. Background paper prepared or the 2011 Indus-
trial Development Report . Vienna: United Nations
Industrial Development Organization.
———, 2010. Barriers to Investments in Industrial Energy
Eciency: Focus on Developing Countries. Background
paper prepared or the 2011 Industrial Development Report . Vienna: United Nations Industrial Develop-
ment Organization.
Mayer, J., Butkevicius, A., Kadri, A., and Pizarro, J., 2003.
Dynamic Products in World Exports. Review o World
Economics, 139(3), pp. 762–795.
McKane, A., Scheihing, P., and Williams, R., 20 08. Certi-
ying Industrial Energy Eciency Perormance: Align-
ing Management, Measurement, and Practice to Cre-
ate Market Value. Berkeley, CA: Lawrence Berkeley
National Laboratory.McKinsey & Company, 2007. Curbing Global Energy
Demand Growth: Te Energy Productivity Opportunity.
New York.
———, 2008. Te Case or Investing in Energy Productivity.
New York.
———, 2009. Unlocking Energy Eciency in the U.S. Econ-
omy. New York.
MEA (Millennium Ecosystem Assessment), 2005. Ecosys-
tems and Human Well-being: Synthesis. Washington,
DC: Island Press.Mills, E., and Roseneld, A., 1996. Consumer Non-Energy
Benets as a Motivation or Making Energy-Eciency
Improvements. Energy—he International Journal,
21(7–8), pp. 707–720.
Montalbano, P., 2011. rade Openness and Developing
Countries’ Vulnerability: Concepts, Misconceptions,
and Directions or Research. World Development ,
39(9), pp. 1489–1502.
Montalvo, C., 2008. General Wisdom Concerning the Fac-
tors Aecting the Adoption o Cleaner echnologies:
A Survey 1990–2007. Journal o Cleaner Production,
16(1), pp. S7–S13.
Morris, M., Barnes, J., and Morris, J ., 2011. Energy Ecient
Production in the Automotive and Clothing extiles

8/2/2019 Unido Full Report eBook
http://slidepdf.com/reader/full/unido-full-report-ebook 250/259
231
r e F e r e n C e s
Industries in South Aica . WP 04/2011. Vienna: United
Nations Industrial Development Organization.
Moskovitz, D., Lin, J., Weston, F., Zhou, F, Liu, S., Hu, Z.,
Bai, Jianhua., and Yu, C., 2007. Part A Final Report A
4706-PRC: Energy Conservation and Resource Manage-
ment Project . Manila: Asian Development Bank.
Mostert, W., Johnson, K., and MacLean, J., 2010. Publicly
Backed Guarantees as Policy Instruments to Promote
Clean Energy. New York: United Nations Environ-ment Programme, Strategic Environmental Framework
Alliance.
Motegi, N., and Watson, D., 2005. Enterprise Energy Man-
agement System Installation Case Study at Food Pro-
cess Plant . Berkeley, CA: Lawrence Berkeley National
Laboratory.
MOIVA (Energy Inormation Centre or Energy E-
ciency and Renewable Energy Sources, Finland), IFE
(Institute or Energy Eciency, Norway) and CRES
(Center or Renewable Energy Sources, Greece),2000. Te Guidebook or Energy Audits, Programme
Schemes and Administrative Procedures. Avail-
able at <www.motiva.i/en/areas_o_operation/
projects_and_campaigns/save_ii_-projects/audit_i>.
Murphy, L.M., and Edwards, P.L., 2003. Bridging the Val-
ley o Death: ransitioning om Public to Private Sector
Financing . Golden, CO: National Renewable Energy
Laboratory.
Myatt, D.P., 2006. Collective Action: Current Perspectives.
Prepared 18 December or the New Palgrave Dictionaryo Economics, eds J. Eatwell, M. Milgate, and P. New-
man. London: Palgrave Macmillan.
Nadal, S., 2002. Appliance and Equipment Eiciency
Standards. Annual Review o Energy & the Environ-
ment, 27(1), pp. 159–192.
Nakhooda, S., and Ballesteros, A., 2010. Investing in Sus-
tainable Energy Futures: Multilateral Development
Banks’ Investments in Energy Policy. WRI Report.
Washington, DC: World Resources Institute.
NECA (National Energy Conservation Awards) India,
2009. NECA Awards. Available at <www.emt-india.
net/eca2008/Award2008CD/list.htm>.
Nelson, K.E., 1989. Are Tere Any Energy Savings Le?
Chemical Processing, January.
Nelson, R.R., and Rosenberg, N., 1993. National Inno-
vation Systems: A Comparative Analysis. New York:
Oxord University Press.
Newell, P., 2010., Te Public, the Private and the Hybrid:
Mapping the Governance o Energy Finance. Te Gov-
ernance o Clean Development Working Paper 010.
Norwich, UK: University o East Angila.
New York imes, 2011. When Energy Eiciency Sul-
lies the Environment . Available at <www.nytimes.com/2011/03/08/science/08tier.html?_r=1>.
Newnan, D.G., 1969. Determining Rate o Return by
Means o Payback Period and Useul Lie in the Engi-
neering Economist. A Journal Devoted to the Problems
o Capital Investment, 15(1), pp. 29–39.
NSW (New South Wales) Government, 2010. Introduction
to the Energy Savings Scheme. Sydney, Australia. Avail-
able at <www.ess.nsw.gov.au/documents/syn6.asp>.
Nuijen, W., 1998. Long erm Agreements on Energy
Eciency in Industry. In Industrial Energy Eciency Policies: Understanding Success and Failure, eds. Mar-
tin, N., Worrell, E., and Sandoval, A. Proceedings o
a Workshop Organized by the International Network
or Energy Demand Analysis in the Industrial Sector,
11–12 June, Utrecht, the Netherlands.
Nyboer, J., and Jaccard, I., 2011. Case Studies and other
Inormation on echnology Eciency. Background paper
or the 2011 Industrial Development Report. Vienna:
United Nations Industrial Development Organization.
OECD (Organisation or Economic Co-operation andDevelopment), 2002. Sustainable Development: Indica-
tors to Measure Decoupling o Environmental Pressure
om Economic Growth. Paris.
———, 2007. Instrument Mixes or Environmental Policy.
Paris.
Ohshita, S. 2006. Cooperation Mechanisms: A Shit
oward Policy Development Cooperation. In Coop-
erative Climate: Energy Eciency Action in East Asia,
Central Research Institute o Electric Power Industry,
eds. Sugiyama, ., and Ohshita, S. San Francisco, CA:
University o San Francisco and International Institute
or Sustainable Development.
Ohshita, S., Wiel, S., and Heggelund, G., 2006. Coop-
eration Structure: Te Growing Role o Independent

8/2/2019 Unido Full Report eBook
http://slidepdf.com/reader/full/unido-full-report-ebook 251/259
232232
r e F e r e n C e s
Cooperation Networks. In Cooperative Climate:
Energy Eciency across East Asia, eds. Sugiyama, .,
and Ohshita, S. San Francisco, CA: University o San
Francisco and International Institute or Sustainable
Development.
Okaor, E.E., 2008. Development Crisis o Power Supply
and Implications or Industrial Sector in Nigeria. Jour-
nal o ribes and ribals, 6(2), pp. 83–92 .
Olivier, J.G.J., and Peters J.A.H.W., 2010. No Growth inotal Global CO 2 Emissions in 2009. Bilthoven, the
Netherlands: Netherlands Environmental Assessment
Agency.
Östblom, G., 1982. Energy Use and Structural Changes.
Factors behind the Fall in Sweden’s Energy Output
Ratio. Energy Economics, 4(1), pp. 21–28.
Ozturk, H.K., 2005. Energy Usage and Cost in extile
Industry: A Case Study or urkey. Energy Volume,
30(13), pp. 2424–2446.
Pacyna, J.M., and Pacyna E.G., 2001. An Assessment o Global and Regional Emissions o race Metals to the
Atmosphere rom Anthropogenic Sources Worldwide.
Environmental Reviews, 9(4), pp. 269–298.
Painuly, J.P., 2009. Financing Energy Eiciency: Les-
sons rom Experiences in India and China. Interna-
tional Journal o Energy Sector Management, 3(3), pp.
293–307.
Painuly, J.P., Lee, M., Park, H., and Noh, J., 2003. Promot-
ing Energy Eciency Financing and ESCOs in Devel-
oping Countries: Mechanisms and Barriers. Journal o Cleaner Production, 11(6), pp. 659–665.
Phylipsen, D., 2010. Energy Eciency Indicators: Best Prac-
tice and Potential Use in Developing Country Policy
Making Climate Change Consulting . Utrecht, the Neth-
erlands: Phylipsen Climate Change Consulting.
Phylipsen, D., Blok, K., Worrell, E., and de Beer, J., 2002.
Benchmarking the Energy Eciency o Dutch Indus-
try: An Assessment o the Expected Eect on Energy
Consumption and CO2 Emissions. Energy Policy, 30
(8), pp. 663–679.
Piattelli-Palmarini, M., 1994. Inevitable Illusions: How
Mistakes o Reason Rule Our Minds. New York: Wiley.
Popp D., Newell R., and Jae. A., 2009. Energy, the Envi-
ronment, and echnological Change. In Handbook o
Economics o Innovation, Vol 2, eds. Hall, B., and Rosen-
berg, N. Oxord, UK: Elsevier.
Price, L., 2005. Voluntary Agreements or Energy Eciency
or Greenhouse Gas Emissions Reduction in Industry: An
Assessment o Programs around the World . Proceedings
o the 2005 Summer Study on Energy Eciency in
Industry. Washington, DC: American Council or an
Energy-Ecient Economy.
Price, L., Galitsky, C., Sinton, J., Worrell, E., Graus, W.,2005. ax and Fiscal Policies or Promotion o Industrial
Energy Eciency: A Survey o International Experience.
Berkeley, CA: Lawrence Berkeley National Laboratory.
Price, L., Wang, X., and Yun, J., 2008. China’s op-1000
Energy-Consuming Enterprises Program: Reducing
Energy Consumption o the 1000 Largest Industrial
Enterprises in China. Berkeley, CA: Lawrence Berkeley
National Laboratory, Environmental Energy echnolo-
gies Division.
———, 2010. Te Challenge o Reducing Energy Con-sumption o the op-1000 Largest Industrial Enter-
prises in China. Energy Policy, 38(11), pp. 6485–6498.
Price, L., and Worrell, E., 2002. Overview o Voluntary
Agreements in the Industrial Sector . Berkeley, CA: Law-
rence Berkeley National Laboratory, Environmental
Energy echnologies Division. Available at <http://
eetd.lbl.gov/ea/IES/iespubs/vaoverview.pd>.
Price, L., Worrell, E., and Sinton, J., 2003. Agreements in
the Industrial Sector in China. Proceedings o the Earth
echnologies Forum and Exhibition, 22–24 April, Washington, DC.
Punte, S., Repinski, P. and Gabrielsson, S, 2007. Improving
Energy Eciency in Asia’s Industry. Greener Manage-
ment International, 50, pp. 41–51.
Rath, A., 2011. Industrial Energy Eciency, Economic
Development and Poverty Reduction. WP 07/2011.
Vienna: United Nations Industrial Development
Organization.
Reddy, A.K.N., 1991. Barriers to Improvements in Energy
Eciency. Bengaluru, India: Indian Institute o Sci-
ence, Department o Management Studies.
Remer, D.S., and Nieto, A.P., 1995. A Compendium and
Comparison o 25 Project Evaluation echniques.
Part 2: Ratio, Payback, and Accounting Methods.

8/2/2019 Unido Full Report eBook
http://slidepdf.com/reader/full/unido-full-report-ebook 252/259
233
r e F e r e n C e s
International Journal o Production Economics, 42(2),
pp. 101–129.
Remer, D.S., Stokdyk, S.B., and Van Driel, M., 1993. Sur-
vey o Project Evaluation echniques Currently Used in
Industry. International Journal o Production Econom-
ics, 32(1), pp. 103–115.
Ribeiro, S.K., Kobayashi, S., Beuthe, M., Gasca, J., Greene,
D., Lee, D.S., Muromachi, Y., Newton, P.J., Plotkin,
S., Sperling, D., and Wit, R., 2007. ransport and itsInrastructure. In Climate Change 2007: Mitigation
o Climate Change. Contribution o Working Group III
to the Fourth Assessment Report o the Intergovernmen-
tal Panel on Climate Change, eds. Metz, B., Davidson,
O.R., Bosch, P.R., Dave, R., and Meyer, L.A. Cam-
bridge, UK: Cambridge University Press.
Rietbergen, M., Farla, J., and Blok, K., 1998. Quantitative
Evaluation o Voluntary Agreements on Energy E-
ciency. In Industrial Energy Eciency Policies: Under-
standing Success and Failure, eds. Martin, N., Wor-rell, E., and Sandoval, A. Proceedings o a Workshop
Organized by the International Network or Energy
Demand Analysis in the Industrial Sector, 11–12 June,
Utrecht, the Netherlands.
Rittho, M., Rohn, H., and Liedtke, C., 2002. Calculating
MIPS: Resource Productivity o Products and Services.
Wuppertal, Germany: Wuppertal Institute or Cli-
mate, Environment and Energy.
Rohdin, P., Tollander, P., and Solding, P., 2007. Barriers
to and Drivers or Energy Eciency in the SwedishFoundry Industry. Energy Policy, 35(1), pp. 672– 677.
Roy, J., 2010. How to Make Energy Eciency in Industry a
Protable Proposition: the Case o India in extile and
Apparel, Food and Beverages and Steel Sector . Back-
ground paper prepared or the 2011 Industrial Develop-
ment Report. Vienna: United Nations Industrial Devel-
opment Organization.
SADC (Southern Arican Development Community),
2008. Protocol on Energy. Available at <www.sadc.int/
index/browse/page/147>.
Saidur, R., 2010. Energy, Economic and Environmental
Benets o Using High-Eciency Motors to Replace
Standard Motors or the Malaysian Industries. Energy
Policy, 38(8), pp. 4617–4625.
Samuelson, W., and Zeckhauser, R., 1988. Status Quo Bias
in Decision Making. Journal o Risk and Uncertainty,
1(1), pp. 7–59.
Sandler, ., 2004. Global Collective Action. Cambridge,
UK: Cambridge University Press.
Sandstad, A.H., and Howarth, R.B., 1994. Consumer
Rationality and Energy Eciency. Proceedings o the
1994 Summer Study on Energy Eciency in Buildings.
Washington, DC: American Council or an Energy-Ecient Economy.
Sarkar, A., and Singh, J., 2010. Financing Energy Eciency
in Developing Countries: Lessons Learned and Remain-
ing Challenges. Washington, DC: World Bank.
Sarnat, M., and Levy, H. 1969. Te Relationship o Rules
o Tumb to the Internal Rate o Return: A Restate-
ment and Generalization. Te Journal o Finance, 24(3),
pp. 479–490.
Satchwell, A., Goldman, C., Larsen, P., Gilligan, D., and
Singer, ., 2010. A Survey o the U.S. ESCO Indus-try: Market Growth and Development om 2008 to
2011. Berkeley, CA: Lawrence Berkeley National
Laboratory.
Saygin, D., and Patel, M.K., 2010. Global Benchmarking
or the Industrial Sector: First Steps in Application and
Analysis o Competitiveness. Background paper prepared
or the 2011 Industrial Development Report . Vienna:
United Nations Industrial Development Organization.
Saygın, D., Patel, M.K., am, C., and Gielen, D.J., 2009.
Chemical and Petrochemical Sector Potential o Best Practice echnology and Other Measures or Improving
Energy Eciency . Paris: International Energy Agency.
Saygin, D., Patel, M.K., Worrell, E., and Gielen, D., 2010.
Global Benchmarking or the Industrial Sector: Applica-
tion and Analysis o Competitiveness. Background paper
prepared or the 2011 Industrial Development Report .
Vienna: United Nations Industrial Development
Organization.
Schäer, A., 2005. Structural Change in Energy Use. Energy
Policy, 33(4), pp. 429–437.
Schiller, S., 2007. Model Energy-Eciency Program Impact
Evaluation Guide. National Action Plan or Energy
Eciency. Available at <www.epa.gov/cleanenergy/
documents/suca/evaluation_guide.pd>.

8/2/2019 Unido Full Report eBook
http://slidepdf.com/reader/full/unido-full-report-ebook 253/259
234234
r e F e r e n C e s
Schipper, L., Howarth, R., and Carlassare, E., 1992. Energy
Intensity, Sectoral Activity, and Structural Change in
the Norwegian Economy? Energy, 1(3), pp. 215–233.
Schleich, J., 2009. Barriers to Energy Eciency: A Com-
parison across the German Commercial and Services
Sector. Ecological Economics, 68(7), pp. 2150–2159.
———, 2011. Barriers Busting in Energy Eciency in Indus-
try. WP 09/2011. Vienna: United Nations Industrial
Development Organization.Schleich, J., and Gruber, E., 2008. Beyond Case Studies:
Barriers to Energy Eciency in Commerce and the Ser-
vices Sector. Energy Economics, 30(2), pp. 449–464.
Schmidheiny, S., 1992. Changing Course: A Global Business
Perspective on Development and Environment . Cam-
bridge, MA: MI Press.
SEAI (Sustainable Energy Authority o Ireland), 2010.
Accelerated Capital Allowance. Available at <www.seai.
ie/Your_Business/Accelerated_Capital_Allowance/>.
SenterNovem, 2008. Long erm Agreements on Energy E-ciency in the Netherlands. Results o 2007 . Te Hague,
the Netherlands: Ministry o Economic Aairs, Agri-
culture and Innovation. Available at <www.sentern-
ovem.nl/mmles/2MJAF0809_LA_results_2007_
tcm24-284428.pd>.
Sethi, G., and Ghosh, A.M., 2008. owards Cleaner ech-
nologies: A Process Story in the Firozabad Glass Industry
Cluster . New Delhi: Te Energy and Resources Institute.
Simon, H., 1959. Teories o Decision Making in Econom-
ics and Behavioral Science. American Economic Review, 49(3), pp. 253–283.
Sinsukprasert, P., 2009. Tailand Clean Energy Policy and
Programs. Asian Development Bank Workshop on Cli-
mate Change and Energy, 27 March, Bangkok.
Sinton, J.E. and Levine, M.D., 1994. Changing Energy
Intensity in Chinese industry: Te Relative Importance
o Structural Shi and Intensity Change. Energy Policy,
22(3), pp. 239–255.
Smith, J.B., Schneider, S.H., Oppenheimer, M., Yohe, G.W.,
Hare, W., Mastrandea, M.D., Patwardhan, A., Burton,
I., Coree-Morlot, J., Magadza, C.H.D., Füssel, H.-M.,
Pittock, A.B., Rahman, A., Suarez, A., and van Yper-
sele, J.-P., 2009. Assessing Dangerous Climate Change
through an Update o the Intergovernmental Panel on
Climate Change Reasons or Concern. Proceedings o
the National Academy o Sciences o the United States o
America, 106(11), pp. 4133–4137.
Soloviev, M.M., 2009. Enhancing Energy Eiciency o
National Economy Is among op Priorities o Rus-
sian Government’s Energy Policy. Moscow: Russian
Federation Ministry o Energy. Available at <www.
docstoc.com/docs/40330159/Enhancing-Energy
-Eciency-o-National-Economy-Is-Among-op>.Sorrell, S., 2002. Te Meaning o BANEEC: Interpret-
ing Excessive Costs in UK Industrial Pollution Regula-
tion. Journal o Environmental Policy & Planning, 4(1),
pp. 23–40.
———, 2007. Te Rebound Eect: An Assessment o the Evi-
dence or Economy-Wide Energy Savings om Improved
Energy Eciency. London: UK Energy Research Cen-
tre. Available at <www.ukerc.ac.uk/Downloads/
PDF/07/0710ReboundEect>.
———, 2009. Improving Energy Eciency: Hidden Costsand Unintended Consequences. In Te Economics and
Politics o Climate Change, eds. Helm, D., and Hep-
burn, C. Oxord, UK: Oxord University Press.
Sorrell, S., and Dimitropoulos, J., 2007. UKERC Review o Evi-
dence or the Rebound Eect: echnical Report 3: Econo-
metric Studies. London: UK Energy Research Centre.
Sorrell, S., Mallet, A., and Nye, S., 2011. Barriers to Indus-
trial Energy Eiciency: A Literature Review. WP
11/2011. Vienna: United Nations Industrial Develop-
ment Organization.Sorrell, S., O’Malley, E., Schleich, J., and Scott, S., 2004.
Te Economics o Energy Eciency: Barriers to Cost-
Eective Investment . Cheltenham, UK: Edward Elgar
Publishing.
Sorrell, S., Schleich, J., Scott, S., O’Malley, E., race, F.,
Boede, E., Ostertag, K., and Radgen, P., 2000. Reduc-
ing Barriers to Energy Eciency in Public and Private
Organizations. Brighton, UK: Science and echnology
Policy Research.
Spalding-Fecher, R., 2003. Indicators o Sustainability or
the Energy Sector: A South Arican Case Study. Energy
or Sustainable Development, 7(1), pp. 35–49.
Spangenberg, J., 2001. Sustainable Development: From
Catchwords to Benchmarks. In Sustainable Solutions:

8/2/2019 Unido Full Report eBook
http://slidepdf.com/reader/full/unido-full-report-ebook 254/259
235
r e F e r e n C e s
Developing Products and Services or the Future, eds.
Charter, M., and ischner, U. Sheeld, UK: Greenlea
Publishing.
Spangenberg, J., Omann, I., and Hinterberger, F., 2002.
Sustainable Growth Criteria: Minimum Benchmarks
and Scenarios or Employment and the Environment.
Ecological Economics, 42(3), pp. 429–443.
Sri Lanka SEA (Sustainable Energy Authority), 2011.
Renewaable Energy Guideline. Available at www.energy.gov.lk/sub_pgs/events_past.html.
Steinbuks, J., and Foster, V., 2010. When Do Firms Gener-
ate? Evidence on In-House Electricity Supply in Arica.
Energy Economics, 32(3), pp. 505–514.
Stern, N., 2006. Stern Review on the Economics o Climate
Change. London: HM reasury.
Stern, P.C., 1986. Blind Spots in Policy Analysis: What
Economics Doesn’t Say about Energy Use. Journal o
Policy Analysis and Management, 5(2), pp. 200–227.
Sugiyama, ., and Ohshita, S., eds., 2006. Cooperative Cli-mate: Energy Eciency Action in East Asia. San Fran-
cisco, CA: University o San Francisco and Interna-
tional Institute or Sustainable Development.
Sunstein, C.R., 2007. O Montreal and Kyoto: A ale o
wo Protocols. Harvard Environmental Law Review,
31, pp. 1–65.
Sustainable Energy Authority o Ireland, n.d. Welcome to
the Accelerated Capital Allowance (ACA). Available at
<www.seai.ie/Your_Business/Accelerated_Capital_
Allowance/>.Swalm, R.O., 1966. Utility Teory: Insights into Risks ak-
ing. Harvard Business Review, 44, pp. 123–136.
Syrquin, M., 2007. Kuznets and Pasinetti on the Study o
Structural ransormation: Never the wain Shall
Meet? Structural Change and Economic Dynamics,
21(4), pp. 248–257.
aylor, R.P., Govindarajalu, C., Levin, J., Meyer, A.S., and
Ward, W.A., 2008. Financing Energy Eciency: Lessons
om Brazil, China, India, and Beyond. Washington,
DC: World Bank.
te Velde, D.W., 2010. Barriers to Investments in Industrial
Energy Eciency. Background paper prepared or the
2011 Industrial Development Report . Vienna: United
Nations Industrial Development Organization.
Taler, R., 1991. Quasi Rational Economics. New York: Te
Russell Sage Foundation.
Tiruchelvam, M., Kumar, S., and Visvanathan, C., 2003.
Policy Options to Promote Energy Eicient and
Environmentally Sound echnologies in Small- and
Medium-Scale Industries. Energy Policy, 31(10), pp.
977–987.
Tollander, P., and Ottosson, M., 2008. An Energy-E-
cient Swedish Pulp and Paper Industry: Exploring Bar-riers to and Driving Forces or Cost-Eective Energy
Eiciency Investments. Energy Eiciency, 1(1), pp.
21–34.
———, 2010. Energy Management Practices in Swedish
Energy-Intensive Industries. Journal o Cleaner Produc-
tion, 18(12), pp. 1125–1133.
onn, B., and Peretz, J.H., 2007. State-Level Benets o
Energy Eciency. Energy Policy, 35(7): pp. 3665–3674.
UN (United Nations), 2011. UN Commodity rade Sta-
tistics (Comtrade) database. Available at <http://comtrade.un.org>.
UNCED (United Nations Conerence on Environment
and Development), 1987. Our Common Future. Oxord,
UK: Oxord University Press.
UNCAD (United Nations Conerence on rade and
Development), 2008. World rade Report: rade in a
Globalizing World. Geneva.
UNDP (United Nations Development Programme), 2000.
UNDP World Energy Assessment Report 2000 . New
York. Available at <www.undp.org/energy/activities/ wea/dras-rame.html>.
———, 2008. UNDP Climate Change Country Proles.
Available at <http://country-proles.geog.ox.ac.uk/>.
———, 2009. Capacity Development: A UNDP Prime. New
York.
UNDESA (United Nations Department o Economic and
Social Aairs), 2004. Central America: New Develop-
ment Credit Guarantee to Fund Clean Energy Invest-
ment. Division or Sustainable Development. New
York. Available at <www.un.org/esa/sustdev/csd/cases-
tudies/CAREC.pd>.
UNECE (United Nations Economic Commission or
Europe), 2010. Financing Global Climate Change Miti-
gation. Geneva.

8/2/2019 Unido Full Report eBook
http://slidepdf.com/reader/full/unido-full-report-ebook 255/259
8/2/2019 Unido Full Report eBook
http://slidepdf.com/reader/full/unido-full-report-ebook 256/259
237
r e F e r e n C e s
———, 2010g. MVA database 2010, Vienna.
———, 2010h. Compendium o Case Studies: Industrial
Energy Eciency in Columbian, Chinese, Nigerian,
Peruvian, unisian and Vietnamese Companies. Back-
ground paper prepared or the 2011 Industrial Develop-
ment Report . Vienna.
———, 2011. Industrial Energy Eciency Policies 2011
Database, Vienna.
UNIDO (United Nations Industrial Development Organ-ization) and UNEP (United Nations Environment
Programme), 2010. aking Stock and Moving Forward:
Te UNIDO-UNEP National Cleaner Production Cen-
tres. Vienna. Available at <www.unido.org/leadmin/
user_media/Services/Environmental_Management/
Contacts/Contacts/aking%20stock%20and%20
moving%20orward-November2010.pd>.
Upadhyaya, S., 2010. Compilation o Energy Statistics or
Economic Analysis. Vienna: United Nations Industrial
Development Organization.Urban, F., Benders, R.M.J., and H.C. Moll., 2007. Mod-
eling Energy Systems or Developing Countries. Energy
Policy, 35 (6), pp. 3473–3482.
USAID (United States Agency or International Develop-
ment), 2008. Indonesia Energy Assessment . Washing-
ton, DC.
USDOE (United States Department o Energy), 2010.
Industrial echnologies Program. Washington, DC.
Available at <www1.eere.energy.gov/industry>.
van Berkel, R., 2007a. Cleaner Production and Eco-E-ciency. In Te International Handbook o Environ-
mental echnology Management, eds. Marinova, D.,
Annandale, D., and Phillimore, J. Cheltenham, UK:
Edward Elgar Publishing.
———, 2007b. Eco-Eciency in Primary Metals Produc-
tion: Context, Perspectives and Methods. Resources
Conservation and Recycling, 51(3), pp. 511–540.
van den Akker, 2008. Malaysian Industrial Energy E-
ciency Improvement Project (MIEEIP): Final Evalua-
tion. Kuala Lumpur: Government o Malaysia; New
York: United Nations Development Programme;
Washington, DC: Global Environment Facility.
van den Bergh, J.C.J.M., 2010. Energy Conservation
More Eective with Rebound Policy. Barcelona, Spain:
Autonomous University o Barcelona, Institute o Envi-
ronmental Science and echnology.
———, 2011. Industrial Energy Conservation, Rebound
Eects and Public Policy. WP 12/2011. Vienna: United
Nations Industrial Development Organization.
Verbeken, A., 20 09. Low Carbon Energ y echnology rans-
er: A Review o GEF Experience. Dissertation. Sussex,
UK: University o Sussex, SPRU – Science and ech-
nology Policy Research. Vince, F., Aoustin, E., Bréant, P., and Marechal, F., 2008.
LCA tool or the Environmental Evaluation o Potable
Water Production. Desalination, 222(1–3), pp. 37–56.
Vine, E., 2003. An International Survey o the Energy Ser-
vice Company (ESCO) Industry. Berkeley, CA: Law-
rence Berkeley National Laboratory.
———, 2005. An International Survey o the Energy Service
Company Industry. Energy Policy, 33(5), pp. 691–704.
Vine, E., and Sathaye, J., 1997. Te Monitoring, Evaluation,
Reporting, and Verication o Climate Change Mitiga-tion Projects: Discussion o Issues and Methodologies and
Review o Existing Protocols and Guidelines. LBNL-
40316. Berkeley, CA: Lawrence Berkeley National
Laboratory. Available at <http://eetd.lbl.gov/EA/ccm/
MonitoringMitigation.pd>.
Violette, D., 2006. Demand-Side Management: Future Role
in Energy Markets. Presented at the 2007 Energy Futures
Speaker Series: Panel Discussion on Consumer Response
to High Energy Prices, Meetings o the National Energy
Board, 21 April, Calgary, Canada. Available at <www.neb-one.gc.ca/cl-nsi/rnrgynmtn/nrgyrprt/nrgytr/
cnslttnrnd1/pnldscssn-eng.html#s3_5>.
von Weizsäcker, E.U., 1989. Erdpolitik: Ökologische Realpoli-
tik an der Schwelle zum Jahrhundert der Umwelt . Darm-
stadt, Germany: Wissenschaliche Buchgesellscha.
Wachsmann, U., Wood, R., Lenzen, M., and Schaeer, R.,
2009. Structural Decomposition o Energy Use in Brazil
rom 1970 to 1996. Applied Energy, 86(4), pp. 578–587.
Wal-Mart, 2008. Wal-Mart Annual Report 2008. Ben-
tonville, AR. Available at <http://walmartstores.com/
sites/AnnualReport/2008/>.
———, 2010. Wal-Mart Annual Report 2010. Bentonville,
AR. Available at <http://walmartstores.com/sites/
AnnualReport/2010/>.

8/2/2019 Unido Full Report eBook
http://slidepdf.com/reader/full/unido-full-report-ebook 257/259
238238
r e F e r e n C e s
Wang, Q., 2008. Basis and Challenges o the Industrial
ransormation o China. Strategic Research on Low-
Carbon Industrialization. Beijing: China Council or
International Co-operation on Economic Develop-
ment and Environment.
Wang, Q., and von unzelmann, N., 2000. Complexity
and the Functions o the Firm: Breadth and Depth.
Research Policy, 29(7–8), pp. 805–818.
Wang, Q. Qiu, H. and Kuang, Y., 2009. Market-DrivenEnergy Pricing Necessary to Ensure China’s Power Sup-
ply. Energy Policy, 37(7), pp. 2498–2504.
Wara, M.W., and Victor, D.G., 2008. A Realistic Policy on
International Carbon Osets. Working Paper 74. Pro-
gram on Energy and Sustainable Development, Stan-
ord University, Palo Alto, CA.
WBCSD (World Business Council or Sustainable Devel-
opment), 2000. Eco-Eciency: Creating More Value
with Less Impact . Geneva.
———, 2001. Mobility 2001: World Mobility at the End o the wentieth Century and its Sustainability. Geneva.
———, 2009. Cement Industry Energy and CO 2 Peror-
mance: “Getting the Numbers Right” . Cement Sustain-
ability Initiative. Geneva.
Weber, C.L., 2009. Measuring Structural Change and
Energy Use: Decomposition o the US Economy rom
1997 to 2002. Energy Policy, 37(4), pp. 1561–1570.
WEC (World Energy Council), 2004. Comparison o
Energy Systems Using Lie Cycle Assessment: A Special
Report o the World Energy Council. London.———, 2008. Energy Eciency Policies around the World:
Review and Evaluation. London.
———, 2010. Energy Eciency: A Recipe or Success . London.
Weyant J.P., de la Chesnaye F.C., and Blanord G.J., 2006.
Overview o EMF-21: Multigas Mitigation and Climate
Policy. Te Energy Journal , Special Issue on Multi-Green-
house Gas Mitigation and Climate Policy, 3, pp. 1–32.
WGA (Western Governors’ Association). 2006. Clean
and Diversiied Energy: Energy Eiciency ask
Force Report. Denver, CO. Available at <www.
westgov.org/component/joomdoc/doc_details/
94-energy-eciency>.
Wiel, S., and McMahon, J.E., 2005. Energy-Eciency Labels
and Standards: A Guidebook or Appliances, Equipment,
and Lighting . Available at <www.clasponline.org/les/
Guidebook_2ndEdition.pd>.
Williams, R., 2008. Leadership and Management Prac-
tices in Industrial Energy Eciency. Vienna: United
Nations Industrial Development Organization, Energy
Eciency Unit. Available at www.e2singapore.gov.sg/
docs/Leadership_and_Management_Practices_in_
Industrial_Energy_Eciency.pd.
Williamson, O.E., 1985. Te Economic Institutions o Capi-talism. New York: Te Free Press.
World Bank, 2000. Energy and Development Report 2000:
Energy Services or the World’s Poor . Washington, DC.
———, 2002. Project Appraisal on a Proposed Credit in the
Amount o SDR 177.90 Million (US$225 Million) to
the Socialist Republic o Vietnam or a System Eciency
Improvement, Equitization and Renewables Project .
East Asia and Pacic Region, Energy Sector Develop-
ment Unit. Washington, DC.
———, 2004. World Bank GEF Energy Eciency Portolio Review and Practitioners’ Handbook. Tematic Discus-
sion Paper. Environment Department Climate Change
eam. Washington, DC.
———, 2005. World Bank/GEF Energy Eciency Porto-
lio Review and Practitioners’ Handbook. Environment
Department. Washington, DC.
———, 2007. Te Economic Impact o Climate Change on
Agriculture in Cameroon. Policy Research Working
Paper 4364. Washington, DC.
———, 2008. Financing Energy Eciency, Lessons om Brazil, China, India and Beyond . Washington, DC.
———, 2010a. Enterprise Surveys. Available at <www.
enterprisesurveys.org>.
———, 2010b. Open Data. Available at <www.worldbank.
org/data>.
———, 2010c. World Development Report 2010: Climate
Change and Development . Washington, DC.
———, n.d. How We Classiy Countries: Country
and Lending Groups. Available at <http://data.
worldbank.org/about/country-classiications/
country-and-lending-groups>.
Worrell, E., 1995. Energy Ecient echnologies in the Iron
and Steel Industry. In Energy Eciency Improvement
Utilising High echnology: An Assessment o Energy

8/2/2019 Unido Full Report eBook
http://slidepdf.com/reader/full/unido-full-report-ebook 258/259
239
r e F e r e n C e s
Use in Industry and Buildings, eds. Levine, M.D.,
Worrell, E., Martin, N., and Price, L. London: World
Energy Council.
———, 2011. Barriers to Energy Eciency: International
Case Studies on Successul Barrier Removal . WP
15/2011. Vienna: United Nations Industrial Develop-
ment Organization.
Worrell, E., Bernstein, L., Roy, J., Price, L., and Harnisch, J.,
2009. Industrial Energy Eciency and Climate ChangeMitigation. Energy Eciency, 2(2), pp. 109–123.
Worrell, E., and Biermans, G., 2005. Move Over! Stock
urnover, Retrot and Industrial Energy Eciency.
Energy Policy, 33(7), pp. 949–962.
Worrell, E., Galitsky, C., Masanet, E., and Graus, W., 2008.
Energy Eciency Improvement and Cost Saving Oppor-
tunities or the Glass Industry: An ENERGY SAR
Guide or Energy and Plant Managers. Berkeley, CA:
Lawrence Berkeley National Laboratory, Environmen-
tal Energy echnologies Division. Worrell, E., Laitner, J.A., Ruth, M., and Finman, H., 2003.
Productivity Benets o Industrial Energy Eciency
Measures. Energy, 28(11), pp. 1081–1098.
Worrell, E., and Price, L., 2000. Barriers and Opportuni-
ties: A Review o Selected Successul Energy-Eciency
Programs. Berkeley, CA: Lawrence Berkeley National
Laboratory.
———, 2001. Productivity Benets o Industrial Energy E-
ciency Measures. LBNL-52727. Berkeley, CA: Lawrence
Berkeley National Laboratory.
Worrell, E., van Berkel, R., Fengqi, Z., Menke, C., Schae-
er, R., and Williams, R .O., 2001. echnology ranser
o Energy Ecient echnologies in Industry: A Review
o rends and Policy Issues. Energy Policy, 29(1), pp.
29–43.
Xinhua News Agency, 2010. IBSA Countries Sign Agree-ments on Scientic Areas. 16 April. Available at <www.
bilaterals.org/spip.php?article17153>.
Yang, M., 2007. Raising China’s Electric Motor Eciency.
Summer Study 2009. Stockholm: European Council
or an Energy Ecient Economy.
Yanjiaa, W., and Chandler, W., 2009. Te Chinese Noner-
rous Metals Industry: Energy Use and CO2 emissions.
Energy Policy, 38(11), pp. 6 475–6484.
Zeng, S. , and Rong, F., 2010. Industrial Energy Eciency in
Chinese Companies. Background paper prepared or the2011 Industrial Development Report . Vienna: United
Nations Industrial Development Organization.
Zhang, J., Baden-Fuller, C., and Mangematin, V., 2007.
echnological Knowledge Base, R&D Organization
Structure and Alliance Formation: Evidence rom the
Biopharmaceutical Industry. Research Policy, 36(4),
pp. 515–528.

8/2/2019 Unido Full Report eBook
http://slidepdf.com/reader/full/unido-full-report-ebook 259/259
Printed in AustriaV.11-86188—October 2011—3,000


![Your Erroneous Zones - Wayne Dyer [Full eBook]](https://static.documents.pub/doc/80x56/55cf9680550346d0338be2ed/your-erroneous-zones-wayne-dyer-full-ebook.jpg)


