+ All Categories
Home > Documents > Unified Kernel/User-space Efficient Linux Tracing Architecture · universite de montr eal unified...

Unified Kernel/User-space Efficient Linux Tracing Architecture · universite de montr eal unified...

Date post: 11-Apr-2018
Category:
Upload: phungdang
View: 235 times
Download: 6 times
Share this document with a friend
74
UNIVERSIT ´ E DE MONTR ´ EAL UNIFIED KERNEL/USER-SPACE EFFICIENT LINUX TRACING ARCHITECTURE DAVID GOULET D ´ EPARTEMENT DE G ´ ENIE INFORMATIQUE ET G ´ ENIE LOGICIEL ´ ECOLE POLYTECHNIQUE DE MONTR ´ EAL M ´ EMOIRE PR ´ ESENT ´ E EN VUE DE L’OBTENTION DU DIPL ˆ OME DE MA ˆ ITRISE ` ES SCIENCES APPLIQU ´ EES (G ´ ENIE INFORMATIQUE) AVRIL 2012 David Goulet, 2012.
Transcript

UNIVERSITE DE MONTREAL

UNIFIED KERNEL/USER-SPACE EFFICIENT LINUX TRACING ARCHITECTURE

DAVID GOULET

DEPARTEMENT DE GENIE INFORMATIQUE ET GENIE LOGICIEL

ECOLE POLYTECHNIQUE DE MONTREAL

MEMOIRE PRESENTE EN VUE DE L’OBTENTION

DU DIPLOME DE MAITRISE ES SCIENCES APPLIQUEES

(GENIE INFORMATIQUE)

AVRIL 2012

© David Goulet, 2012.

UNIVERSITE DE MONTREAL

ECOLE POLYTECHNIQUE DE MONTREAL

Ce memoire intitule :

UNIFIED KERNEL/USER-SPACE EFFICIENT LINUX TRACING ARCHITECTURE

presente par : GOULET David

en vue de l’obtention du diplome de : Maıtrise es Sciences Appliquees

a ete dument accepte par le jury constitue de :

M. ANTONIOL Giuliano, Ph.D., president

M. DAGENAIS Michel, Ph.D., membre et directeur de recherche

M. BOIS Guy, Ph.D., membre

iii

For a free and common knowledge

for everyone on earth regardless

of gender, race or color . . .

Pour un savoir libre et commun

pour tous sans distinction

de genre, race ou couleur . . .

iv

LICENSE

Unified Kernel/User-space Efficient Linux Tracing Architecture

by David Goulet is licensed under a

Creative Commons Attribution-ShareAlike 3.0 Unported License

Based on the work at lttng.org

Copyleft

This is a contribution to the global intellectual commons which provides the greatest benefit

to all people and help realizing universal and free access to culture, education and research.

v

ACKNOWLEDGEMENTS

First of all, I would like to thanks my director Michel Dagenais for giving me the oppor-

tunity to work with him and learn from his immense legacy in the tracing world which is

still growing today. I will not thank him however for the pain endure during the Lafayette

mountain hiking which greatly diminish my ability to walk the next morning. I have learn

my lesson not to follow him anymore.

I would also like to thanks Yannick Brosseau and Matthew Khouzam who motivated me

and followed my work greatly through out my master. Without them, LTTng would not be

what it is today and would be seperated from Java.

Very special thanks to the great Dr. Tracing, Mathieu Desnoyers. His appetite for tracing

and computer science is insatiable as well as his knowledge. Thanks to him for mentoring

me through out this journey and making a leap of faith in my ability to improve the tracing

world.

Thanks to mister Alexandre ”My-Pleasure” and Julien Desfossez for tolerating me in the

DORSAL lab and making a difference in every decision of the LTTng project.

Thanks to Revolution Linux for their financial and technical support. Thanks to the

Ericsson team in Montreal as well for helping us improve our work and giving us importan

use cases. Thanks to the Research Council of Canada for the research funding.

I would like also to thanks the Dieu Du Ciel microbrewery who hosted most of our

meetings and is basically a landmark in the LTTng community.

Finally, I would like to thank my love, Helene, for supporting me all the way through by

believing in me and keeping my moral high and happy.

vi

RESUME

De nos jours, il n’est pas inhabituel de voir de grands centres de donnees regroupant

des centaines de serveurs deployant de grosses applications, des systemes d’exploitation

heterogenes et differentes technologie de virtualisation. Implanter du tracage dans ce genre

d’environnement peut s’averer utile pour la surveillance et le debogage de problemes de pro-

duction. Avec les derniere architecture de tracage developpe, il peut etre difficile d’atteindre

un tel objectif dans un environnement multi-utilisateur et egalement traiter les questions de

securite.

Dans cette recherche, nous proposons une nouvelle architecture de tracage unifiee combi-

nant l’espace noyau et utilisateur visant a repondre aux contraintes de production en termes

de securite et de performance. Avec le traceur en espace utilisateur, le nombre de sources de

donnees augmentent, ou non seulement le noyau peut etre tracee mais plusieurs applications

en meme temps.

Cette nouvelle architecture presente un demon de session qui devient une nouvelle com-

posante de tracage agissant comme un point de rendez-vous pour toutes les interactions

avec les traceurs. Ce demon agit comme un registre de sessions de tracage pour les utilisa-

teurs abstrayant les traceurs a des domaines. Nous proposer un ensemble de structure de

donnees sans verrou et des algorithmes utilises pour construire la base de registre rendant

cette composante tres performante.

Cela a permis la creation du projet lttng-tools, basee sur les traceurs de LTTng 2.0,

qui met en oeuvre l’architecture proposee. Nous avons developpe plusieurs algorithmes pour

gerer et fournir un systeme multi-session et multi-utilisateur tout en gardan une empreinte

memoire et CPU basse sur la machine cible. Avec l’abilite du traceur de l’espace utilisateur de

s’enregistrer au demarrage au demon de session, de nouvelles fonctionnalites sont disponibles

comme lister des applications tracable et de permettre de tracer des evenements disponibles

seulement au demarrage de l’application.

Nous avons demontrer l’exactitude de notre modele en utilisant le tracage noyau par ce

nouveau composant pour analyser la performance de grosses applications de qui a ete inspire

la conception des mecanismes internes de parallelisme.

Enfin, cette etude presente les travaux futurs et les ameliorations possibles du modele

propose et examine les defis a venir.

vii

ABSTRACT

Nowadays, it is not unusual to see large data centers regrouping hundreds of servers

mixing large applications, heterogeneous kernels and different virtualization technology. De-

ploying tracing in these kinds of environments can prove to be useful for monitoring and

debugging production problems. With today’s tracing architecture, it can be difficult to

achieve such goal in a multi-user environment while also dealing with security issues.

In this research, we propose a new unified tracing architecture combining kernel and user

space aimed at addressing production constraints in terms of security and low-instrusiveness

for large scale deployment. With user space tracers, data sources increase where not only

the kernel can be traced but multiple applications at the same time.

This new architecture introduces a session daemon which becomes a new tracing com-

ponent acting as a rendez-vous point for all interactions with the tracers. This daemon

acts as a tracing registry providing tracing sessions to users, abstracting tracers to domains.

We propose a set of lockless data structures and algorithms used to build the registry and

making this component very efficient.

This brought to life the lttng-tools project, based on the LTTng 2.0 tracers, which

implements the proposed architecture. We have developed several algorithms to handle and

provide a multi-session and multi-user tracing environment with a low memory and CPU

footprint on the target machine. With the user space tracer ability to register at startup to

the session daemon, a new set of features are available, from listing traceable applications

to enabling events before registration, allowing recording of very early events during the

boostrap process of the program.

We have demonstrated the usability of our model by using kernel tracing through this

new component to analyze the performance of large applications, which inspired us to design

internal multithreaded mechanisms.

Finally, this study presents future work and possible improvements to the proposed model

and discusses the next challenges.

viii

CONTENTS

DEDICATION . . . . . . . . . . . . . . . . . . . . . . . . . . . . . . . . . . . . . . . iii

ACKNOWLEDGEMENTS . . . . . . . . . . . . . . . . . . . . . . . . . . . . . . . . v

RESUME . . . . . . . . . . . . . . . . . . . . . . . . . . . . . . . . . . . . . . . . . . vi

ABSTRACT . . . . . . . . . . . . . . . . . . . . . . . . . . . . . . . . . . . . . . . . vii

CONTENTS . . . . . . . . . . . . . . . . . . . . . . . . . . . . . . . . . . . . . . . . viii

LIST OF TABLES . . . . . . . . . . . . . . . . . . . . . . . . . . . . . . . . . . . . . x

LIST OF FIGURES . . . . . . . . . . . . . . . . . . . . . . . . . . . . . . . . . . . . xi

LIST OF APPENDICES . . . . . . . . . . . . . . . . . . . . . . . . . . . . . . . . . . xii

LIST OF SIGNS AND ABBREVIATIONS . . . . . . . . . . . . . . . . . . . . . . . . xiii

CHAPTER 1 INTRODUCTION . . . . . . . . . . . . . . . . . . . . . . . . . . . . 1

1.1 Tracing overview . . . . . . . . . . . . . . . . . . . . . . . . . . . . . . . . . 1

1.2 Problem . . . . . . . . . . . . . . . . . . . . . . . . . . . . . . . . . . . . . . 2

1.3 Objectives . . . . . . . . . . . . . . . . . . . . . . . . . . . . . . . . . . . . . 2

1.4 Contribution . . . . . . . . . . . . . . . . . . . . . . . . . . . . . . . . . . . . 3

1.5 Outline . . . . . . . . . . . . . . . . . . . . . . . . . . . . . . . . . . . . . . . 3

CHAPTER 2 STATE OF THE ART . . . . . . . . . . . . . . . . . . . . . . . . . . 4

2.1 Tracing infrastructure . . . . . . . . . . . . . . . . . . . . . . . . . . . . . . 4

2.1.1 Tracing systems . . . . . . . . . . . . . . . . . . . . . . . . . . . . . . 4

2.2 Multi-user architecture . . . . . . . . . . . . . . . . . . . . . . . . . . . . . . 9

2.2.1 Popular applications . . . . . . . . . . . . . . . . . . . . . . . . . . . 10

CHAPTER 3 UNIFIED KERNEL/USER-SPACE EFFICIENT LINUX TRACING AR-

CHITECTURE . . . . . . . . . . . . . . . . . . . . . . . . . . . . . . . . . . . . . 12

3.1 Abstract . . . . . . . . . . . . . . . . . . . . . . . . . . . . . . . . . . . . . . 12

3.2 Introduction . . . . . . . . . . . . . . . . . . . . . . . . . . . . . . . . . . . . 13

3.3 State of the Art . . . . . . . . . . . . . . . . . . . . . . . . . . . . . . . . . . 14

ix

3.3.1 Tracing infrastructure . . . . . . . . . . . . . . . . . . . . . . . . . . 14

3.3.2 Multi-user multithreaded application . . . . . . . . . . . . . . . . . . 15

3.3.3 Synchronization . . . . . . . . . . . . . . . . . . . . . . . . . . . . . . 17

3.4 Design Requirements . . . . . . . . . . . . . . . . . . . . . . . . . . . . . . . 17

3.5 Unified tracing architecture . . . . . . . . . . . . . . . . . . . . . . . . . . . 18

3.5.1 Tracing concepts . . . . . . . . . . . . . . . . . . . . . . . . . . . . . 20

3.5.2 Session daemon . . . . . . . . . . . . . . . . . . . . . . . . . . . . . . 22

3.6 Experimental results . . . . . . . . . . . . . . . . . . . . . . . . . . . . . . . 35

3.6.1 Benchmarks . . . . . . . . . . . . . . . . . . . . . . . . . . . . . . . . 35

3.6.2 Comparison . . . . . . . . . . . . . . . . . . . . . . . . . . . . . . . . 40

3.6.3 Discussion . . . . . . . . . . . . . . . . . . . . . . . . . . . . . . . . . 44

3.7 Conclusion . . . . . . . . . . . . . . . . . . . . . . . . . . . . . . . . . . . . . 44

CHAPTER 4 GENERAL DISCUSSION . . . . . . . . . . . . . . . . . . . . . . . . 45

4.1 Thread pooling . . . . . . . . . . . . . . . . . . . . . . . . . . . . . . . . . . 45

4.2 Network streaming . . . . . . . . . . . . . . . . . . . . . . . . . . . . . . . . 46

4.3 UST 0.x scalability . . . . . . . . . . . . . . . . . . . . . . . . . . . . . . . . 47

CHAPTER 5 CONCLUSION . . . . . . . . . . . . . . . . . . . . . . . . . . . . . . 49

5.1 Summary of the work . . . . . . . . . . . . . . . . . . . . . . . . . . . . . . . 49

5.2 Limitations . . . . . . . . . . . . . . . . . . . . . . . . . . . . . . . . . . . . 50

5.3 Future work . . . . . . . . . . . . . . . . . . . . . . . . . . . . . . . . . . . . 50

LIST OF REFERENCES . . . . . . . . . . . . . . . . . . . . . . . . . . . . . . . . . 51

APPENDICES . . . . . . . . . . . . . . . . . . . . . . . . . . . . . . . . . . . . . . . 53

x

LIST OF TABLES

Table 3.1 Scheme to avoid race condition between look up and lock . . . . . . . 34

Table 3.2 Test setup specification . . . . . . . . . . . . . . . . . . . . . . . . . . 35

Table 3.3 write to pipe . . . . . . . . . . . . . . . . . . . . . . . . . . . . . . . 36

Table 3.4 read from pipe . . . . . . . . . . . . . . . . . . . . . . . . . . . . . . 36

Table 3.5 send to socket . . . . . . . . . . . . . . . . . . . . . . . . . . . . . . . 37

Table 3.6 recv from socket . . . . . . . . . . . . . . . . . . . . . . . . . . . . . 37

Table 3.7 UST notification time breakdown . . . . . . . . . . . . . . . . . . . . 40

Table 3.8 UST registration time breakdown . . . . . . . . . . . . . . . . . . . . 40

Table 3.9 Memory usage of lttng-sessiond (size kB) . . . . . . . . . . . . . . . . 41

Table 3.10 CPU usage of lttng-sessiond (% System CPU time) . . . . . . . . . . 41

Table 3.11 Apache dispatch request time . . . . . . . . . . . . . . . . . . . . . . 43

Table 4.1 UST 0.x benchmark . . . . . . . . . . . . . . . . . . . . . . . . . . . 48

xi

LIST OF FIGURES

Figure 3.1 Architecture . . . . . . . . . . . . . . . . . . . . . . . . . . . . . . . . 19

Figure 3.2 Multi-user scenario . . . . . . . . . . . . . . . . . . . . . . . . . . . . 23

Figure 3.3 UST registration synchronization . . . . . . . . . . . . . . . . . . . . 25

Figure 3.4 UST registration wait/wake race . . . . . . . . . . . . . . . . . . . . 25

Figure 3.5 User space tracer registration . . . . . . . . . . . . . . . . . . . . . . 27

Figure 3.6 Session lock with the lockless hash table issue . . . . . . . . . . . . . 28

Figure 3.7 Tracing registry . . . . . . . . . . . . . . . . . . . . . . . . . . . . . . 29

Figure 3.8 Two lockless hash table node . . . . . . . . . . . . . . . . . . . . . . 30

Figure 3.9 Possible race with register before . . . . . . . . . . . . . . . . . . . . 31

Figure 3.10 Lockless shadow-copy mechanism on application registration . . . . . 32

Figure 3.11 Lockless shadow-copy mechanism on client command . . . . . . . . . 33

Figure 3.12 Session lock with the lockless hash table issue . . . . . . . . . . . . . 34

Figure 3.13 Socket send() vs Pipe write() . . . . . . . . . . . . . . . . . . . . . . 38

Figure 3.14 Socket recv() vs Pipe read() . . . . . . . . . . . . . . . . . . . . . . . 39

xii

LIST OF APPENDICES

Appendice A LTTng-Tools session code snippet . . . . . . . . . . . . . . . . . . . . 53

Appendice B CPU frequency acquisition code . . . . . . . . . . . . . . . . . . . . . . 55

Appendice C Apache tests . . . . . . . . . . . . . . . . . . . . . . . . . . . . . . . . 57

Appendice D Command line interface . . . . . . . . . . . . . . . . . . . . . . . . . . 58

xiii

LIST OF SIGNS AND

ABBREVIATIONS

API Application Programming Interface

ASCII American Standard Code for Information Interchange

BLOB Binary Large Object

CLI Command Line Interface

CPU Central Processing Unit

GDB GBU Debugger

FIFO First In First Out

HTTP Hypertext Transfer Protocol

I/O Input/Output

IP Internet Protocol

IPC Inter Process Communication

IT Information Technology

LDAP Lightweight Directory Access Protocol

LTT Linux Trace Toolkit

LTTng Linux Trace Toolkit Next Generation

POSIX Portable Operating System Interface for Unix

PID Process Identifier

RCU Read-Copy Update

SHM Shared Memory

SMP Symmetric Multiprocessing

SSL Secure Socket Layer

TCP Transport Control Protocol

UST User Space Tracer

UID Unique Identifier

UUID Universal Unique Identifier

1

CHAPTER 1

INTRODUCTION

Since the beginning of the LTTng project, and the release of its low-intrusiveness Linux

tracer, tracing is used on a daily basis in very large data centers from small and medium

companies like Revolution Linux to large corporation like Ericsson and Google. Over time,

it has proven that it is not only useful for debugging complex performance problems. An

increasing number of people are looking at tracing as a new tool for monitoring health of

large computer clusters.

However, production deployment is still not mainstream. Key aspects are missing for

it to be considered an essential production infrastructure component. Efficient tracers and

data analysis tools are not enough.

1.1 Tracing overview

In order to understand the research problem, this section makes a brief overview of tracing

by defining basic concepts used throughout this document.

On popular operating systems such as Linux, tracing is the action of recording events or

”trace events” with a minimum of disturbance. In other words, it is an high throughput and

efficient printf used to extract information from a running system, either from the kernel

or from a simple user space application.

To achieve such goals, instrumentation is enabled on a trace source (Ex: kernel) called

tracepoints. It can be added statically at the source code level or dynamically during runtime.

Unlike traditionnal debug statements, tracepoints can be enabled or disabled at any point

during the system lifetime. When a tracepoint is reached during execution, a probe, connected

to it, is responsible for writing the data to buffers managed by the tracer. For each tracer,

there is a consumer with a single task, writing the gathered information to a device (Ex:

disk, network card).

A tracer is considered a tracing source, i.e. providing information for one contained sys-

tem like the kernel or an application. With user space tracing, multiple sources are possible

and can be merged with kernel data for extensive analysis of an application behaviour.

The amount of data generated by tracers can be pretty large hence analysis tools like

2

LTTV or TMF (Tracing Monitoring Framework) developed by Ericsson are used to display

and understand collected data.

1.2 Problem

Today, many servers are running large number of applications with many different users.

Thus, there is, at an unknown rate, always new programs spawning, chaging state (blocked,

sleeping) and dying due to constant user interactions and potential heavy workload (Web

servers). We are faced with new challenges both in terms of security and management of

multiple tracing sources at once.

As mentionned, security is a very important issue here. Both user access control and data

security have to be taken into account considering, for example, that critical applications like

Web transactional software can be traced. With multiple programs running with different

security credentials, it makes sense to consider managing user space tracing with a trusted

central entity following an important security rule which is that no unprivileged user should

be trusted.

The problem studied in this work is how can we achieve tracing in a production envi-

ronment and still address resource usage and security constraints, using the LTTng tracer

as research vehicle. We then propose a new architecture and demonstrate its effectiveness

through the open source lttng-tools project which fulfills the needs for reliable tracing

tools in both controlled and uncontrolled IT ecosystems.

1.3 Objectives

The methodology of this study focuses on the following four steps and resulted in a

working implementation of our proposed model 3.1. The objective is to come up with a new

architecture designed to combine kernel and user space tracing with a low overhead on the

system. Improving usability is also highly desirable.

1. Study tracing impact and needs for large scale deployment.

Identify key architectural aspects of having tracing in production systems often involv-

ing machines with heavy workloads.

2. Create new algorithms and design model to achieve our tracing goals.

3. Implement new tracing components to validate our model and algorithms.

4. Provide measurements for reference baseline results.

3

1.4 Contribution

The main contribution of this research is the design and creation of a tracing architecture

suited and ready for production usage. This work includes the creation of efficient scheme

and algorithm used to handle tracing for multiple applications. Those schemes extensively

use RCU lockless data structures.

– Lockless dispatch mechanism to a thread pool.

– Efficient tracing application registration scheme.

– Tracing registry and lockless management.

– Kernel and user space tracing control unification.

The implementation of this work ended being the lttng-tools project providing a cen-

tral point of control for tracing in the LTTng 2.0 toolchain.

1.5 Outline

Chapter 2 presents the state of the art of tracing systems and focuses on the infrastructure

design. This section is a complete study of tracing related work, and relevant multithreaded

multi-user daemon applications (in other areas than tracing but facing similar architectural

requirements).

Then, Chapter 3 presents the article Unified efficient Linux tracing architecture combining

kernel and user space submitted to the ACM Operating Systems Review. This article details

the core of our research contributions. Section 3.3 is a subset of the state of the art Chapter

and adds a note on performance. Section 3.5 presents the proposed unified efficient tracing

architecture. Subsequently, section 3.6 shows the experimental results and performance

baseline of the implemented solution.

Chapter 4 follows with some discussions on other work done and consideration on non-

implemented parts of the model.

We will conclude in Chapter 5 by summarizing our work, explaining limitations to the

solution and possible future work.

4

CHAPTER 2

STATE OF THE ART

This chapter presents different tracing related software tools and how they coped with

multi-user tracing of multiple sources, from a performance and security point of view. This

is highly relevant since it defines part of a tracing model for production environments.

Following this, we examine the work done on multithreaded Linux daemons handling

large number of user requests. The actual benefit of this study is to explore architectures

developed in other fields to solve similar problems. Thus, looking at existing APIs and

mechanisms to deal with a large number of applications, interacting with a central service

concurrently, is directly relevant.

2.1 Tracing infrastructure

The first subsection gives an overview of past and present software tracing systems and

their architecture and design choices. This part is needed to identify some key elements

missing for a good production tracing infrastructure and understand success and failures.

2.1.1 Tracing systems

In early 1994, a technique called dynamic instrumentation or Dyninst API was proposed

to provide efficient, scalable and detailed data collection for large-scale parallel applications

(Hollingsworth et al., 1994). Being one of the first tracing systems, the infrastructure built

for data extraction was limited. The operating systems at hand were not able to provide

efficient services for data extraction. They had to build a data transport component to read

the tracing data, using the ptrace function, that was based on a time slice to read data.

A time slice handler was called at the end of each time slice, i.e when the program was

scheduled out, and the data would be read by the data transport program built on top.

Based on this technology, the DPCL project was created to extend the Dyninst tools

using a robust scalable design. It offered, at the time, an API for installing and removing

instrumentation from serial or parallel programs at runtime (Pase, 1998). The original

motivation for DPCL was to provide application performance analysis tools for customers

where no tool suppliers could build this kind of framework.

5

This framework provided components to manage tracing, with what they called special

daemons that work in a client-server application scheme. The end-user-tools were able to

communicate with a service provider (daemon) and that daemon could install, activate, de-

activate and remove instrumentation in an application. Both synchronous and asynchronous

requests could be handled. This instrumentation was defined combining probe expressions

and probe modules, which is a concept that we will meet later in the Systemtap project.

DPCL introduced the concept of a central daemon processing client requests through a

library. The client tool, wanting to create a connection to a process for data acquisition,

spawned a super daemon, if it did not exist, that checked for a normal daemon. The normal

daemon would change its ownership to the process credentials. The connection was then

transfered to that daemon and a channel was opened to the target process. Thus, for each

user, there was a DPCL daemon created. The infrastructure design was made to provide a

secure infrastructure and to be scalable on multiple nodes. This way, user a cannot interact

with the daemon of user b and vice versa. It basically offloads all access control to the kernel.

This framework made possible new tools like DynaProf and graphical user interface for

data analysis (DeRose et al., 2001). DynaProf is a dynamic profiling tool that provides a

command line interface, similar to gdb, used to interact with the DPCL API and to basically

control tracing all over your system.

Kernel tracing brought a new dimension to infrastructure design, having the problem of

extracting data out of the kernel memory space to make it available in user-space for analysis.

The K42 project (Appavoo et al., 2002) used shared buffers between kernel and user space

memory, which had obvious security issues. A provided daemon waked up periodically and

emptied out the buffers where all client trace control had to go through. This project was

a research prototype aimed at improving tracing performance. Usability and security was

simply sacrificed for the proof of concept. For example, a traced application could write to

these shared buffers and read or corrupt the tracing data for another application, belonging

to another user.

At this point, we can see that a central tracing control daemon is often used to handle

the tracing back-end and for security issues. It works basically as a rendez-vous point for

the user and tracer to manage their interactions, and to isolate components from each other.

In the next sections, recent open source tracers and how they built their tracing infras-

tructure will be examined. Even though most of these are kernel tracers, some projects also

mix user space tracing, bringing up new issues.

6

LTT and LTTng

If we look at the first Linux Trace Toolkit project (LTT)(Yaghmour et Dagenais, 2000),

it was designed to help finding performance issues in fairly complex Linux systems, and

provide users with a view of the system behaviour. A set of tools was offered to interact

with the tracer, and a user space daemon for data extraction. No user space tracing was

offered at that time. Therefore, we ended up with a very basic control, for only one user and

one tracing source, the kernel.

Its successsor, LTTng (Desnoyers et Dagenais, 2006), was designed to offer kernel tracing

with low latency, deterministic real-time impact, small impact on the operating system

throughput and linear scalability with the number of cores (Desnoyers, 2009). It was a new

and greatly improved system that made possible new tracing technology to be incorporated

in the Linux kernel, such as immediate values and tracepoints(Desnoyers, 2009). Still, the

goal was to address important performance needs. The same subset of tools as the LTT

project were offered to the user space for tracing control and data extraction but, again,

only privileged users can use it and a single tracing source is available.

One common aspect of those two tracers is that tracing data can be fetched through a

character device, for LTT, and, for LTTng, a per stream file descriptor exposed through the

debugfs filesystem. For LTTng, a central daemon polls on all stream file descriptors (which

is a blocking state) and, when data is available, it is consumed by writing to trace files that

can later be analysed. Tracer control is achieved through the debugfs filesystem by writing

commands to the right file representing a tracer object (Ex: events, channel).

Note that security was never a prerequisite during development since the kernel is the

only data source and privileged credentials are always needed. Multiple user sessions are not

supported so only one privileged user could trace the kernel at once, which is not well suited

for production. Furthermore, tracing control was not integrated between the LTTng kernel

tracer and the LTTng user space tracer (UST), which reduced usability.

DTrace

Then, Sun Microsystems� released, in 2005, DTrace(Cantrill et al., 2004) which offers

the ability to dynamically instrument both user-level and kernel-level software. As part of a

mass effort by Sun, a lot of tracepoints were added to the Solaris 10 kernel and user space

applications. Projects like FreeBSD and NetBSD also ported dtrace to their platform, as

later did Mac OS X. The goal was to help developers find serious performance problems.

The intent was to deploy it across all Solaris servers and to use it in production.

If we look at the DTrace architecture, it uses multiple data providers, which are basically

7

probes used to gather tracing data and write it to memory buffers. The framework provides

a user space library (libdtrace) which interacts with the tracer through ioctl system calls.

Through those calls, the DTrace kernel framework returns specific crafted data for immediate

analysis by the dtrace command line tool. Thus, every interaction with the DTrace tracer

is made through the kernel, even user space tracing.

On a security aspect(Gregg et Mauro, 2011), groups were made available for different level

of user privileges. You have to be in the dtrace proc group to trace your own applications

and in the dtrace kernel group to trace the kernel. A third group, dtrace user, permits

only system call tracing and profiling of the user own processes.

This work was an important step forward in managing tracing in current operating sys-

tems in production environment. The choice of going through the kernel, even for user space

tracing, is a performance trade-off between security and usability.

SystemTap

In early 2005, Red Hat released SystemTap (Prasad et al., 2005) which also offers dynamic

instrumentation of the Linux kernel and user applications. In order to trace, the user needs

to write scripts which are loaded in a tapset library. SystemTap then translates these in C

code to create a kernel module. Once loaded, the module provides tracing data to user space

for analysis.

Two system groups namely stapdev and stapusr are available to separate possible trac-

ing actions. The stapdev group can do any action over Systemtap facilities, which makes it

the administrative group for all tracing control (Don Domingo, 2010) and module creation.

The second group, stapusr, can only load already compiled modules located in specific

protected directories which only contain certified modules.

The project also provides a compile-server which listens for secure TCP/IP connections

using SSL and handles module compilation requests from any certified client. This acts as

a SystemTap central module registry to authenticate and validate kernel modules before

loading them.

This has a very limited security scheme for two reasons. First, privileged rights are still

needed for specific task like running the compilation server and loading the modules, since

the tool provided by Systemtap is set with the setuid bit. Secondly, for user space tracing,

only users in SystemTap’s group are able to trace their own application, which implies that

a privileged user has to add individual users to at least the stapusr group at some point in

time, creating important user management overhead.

It is worth noting that the compilation server acts mostly as a security barrier for kernel

module control. However, like DTrace, the problem remains that it still relies on the kernel for

8

all tracing actions. Therefore, there is still a bottleneck on performance if we consider that a

production system could have hundreds of instrumented applications tracing simultaneously.

This back and forth in the kernel, for tracing control and data retrieval, cannot possibly scale

well.

Perf and Ftrace

In 2008 came the kernel function tracer Ftrace designed by Steven Rostedt and Ingo

Molnar, and targeting kernel developer’s needs. It offered new features, not in LTTng at the

time, and a mainline Linux tracer more efficient than SystemTap (which as of today is still

not in the mainline kernel).

Perf made by Ingo Molnar and Thomas Gleixner, which also came in 2008, brought

performance counters access coupled with a tracer that uses the available kernel instrumen-

tation.

Like the previous project, those tools are aimed at providing system data, with minimal

impact on the operating system. Most of the time, the kernel is the target and all tracing

facilities are inside it.

To use Ftrace, every interaction with it is done through the debugfs filesystem in

/debug/tracing subdirectory. Commands are executed by changing values in files located

in this directory. For instance, enabling the function tracer would be as follows:

# echo function >/debug/tracing/current_tracer

# echo 1 >/debug/tracing/tracing_enabled

[actions]

# echo 0 >/debug/tracing/tracing_enabled

Looking at the traced data is done by reading the trace file for human-readable output.

Files latency trace and trace pipe are also available from which the trace can be read,

organized respectively by system latencies and to be piped in a command. A trace cmd

command is available to make tracing easier and user friendly.

Perf is similar to ftrace, also using debugfs for trace output and command input. A

perf command is available which helps on the usability side. Here is an example of how to

start tracing kernel events:

# perf record -c 1 -a -e sched:sched_wakeup

Option ”-c 1” says to sample every event and ”-a” to enable system-wide tracing. This

command records all sched wakeup events in the system.

9

However, the design does not support production infrastructure with unprivileged users

accessing the data. Moreover, aggregating tracing data from multiple sources is not possible.

Every command has to be done as root and cannot be executed otherwise.

UST

One of the first user space alternative to DTrace and SystemTap came in January 2010

with the first official release of the user space tracer (UST) made by Pierre-Marc Fournier at

Ecole Polytechnique de Montreal(Fournier et al., 2009). Largely based on the LTTng kernel

tracer, the goal was to offer a framework for developers to add static tracepoints to their

applications and be able to trace them exclusively in user space (not using the kernel or

having privileged rights like in the previous projects).

This project was the starting baseline of this study. The tools provided were not address-

ing production needs and security issues, thus making this tracer only used by developers.

With an in-process library, this tracer brought new concepts to tracing and thus new chal-

lenges to make an integration in a real world environment. Among these challenges, is the

multi-user aspect, handling tracing session on a per-user basis with multiple tracing sources.

One major factor of scalability is the one daemon per process design. With large number

of applications being traced on a system, this scheme can consume a lot of resources (memory

and CPU), thus degrading the server performance. However, the advantages of this tracer

is that everything is done in user land, thus eliminating the need for a kernel component,

bringing higher performance versus Dtrace and SystemTap. UST uses RCU data structures

for a completely lockless tracer.

2.2 Multi-user architecture

We have highlighted in the last section that user space tracing brought issues to the

production environment concept. In order to propose a new tracing component, the next

sections explore multi-user support in areas other than tracing, and how widely used appli-

cations are dealing with it.

Through this research, we propose a new approach to tracing by combining kernel and

user space tracing through one central component. As mentioned before, with user space

tracing, systems can now have an large number of tracing sources in a multi-user environment.

Knowing that, challenges arise on how can we manage a potentially large number of requests

from users and applications to our central component by keeping it fast and efficient.

The following studied applications are routinely deployed across all types of servers and

workloads and can manage numerous client requests to be served efficiently. They could

10

serve as an inspiration for a scalable tracing infrastructure and help us choose a design

synchronization model.

2.2.1 Popular applications

Pulseaudio

Pulseaudio is a cross-platform networked sound server, commonly used on the Linux-

based and FreeBSD operating systems (Wikipedia, 2011). It is the most widespread program

in all Unix operating systems to manage sound I/O. Audio streams management, transport

and composition has been a difficult problem with a large number of proposals through the

years which failed to offer the desired scalability, performance and architectural soundness.

The pulseaudio daemon acts like a central rendez-vous point for all sound sources. It

then reroute sound streams to the corresponding hardware or even over a network stack.

Through a library layer, the pulseaudio server can be controlled from multiple applications

and also acts as a sound system registry.

They extensively uses the POSIX thread library (pthread) for synchronization using mu-

texes and conditions. They also use shared memory for sound buffer sharing and semaphores

for sound stream synchronization. This particular design is very interesting from a multi-

source point of view, where one main server handles multiple commands, taken from a user

space library API, and reroutes requests and replies through the server. Depending on the

sound sources, the right hardware is chosen.

The routing commands concept was used in our work to develop a new tracing component

sending client requests to tracers (tracing sources). We also created a similar API to control

the central daemon handling tracing sources (here sound streams). The whole idea of being

a rendez-vous point for sound sources is one of the core foundation behind our work.

Memcached

Memcached is an interesting software to look at in terms of distributed client and concur-

rent data access. Memcached is a high-performance, distributed caching system used to speed

up applications by using unused memory across remote nodes (Fitzpatrick, 2004)(Petrovic,

2008). It uses a distributed hash table shared between nodes so that every change could

be seen by every node. Keys in the global hash table represent memory segments that an

application could request using the user-space API.

The basic tasks of memcached are:

– Manage memory allocation (malloc/free)

– Keep track of BLOB stored in memory

11

– Serve client for memory requests

The interesting aspect here to consider for this study is the storage technique used and

effiency at getting coherent data between nodes. Using hash tables makes searches in O(1)

for every existing or non existing memory object lookup. Although our approach in this work

is different, being not distributed, the concept of tracking memory and using hash tables is

used for our purposes.

In terms of code and threading model, having thread workers handling client requests,

since using TCP/IP sockets can be costly, is a nice model to consider.

Apache 2.2 Web Server

The Apache project came to life in 1995 (Fielding et Kaiser, 1997) and brought to the

open source world one of the most powerful and widespread Web server. This software is

currently used to handle most of the busy Web sites like Wikipedia.

Apache uses a thread pool scheme. It allocates resources for a fixed number of threads

at startup, and dispatches requests among them. A process pool (workers) is created by the

MPM module (multi-processing module) (Kew, 2007) to handle client requests. By looking

at the dispatch mechanism, (i.e. how the main listener thread hands over a user request to

a process in the pool), helped us design the main part of the lttng-tools project.

Basically, each worker waits on a global queue using the queue’s global lock (pthread

mutex (Rochkind, 2004)) and reads from the socket when it is able to acquire the lock.

Once the element is read (here a HTTP request), it is processed by the worker thread.

After finishing the request, the worker thread requeues itself by trying to reacquire the lock.

The contention is basically handled by the kernel and starvation is avoided since this queue

basically acts as a FIFO mechanism.

Section 3.6 looks at the time taken by the process to settle the contention between all

worker threads and compares it to the proposed lttng-tools dispatch mechanism.

This overview of these three multi-user infrastructure applications, extensively used on

high end production servers, gives us a good idea on how we can achieve our goals efficiently.

12

CHAPTER 3

UNIFIED KERNEL/USER-SPACE

EFFICIENT LINUX TRACING

ARCHITECTURE

Authors

David Goulet <[email protected]>

Ecole Polytechnique de Montreal

Michel Dagenais <[email protected]>

Ecole Polytechnique de Montreal

Mathieu Desnoyers <[email protected]>

EfficiOS Inc.

Submitted to Operating Systems Review (ACM)

Categories and Subject Descriptors

D.2.5 [Software Engineering]: Testing and Debugging - Tracing

D.4.8 [Operating Systems]: Performance - Operational analysis

Date: March 23, 2012

Status Under review

3.1 Abstract

As tracing becomes increasingly efficient, new applications are envisioned such as mon-

itoring servers farms. When dealing with multiple tracing sources, from user to kernel

space, a production grade architecture is needed to handle multi-user environments and se-

curity concerns. This work aims at creating a unified tracing architecture, combining tracers

functionalities under one umbrella. The objective is to provide good performance and low

resource footprint. This model motivated the lttng-tools project, based on the LTTng 2.0

tracers, which implements the proposed architecture.

13

3.2 Introduction

Tracing is used on a daily basis in large data centres from small companies to large

corporation like Ericsson and Google. It has proven that it is not only useful for debugging

complex performance problems (Bligh et al., 2007) but people are looking at tracing as a

new tool for monitoring the health of large computer clusters.

Bringing tracing into production systems involves multi-user environments. For instance,

software developers using shared servers with different credential levels imply using a session

mechanism in order to isolate these from each other. Furthermore, with user space tracing

comes the aspect of multiple tracing sources, where a large number of tracers (e.g. traced

applications) can be running at the same time and controlled by different users. Security is

an important factor addressed with sessions at two levels: tracer access control, and reliable

tracing control.

This paper presents a new unified infrastructure to trace multiple sources (kernel and

applications). This infrastructure addresses multi-user and security constraints. Moreover,

it keeps the low-intrusiveness and efficiency properties that modern tracers offer. By unify-

ing tracer control, we proposed new tracing components which act as a rendez-vous point,

handling data consumption and interactions between users and tracers.

To achieve this, we propose a new tracing architecture, suited for production environment,

unifying kernel and user space tracing. The results of our study, based on the LTTng 2.0

tracer 1, resulted in the lttng-tools project.

In the next section, we present the existing work on tracing infrastructure from the

design point of view. We also outline known multi-user multithreaded applications like

Apache (Fielding et Kaiser, 1997) which address similar performance and efficiency concerns

in a multi-user context. The following section 3.4 explains the design requirements for our

architecture.

In section 3.5, we present our solution based on the aforementioned design requirements.

This model was implemented in the lttng-tools project and now provides a new set of

features. In section 3.6 experimental results are presented and demonstrate the performance

and correctness of the proposed architecture and synchronization algorithms. We then con-

clude this research, briefly discussing areas for improvement.

1. http://lttng.org

14

3.3 State of the Art

This paper proposes a new tracing component not found in existing tracing solutions,

as detailed in this section. For this reason, efficient multi-user infrastructure applications

in areas other than tracing were also examined, to study how they handle multiple requests

from clients and scale on multi-processor systems.

3.3.1 Tracing infrastructure

The first section gives an overview of current software tracing systems and the design

choices they made.

Sun Microsystems� released, in 2005, DTrace (Cantrill et al., 2004) which offers the

ability to dynamically instrument both user-level and kernel-level software. As part of a

mass effort by Sun, numerous tracepoints were added to the Solaris 10 kernel and user space

applications. Projects like FreeBSD and NetBSD also ported dtrace to their platform, as

later did Mac OS X. The goal was to help developers find serious performance problems.

The intent was to deploy it across all Solaris servers, to be used in production.

If we look at the DTrace architecture, it uses multiple data providers, which are probes

used to gather tracing data and write it to memory buffers. The framework provides a user

space library (libdtrace) which interacts with the tracer through ioctl system calls. Through

those calls, the DTrace kernel framework returns specific crafted data for immediate analysis

by the dtrace command line tool. Every interaction with the DTrace tracer is through the

kernel, even for user space tracing. This creates an important bottleneck since the kernel

handles every tracing source, slowing concurrent user space tracing.

On a security aspect (Gregg et Mauro, 2011), groups are available for different levels of

user privileges. You have to be in the dtrace proc group to trace your own applications and

in the dtrace kernel group to trace the kernel. A third group, dtrace user, permits only

syscall tracing and profiling of the user’s own processes. This concept of tracing roles sepa-

ration is good for dealing with credentials separation and not force users to have privileged

rights (root).

In early 2005, Red Hat released SystemTap (Prasad et al., 2005) which also offers dynamic

instrumentation of the Linux kernel and user applications. In order to trace, the user needs

to write scripts which are loaded in a tapset library. SystemTap then translates these in C

code to create a kernel module. Once loaded, the module provides tracing data to user space

for analysis.

Two system groups, namely stapdev and stapusr, are available to separate possible

tracing actions. The stapdev group can do any action over Systemtap facilities, making it

15

the administrative group for all tracing control (Don Domingo, 2010) and module creation.

The second group, stapusr, can only load already compiled modules, located in specific

protected directories which only contain certified modules.

The project also provides a compilation server, listening for secure TCP/IP connections

using SSL and handling module compilation requests from any certified client. This acts

as a SystemTap module central registry to authenticate and validate kernel modules before

loading them.

This constitutes a very limited security scheme for two reasons. First, privileged rights are

still needed for specific tasks like running the compilation server and loading the modules,

since the tool provided by Systemtap is set with the setuid bit. Secondly, for user space

tracing, only users in SystemTap’s group are able to trace their own application, which

implies that a privileged user has to add individual users to at least the stapusr group at

some point in time, creating important user management overhead.

It is worth noting that the compilation server acts mostly as a security barrier for kernel

module control. However, like DTrace, the problem remains that it still relies on the kernel

for all tracing actions. Thus, there is still a bottleneck on performance if we consider that a

production system could have hundreds of instrumented applications tracing simultaneously.

Transitioning back and forth in the kernel for tracing control and data retrieval cannot pos-

sibly scale well.

Linux tracing is designed to be extremely efficient. Yet, until now, no existing solution

provides good performance and security to handle tracing in a multi-user environment with

multiple tracing sources.

3.3.2 Multi-user multithreaded application

Throughout this research, a main focus is to handle not only many users but also many

tracing sources. The memcached and Apache project are two widespread applications that

efficiently address these security and multi-user requirements.

This work proposes a new approach to tracing by combining kernel and user space tracing

through one central component. As mentioned before, with user space tracing, a system can

now have a large number of tracing sources in a multi-user environment. Knowing that,

challenges arise on how can we manage a potentially large number of requests from users

and applications to our central component by keeping it fast and efficient. Studying the

following applications helped design our new architecture and algorithms for synchronization

in a multithreaded environment.

16

Memcached

Memcached is a very interesting system to look at in terms of distributed client and

concurrent data access. It is a high-performance, distributed caching system, used to speed

up applications by using unused memory across remote nodes (Fitzpatrick, 2004) (Petrovic,

2008). It uses a distributed hash table shared between nodes so every change could be seen

by every node. Keys in the global hash table represent memory segments that an application

could request using the user space API.

The basic tasks of memcached are:

– Manage memory allocation (malloc/free)

– Keep track of BLOB stored in memory

– Serve clients for memory requests

Interesting aspects to considered for this study are the storage technique used and effi-

ciency at getting coherent data between nodes. Using hash tables enables searches in O(1)

for every existing or non existing memory object lookup.

Moreover, the client request handling threading model is based on libevent 2 which

passes every new connection to a thread pool on a round-robin basis. However, to access

the main hash table, a global lock is still needed, creating an important contention between

requests.

Apache 2.2 Web Server

The Apache project started in 1995 (Fielding et Kaiser, 1997) and brought to the open

source world one of the most powerful and widespread Web server. It is used to handle

several of the busiest Web sites like Wikipedia.

Apache uses a thread pool scheme. It allocates resources for a fixed number of threads

at startup, and dispatches requests among them. A process pool (workers) is created by the

MPM module (multi-processing module) (Kew, 2007) to handle client requests. Looking at

the dispatching mechanism, i.e. how the main listener thread hands over a user request to a

process in the pool, helped us design the main part of the lttng-tools project.

Each worker waits on a global queue using the queue’s global lock (pthread mutex

(Rochkind, 2004)) and reads from the socket when it is able to acquire the lock. Once

the element is read (here a HTTP request), it is processed by the worker thread. After

finishing the request, the worker thread requeues itself by trying to reacquire the lock. The

contention is handled by the kernel and starvation is avoided since this queue essentially acts

as a FIFO mechanism.

2. http://libevent.org

17

Section 3.6 looks at the time taken by the process to settle the contention between all

worker threads, and compares it to the lttng-tools dispatching mechanism.

This overview of these multi-user infrastructure applications, extensively used on high

end production servers, gives us a good idea on how we can achieve our goals efficiently.

3.3.3 Synchronization

Multithreaded applications come with important synchronization challenges. The key

goal of our proposed architecture is to optimise the performance. A lockless scheme was

devised using RCU technology (McKenney et Walpole, 2007) – a synchronization mecha-

nism allowing reads to occur concurrently with updates. RCU enables concurrent access to

data structures without locks for one updater and multiple readers. It differs from locking

primitives that ensure mutual exclusion between threads, or reader-writer locks which allow

concurrent reads but not during updates.

The basic idea is that updates are atomic, even for complex structures. A pointer to

the complex structure is atomically replaced by another pointer to a fresh updated copy of

the structure. Thus, while updating is protected by locks, reads can happen concurrently

with updates and other reads. The tricky part in RCU algorithms is to determine when the

previous version of the updated structure can be released, all concurrent reads accessing that

version being terminated.

The user space RCU library (Desnoyers et al., 2010) provides a wide variety of lockless

data structures, from linked lists to red-black trees. They were used extensively for the

synchronization model of our proposed tracing rendez-vous point.

3.4 Design Requirements

This research is in part intended to meet the requirements set by industry partners such

as Ericsson and Revolution Linux who helped define the missing parts of today’s tracing

architecture. Four requirements were identified and are an important focus of this work.

1. Multi-user

2. Security

3. Performance

4. Reliability

18

Deployed servers support many users with different security rights and are often managed

through a central directory (Ex: LDAP). For thin clients deployed by Revolution Linux 3,

tracing cannot be deployed unless the multi-user constraint is addressed. Since we are dealing

with multiple tracing sources, it becomes important that users do not interfere with each

other. Hence a separation is needed in terms of data coherency and security.

The next key point to consider is security. Again, multiple users means different access

levels, where everyone is not a privileged user. Tracing data from critical applications, for

example banking software and sensitive databases, should not be accessible by unprivileged

users for obvious reasons.

Furthermore, there is the question of trace data protection and integrity to consider. For-

tunately, the tracer itself can guarantee the correctness of data written to buffers. However,

unifying tracers implies aggregating tracing sources, so care is needed for managing those

traces beyond the tracer lifetime.

Production servers should not suffer performance issues from tracing and it should scale

throughout hardware and software upgrades (e.g. adding more cores).

Tracers usually outsource the extraction of recorded data from buffers to disk using a

separate user space process. Indeed, LTT (Yaghmour et Dagenais, 2000), LTTng (Desnoyers

et Dagenais, 2006), SystemTap (Prasad et al., 2005) and DTrace (Cantrill et al., 2004) all

use kernel IPC (Love, 2010) mechanisms to notify a user space daemon to consume buffers.

On large server farms, the scalability of the data retrieval and analysis infrastructure is a

concern.

Different types of efficient data transport, subject to security constraints (integrity and

protection), were examined during the architectural design. For instance, the types of trans-

port investigated are network streaming (using either UDP or TCP), local device writing,

secure communication layer like SSH protocol (Ylonen et al., 2006) or memory caching (flight

recorder).

Finally, a separation between the control and data path, for the telecommunication in-

dustry, is very important to ensure reliability of their software and hardware. One failing

should not cause the other one to stop.

3.5 Unified tracing architecture

One of the main problems faced throughout this research, encountered during the design

phase of lttng-tools, is how to integrate all tracing components and create a rendez-vous

point for all tracing activities, while addressing the previous considerations.

3. http://revolutionlinux.com

19

With a set of design goals and use cases to address, this section explains in detail the

work done to design an efficient tracing infrastructure. This resulted in the lttng-tools

project, based on the LTTng tracer family (Desnoyers et Dagenais, 2006) (Desnoyers, 2012),

an important benefit of this research to the tracing and open source communities.

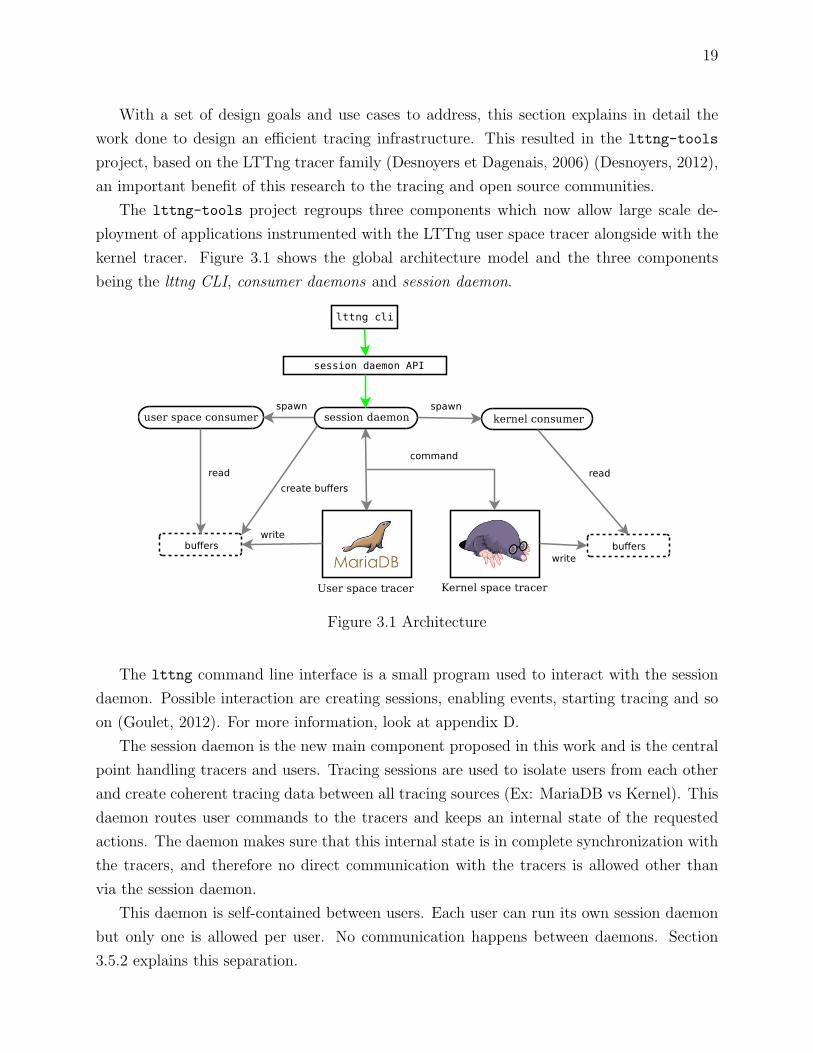
The lttng-tools project regroups three components which now allow large scale de-

ployment of applications instrumented with the LTTng user space tracer alongside with the

kernel tracer. Figure 3.1 shows the global architecture model and the three components

being the lttng CLI, consumer daemons and session daemon.

Figure 3.1 Architecture

The lttng command line interface is a small program used to interact with the session

daemon. Possible interaction are creating sessions, enabling events, starting tracing and so

on (Goulet, 2012). For more information, look at appendix D.

The session daemon is the new main component proposed in this work and is the central

point handling tracers and users. Tracing sessions are used to isolate users from each other

and create coherent tracing data between all tracing sources (Ex: MariaDB vs Kernel). This

daemon routes user commands to the tracers and keeps an internal state of the requested

actions. The daemon makes sure that this internal state is in complete synchronization with

the tracers, and therefore no direct communication with the tracers is allowed other than

via the session daemon.

This daemon is self-contained between users. Each user can run its own session daemon

but only one is allowed per user. No communication happens between daemons. Section

3.5.2 explains this separation.

20

Consumer daemons extract data from buffers containing recorded data and write it to

disk for later analysis. There are two separate consumer daemons, one handling user space

and the second one the kernel. A single consumer daemon handles all the user space (and

similarly for kernel space) tracing sessions for a given session daemon. It is the session daemon

that initiates the execution of the user space and kernel consumer daemons and feeds them

with tracing commands. The session daemon implements our proposed architecture.

For illustration purposes, here is a small example on how you start tracing the kernel

using this new architecture.

# lttng create mysession

# lttng enable-event sched_switch --kernel

# lttng start

...

# lttng stop

First, a session is created using the lttng command line interface which send command

to the session daemon. We then enable the event sched switch for the kernel domain (–

kernel). So, the daemon receives the command, maintain an internal state for the session and

finally enables the event on the tracer. Following this, the start action basically spawn the

kernel consumer and start tracing for every session. Upon the stop command, the consumer

stays alive but the tracer stops recording data.

The next section describes important tracing concepts for the global understanding of

the model. The following section presents the session daemon internal algorithms, key to its

efficiency.

3.5.1 Tracing concepts

One of the goals of the lttng-tools project is to bring LTTng’s tracers under one umbrella

and creating an abstraction layer between the user and the tracers, hence the importance of

the rendez-vous point concept.

Domains

First, we introduce the notion of tracing domains which is essentially, a type of tracer or

tracer/feature tuple. We currently implement two domains in lttng-tools:

– UST

Global user space domain. Channels and events registered in that domain are enabled on all current

and future registered user space applications.

21

– KERNEL

Three more domains are not yet implemented but are good examples of the tracer/feature

concept. They are UST PID for specific PID tracing, UST EXEC NAME based on application

name and UST PID FOLLOW CHILDREN which is the same as tracing a PID but follows spawned

children.

Session

One of the key new features is the concept of tracing session. It is an isolated container

used to separate tracing sources and users from each other. It takes advantage of the session

feature offered by the tracer.

Each tracing session has a human readable name (Ex.: myapps) and a directory path

where all trace data is written. It also contains the user UID/GID, in order to handle

permissions on the trace data and also determine who can interact with it. We use credentials

passing through UNIX socket (Rochkind, 2004) (Linux, 2008) for that purpose.

More importantly, it has pointers to each possible tracer session (kernel and user space).

Each of them contains the list of domains which contain a list of channels. Appendix A

shows the code snippet for the tracing session data structure.

Event

In earlier LTTng tracers (version 0.x) (Desnoyers et Dagenais, 2006), the term tracepoint

was used and represented a probe in the code recording information. Here, to abstract

different domains, the term event is used which relates to a TRACE EVENT statement in your

application code or in the Linux kernel instrumentation.

Using the command line tool lttng D, you can enable and disable events for a specific

tracing session on a per domain basis. An event is always bound to a channel and associated

tracing context (Desnoyers, 2012).

Channel

Channels existed in the earlier LTTng tracers but were hardcoded and specified by the

tracer. In the new LTTng 2.0 version, channels are now definable by the user and completely

customizable (size of buffers, number of subbuffer, read timer, etc.).

A channel contains a list of user specified events (e.g. system calls and scheduling

switches) and context information (e.g. process id and priority). Channels are created

on a per domain basis, thus each domain contains a list of channels that the user creates.

22

Each event type in a session can belong to a single channel. For example, if event A is

enabled in channel 1, it cannot be enabled in channel 2. However, event A can be enabled

in channel 2 (or channel 1 but not both) of another session.

3.5.2 Session daemon

The session daemon handles all interactions between the users, consumers and tracers.

Here is the list of the daemon’s roles. Each role is explained in depth to illustrate how are

satisfied the requirements exposed in section 3.3.

– Rendez-vous point:

Handles user, consumer and tracer interactions, being the synchronization component

across the tracing toolchain.

– Act as a tracing registry:

1. User space tracer registration (application register)

2. Tracing sessions management (user command)

Unlike the DPCL(Pase, 1998) project using a super daemon, our session daemons coexist

and act independently, never exchanging data, managing their instrumented applications

with the same credentials and handling their own consumers.

It is possible for multiple users to run a session daemon at the same time on the same

machine. Figure 3.2 shows the interaction between all the components in a multi-user envi-

ronment. It should be noted that the two session daemons of the figure never communicate.

Such separation is crucial for usability. It allows any user to compile its own session dae-

mon, run it and be able to trace his or her applications independently. Having two session

daemons communicating would be useless since the information of another user is irrelevant.

Section 3.5.2 explains the efficient mechanism behind applications and tracing sessions

management.

For kernel tracing, the session daemon must run with privileged credentials (UID = 0).

For obvious security reasons, only allowed users can gather kernel traces. A tracing group

is defined, similar to SystemTap groups (Prasad et al., 2005), where everyone in that group

can communicate with the session daemon running as root. This is achieved by using Unix

sockets (Rochkind, 2004) and having read and write permissions for the tracing group.

In summary, the session daemon grants access to tracing resources by running under

various credentials and allowing interactions only from users who possess enough rights to

do so. Unprivileged users cannot access other user’s traces and only allowed users can

control the kernel tracer. Moreover, the rendez-vous point concept allows it to provide a

23

Figure 3.2 Multi-user scenario

new set of features that tracers themselves cannot provide such as application registration,

and synchronization of every tracer available on the system.

The next two sections explains the user and kernel space tracer interactions with the

session daemon, looking in depth at application registration and kernel features. Following

this, the tracing registry, the core of the session daemon, is described.

Kernel tracer

While the kernel tracer is the most complex entity in terms of code and algorithms, it

is the simplest to handle. For the session daemon, this tracer is a single tracing source.

You cannot have two kernels running concurrently, as opposed to user space tracers where

multiple instrumented applications provide multiple tracing sources.

Managing the kernel tracer requires a different approach from user space tracing. The

traced data is entirely controlled by the kernel. For security reasons, we can assume that

they are not directly accessible by user space, at least not writable. As we saw in previous

projects (Desnoyers et Dagenais, 2006) (Yaghmour et Dagenais, 2000) (Prasad et al., 2005),

the kernel exposes a transport pipeline (Ex: character device or anonymous file descriptor)

and a user space daemon simply extracts data through this mechanism.

Mostly for security purposes, and buffering differences between tracers, the lttng-tools

24

project implemented a separate consumer for the kernel tracer. It is spawned and updated

by the session daemon. At startup, the session daemon loads every LTTng kernel module

and opens file /proc/lttng for upcoming interactions. As mention earlier, only a privileged

session daemon can communicate with the kernel tracer, and only users in the tracing group

can interact with it.

One specific feature of the kernel tracer is CPU hotplug. It is explained in section 3.5.2.

The kernel notifications are handled by a thread that polls the kernel file descriptor notifies

the consumer of the newly created per-cpu channel to consume.

User-space tracer

The user space tracer brings the possibility of multiple concurrent tracing sources. With

the LTTng 2.0 UST tracer, instrumented applications register with the session daemon at

the beginning of their execution.

Since the tracer functionality relies on a running session daemon, the registration mech-

anism is crucial and, thus, has to be very efficient. Two challenging situations occur, where

the session daemon is either running or not running. The most important premise is that

the application runtime behaviour should not be altered by the user space tracer waiting for

the session daemon. Thus, the user space tracer needs to follow this algorithm in a separate

thread, since condition at line 1 might not be satisfied at first:

Require: New process (thread)

1: if connect succeed then

2: register

3: receive possible command(s)

4: begin normal program execution

5: else

6: begin normal program execution

7: wait for notification (passive blocking)

8: end if

Line 1 tests the condition by connecting to the session daemon application socket. On

success, the application sends basic information used by the application registry 3.5.2 on line

3. Then, it waits for commands (Ex: create session, enabling events, etc.) and finally begins

the normal execution of the program (C main()).

On connection failure, we immediately begin the program execution since we cannot wait

for an unknown period of time. Finally, on line 7, we wait for notification, which is the more

25

complex part.

Figure 3.3 shows the three possible scenarios for the session daemon notification process.

Three applications begin waiting respectively before, during and after the notify (wake) of

the session daemon which indicates that it is ready to receive registration.

App1 and app3 are clearly able to register since the state of the wake is not racing with

the wait process and the registration. However, app2 is a more problematic case which

requires careful synchronization in order to avoid starvation on the tracer side and the

possible wait/wake race shown in figure 3.4. This model is based on the fact that there are

n > 0 wait processes and 1 waker.

Figure 3.3 UST registration synchronization

Figure 3.4 UST registration wait/wake race

This issue shows that a shared IPC is needed as a way to synchronize applications and

a session daemon. A persistent memory location with the session daemon state (flag) is

needed to ensure coherent state over time for all user space tracers. Commonly, this is called

a semaphore (Abraham Silberschatz et Gagne, 2008) and we use it to synchronize processes.

We elected to use a shared memory area (SHM) (Manpages, 2008) where we put the

semaphore. The second important consideration is that if no session daemon is available,

26

the user space tracer should wait passively in a separate thread, hence not altering the

execution behaviour of the application. A futex object (Drepper, 2011) was chosen.

A futex() system call provides a way for a program to wait passively on a value at

a given address. It can also use a method to wake anyone waiting on that value. This

mechanism is typically used to implement locking scheme in a shared memory area. Thus,

it provides a passive blocking call for the session daemon state variable and the contention

dealt by the kernel.

Overall, there are two critical concepts for the wait/wake scheme:

1. Persistent memory area with a state flag (using a semaphore)

2. Waiting has to be passive (no CPU usage)

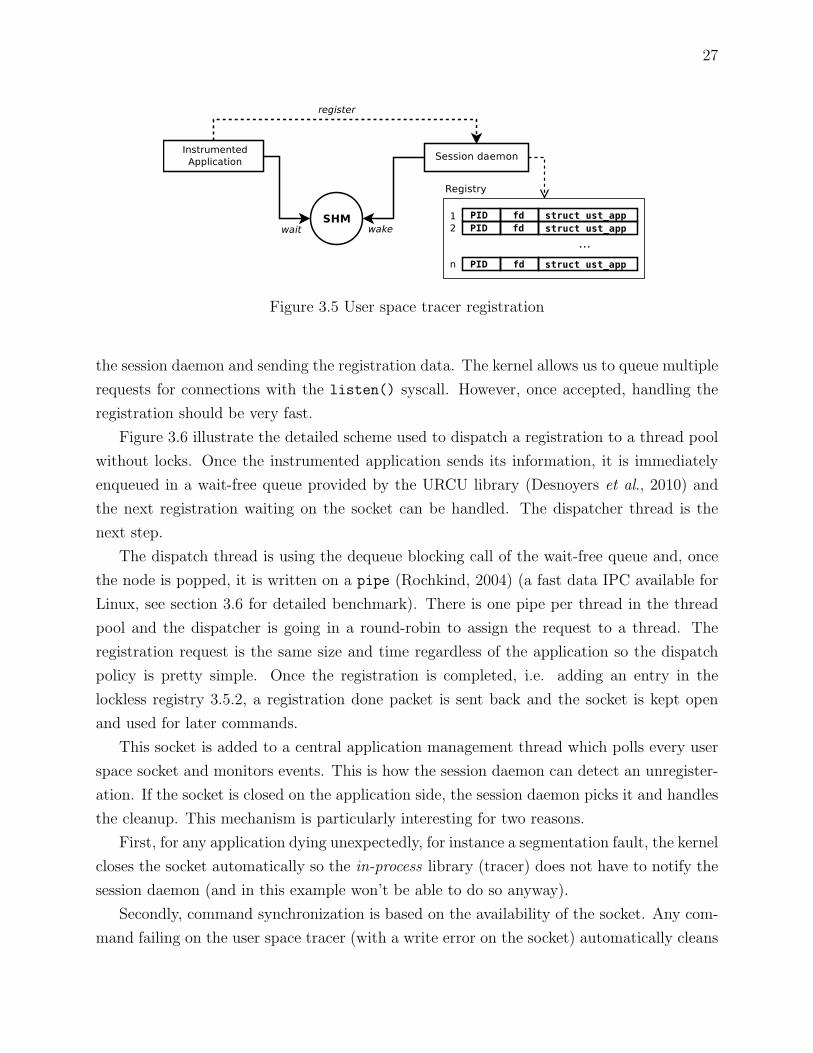
Figure 3.5 illustrates the data flow between the application and the tracer at this stage.

The SHM area is created either by the user space tracer or the session daemon, whoever

comes first, at a hardcoded path, and contains a futex object used to wake every process

waiting on it.

The user space tracer waits on the futex and the session daemon, once spawned and

ready for registration, notifies all waiting applications by atomically setting the state flag

and waking the futex (FUTEX WAKE).

After this notification, instrumented applications register to the session daemon. At any

point in time, if the session daemon dies, the same process is done all over again. The user

space tracer returns waiting on the global futex which is reset atomically by the session

daemon when quitting. If an application cannot connect to a daemon and the state of the

flag indicates to register, the application will reset it.

There is a potential race at the user space level when two applications try to create the

SHM area. The kernel ensures (Love, 2010) that only one shared memory segment is created

with the same path, so if one creation fails with an already exist error message, the user

space tracer retries immediately to wait on the futex.

This design is important because it avoids starvation on the tracer side by using futex

synchronization. The tracer is either waiting or registering. There is absolutely no window

where it could wait forever. It would be unacceptable for an instrumented application to

never register hence not be traceable. Moreover, this registration phase is only done once

and before the main() of the application is called. Little extra time is added to the program

execution 3.6.

Figure 3.5 shows that once the session daemon wakes the futex, all applications, which

can be numerous, immediately try to register by connecting to a socket (ust sock) created by

27

Figure 3.5 User space tracer registration

the session daemon and sending the registration data. The kernel allows us to queue multiple

requests for connections with the listen() syscall. However, once accepted, handling the

registration should be very fast.

Figure 3.6 illustrate the detailed scheme used to dispatch a registration to a thread pool

without locks. Once the instrumented application sends its information, it is immediately

enqueued in a wait-free queue provided by the URCU library (Desnoyers et al., 2010) and

the next registration waiting on the socket can be handled. The dispatcher thread is the

next step.

The dispatch thread is using the dequeue blocking call of the wait-free queue and, once

the node is popped, it is written on a pipe (Rochkind, 2004) (a fast data IPC available for

Linux, see section 3.6 for detailed benchmark). There is one pipe per thread in the thread

pool and the dispatcher is going in a round-robin to assign the request to a thread. The

registration request is the same size and time regardless of the application so the dispatch

policy is pretty simple. Once the registration is completed, i.e. adding an entry in the

lockless registry 3.5.2, a registration done packet is sent back and the socket is kept open

and used for later commands.

This socket is added to a central application management thread which polls every user

space socket and monitors events. This is how the session daemon can detect an unregister-

ation. If the socket is closed on the application side, the session daemon picks it and handles

the cleanup. This mechanism is particularly interesting for two reasons.

First, for any application dying unexpectedly, for instance a segmentation fault, the kernel

closes the socket automatically so the in-process library (tracer) does not have to notify the

session daemon (and in this example won’t be able to do so anyway).

Secondly, command synchronization is based on the availability of the socket. Any com-

mand failing on the user space tracer (with a write error on the socket) automatically cleans

28

Figure 3.6 Session lock with the lockless hash table issue

up the application session registry of newly created data structure protected by RCU mech-

anisms. It is however very important to close the socket on the session daemon side after

releasing application and registry data structure memory, or else an application could regis-

ter during that time, and the socket number be reused. This would create incoherent data

in the registry having a session assigned to the application but non existent in the tracer.

By monitoring this socket, we are able to remove synchronization primitives between the

user and the tracer since it is correct, by design, for the command to fail on the tracer side,

even if the data is coherent on the session daemon.

Tracing registry

The tracing registry stores tracing sessions and application information using lockless

data structures. Figure 3.7 is a representation of the registry tree for tracing session objects

3.5.1.

A tracing session contains two tracer types, the first level nodes of the registry hierarchy,

with the tracing session itself being the root node. Those nodes contain per domain channel

hash tables. For example, the UST PID domain is a hash table indexed by PID and each

bucket contains a hash table of channels. The UST and KERNEL domains are actually a single

29

structure containing a hash table of channels. Indeed, those domains are global and only

one element is possible.

Figure 3.7 Tracing registry

The main goal of this structure is to be efficient for lookups and insertions. Each user

command specifies at least a session name and a domain. Lookups for the session, a channel

and an event are all O(1). Thus, every client command is efficiently handled.

The insertion process is trivial, beginning with a lookup by key given by the user (Ex:

channel name), to see if the object already exists and adding it to the right hash table found

using the tracing session name and domain. The cost of adding an element is basically the

time to hash the key, see section 3.6 for performance results.

However, a special use case arises for the kernel tracer. Channels are allocated on a per

CPU basis, meaning that the number of data structures allocated is set to the number of

enabled CPUs. Linux supports CPU hotplug, the kernel then informs the session daemon

of added or removed CPUs, and the channel hash table has to be updated accordingly.

We currently use a per-session pthread mutex (Rochkind, 2004) to synchronize the channel

hash table between the thread handling client commands and the thread handling CPU

hotplug. As future work, the user space lockless notification mechanism developed during

this research, explained in section 3.5.2, will be implemented.

30

The tracing registry also keeps track of registered applications. With LTTng UST 2.0

tracer (Desnoyers, 2012), applications register at startup with the session daemon, trying to

connect to a socket and send information such as UID, GID, PID and library version used

to validate the compatibility of the tracer against the session daemon. That bidirectional

Unix socket (Linux, 2008) is kept open for future tracing commands requested by the user.

The transmitted information is stored in an application structure (See appendix A for

the code reference) which is kept in two lockless hash tables where one is indexed by PID

and the second one is indexed by socket file descriptor number. Upon registration, we get

the PID of the application and a new socket file descriptor value. An add unique operation

is done using the PID as key to insert the application into the registry. When an application

unregisters, the only notification we have is the socket application being closed. Therefore,

the session daemon needs to be able to find the application using two different informations,

PID and socket number. In a previous implementation, the second table simply mapped

from socket to PID, leading to a race when a process was removed between the access to the

socket to PID table and the access to the PID table, as shown in figure 3.8. The important

point is that every lookup to the registry has to be done in a single operation to avoid such

races in this lockless design.

Figure 3.8 Two lockless hash table node

This registration process is of prime importance, creating the user space tracer rendez-

vous point allowing the session daemon to provide features that the tracer itself cannot

provide. It allows the user to list what are the available applications to trace.

Furthermore, for user space tracing, events that measure and record bootstrap proce-

dures for an application are extremely common. With the tracing registry, all events are

31

first defined in the session daemon and then dispatched to the appropriate domain (tracer).

This enables preregistered channels/events for a session, before the application has started.

Since a tracing session is independent of the tracer lifetime, those pending events are auto-

matically enabled on the tracer when it becomes available (by registering).

Multiple tracing sources case

User-space tracing is more involved since, unlike the Kernel, we have multiple tracing

sources (applications). This brings different synchronization issues between client commands

and application commands. The typical scenario is:

1. Tracing is started

2. The enable-event command, when completed, assures the user that the data will be

recorded if the user space tracer hits the event.

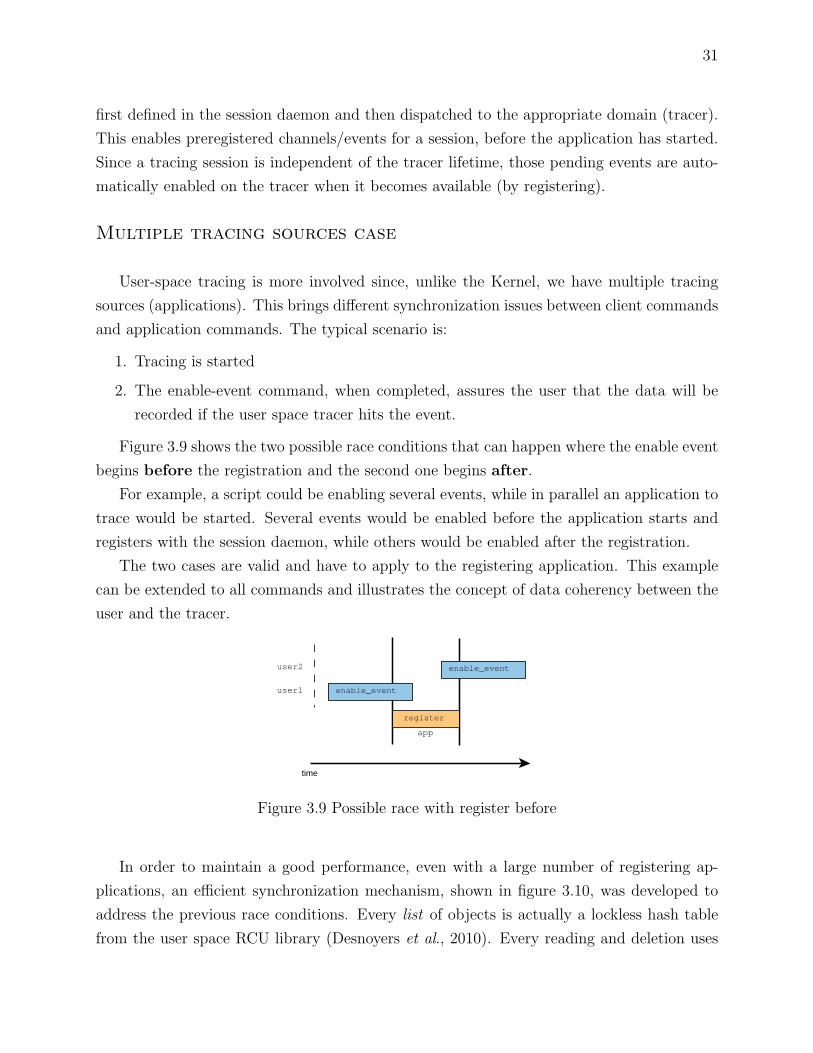
Figure 3.9 shows the two possible race conditions that can happen where the enable event

begins before the registration and the second one begins after.

For example, a script could be enabling several events, while in parallel an application to

trace would be started. Several events would be enabled before the application starts and

registers with the session daemon, while others would be enabled after the registration.

The two cases are valid and have to apply to the registering application. This example

can be extended to all commands and illustrates the concept of data coherency between the

user and the tracer.

user1

app

user2 enable_event

register

enable_event

time

Figure 3.9 Possible race with register before

In order to maintain a good performance, even with a large number of registering ap-

plications, an efficient synchronization mechanism, shown in figure 3.10, was developed to

address the previous race conditions. Every list of objects is actually a lockless hash table

from the user space RCU library (Desnoyers et al., 2010). Every reading and deletion uses

32

RCU (McKenney et Walpole, 2007), thus completely eliminating the use of locks for every

operation, as long as we have a single writer.

Figure 3.10 Lockless shadow-copy mechanism on application registration

When an application registers, it is quickly added to the registered application hash table.

It then triggers a shadow copy of all UST sessions of all tracing sessions (from the registry)

to its application session structure. The application session structure thereafter contains

all applicable sessions, channels and events for the application, which can then be activated

accordingly. The UST sessions thus represent user tracing commands, while the application

session represents the application tracing state.

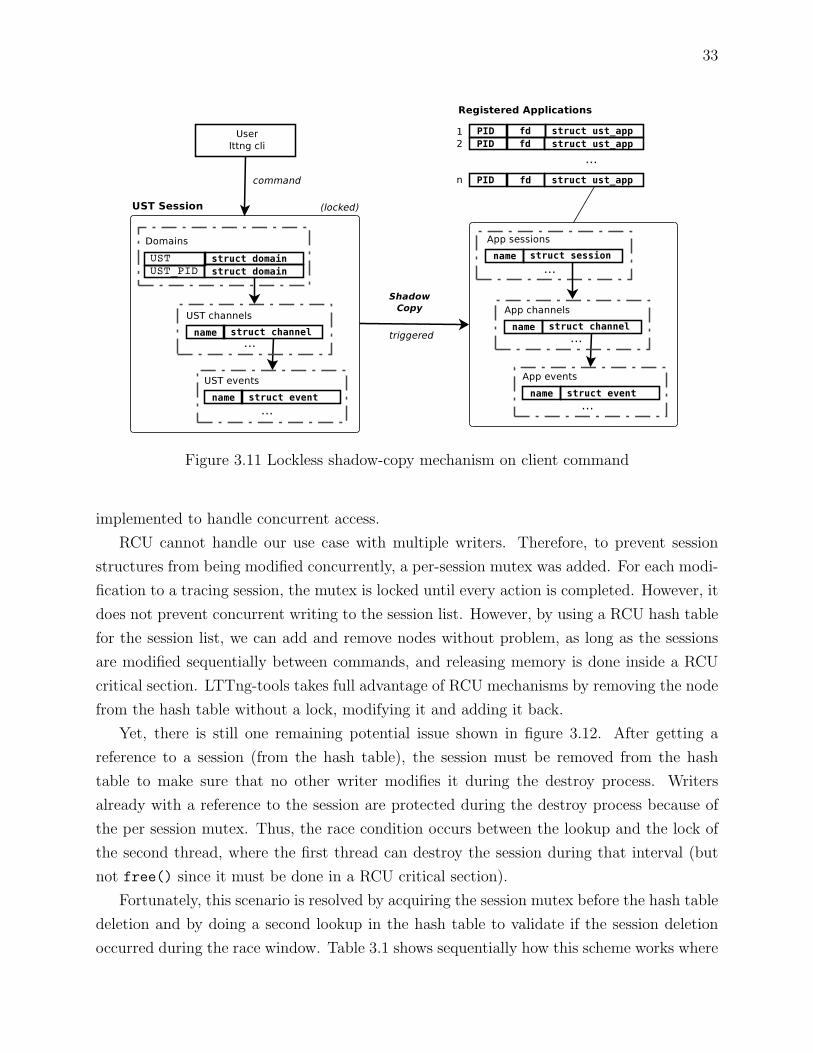
Figure 3.11 illustrate the concept of shadow copy on a user command. The UST session

reference is acquired, modifications are done on that session and the shadow copy is triggered

for each user space application session. An important point to understand is that every

addition, modification or deletion is first done onto the UST session and then applied to

the application session. Upon registration, the UST session hash table is used to trigger the

shadow copy.

The last element to examine is how to modify a tracing session in a multi-threaded

environment. Multiple users can modify the same session concurrently. Many concurrent

commands may be issued using lttng command line, modify the tracing session information

and trigger actions in application tracers. At this time, lttng-tools does not handle client

commands using a thread pool scheme, but its synchronization model was designed and

33

Figure 3.11 Lockless shadow-copy mechanism on client command

implemented to handle concurrent access.

RCU cannot handle our use case with multiple writers. Therefore, to prevent session

structures from being modified concurrently, a per-session mutex was added. For each modi-

fication to a tracing session, the mutex is locked until every action is completed. However, it

does not prevent concurrent writing to the session list. However, by using a RCU hash table

for the session list, we can add and remove nodes without problem, as long as the sessions

are modified sequentially between commands, and releasing memory is done inside a RCU

critical section. LTTng-tools takes full advantage of RCU mechanisms by removing the node

from the hash table without a lock, modifying it and adding it back.

Yet, there is still one remaining potential issue shown in figure 3.12. After getting a

reference to a session (from the hash table), the session must be removed from the hash

table to make sure that no other writer modifies it during the destroy process. Writers

already with a reference to the session are protected during the destroy process because of

the per session mutex. Thus, the race condition occurs between the lookup and the lock of

the second thread, where the first thread can destroy the session during that interval (but

not free() since it must be done in a RCU critical section).

Fortunately, this scenario is resolved by acquiring the session mutex before the hash table

deletion and by doing a second lookup in the hash table to validate if the session deletion

occurred during the race window. Table 3.1 shows sequentially how this scheme works where

34

Figure 3.12 Session lock with the lockless hash table issue

each column is a different thread doing modification and removal concurrently (th1 and th2

are from 3.12).

Table 3.1 Scheme to avoid race condition between look up and lock

Modify (th1) Removal (th2)

lookup()

lookup()

lock session()

ht del()

unlock session()

call rcu(free session)

lock session()

lookup()

session unavailable

There is also the possibility of using a simple deleted flag on the node and testing it

atomically instead of acquiring a mutex. However, it was implemented that way to take

advantage of the pthread mutex lock blocking call.

In summary, the tracing registry is the backbone of LTTng tracing, being a rendez-vous

point for all tracing components, thus ensuring data coherency between the user, the tracers

and the consumers.

35

3.6 Experimental results

This section presents the experimental results of all lttng-tools mechanisms. Section 3.6.1

shows the different benchmarks done, as of today, on the lttng-tools 2.0 stable version:

– User space tracer notification

– User space tracer registration

– Performance baseline

This section also includes performance results on studied Linux IPC. Those results are

the performance baseline of the implementation and a discussion follows on possible avenues

to improve this baseline.

Finally, section 3.6.2 compares our work to studied user space application synchronization

mechanisms presented in section 3.3.

3.6.1 Benchmarks

First, Table 3.2 describes the test setup hardware used for the benchmark. After that,

for each subsection, the methodology is explained first and results are presented in a table.

Every measurement was taken using the precise cpu cycle count before and after each

tested section. See appendix B to see how the cpu frequency is measured before running the

benchmarks. For the IPC section, the Linux command time is also used for comparison.

Linux IPC

As aforementioned, this study analyzed the different possible IPCs (Kay A. Robbins,

2003) of the Linux operating system in order to determine the fastest and most efficient for

Table 3.2 Test setup specification

CPU Intel Core i7 920 @ 2.67GHzRAM 6 GB

OS Linux ubuntu 10.04.4Kernel 3.2.0

Version lttng-tools 2.0-stableVersion lttng-ust 2.0-stable

Version libc6 2.11.1-0ubuntu7.8

36

our application.

Shared memory area is of course the fastest IPC between processes since, once initialized,

there is no system call to access the data. Nevertheless, this requires more synchronization,

often ending up using a system call to deal with contention.

Asynchronous bidirectional communication between threads and processes is crucial for

lttng-tools. For this reason, we experimented with pipes and sockets, testing outbound and

inbound data transmission. Tables 3.3 and 3.4 show the write and read average time for the

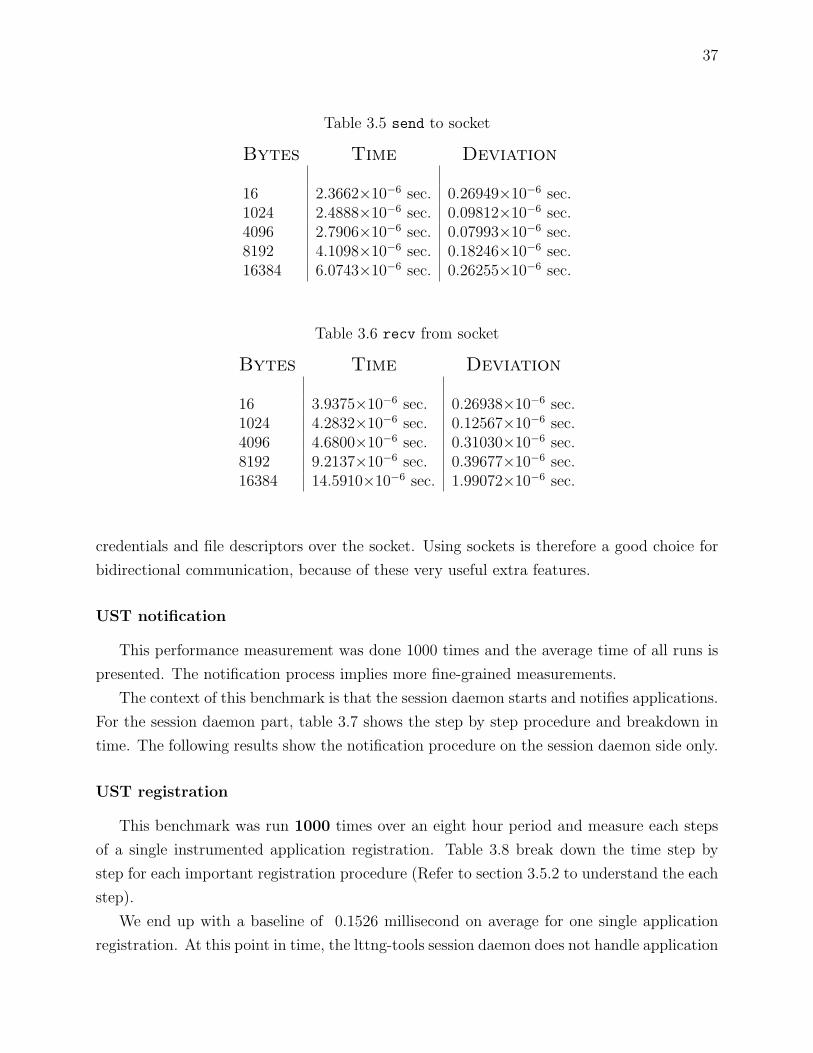
pipe IPC along with the standard deviation. Tables 3.5 and 3.6 present the send and recv

average time. The standard deviation is also available.

Benchmarks were run 1000 times for each with different message sizes ranging from very

few bytes (16) to four times the size of a Linux memory page of 4096 bytes. For each result,

the received data is validated against the sent data.

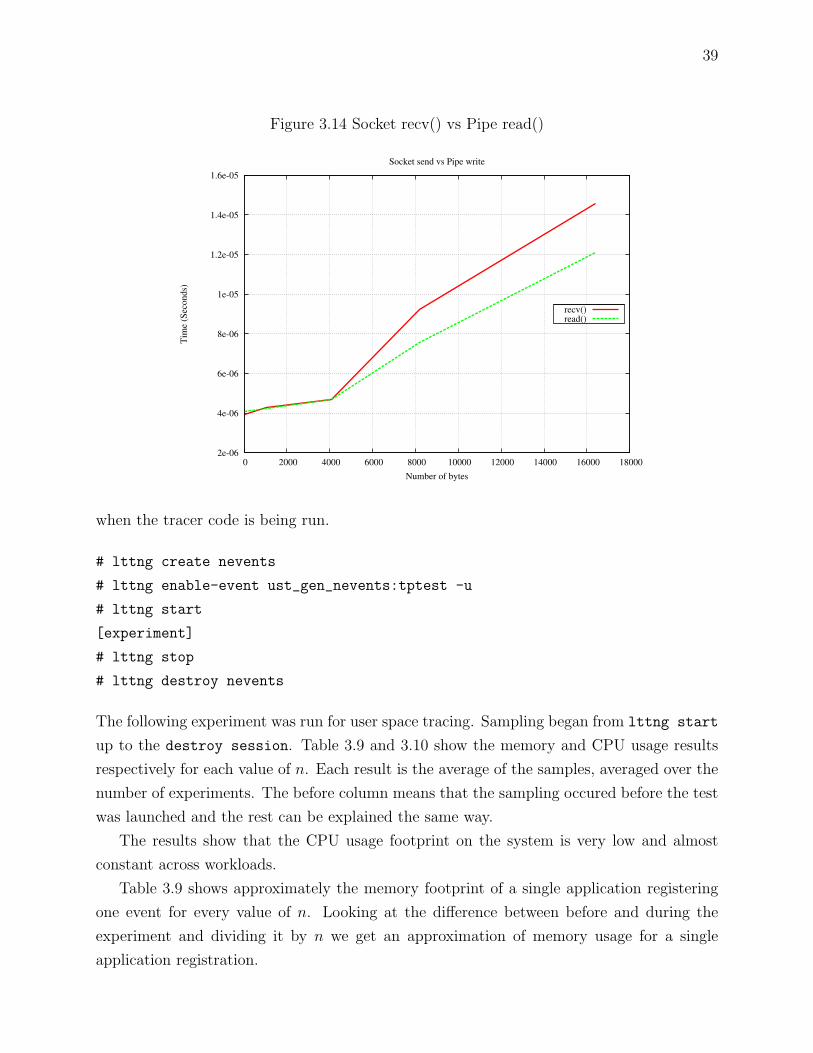
The overall difference between those two mechanisms are shown in figure 3.13 and 3.14.

Table 3.3 write to pipe

Bytes Time Deviation

16 3.3197×10⁻⁶ sec. 0.16344×10⁻⁶ sec.1024 3.4067×10⁻⁶ sec. 1.09235×10⁻⁶ sec.4096 3.4127×10⁻⁶ sec. 0.24667×10⁻⁶ sec.8192 3.9786×10⁻⁶ sec. 0.31152×10⁻⁶ sec.16384 5.5347×10⁻⁶ sec. 0.17899×10⁻⁶ sec.

Table 3.4 read from pipe

Bytes Time Deviation

16 4.1076×10⁻⁶ sec. 0.4876×10⁻⁶ sec.1024 4.2581×10⁻⁶ sec. 0.4925×10⁻⁶ sec.4096 4.6689×10⁻⁶ sec. 0.0858×10⁻⁶ sec.8192 7.5881×10⁻⁶ sec. 0.6682×10⁻⁶ sec.16384 12.1067×10⁻⁶ sec. 2.9066×10⁻⁶ sec.

The croocked line in figure 3.13 and 3.14 which occurs at 4096 and 8192 are page faults

triggered by the kernel hence creating a longer time to manage the data.

These results demonstrate the very thin difference between the two. In addition, Unix

sockets allow two key features that are used across the lttng-tools code base: passing process

37

Table 3.5 send to socket

Bytes Time Deviation

16 2.3662×10⁻⁶ sec. 0.26949×10⁻⁶ sec.1024 2.4888×10⁻⁶ sec. 0.09812×10⁻⁶ sec.4096 2.7906×10⁻⁶ sec. 0.07993×10⁻⁶ sec.8192 4.1098×10⁻⁶ sec. 0.18246×10⁻⁶ sec.16384 6.0743×10⁻⁶ sec. 0.26255×10⁻⁶ sec.

Table 3.6 recv from socket

Bytes Time Deviation

16 3.9375×10⁻⁶ sec. 0.26938×10⁻⁶ sec.1024 4.2832×10⁻⁶ sec. 0.12567×10⁻⁶ sec.4096 4.6800×10⁻⁶ sec. 0.31030×10⁻⁶ sec.8192 9.2137×10⁻⁶ sec. 0.39677×10⁻⁶ sec.16384 14.5910×10⁻⁶ sec. 1.99072×10⁻⁶ sec.

credentials and file descriptors over the socket. Using sockets is therefore a good choice for

bidirectional communication, because of these very useful extra features.

UST notification

This performance measurement was done 1000 times and the average time of all runs is

presented. The notification process implies more fine-grained measurements.

The context of this benchmark is that the session daemon starts and notifies applications.

For the session daemon part, table 3.7 shows the step by step procedure and breakdown in

time. The following results show the notification procedure on the session daemon side only.

UST registration

This benchmark was run 1000 times over an eight hour period and measure each steps

of a single instrumented application registration. Table 3.8 break down the time step by

step for each important registration procedure (Refer to section 3.5.2 to understand the each

step).

We end up with a baseline of 0.1526 millisecond on average for one single application

registration. At this point in time, the lttng-tools session daemon does not handle application

38

Figure 3.13 Socket send() vs Pipe write()

2e-06

2.5e-06

3e-06

3.5e-06

4e-06

4.5e-06

5e-06

5.5e-06

6e-06

6.5e-06

0 2000 4000 6000 8000 10000 12000 14000 16000 18000

Tim

e (S

econds)

Number of bytes

Socket send vs Pipe write

send()write()

registration using a thread pool. However, since lockless data structures are used to add the

application to the registry, the increase in time, for a thread pool design, should only appear

at step 3 where the dispatcher thread would have to choose an idle worker thread.

Note step 3 which is two times faster than the measured read() for a pipe in section

3.6.1. This is due to kernel page caching. The same test was run but dropping caches just

before the read operation. The values are then very close to the section 3.6.1 measurements.

Step 5 is a back and forth communication with the application, since a REGISTER DONE

acknowledgement is sent back by the application.

Performance baseline

To get a performance baseline, we have created an experiment which runs n instrumented

processes concurrently and enable tracing on each of them. This experiment was run 1000

times for each n value.

We have measured the memory consumption before, during and after the experiment by

sampling at a regular rate. CPU usage was also sampled.

For memory measurements, the real memory usage was sampled every 0.2 seconds us-

ing values in /proc/PID/status (VmRSS value). For CPU usage, the tool top was used,

configured to sample a single PID.

The experiment is setup with the following lttng commands. The line [experiment] is

39

Figure 3.14 Socket recv() vs Pipe read()

2e-06

4e-06

6e-06

8e-06

1e-05

1.2e-05

1.4e-05

1.6e-05

0 2000 4000 6000 8000 10000 12000 14000 16000 18000

Tim

e (S

eco

nds)

Number of bytes

Socket send vs Pipe write

recv()read()

when the tracer code is being run.

# lttng create nevents

# lttng enable-event ust_gen_nevents:tptest -u

# lttng start

[experiment]

# lttng stop

# lttng destroy nevents

The following experiment was run for user space tracing. Sampling began from lttng start

up to the destroy session. Table 3.9 and 3.10 show the memory and CPU usage results

respectively for each value of n. Each result is the average of the samples, averaged over the

number of experiments. The before column means that the sampling occured before the test

was launched and the rest can be explained the same way.

The results show that the CPU usage footprint on the system is very low and almost

constant across workloads.

Table 3.9 shows approximately the memory footprint of a single application registering

one event for every value of n. Looking at the difference between before and during the

experiment and dividing it by n we get an approximation of memory usage for a single

application registration.

40

Table 3.7 UST notification time breakdown

Step Time

1 Memory mapping for the shared page 4.3458×10⁻⁶ sec.2 Setting read-only permissions 4.6256×10⁻⁶ sec.3 Open shm and truncate it to fit a memory page 9.6669×10⁻⁶ sec.4 Futex wake call 4.9137×10⁻⁶ sec.

Total 23.552×10⁻⁶ sec.

Table 3.8 UST registration time breakdown

Step Time

1 Receiving and enqueue data 36.394×10⁻⁶ sec.2 Dequeue and write to pipe 11.564×10⁻⁶ sec.3 Read from pipe 2.6511×10⁻⁶ sec.4 Add app to registry 32.535×10⁻⁶ sec.5 Send register done 69.441×10⁻⁶ sec.

Total 152.58×10⁻⁶ sec.

(1475− 1192)/n = 283 kB (3.1)

(8255− 1192)/n = 70.63 kB (3.2)

(59936− 1192)/n = 58.744 kB (3.3)

We end up with a memory footprint of less than 58 kilobytes per registered application

since n = 1 shows the amount of memory needed for data structures handling application

registration. Since the process event was enabled by the user, a shadow copy was triggered,

increasing the memory usage. Also, channel streams are on a per CPU basis and contain a

trace directory path of 4096 bytes. More cores, more memory.

3.6.2 Comparison

This section takes a look at the dispatching mechanism performance. Section 3.6.1 shows

the time it takes, once an application has established a connection, to dispatch and handle

41

Table 3.9 Memory usage of lttng-sessiond (size kB)

Before During Afterprocesses (n = 1 1196 1477 1210processes (n = 100) 1192 8255 1240processes (n = 1000) 1192 59936 4010

Table 3.10 CPU usage of lttng-sessiond (% System CPU time)

Before During Afterprocesses (n = 1) 0.50 0.50 0.50processes (n = 100) 0.50 0.50 0.50processes (n = 1000) 0.50 0.58 0.60

the application registration.

Our case study was Apache 2.2 (Fielding et Kaiser, 1997). With the following results,

we can confirm that our solution indeed works very efficiently. Indeed, our proposed im-

plementation was even used to pinpoint possible issues with the dispatching mechanism of

Apache.

Apache 2.2

As mentioned in section 3.3.2, Apache relies on the kernel to resolve contention on a global

mutex lock shared between threads. The dispatching time was measured using LTTng kernel

tracing, since we cannot measure this in user space. The pthread mutex implementation of

libc uses the futex syscall to manage multiple threads locking a mutex or contention. By

monitoring this system call, we can measure the contention time imposed by the kernel on

multiprocessor machines and have a good estimation of the time it takes to assign a task to

an Apache worker thread.

We first installed Apache on a Ubuntu 11.04 server and created a dummy web page. Here

is the setup experiment.

1. Kernel tracing

The following commands enable syscall tracing and add to each event the PID, process

name and TID so we can recognize the apache2 processes.

# lttng create apache

# lttng enable-event -a -k --syscalls

# lttng add-context -k -t pid -t procname -t tid -c channel0

42

# lttng start

[...]

2. Multiple client HTTP request

We used a script to make 10 requests simultaneously. Appendix C shows the small

simple script used.

Looking at the tracing results, we have to make sure that the futex system call measured

is the correct one. For a mutex lock to return, the contention is resolved when a thread does

an unlock. Here is an example of a futex call taken, from the trace to understand what is

happening.

[...]

[13:35:28.093556882] (+0.000003038) sys_futex: { 2 }, { 6821, "apache2",

6792 }, { uaddr = 0x7FEF5EB31D10, op = 129, val = 1, utime = 0x1, uaddr2 =

0x7FEF5EB31D60, val3 = 67108865 }

[13:35:28.093568000] (+0.000011118) exit_syscall: { 2 }, { 6816, "apache2",

6792 }, { ret = 0 }

[...]

Here we have a sys futex syscall made on the first line for PID 6821 with parent being

6792 (our main dispatch thread of Apache). The op value indicates that this call is actually

doing a FUTEX WAKE. Thus, some previous thread unlocked the mutex and now the kernel is

dealing with contention for the other threads trying to lock the mutex.

The C library does actually more futex syscalls to handle this situation, increasing

the total time significantly. However, we just want to compare the unlock/contention/lock

mechanism.

The second line indicates the end of the futex syscall, which is immediately after. It

shows that the exiting PID is 6816. This thread is then in control of the mutex lock critical

section. We can also confirm that we are in fact dealing with a request being served and

dispatched by looking at the following syscalls issued by Apache: sys gettimeofday and

sys getsockname. The CPU number is displayed just after the system call name (Ex: {2}).

[13:35:28.093579552] (+0.000008049) sys_gettimeofday: { 2 }, { 6816,

"apache2", 6792 }, { tv = 0x7FEF4EB43CD0, tz = 0x0 }

[13:35:28.093580797] (+0.000001245) exit_syscall: { 2 }, { 6816, "apache2",

6792 }, { ret = 0 }

[13:35:28.093584705] (+0.000003908) sys_getsockname: { 2 }, { 6816,

"apache2", 6792 }, { fd = 10, usockaddr = 0x7FEF5EB6F3F0,

43

usockaddr_len = 0x7FEF5EB6F3D0 }

[13:35:28.093587079] (+0.000002374) exit_syscall: { 2 }, { 6816, "apache2",

6792 }, { ret = 0 }

After identifying the dispatch pattern in the trace, the offset between the beginning of the

futex call and the exit (just after the timestamps in the parentheses) can be measured. Table

3.11 shows four requests, providing a good approximation of the dispatch time in seconds.

Table 3.11 Apache dispatch request time

Req 1 Req 2 Req 3 Req 4

Time 11.118×10⁻⁶ 14.257×10⁻⁶ 16.578×10⁻⁶ 13.044×10⁻⁶

Those requests are lucky ones since they were all handled by the same CPU, hence

with pretty good performance results. This is even better than our dispatch mechanism,

calculated with the sum of line 1 and 2 in table 3.8, ( 0.0004 sec.) including the recv()

system call.

However, letting the kernel handle contention in a multithreaded environment can be

costly. Indeed, it is possible for one thread on a CPU to unlock and another thread on an

another CPU to lock. This causes a serious performance penalty to get the CPU caches

coherent between the two CPUs. From the same trace, here is an example of the time

penalty when bouncing between CPUs.

[14:35:49.744430680] (+0.000002175) sys_futex: { 2 }, { 6803, "apache2",

6792 }, { uaddr = 0x7FEF5EB31D64, op = 129, val = 389, utime = 0x0,

uaddr2 = 0x0, val3 = 182 }

[14:35:50.615251899] (+0.870821219) exit_syscall: { 3 }, { 6787, "apache2",

6787 }, { ret = 0 }

The migration between processors costs 0.87 seconds for the futex wake call. This result

was confirmed by the sched switch event being traced at the same time (here removed for

brevity) and shows the CPU migration for the correct process.

It is important to understand that, even though this can happen, the Linux scheduler is

optimized to avoid theses situations. Nonetheless, dealing with contention in user space can

help circumvent this.

44

3.6.3 Discussion

The proposed tracing architecture, implemented in lttng-tools, is the first published

working infrastructure that unifies tracing for user and kernel space under one component

not being a kernel module. The ability to trace entirely in user-space gives to this approach

a significant speed advantage.

One of the most widespread tool used to debug development code and production use

cases is strace which takes advantage of the ptrace functionality. However, this comes at

an important performance cost. With the previous performance results, we hope to provide

equivalent functionality to strace at almost no performance cost, cutting the performance

trade-off associated with tracing and improving the applicability of tracing to production

usage.

3.7 Conclusion

We have presented the lttng-tools project which implements the synchronization mech-

anisms proposed for handling large scale tracing with multiple sources. There are three

important processes explained which are the fast and efficient dispatching mechanism for

application registration, the user space tracer notification, used to notify waiting applica-

tions to register to the session daemon, and the tracing registry data structure interactions.

Our proposed dispatching system resulted in good performance when dealing with a

large number of registering applications and can easily be extended and used by programs

dispatching a large number of requests to a thread pool. The use of lockless data structures

came with synchronization challenges and largely drove the design and development of the

tracing registry.

We are confident that the synchronization and lockless algorithms presented in this paper

can be extended to a large set of use cases, from load balancer system to telecommunication

workloads, where large number of requests are dispatched.

This study brought to life one of the core system of the LTTng 2.0 toolchain and provided

a new set of features for Linux tracing. Efforts were spent for bringing better usability to

users and to system administrators in large in data centres.

45

CHAPTER 4

GENERAL DISCUSSION

This chapter focuses on complementary work done during this research on the lttng-tools

project and user space tracing.

Section 4.3 presents the work done on performance measurements of the lttng user space

tracer 0.x and how the scalability was improved significantly. There improvements formed

an important portion of the improvements leading to version 2.0.

4.1 Thread pooling

As a reminder, thread pools are a set of worker threads where all resources are allocated

preemptively and used during the program lifetime to help serve efficiently large number of

requests. The registration process and client commands management can be handled with

a thread pool. The current lttng-tools implementation does not currently use this.

However, here are some important considerations to take into account in order to achieve

thread pooling for managing registration and client commands.

For the registration, the application registry has to be protected against multiple writers

since RCU cannot guarantee coherency through multiple writes. Insertion has to be in a

critical section. Since this registry was designed using a lockless hash table, the insertion

cost of one application is basically O(1). Moving to a multithreaded registration scheme

would likely speed up the process, since insertion is only a fraction of the total cost the

thread would have to pay which is O(n) where n is the number of threads.

Secondly, threading client commands is non trivial. The model proposed is based on the

fact that the tracing session is only modified through one vector (the client) and is protected

by a mutex against modifications, for instance two racing user commands modifying a given

session. Creating a thread pool here makes sense to speed up the process so the session

daemon could handle more user commands concurrently.

A more fine-grained locking, i.e. using locks on channels and events instead of the whole

tracing session, can be a solution to increase the performance of multiple users modifying the

same session. The most important aspect of our synchronization model is that the session is

only modified by the user. While still satisfying this condition, better locking could be used

46

to limit contention on tracing objects.

There is also the question of how many threads are needed to get the best efficiency out

of our two use cases. One known optimization would be to use one thread per CPU, making

sure each thread is not bounced between cores. However, this solution is limited by what the

thread does exactly. We use asynchronous blocking IPC (sockets) to communicate, which

creates a problem if the thread not only waits for the incoming data but also sends back

information. Delays can incur large wait periods on either the incoming or outgoing data.

Using a per CPU thread, this can block the CPU. The dispatcher can starve quickly not

being able to find a thread to assign the request due to I/O delay.

For the client command manager, a thread pool on a per CPU basis is less than ideal for

the aforementioned reason. The same applies for the application registration thread, since

it has to reply on the application to notify the completion of the registration.

This is why the Apache project uses a default value of 25 threads per listener process,

since it relies heavily on network I/O and starvation has to be avoided.

4.2 Network streaming

Network streaming is another aspect considered but not covered throughout this research.

We briefly discussed the challenges and basic design work done recently to support trace

network streaming.

Communication over the network becomes inevitable when the client and the session

daemon have to be able to send and receive actions between the host and target systems.

A network consumer is thus needed to handle the reception of data (streaming) and make

sure it is written to disk in the correct order as well. Network transport layer can offer such

guarantee (ordering) but at the cost of performance (TCP vs UDP).

When communicating between systems, authentication is an additional security require-

ment. When tracing on a local machine, user credentials validate if the user is allowed to

talk to the session daemon or trace an application. On a remote machine, some kind of

authentication mechanism is needed to avoid unauthorized remote users controlling tracing.

Here are the factors we need to consider for network communication.

– Transport layer (Ex: TCP, UDP)

– Integrity

– Authentication

– Data protection

Extending those new constraints to the current model, synchronization has to be designed

in order to guarantee data integrity (trace data received during streaming) and interaction

47

between remote sessions (remote user versus local user). Moreover, the data and control

paths should be separated such that one bad command does not cause the streaming trace

to stop or break down.

The transport layer could change, hence providing packet ordering on reception is needed.

Thus, an extra protocol is needed on top of tracing data to provide minimal information to

the remote consumer on the ordering scheme and the associated session information.

The authentication part is a more technical aspect but that can be fulfilled using the

SSH protocol (Ylonen et al., 2006), providing an encrypted tunnel for the control path and

authentication on the remote machine.

As for data protection, this question has not been studied and is mentioned as future

work in section 5.3.

4.3 UST 0.x scalability

Interesting work was performed to improve the scalability of the user space tracer 0.x

made by Pierre-Marc Fournier (Fournier et al., 2009). First, the tracer performance was

measured to get a baseline for an event hit by the application and its overall impact. The

following results and tests were made on version 0.11 and used the same setup as describe

in section 3.6.

This tracer had three different tracing mechanisms to record data which are:

– trace mark (using marker technology (Corbet, 2007))

– trace mark tp (using a marker inside a tracepoint)

– ltt specialized trace (tracepoint with custom probe)

The performance tests consisted of running 1000 times a simple single threaded program

recording 5 million events for each tracing mechanism. The CPU cycle counter was sampled

at the beginning and end of the event loop using the rdtsc (Intel, 2010). The time was

recorded and the test was rerun again for 1000 iterations. The average was computed,

providing the baseline time of an event.

At that point, running the same test again but without tracepoints gave us the normal

execution time of the loop. The difference between them, divided by the number of events,

got us the results found in table 4.1. Those results were presented at LinuxCon North

America in 2010 1.

1. https://events.linuxfoundation.org/events/linuxcon

48

Mechanism Time

Trace mark 247 ns / per eventTracepoint marker 271 ns / per eventCustom probe 189 ns / per event

Table 4.1 UST 0.x benchmark

The user space tracer 0.x was designed to be scalable across CPUs using per CPU buffers.

However, running those tests concurrently, generated a disappointing scaleup, 3 to 4 times

the single threaded time per event.

Thus, we profiled the entire tracer to understand the problem. We investigated and

discovered a large number of L1 and L2 cache misses where the tracepoint information was

accessed (marker probe cb). Using oprofile 2, we were able to isolate the above issues.

The following is taken from an experiment run 100 times which ran 8 threads, each

generating 50 million events.

<L2_RQSTS, L1D_CACHE_LD, DTLB_LOAD_MISSES, CPU_CLK_UNHALTED>

marker_probe_cb : [’97.15989’, ’93.84391’, ’76.53719’, ’77.41132’]

We see here that the marker probe cb function is responsible for 93.84% L1 cache misses.

It is the primary function to access tracepoint information.

Our tracepoint data structure gets in the CPU cache for any tracing related action on

that processor. However, if the data is smaller than the cache line size (CPU specific), other

objects can share the same line which can be accessed by other CPUs, hence creating false

sharing. This may cause a back and forth cache line exchange between CPUs, which is very

costly. This behaviour is known as cache line bouncing.

Even having per CPU buffers, and using TLS (Tread Local Storage) variables, sharing

data between CPUs on a single misaligned cache line causes severe scalability issues. Knowing

what data structure was bounced between CPUs, we added this simple patch to the code to

align those structures to a cache line.

#define CAA_CACHE_LINE_SIZE 128 /* Defined in the Intel manual */

#define ____cacheline_aligned __attribute__((aligned(CAA_CACHE_LINE_SIZE)))

The trace became fully scalable on SMP systems meaning that we had the same event

time shown above using 8 threads on an 8 core machines.

2. http://oprofile.sourceforge.net

49

CHAPTER 5

CONCLUSION

This chapter presents the conclusion of this research. The proposed tracing architecture

and the lttng-tools project are first summarized. Then, some limitations of the current

implementation are presented. Finally, we discuss possible improvements as future work.

5.1 Summary of the work

This main accomplishment presented here is the unified tracing architecture, combining

user and kernel space control, and enabling the implementation of the lttng-tools project.

It provides a command line user interface, a tracing control library, user and kernel tracing

consumers and, the pivotal part of this architecture, the session daemon.

We have presented a tracing registry and algorithms that provide lockless interactions.

This registry enables tracing sessions and aggregates user and kernel tracer information

under one umbrella. Moreover, this registry is extended to registering applications, allowing

user space tracing to record early event(s) during the bootstrap process, and trace events

to be pre-enabled before the program lifetime. With registration, users are also able to list

available traceable applications.

The notification process of waiting applications is also an important realization. Using a

shared semaphore (implemented with futex and SHM), we were able to address race condi-

tions on registration and insure that no starvation occurs on the application side (user space

tracer). This scheme also enables applications to register in any state of the runtime, i.e.

the program continues to work even if the session daemon is not available or is restarting.

Finally, we proposed a fast dispatch mechanism to handle application registration which

can possibly be extended to thread pooling and larger workloads. We have shown that the

CPU usage on the system is quite low during that process. This design takes advantage of

multi-processor systems by creating three different processes to optimize the request dispatch

and avoid wait periods on Linux IPC or I/O.

50

5.2 Limitations

Since the model allows to enable events on non registered applications, when the tracer

registers, all tracing sessions are checked for pending events and enabled on the tracer side if

it applies. This process takes the lock on the global session list to stop any modification and

iterate. Assuming a large number of applications registering at the same time, this causes

an important latency on the client side, since the global list is locked. Consequently, if the

client request is very long, it will penalize every application.

The per session mutex is definitely a bottleneck to performance. Fine-grained locking

could be done to address such problem. This would require precise measurements and

synchronization checks.

The proposed model was not validated on other user space domains such as per PID

events. The problem with this domain is that a PID can be reused for two different appli-

cations. If the tracing session has multiple events and channels enabled for a specific PID,

if the application dies it is detected and the shadow copy is cleaned up. However, on a per

PID basis, we would also need to clean the tracing session which only the client side can do

securely in the current synchronization model.

5.3 Future work

As short term future work, one possible improvement would be to implement a thread

pool design, for both application registration and user commands management, and validate

its scalability.

The previous issues on per PID tracing is a more complex problem with the current

scheme. Nonetheless, it would be very useful to allow LTTng to behave like strace.

The data protection issues are also important. There are mostly two ways to approach

this problem. Either the transport layer is the secure channel or, upon extraction, the data

itself is encrypted.

Furthermore, network streaming and remote control is still to be investigated. This

would require to at least add one thread in the architecture, which will potentially bring

synchronization issues and an in-depth review of the underlying algorithms.

51

LIST OF REFERENCES

ABRAHAM SILBERSCHATZ, P. B. G. et GAGNE, G. (2008). Operating System Concepts

(8th ed.). John Wiley & Sons. Inc.

APPAVOO, J., WISNIEWSKI, R. W. et XENIDIS, J. (2002). K42’s performance monitor-

ing and tracing infrastructure. IBM Research.

BLIGH, M., DESNOYERS, M. et SCHULTZ, R. (2007). Linux kernel debugging on google-

sized clusters. Proceedings of the Linux Symposium.

CANTRILL, B. M., SHAPIRO, M. W. et LEVENTHAL, A. H. (2004). Dynamic instru-

mentation of production systems. USENIX.

CORBET, J. (2007). Kernel markers. Linux Weekly News.

DEROSE, L., JR., T. H. et HOLLINGSWORTH, J. K. (2001). The dynamic probe class

library - an infrastructure for developing instrumentation for performance tools. Parallel

and Distributed Processing Symposium., Proceedings 15th International.

DESNOYERS, M. (2009). Low-Impact Operating System Tracing. These de doctorat, Ecole

Polytechnique de Montreal.

DESNOYERS, M. (2012). Man page lttng-ust.3. Efficios Inc.

DESNOYERS, M. et DAGENAIS, M. (2006). The lttng tracer : A low impact performance

and behavior monitor for gnu/linux. Ottawa Linux Symposium.

DESNOYERS, M., MCKENNEY, P. E., STERN, A. S., DAGENAIS, M. R. et WALPOLE,

J. (2010). User-level implementations of read-copy update. IEEE Transaction on Parallel

and Distributed Systems.

DON DOMINGO, W. C. (2010). SystemTap Beginners Guide - Introduction to SystemTap.

RedHat.

DREPPER, U. (2011). Futexes are tricky. Red Hat Inc.

FIELDING, R. et KAISER, G. (1997). The apache http server project. Internet Computing,

IEEE, 1, Issue 4.

FITZPATRICK, B. (2004). Distributed caching with memcached. Linux Journal,

2004, Issue 124.

FOURNIER, P.-M., DESNOYERS, M. et DAGENAIS, M. R. (2009). Combined tracing of

the kernel and applications with lttng. Linux Symposium, Ottawa.

GOULET, D. (2012). lttng.1. Efficios Inc.

52

GREGG, B. et MAURO, J. (2011). DTrace : Dynamic Tracing in Oracle Solaris, Mac OS

X and FreeBSD. Prentice Hall.

HOLLINGSWORTH, J. K., MILLER, B. P. et CARGILLE, J. (1994). Dynamic program

instrumentation for scalable performance tools. Scalable High Performance Computing

Conference.

INTEL (2010). Intel 64 and IA-32 Architectures Software Developer Manuals.

KAY A. ROBBINS, S. R. (2003). Unix Systems Programming Communication Concurrency

And Threads. Prentice Hall.

KEW, N. (2007). Apache Modules Book, The Application Development with Apache. Pren-

tice Hall.

LINUX (2008). Man page unix.7. Linux.

LOVE, R. (2010). Linux Kernel Development, 3rd Edition. Addison-Wesley, troisieme

edition.

MANPAGES (2008). Man page shm overview.7. Linux man-pages project.

MCKENNEY, P. E. et WALPOLE, J. (2007). What is rcu, fundamentally ? Linux Weekly

News, http ://lwn.net/Articles/262464/.

PASE, D. M. (1998). Dynamic Probe Class Library (DPCL) : Tutorial and Reference Guide.

IBM Corp.

PETROVIC, J. (2008). Using memcached for data distribution in industrial environment.

Systems, 2008. ICONS 08. Third International Conference on Systems.

PRASAD, V., COHEN, W. et EIGLER, F. C. (2005). Locating system problems using

dynamic instrumentation. Proceedings of the Ottawa Linux Symposium.

ROCHKIND, M. J. (2004). Advanced UNIX Programming, 2nd Edition. Addison-Wesley.

WIKIPEDIA (2011). Pulseaudio. referal from http ://pulseaudio.org.

YAGHMOUR, K. et DAGENAIS, M. R. (2000). The linux trace toolkit. Linux Journal.

YLONEN, T., CORP, S. C. S., LONVICK, C. et INC., C. S. (2006). RFC 4251 : The

Secure Shell (SSH) Protocol Architecture.

53

APPENDIX A

LTTng-Tools session code snippet

Tracing session code

Listing A.1 lttng-sessiond/session.h

1 /*

2 * This data s t r u c tu r e conta in s in fo rmat ion needed to i d e n t i f y a t r a c i ng

3 * s e s s i o n f o r both LTTng and UST.

4 */

5 struct l t t s e s s i o n {6 char name [NAMEMAX] ;

7 char path [PATHMAX] ;

8 struct l t t k e r n e l s e s s i o n * k e r n e l s e s s i o n ;

9 struct l t t u s t s e s s i o n * u s t s e s s i o n ;

10 /*

11 * Protect any read/wr i t e on t h i s s e s s i o n data s t r u c tu r e . This l o ck

12 * must be acqu i red * be f o r e * us ing any pub l i c f unc t i on s dec l a r ed

13 * below . Use s e s s i o n l o c k ( ) and s e s s i o n un l o c k ( ) f o r that .

14 */

15 pthread mutex t l ock ;

16 struct c d s l i s t h e a d l i s t ;

17 int enabled ; /* enabled / s t a r t ed f l a g */

18 int id ; /* s e s s i o n unique i d e n t i f i e r */

19 /* UID/GID of the user owning the s e s s i o n */

20 u id t uid ;

21 g i d t g id ;

22 } ;

54

UST application code

Listing A.2 lttng-sessiond/ust-app.h

1 /*

2 * Reg i s t e r ed t r a c e ab l e app l i c a t i o n s . Libust r e g i s t e r s to the

3 * s e s s i o n daemon .

4 */

5 struct ust app {6 p id t ppid ;

7 u id t uid ; /* User ID that owns the apps */

8 g i d t g id ; /* Group ID that owns the apps */

9 int b i t s p e r l o n g ;

10 int compatible ; /* I f the l t tng−ust t r a c e r v e r s i on does not match the

11 supported ve r s i on o f the s e s s i o n daemon , t h i s f l a g i s

12 s e t to 0 (NOT compatible ) e l s e 1 . */

13 struct l t t n g u s t t r a c e r v e r s i o n ve r s i on ;

14 u in t 32 t v major ; /* Verion major number */

15 u in t 32 t v minor ; /* Verion minor number */

16 char name [ 1 7 ] ; /* Process name ( shor t ) */

17 struct l t t n g h t * s e s s i o n s ;

18 struct l t t ng h t node u l ong pid node ;

19 struct l t t ng h t node u l ong sock node ;

20 } ;

55

APPENDIX B

CPU frequency acquisition code

CPU frequency sampling code

Listing B.1 benchmark/benchmark.c

1 c y c l e s t g e t c y c l e s (void )

2 {3 /*

4 * URCU macro us ing the cpu cy c l e counter :

5 * #de f i n e r d t s c l l ( va l ) \6 * do { \7 * unsigned i n t a , d ; \8 * asm v o l a t i l e (” rd t s c ” : ”=a” ( a ) , ”=d” ( d ) ) ; \9 * ( va l ) = ( ( unsigned long long ) a ) \

10 * | ( ( ( unsigned long long ) d ) << 32 ) ; \11 * } whi le (0 )

12 */

13 return c a a g e t c y c l e s ( ) ;

14 }15

16 u in t 64 t g e t cpu f r e q (void )

17 {18 struct t imezone tz ;

19 struct t imeva l tv s ta r t , tvstop ;

20 c y c l e s t c be f o r e , c a f t e r ;

21 unsigned long microseconds ;

22

23 memset(&tz , 0 , s izeof ( tz ) ) ;

24

25 gett imeofday(&tvs ta r t , &tz ) ;

26 c b e f o r e = g e t c y c l e s ( ) ;

27 gett imeofday(&tvs ta r t , &tz ) ;

28

29 s l e e p ( 1 ) ;

30

31 gett imeofday(&tvstop , &tz ) ;

56

32 c a f t e r = g e t c y c l e s ( ) ;

33 gett imeofday(&tvstop , &tz ) ;

34

35 microseconds = ( ( tvstop . t v s e c − t v s t a r t . t v s e c ) * 1000000) +

36 ( tvstop . tv us e c − t v s t a r t . t v u s e c ) ;

37

38 return ( u i n t 64 t ) ( ( c a f t e r − c b e f o r e ) / microseconds ) ;

39 }

57

APPENDIX C

Apache tests

Apache test script

for i in ‘seq 1 10‘; do

wget -o /dev/null -b http://OUR_SERVER/index.html -O /dev/null;

done

58

APPENDIX D

Command line interface

Command line interface

During the design and architectural phases of LTTng 2.0, the usability was one of the

motivation behind the new version. Mainly, the 2.0 version had to unify the user space tracer

and kernel tracer (and possibly more in the future) under one control tool. This is why the

concept of event, explain in section 3.5.1, was introduced along with domains.

With the LTTng 0.x version (both kernel and user space tracer), there was two distinct

programs used to control those tracers which are respectively lttctl, part of the ltt-control

project, and ustctl integrated in the UST project (Fournier et al., 2009). Now, the 2.0

version brought to life the session daemon which is, as a reminder, the central registry and

rendez-vous point for all tracing sources and users. We needed a command line interface to

handle user inputs and interact directly with the session daemon.

Moreover, a single command line interface is not enough for today use cases. It is not

uncommon, as of today, that an instrumented application control itself tracing actions. Also,

third part application managing tracing of large number of applications and systems is an

important use case to support. Only using the lttng command in scripts or executing it at

each action inside source code is not efficient nor portable.

This is why we designed a control library called liblttng-ctl which provide an API for

every possible actions and features supported by the tracers and session daemon. The lttng

command was built on top of it.

lttng command

Mention earlier, the usability, for user experience and ease of use, was studied looking at

three possible Linux user interfaces commonly used.

1. Arguments and options for all LTTng features like so:

$ lttng --create my_session

$ lttng --enable-event --kernel --name sched_switch

$ lttng --start

59

2. Provided shell inside a Linux shell (bash):

$ lttng

lttng> create my_session

lttng> enable-event sched_switch --kernel

lttng> start

[...]

3. Command-action combo on the command line (like the version control software git 1

$ lttng create my_session

$ lttng list --kernel

[listing kernel events]

$ lttng enable-event sched_switch --kernel

$ lttng destroy my_session

The proof of concept of lttng-tools was originally designed using the UI number one and

was a disaster as more features came in. As of today, the LTTng project as more than 14

different available features and more than 50 different options applicable on those features.

Not only the first UI is very difficult to implement correctly by handling all possible command

line arguments and options but it is also pretty difficult for the user to know what to use.

The second UI studied has almost the same work flow as the third one. However, the

real problem is non-interactive user interaction. The Linux default shell, bash, comes with

a scriptable language and makes the interaction really organic for users. With a home made

shell has to come with functionnalities to make interactions easier from the Linux shell in

order to support automatic user scripts managing lttng commands. The GPG 2 project has

a shell like that but provides the same functionnalities with command line options (1). This

is double the work and is an unnecessary development burden.

Finally, the third UI was the approach we chose. The concept of the tool having a

command as first arguments creates a virtual container for all options and isolates it from

the other commands. For instance, the following example shows the problem of dealing with

arguments that are not compatiable. Which one is the right command to execute? (create

session or create kernel channel).

$ lttng --session my_session --kernel --channel chan1

[bad command]

1. http://git-scm.com2. http://gnupg.org

60

However, looking at the git alike example, we don’t even need to examine the correct

versus bad arguments. The command is create hence use to create a session so the following

options are simply not applicable.

$ lttng create my_session --kernel --channel chan1

All arguments and options following the first parameter is consider to be applied on the

specific command passed to lttng. Here is the list of today’s commands and you will notice

that we went for a semantic of one command is one tracing action.

add-context Add context to event and/or channel

calibrate Quantify LTTng overhead

create Create tracing session

destroy Tear down tracing session

enable-channel Enable tracing channel

enable-event Enable tracing event

disable-channel Disable tracing channel

disable-event Disable tracing event

list List possible tracing options

set-session Set current session name

start Start tracing

stop Stop tracing

version Show version information

view Start trace viewer

One possibility was to merge enable-event and enable-channel under one command being

enable using event and channel as arguments. However, these two commands have very

different options and we endup with the UI one inside a supposedly action container. So, we

went for the most specific action we could and made arguments and options handling much

more easier.

On the usability side, this is the best way we found to present all available LTTng features

to the user. A normal user not knowing anything about tracing can and should understand

quickly how to operate it just by looking at the possible actions instead of possible command

line options. Of course, we always recommend to RTFM :).

Please refer to the lttng.1 man page for more information (Goulet, 2012).

61

Control library

We’ve mentionned above the control library which is the backbone of lttng. Quick note

on that and how it is working along side with the session daemon.

Upon startup, the session daemon creates a client Unix socket which shall only be used

by the control library. If the session daemon is running with privileged credentials, the write

permission is set for the tracing group hence anyone in the tracing group is able to trace the

kernel. If it’s running under normal credential, this socket is created in the home directory

of the user and only him or her can interact with the session daemon.

For each API calls of the control library (Ex: lttng enable event(...)), a connection

is established to the session daemon where the session name, domain and credentials are

passed over the socket along with the command and related options. The socket is than

closed and the returned value is given to the user.

Also, remote control is planned for mid-2012 and will rely on a secure communication

channel using SSH2 protocol (Ylonen et al., 2006). This is the last step for an almost complete

tracing integration for data centres. The ability to control tracing over the network is a very

demanded feature and is crucial for large scale monitoring. The control library will be

extended to support remote control and a possible new command/actions will be added to

the lttng command line interface.

Final note. In order to control tracers (lttng-ust and lttng-kernel), the LTTng 2.0

toolchain’s design imposes that every command has to passed through the session daemon

using this control library. There is no other way to do so by design.


Recommended