Unilateral Facilitation Does Not Raise InternationalLabor Migration from the Philippines
emily a. beam
National University of Singapore
david mckenzie
World Bank
dean yang
University of Michigan
I. IntroductionWage rates of workers using the same skills and doing the same jobs differ by asmuch as 10 to 1 depending on the country in which they work ðAshenfelter2012Þ. Moving from a developing to a developed country results in immediatelarge increases in income for the migrants, with gains that far exceed thoseof any other development policy intervention ðClemens, Montenegro, andPritchett 2009; Hanson 2009; McKenzie, Gibson, and Stillman 2010; Gibsonand McKenzie 2014Þ. Why do so few people emigrate, and what policies cangovernments in developing countries pursue to make it easier for their citizensto escape poverty through international migration?There is a growing literature in development economics that addresses the
question of why households do not make objectively profitable investments,such as using more fertilizer ðDuflo, Kremer, and Robinson 2011Þ, reinvest-ing profits in their businesses ðFafchamps et al. 2014Þ, keeping enough smallchange ðBeaman, Magruder, and Robinson 2014Þ, and continuing in schoolðJensen 2010Þ. These studies have shown that often a relatively small and
We gratefully acknowledge funding support from the World Bank’s Gender Action Plan and ResearchSupport Budget. We thank the editor and associate editor for helpful comments, Ditas Ravanilla andAdelia Oling for their crucial collaboration in this project, the People’s Alternative Livelihood Foun-dation of Sorsogon, Inc. ðPALFSIÞ, branch officers and staff for their support and assistance inimplementation, Innovations for Poverty Action for overseeing the fieldwork, and in particular, JomaGonzalez, Jaye Stapleton, Naomi Joseph, Veronica Gonzalez, Cree Jones, Amanda Chang, and the restof the Sorsogon Work Access Project team. We obtained human subjects approval for this study fromthe University of Michigan, Health Sciences and Behavioral Sciences Institutional Review Board,project HUM00034271, The Determinants of Temporary Labor Migration in the Philippines. Con-tact the corresponding author at [email protected].
inexpensive intervention, such as providing information or nudging behavior,can result in more households undertaking these investments. But the absolutescale of the returns to these investments is small—Duflo et al. ð2011Þ estimatethat farmers stand to earn $10 more per season from using fertilizer, forexample.1 In contrast, Clemens et al. ð2009Þ estimate that amarginalmoderate-skill mover from a typical developing country to the United States would earnan additional $10,000 per year, a gain 1,000 times as large. Yet to date there isvery little literature to explain why more individuals do not take up thesemassive returns or on what interventions can work in spurring them to do so.Migration-source country governments have pursued two broad approaches
to facilitating international migration for formal, legal work. Source countriescan pursue unilateral facilitation policies on their own, without needing thecooperation of governments of migration-destination countries. Unilateral fa-cilitation may involve provision of information, loan facilitation, and policiesto ease the international job-search process. These policies act on the supplyside of the migrant labor market and are similar in spirit to the types of in-terventions that have been shown to enable households to undertake smaller-scale profitable investments. Enhanced unilateral facilitation could have positiveimpacts on migration if immigration policies in destination countries are suf-ficiently open or if bilateral policies are already in place. Conversely, eventhough migration can have a high return, investing in obtaining information,in acquiring a passport, and in searching for overseas jobs may have low returnsif border restrictions make the probability of being able to migrate abroad af-ter undertaking this investment low.Bilateral facilitation policies, however, involve cooperation with govern-
ments or employers in destination countries and include the formalization ofagreements to allow labor migration of specified numbers and types of work-ers. Such policies primarily attempt to influence the demand side of themigrantlabor market, but they could also have supply-side components.The Philippines has made perhaps the greatest progress among migration-
source countries in implementing bilateral approaches, as evidenced by theexistence of 49 bilateral migration agreements with 25 destination countriesðCenter for Migrant Advocacy 2010Þ and an annual deployment of more than2 million overseas Filipino workers ðOFWsÞ worldwide ðCFO 2012Þ. Con-sequently, overseas remittances top US$25 billion annually, nearly 10% ofGDP ðBSP 2012Þ. However, the Philippines is not alone in promotinginternational migration; countries such as Bangladesh, Sri Lanka, and India
1 Rosenzweig ð2012Þ makes this point more systematically, showing that many such studies withlarge percentage gains amount to very small absolute gains.
000 E C O N O M I C D E V E L O P M E N T A N D C U L T U R A L C H A N G E
This content downloaded from 23.235.32.0 on Mon, 7 Dec 2015 10:35:31 AMAll use subject to JSTOR Terms and Conditions
are looking to the Philippine government’s efforts as a model for promotingand regulating international migration ðRay, Sinha, and Chaudhuri 2007Þ.2Awider range of countries have also attempted unilateral policies to ease the
barriers preventing their citizens from migrating. For example, several PacificIsland governments such as Tuvalu have provided financing for seasonalworkers wishing to migrate abroad ðBedford, Bedford, and Ho 2010Þ. Anumber of countries have made it easier for their citizens to obtain passports;Nepal, for example, decentralized the passport issuance process so that citizensno longer had to travel over mountain ranges to Kathmandu to obtain apassport ðMcKenzie 2007Þ. Other countries, such as Armenia, have attemptedto provide potential migrants with more information about the disadvantagesof illegal migration and about possibilities for legal jobs abroad ðIOM 2009Þ.And Egypt created a jobs website to better connect Egyptian job-seekers andemployers abroad ðFandrich 2009Þ.Despite the spread of these policies, there is currently little rigorous em-
pirical evidence on the effectiveness of either unilateral or bilateral migrationfacilitation in enabling individuals to benefit from the large income gains in-ternational migration offers. We implement a randomized experiment mea-suring the impact of unilateral migration facilitation. Our experiment is largein scale, implements unilateral facilitation at a range of intensities, and occursin the Philippines, one of the world’s most important sources of legal, tem-porary, international labor migration.We implemented our study in Sorsogon, a province that sends relatively
few labor migrants overseas compared to other parts of the Philippines, butwhere one-third of households say they would like to migrate abroad. Thesefeatures—existing and extensive bilateral labor migration arrangements butrelatively low migration relative to other parts of the country—make our ex-perimental context one in which unilateral migration policies could potentiallyhave a substantial positive impact. While Sorsogon residents are underrepre-sented among OFWs, a good share is likely to be qualified for overseas work:more than two-thirds ð69%Þ of our sample had completed high school, andnearly half ð50%Þ had completed at least some postsecondary school.3 We
2 While the Philippines ranks fourth globally in total remittances received annually, just behindMexico, as a share of its own GDP, it ranks only eighteenth, behind countries including Nepal,Honduras, El Salvador, Serbia, and Bangladesh ðRatha, Mohapatra, and Silwal 2010Þ.3 The recruitment agencies we worked with were eager to attract workers from Sorsogon Province,particularly for jobs that require less specialized work experience, for which they reported difficultyfilling vacancies. They were hesitant to recruit in rural areas because although they had no difficultyidentifying qualified workers, in the past they found that applicants would initiate but could notcomplete the process.
Beam, McKenzie, and Yang 000
This content downloaded from 23.235.32.0 on Mon, 7 Dec 2015 10:35:31 AMAll use subject to JSTOR Terms and Conditions
deliberately focus on a random sample of households, rather than selecting oninitial interest in migration, in order to use our interventions to help assess therole of different explanations for why most households do not migrate.Our experiment tested the impact of unilateral facilitation policies modeled
after potential low- and medium-cost interventions to reduce informational,job matching, and documentation barriers, which, as described above, havebeen used at least in part by a wide range of other countries. In addition to itsactive role in bilateral migration facilitation, the Philippine government hasundertaken or has underway a number of unilateral efforts, such as warningmigrants about illegal recruitment, providing information on cultural differ-ences in different destinations abroad, and implementing new efforts to re-duce the hassle of applying for a passport ðReyes 2012Þ.The treatments we implement build on these policy efforts, but we refine
them to isolate specific mechanisms that may prevent most people from mi-grating abroad. We target the following mechanisms: ð1Þ information ðaboutjob search, migrating abroad, financing migration, and passport processingÞ,ð2Þ frictions in job search ðassistance in enrolling in an online job-findingwebsite set up by the project to lower search costs and facilitate matchingbetween recruiters and workersÞ, and ð3Þ documentation barriers ðassistanceand a full subsidy for passport applicationÞ. We randomized adults of primemigration age into various combinations of treatments facilitating interna-tional labor migration. Individuals were randomized into a control group thatreceived no treatment or into treatment groups receiving one or more of the setof facilitation treatments.Although we find that our package of interventions results in individuals
taking more steps toward international migration, such as searching for workabroad, getting a job interview, and even getting a job offer, we find a precisezero impact of even our full package of assistance on the likelihood of inter-national migration over a 2-year period. Our point estimate is exactly zero,and the 95% confidence interval is ±1.4%. Thus, reducing information, search,and documentation frictions through the methods tested here can explain atmost why 1 in 100 do not migrate and cannot explain why most people do notmigrate abroad. This contrasts strongly with work on facilitating internalmigration in which information and job postings were sufficient to get ruralThai migrants to go to nearby cities rather than Bangkok ðFuller, Lightfoot,and Kamnuansilpa 1985Þ and a small subsidy equal to the cost of a bus ticketwas sufficient to spur a large increase in internal seasonal migration in Ban-gladesh ðBryan, Chowdhury, and Mobarak 2014Þ. The difference here is, ofcourse, that even with information, job-seeking assistance, and a passport, bor-der restrictions are still in place and curtail migration. We find some evidence
000 E C O N O M I C D E V E L O P M E N T A N D C U L T U R A L C H A N G E
This content downloaded from 23.235.32.0 on Mon, 7 Dec 2015 10:35:31 AMAll use subject to JSTOR Terms and Conditions
of remaining barriers on both the demand and the supply sides for migrantlabor that may explain this lack of migration.
II. SettingThe Philippines is a useful setting to study the impact of unilateral ap-proaches. The Philippine government’s extensive bilateral facilitation policies,along with strong international labor demand, have created many migrationopportunities in the past few decades. The government directly encouragesinternational emigration and regulates private labor recruiters. Numerousfinancial institutions provide financial services to help potential migrants payrecruitment fees ðO’Neil 2004Þ. In the Philippines, even with this infra-structure in place, and despite the fact that the country’s per capita GDPðaround US$2,000Þ is less than one-tenth of that in developed countries,most Filipinos do not migrate, and five in six families do not receive remit-tances from workers abroad.While the Philippines stands out as a promoter of international migration, it
is far from alone in doing so. The promise of remittances and their potential tospur economic development has similarly motivated developed and developingcountry governments to encourage workers overseas either directly, throughbilateral arrangements, or indirectly, by providing favorable tax treatment andincentives to encourage remittances ðPuri and Ritzema 1999; World Bank2006Þ. The type of temporary migration common in the Philippines—legalmigration of an individual as a temporary worker—is common worldwide,with almost all Organization for Economic Cooperation and Developmentcountries having temporary worker programs; it is also the dominant form oflabor migration into the Gulf countries and to Singapore, Malaysia, and Japan.We conducted our experiment in Sorsogon, a rural province 10–12 hours
by bus from the capital, Manila, where most recruitment activities take place.Reflecting its relative poverty and isolation, the Bicol region ðwhere Sorsogonis locatedÞ has relatively low participation in international migration. Theregion accounts for 5.8% of the Philippine population but only 3.3% of thecountry’s overseas worker deployments in 2011 ðNSO 2011Þ.We deliberately chose to focus on a random sample of households from this
province, as detailed below. This enables us to examine what we consider to bethe most important question, “why do most people not migrate?” An alter-native approach would be to try to screen a population to obtain a group ofindividuals who are right at the margin of migrating and see whether par-ticular interventions are enough to push them over the threshold of migrating.Although we believe this would also be an interesting avenue to explore infuture experiments, it would answer a much narrower question. But recent
Beam, McKenzie, and Yang 000
This content downloaded from 23.235.32.0 on Mon, 7 Dec 2015 10:35:31 AMAll use subject to JSTOR Terms and Conditions
findings as to why individuals do not take high-return investments havestressed that it may be because individuals do not have the right informationor need a “nudge” to overcome behavioral biases ðJensen 2010; Duflo et al.2011Þ. This suggests that focusing just on individuals who have already sig-naled their intent to migrate or who have taken steps toward doing so maymiss out on individuals who could benefit substantially from information andother assistance.
III. MethodEarly in 2010, we randomly selected 42 barangays from six municipalities inSorsogon Province in which to conduct the baseline survey.4 We collected ahousehold roster from each barangay that included a list of households, andwe used these to set barangay-specific target sample sizes proportional topopulation. We targeted approximately 5% of the total population from eachbarangay, or roughly 26% of households. We sorted households randomly andselected the first listed households to be our target. When a household couldnot be located or had no eligible members, we replaced it with the nexthousehold on the list.From each household, interviewers screened the first member they met who
had never worked abroad and was age 20–45. Subsequent to the baselinesurvey, we learned from recruitment agencies that most individuals over age40 would not be eligible for overseas work, so we restricted our baselinesample to the 4,153 individuals age 20–40 we interviewed.5 Houses selectedwere typically far enough apart from each other that concerns about infor-mation spillovers are second order; to the extent that there were spillovers, ourtreatment estimates are lower bounds on the differential impact of moreinformation. The passport assistance was only offered to the respondentsthemselves, and so it is not subject to such spillovers. Appendix section A1describes our project timeline and sampling procedure in greater detail.Table 1 reports demographic characteristics of the sample from the baseline
survey: 71% of respondents are female, reflecting the fact that women weremore likely to be at home when our project staff visited the household but alsoenabling us to target those most likely to benefit from a reduction in barriersto overseas migration. Unlike some other migrant-sending countries such as
4 A barangay is the smallest administrative division in the Philippines. The municipalities weselected each have between 25 and 65 barangays, and there are roughly 42,000 barangays in thecountry.5 For the passport sample, we also required that individuals be between age 20 and 40. Tables A12and A13 demonstrate that our results are not affected by including the 855 respondents age 41–45who participated in the baseline survey.
000 E C O N O M I C D E V E L O P M E N T A N D C U L T U R A L C H A N G E
This content downloaded from 23.235.32.0 on Mon, 7 Dec 2015 10:35:31 AMAll use subject to JSTOR Terms and Conditions
Mexico, India, and Bangladesh, where the majority of migrants are male,6
migration from the Philippines is female dominated; between 1992 and 2009,61% of new hires for overseas work were women ðMcKenzie, Theoharides,and Yang 2014Þ. Respondents report relatively high educational attainmentð69% have completed high school and 36% have completed at least somepostsecondary schoolingÞ but low levels of household income ðaveraging₱ 7,400/month, or US$165Þ suggesting they may have high returns to work-ing overseas.7 Thirty-four percent report that they are “interested” or “stronglyinterested” in working abroad.We revisited respondents in 2012 to collect information on their overseas
job-search knowledge, job-search behavior, and migration decisions. We askedwhether and how respondents searched for work overseas between 2010 and2012, and we classified respondents as having migrated if they obtained a job
TABLE 1DESCRIPTIVE STATISTICS
Mean SD N
Female .71 .46 4,151Age ðmeanÞ 31.65 6.06 4,151High school graduate only .33 .47 4,151Some college or vocational only .23 .42 4,151College graduate .13 .34 4,151Interested in working abroad .34 .47 4,151Willing to take risks ð1 5 low, 10 5 highÞ 5.39 3.53 4,143Household income 7.74 6.87 4,084Household savings ðunconditionalÞ 1.78 10.03 3,927No household savings .83 .38 3,927Anyone in household ever take out loan .53 .50 4,150Normalized asset index .00 1.00 4,151Any immediate family overseas .13 .34 4,151Any extended family overseas .54 .50 4,151Household size 5.65 2.22 4,151Employed .41 .49 4,146Ever applied overseas .15 .35 4,147Household receives remittances .09 .29 4,149Ever uses Internet .18 .39 4,149
Note. Sample restricted to baseline respondents without missing data on education and pasthousehold member migration. Household income and savings reported in thousands of pesos.
6 Based on authors’ calculations from 2000 data from the Global Bilateral Migration DatabaseðÖzden et al. 2011; World Bank 2011Þ. Overall, the global stock of migrants is predominantlymale. However, as of 2000, the estimated stock of migrants from the Philippines was 61.1% female,while the stock was 44.7% female from Mexico, 42.4% female from Bangladesh, and 39.0% femalefrom India.7 This and all other conversions are based on the average exchange rate from February to June 2010:US$1 5 ₱ 45.0497 ðOANDA 2012Þ.
Beam, McKenzie, and Yang 000
This content downloaded from 23.235.32.0 on Mon, 7 Dec 2015 10:35:31 AMAll use subject to JSTOR Terms and Conditions
offer and migrated abroad during that period.8 We successfully surveyed90.8% of respondents or another member of their household at endline, andwe find no evidence of differential attrition across treatment assignment ðta-ble A2Þ.9 Our primary analytical sample consists of these 90.8% for whomwe successfully fielded an endline survey of the respondent or a fellow house-hold member. Among the 9.2% who could not be reached at endline in thismanner, we fielded brief “log” surveys of neighbors on international labormigration by the respondent, and inclusion of these log surveys raises our totalendline response rate ðfor the “migrate abroad” outcomeÞ to 98.5%. We showin section A5 that our estimated impacts on migration are robust to use of thefull ð98.5%Þ endline sample, which includes the log surveys.
A. Theoretical Reasons Why More People Do Not MigrateIn the classic economic migration model, migration is an investment: indi-viduals and households incur moving costs to generate returns via higher in-comes ðSjaastad 1962Þ. Subsequent work acknowledges that imperfect finan-cial markets in developing countries can also create additional rationales formigrating such as to finance household investments ðStark and Bloom 1985;Yang 2006Þ.This framework suggests three main reasons why individuals do not mi-
grate even when there are job opportunities and higher incomes to be earnedabroad. First, individuals may have high disutility from moving and thereforemay not wish to migrate internationally even though the monetary benefitsoutweigh the monetary costs. This is certainly not what many nonmigrantssay. For example, 51.1% of surveyed Filipinos age 15 and older say they wouldlike to work abroad if they had the opportunity ðGallup 2010Þ. Second,individuals may not be fully informed about the costs and benefits of mi-gration. Perhaps because they do not get to observe the outcomes of the mostsuccessful individuals who leave ðWilson 1987; Jensen 2010Þ, potential mi-grants may underestimate the benefits of migration ðMcKenzie, Gibson, andStillman 2013Þ. Third, individuals may wish to migrate but may be unable todo so because of various constraints such as credit market imperfectionsðMcKenzie and Rapoport 2007; Grogger and Hanson 2011Þ, documentationbarriers such as difficulty in obtaining a passport ðMcKenzie 2007Þ, or fric-tions in job search that are exacerbated when searching internationally ðOr-tega 2000; Lumpe and Weigert 2009Þ. We designed interventions to attemptto reduce these barriers.
8 See sec. A1 for additional details on the endline survey.9 See sec. A1 for additional details.
000 E C O N O M I C D E V E L O P M E N T A N D C U L T U R A L C H A N G E
This content downloaded from 23.235.32.0 on Mon, 7 Dec 2015 10:35:31 AMAll use subject to JSTOR Terms and Conditions
However, we should note that the original Sjaastad ð1962Þ model waswrittenwith internalmigration inmind. In thatmodel, individuals who pay thecosts of migrating can do so if they choose. In contrast, international migrationpresents the further constraint of international borders, which limit migrationopportunities. There are two ways we can modify the model to include thepresence of these borders. The first is to view border restrictions as anotherelement of the cost of migrating ðe.g., paying for the qualifications to meetskilled migration requirements or paying recruitment fees to companies thatcan secure a job opening for you abroadÞ. If these costs are large relative tothe costs of information, job search frictions, and documentation, then inter-ventions that change only these components of costs without relaxing borderrestrictions will have limited effect. Alternatively, instead of viewing the modelas being about whether to invest inmigration, it could be viewed as being aboutwhether to invest in steps to migration, such as obtaining information aboutmigration, searching for a job abroad, and getting a passport. The expectedreturns from investing in this technology will then depend on how easy it isto migrate once these other constraints are overcome—if border restrictionsmake the likelihood of migrating low, it may not be profitable to invest in ef-forts to migrate, even though migration itself is extremely profitable for thosewho get to migrate.
B. InterventionsInformation and Website Assistance
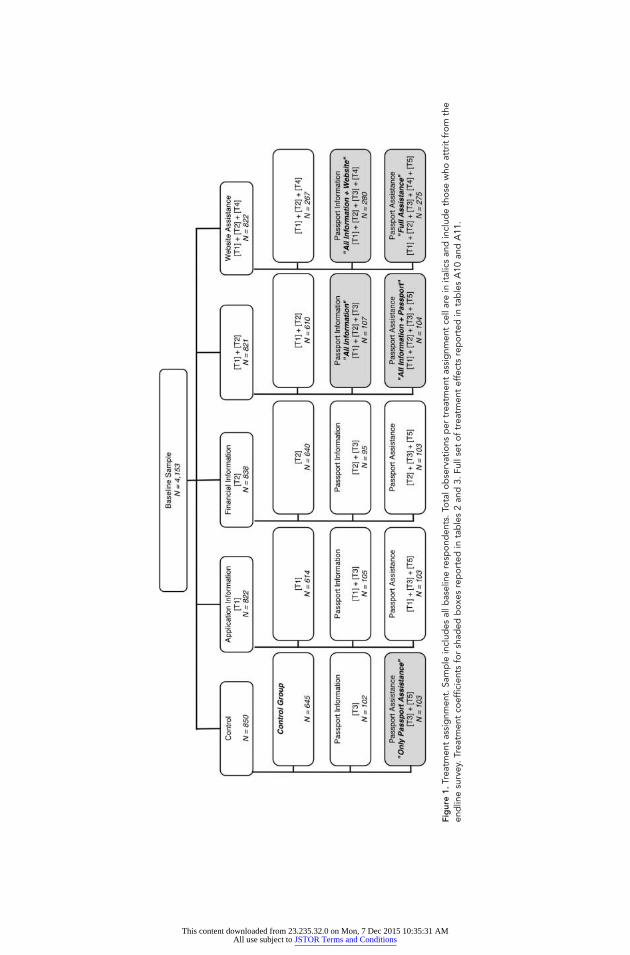
During the baseline survey, we randomly assigned respondents to a controlgroup or to one of four treatment groups designed to improve their infor-mation about and access to overseas work opportunities ðfig. 1Þ. These groupswere application information ðT1Þ, financial information ðT2Þ, applicationand financial information ðT1 1 T2Þ, and website assistance ðT4Þ. Theapplication information consisted of information on typical overseas costs; thesteps needed to apply for work abroad; an advertisement to enroll in Pilijobs.org, an overseas job-finding website designed as part of this project; and a listprovided by the Philippine Overseas Employment Agency that details ways toavoid illegal recruitment.10 Financial information consisted of typical place-ment fees for work abroad and a list of Manila-based financial companiesthat provide loans for placement fees.To facilitate job matching, we worked with several Manila-based over-
seas recruitment agencies and a Sorsogon microfinance nongovernmental
10 The full text of these interventions is included in an online appendix. Note that Pilijobs.org is nolonger available, since it was taken down when our project ended.
Beam, McKenzie, and Yang 000
This content downloaded from 23.235.32.0 on Mon, 7 Dec 2015 10:35:31 AMAll use subject to JSTOR Terms and Conditions
organization to develop a website, Pilijobs.org, to help respondents easilycontact and apply with reputable recruitment agencies and to allow thoseagencies to directly post job opportunities that could be accessed by respon-dents. While several widely used job-finding websites for overseas work al-ready exist in the Philippines, we developed a separate one to ensure thatapplicants would be put in contact with high-quality, properly licensed re-cruitment agencies only and to track their enrollment and participation in thewebsite. Five recruitment agencies used the site, both to post job listings andto review applicants, and we worked closely with them to obtain their feed-back and to encourage their staff to use the website. Section A2 includes ad-ditional details about Pilijobs.orgWebsite assistance ðT4Þ was always assigned along with application and
financial information ðT1 1 T2Þ. It consisted of a paper form respondentscould use to enroll in Pilijobs.org, and interviewers provided help if requested.Interviewers returned to pick up completed forms, or respondents returnedthem to a nearby office. Project staff encoded and uploaded forms to thewebsite.
Passport Assistance
On the basis of feedback from our partner recruitment agencies during thefirst stage of the project, we determined that another potential barrier tooverseas migration was difficulty accessing a passport. Agencies reported thatbecause of difficulty and delays many individuals encounter when applyingfor passports, they prioritized applicants who already had passports. In mid-2011, we randomly assigned a subset of our sample to one of two treatmentstargeted to help respondents get passports for overseas work, which were cross-randomized with our initial treatments to generate 15 total treatment andcontrol cells ðfig. 1Þ.The first passport treatment, passport information ðT3Þ, provided respon-
dents a flier on the importance of having a passport before applying for over-seas work and the steps they could take to obtain a passport. The secondpassport treatment, passport assistance ðT3 1 T5Þ, involved the passport in-formation treatment plus a letter inviting respondents to participate in a pro-gram that fully subsidized the typical costs of applying for a passport ðinclud-ing transportationÞ, along with project staff assistance with passport application.Figure 1 shows the treatments, which range from the control group to “All
Information” ðapplication, financial, and passport information; T1 1 T2 1T3Þ and “All Information1Website” ðT11 T21 T31 T4Þ. The most in-tensive treatment, “Full Assistance,” includes all information treatments, web-site assistance, and passport assistance ðT1 1 T2 1 T3 1 T4 1 T5Þ.
Beam, McKenzie, and Yang 000
This content downloaded from 23.235.32.0 on Mon, 7 Dec 2015 10:35:31 AMAll use subject to JSTOR Terms and Conditions
C. Randomization to Treatment and ControlInformation and Website Assistance Randomization
Our baseline sample was randomly allocated to a control group or to one offour treatment groups: application information ðT1Þ, financial informationðT2Þ, application and financial information ðT1 1 T2Þ, and website assis-tance ðT1 1 T2 1 T4Þ. The sample was divided evenly between these fivegroups.Each respondent’s treatment assignment was blind to the interviewer until
after he or she completed the baseline survey. Interviewers received sealedenvelopes containing a thank you letter, the information treatments ðas as-signedÞ, and blank paper to balance the weight of the envelopes betweentreatment types so that the interviewer could not guess the treatment until theenvelope was opened after the survey. Each envelope was labeled with thehousehold identification number assigned to the respondent being inter-viewed, serving as the link between the respondent and treatment assignment.Because of our partnership with the microfinance institution PALFSI, we
anticipated that current clients might respond differently to treatment andhave different characteristics from non-PALFSI clients. Envelopes were ran-domized by barangay and by microfinance client status in blocks of five. Thisprocedure generated block randomization within 81 barangay-by-client-statusstratification cells. Our regression estimates include indicator variables foreach stratification cell as control variables.
Passport Randomization
Respondents in the passport survey were randomly assigned with equal prob-ability to a control group or to one of two treatment groups before imple-mentation.We stratifiedmembers of the passport sample by baseline treatmentgroup,whether they had enrolled in Pilijobs.org, barangay, and age. Specifically,we divided members of this sample into groups on the basis of baseline treat-ment assignment and Pilijobs.org enrollment status, divided each group intobarangays, sorted by age within each barangay-sample cell, and block ran-domized by threes. These respondents were resurveyed and randomly assignedto a passport control group or to the passport information ðT3Þ or passportassistance ðT3 1 T5Þ interventions.Our administrative records indicate that 9.6% of baseline respondents
offered passport assistance successfully obtained a passport. Although theprogram provided a full subsidy of the cost of the passport and required doc-umentation, as well as fully subsidized transport expenses, passport applicantsstill needed to devote substantial time and effort to obtain a passport. For ex-ample, applicants traveled 1–2 hours to the regional office of the Department
000 E C O N O M I C D E V E L O P M E N T A N D C U L T U R A L C H A N G E
This content downloaded from 23.235.32.0 on Mon, 7 Dec 2015 10:35:31 AMAll use subject to JSTOR Terms and Conditions
of Foreign Affairs in Legazpi City three separate times to apply for and receivetheir passport, andmost applicants made additional trips to other local agenciesto obtain required documentation for their passport application. Appendixsection A3 and table A4 provide additional details on the passport assistanceprogram and direct impacts of the interventions on passport acquisition.
Balancing Tests
Columns 1–5 of table A3 report mean values for a set of individual andhousehold characteristics of respondents, separately for each of the fouroriginal treatment conditions plus the control group. In columns 6–8, wereport the corresponding characteristics of respondents who were part of thepassport sample, on the basis of their assignment to the passport control,information, or assistance treatments. ðRecall that these are overlappingtreatments, but not all baseline respondents were part of the passport sample.ÞThe various randomized treatments have similar observables to the respec-
tive control groups. While there are some cases in which the mean value ofa covariate in a treatment group is statistically significantly different from themean value in the respective control group ðsignificance levels 10%, 5%, and1%, respectivelyÞ, their frequency is commensurate with what we expectwould occur by chance: out of 84 comparisons with the control group meanin the table, nine ð10.7%Þ are statistically significant at the 10% level or less.Our regression estimates control for this set of baseline covariates, whichshould account for any biases due to these chance imbalances.
D. SpecificationsWe use the following specification to measure the impact of unilateral facil-itation on job search and migration:
Yi 5 a1 o14
j51
bjDji 1 B0
l1 X 0d1 εi;
where Yi is the outcome variable for respondent i, measured in the 2012 end-line survey, and D j
i is a binary indicator equal to one if respondent i is as-signed to combination j of application information ðT1Þ, financial informationðT2Þ, passport information ðT3Þ, website assistance ðT4Þ, or passport assis-tance ðT5Þ.Vector B includes the barangay/client status set of stratification cell fixed
effects, along with an indicator for whether the respondent was randomlyselected to be in the passport sample. The coefficient on this indicator would benonzero if simply being interviewed in the passport sample affected our endline
Beam, McKenzie, and Yang 000
This content downloaded from 23.235.32.0 on Mon, 7 Dec 2015 10:35:31 AMAll use subject to JSTOR Terms and Conditions
outcomes. ðIn practice, this coefficient is consistently close to zero and notstatistically significant.Þ To increase the precision of our estimates, we alsoinclude a vector of prespecified controls, X, for the following baseline char-acteristics: female ðindicatorÞ, age ðcontinuousÞ, high school completionðindicatorÞ, some college or vocational training ðindicatorÞ, college completionðindicatorÞ, interested in working abroad ðindicatorÞ, willingness to take risksð0–10 scaleÞ, household income ðin thousands of pesosÞ, household savings ðinthousands of pesosÞ, whether the household has ever taken out a loan ðin-dicatorÞ, asset ownership ðnormalized index of durable asset holdingsÞ, whetherthe respondent has extended family overseas ðindicatorÞ, and whether the re-spondent has immediate family overseas ðindicatorÞ. Missing covariate valuesare coded as zeros, and we include a set of missing value indicator variables.We have 14 mutually exclusive treatment categories in addition to an omit-
ted control group, as outlined in figure 1. In regressions for tables 2 and 3, weestimate all coefficients, but to simplify presentation we report results for onlythe following five treatments:
1. Application, financial, and passport information ðT1 1 T2 1 T3; AllInformationÞ
2. Application information, financial information, passport information,and website assistance ðT1 1 T2 1 T3 1 T4; All Information 1WebsiteÞ
3. Passport information and passport assistance ðT3 1 T5; Only PassportAssistanceÞ
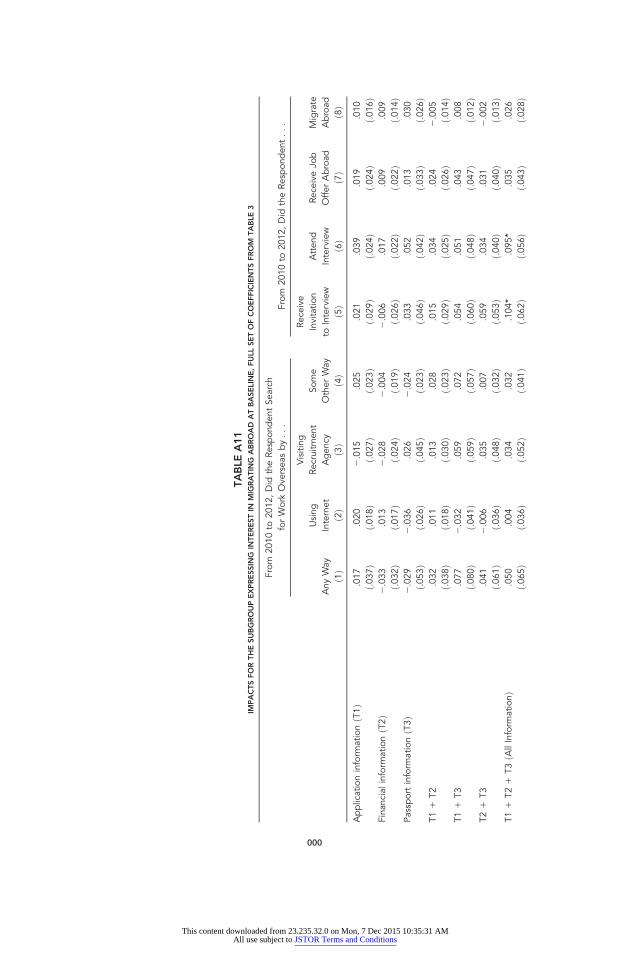
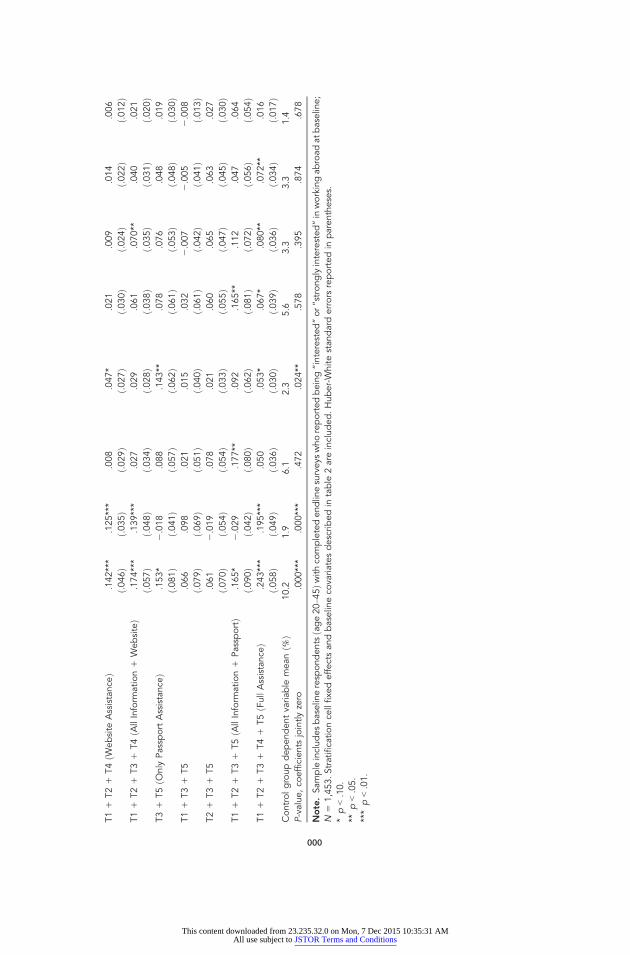
This specification enables us to report results for the full informationtreatment and then for combinations of the website assistance and passportassistance with full information. We report the complete set of 14 treatmentcoefficients in tables A10 and A11.
IV. ResultsWe examine whether unilateral facilitation can increase international migra-tion. In particular, we test four hypotheses:
H1. The massive gain in income possible from migration should result inhigh migration demand.
000 E C O N O M I C D E V E L O P M E N T A N D C U L T U R A L C H A N G E
This content downloaded from 23.235.32.0 on Mon, 7 Dec 2015 10:35:31 AMAll use subject to JSTOR Terms and Conditions
Since the monetary gains from migration are likely to far exceed the mon-etary costs for most Filipinos ðClemens et al. 2009Þ, theory predicts mostindividuals will wish to migrate unless the disutility from moving is high. Infact, only 33.9% of individuals say they are interested or very interested inmigration at baseline, and far fewer search for work overseas ð5.1% of thecontrol groupÞ between survey rounds.
H2. Incomplete information prevents individuals from realizing the gainsfrom migration.
If individuals underestimate the gains from migration ðMcKenzie et al. 2013Þor overstate the costs, then some individuals for whom it is optimal to migratewill decide not to do so. Knowledge is clearly incomplete—at baseline, one-quarter of individuals responded with “don’t know” to the typical wages andcosts of work overseas for six common destination countries, and the responsesgiven by those who do give an answer also suggest considerable inaccuracies.For example, half of those who did respond estimated they would earn the samewage or less in high-wage Canada as they would in low-wage Saudi Arabia. Atendline, only 14.3% of the control group can name a lender who can financemigration costs, and only 19.9% know where to go to apply for a passport.However, the information treatments alone do not result in higher rates ofjob search or international migration.Figure 2 highlights means of key outcomes across a representative subset of
treatments. We see that the rate of overseas job search ð5.3%Þ for the AllInformation treatment is similar in magnitude and not statistically differentfrom the 5.1% rate in the control group and that only 1.1% of the All Infor-mation group migrates abroad over the 2-year period. Table 2 provides re-gression estimates of the treatment effects for a broader range of job-search andmigration outcomes over the 2-year period and confirms this lack of impact.Table 3 restricts the regression analysis to the subset of individuals who indi-cated that they were interested in migrating at baseline. In this subsample,information alone induces statistically significant increases ðat the 10% levelÞin the likelihood of being invited to interview and attending an interview forwork abroad, but there is no statistically significant impact of informationalone on actual migration.
H3. Frictions in matching with recruiters limit international migration.
Even if individuals have correct information and decide the gains frommigration exceed the costs, they still need to match with a job abroad ðOrtega
Beam, McKenzie, and Yang 000
This content downloaded from 23.235.32.0 on Mon, 7 Dec 2015 10:35:31 AMAll use subject to JSTOR Terms and Conditions
2000; Lumpe and Weigert 2009Þ. The website treatment is intended to helpindividuals do this. Figure 2 shows that the combination of information and thewebsite treatment ðAll Information 1 WebsiteÞ caused a substantial increasein the rate of search for work abroad, from 5.1% to 15.7%. The regression-adjusted estimate of this treatment effect from table 2 is nearly identical,indicating a 10.6 percentage-point increase ðstatistically significant at the 1%levelÞ. Despite inducing substantially higher search effort, the treatment causesno additional migration abroad: the coefficient estimate in table 2 column 8 isvery small in magnitude and is not significantly different from zero. For thesubgroup expressing interest in migrating at baseline, table 3 shows the websiteand information combination resulted in a 19.6 percentage-point increase injob search and a 7.7 percentage-point increase in attending an interviewðstatistically significant at the 1% and 5% levels, respectivelyÞ butmuch smallerand statistically insignificant increases in the job-offer rate ð4.1 percentagepointsÞ and in the migration rate ð2.3 percentage pointsÞ.
Figure 2. Reported interest in overseas migration, compared to search effort and realized migration acrossselected treatment conditions. “Interested in working abroad” indicates respondent reported he or shewas “interested” or “very interested” in migrating overseas at baseline ðearly 2010Þ. Other variables re-ported in 2012 endline survey. Searching for work abroad includes asking family/friends, applying with arecruitment agency, applying online, or searching another way. Sample includes all baseline respondentswith completed endline surveys. Error bars indicate 95% confidence intervals; *** 5 difference versuscontrol group is statistically significant at 1% level. See figure 1 for treatment definitions.
000 E C O N O M I C D E V E L O P M E N T A N D C U L T U R A L C H A N G E
This content downloaded from 23.235.32.0 on Mon, 7 Dec 2015 10:35:31 AMAll use subject to JSTOR Terms and Conditions
Lack of a passport may prevent recruiters from even considering individualsfor job openings or prevent some of those who receive job offers from takingup these offers. Our most intensive Full Assistance treatment, which combinesinformation, website assistance, and assistance obtaining a passport, results ina 21.7% job-search rate ðfig. 2Þ, but it is still far short of the 33.9% reportinginterest in migration at baseline. Table 2 shows that this 15.9 percentage-pointincrease in job search over the control group rate is statistically significant atthe 1% level, and it mainly reflects increased online search ðcol. 2, increase sig-nificant at the 1% levelÞ, in addition to some additional search via other meth-ods, such as attending job fairs ðcol. 4, increase significant at the 5% levelÞ.The Full Assistance treatment also has positive impacts on job-interview in-vitations, interview attendance, and job-offer receipt ðcols. 5–7, effects signif-icant at the 10%, 5%, and 10% levels, respectivelyÞ, and these effects are largerelative to control group rates ð2.6%, 1.5%, and 1.7%, respectivelyÞ. Despitethese positive impacts on premigration outcomes, the treatment has no sta-tistically significant impact on migration abroad: the point estimate is 0 per-centage points to the third decimal place ðcol. 8Þ. A 95% confidence intervalfor the impact is ±1.4%.Should we view these impacts as small or large? While this confidence in-
terval includes impacts that are large in relative terms compared to the controlgroupmigration rate of 0.9%, they are very small in absolute terms. Even at theupper end of our confidence interval, at most one out of 100 individualsmigrates as a result of the combined package of reduced barriers. In the words ofClemens ð2011Þ, the massive gains from international migration represent“trillion dollar bills on the sidewalk.” At present only one in 100 individuals inour sample stops to pick up one of these bills, and at most, our full package ofinterventions succeeds in getting one more picked up—clearly then our in-terventions do not explain why the vast majority of people do not take up thisopportunity. We are in agreement here with Rosenzweig ð2012Þ who critiquesthe practice of viewing large percentage changes on small bases as large effects,when they represent very small absolute gains.Table 3 shows these effects are larger for the subgroup initially expressing
interest in migration ðfor whom demand should not be the constraintÞ, with a26.6 percentage-point increase in job search, an 8.5 percentage-point increasein job-interview attendance, and a 7.3 percentage-point increase in the likeli-hood of receiving a job offer abroad ðall statistically significant at the 5% levelor lessÞ. However, there is still only a statistically insignificant 1.7 percentage-point increase in migration abroad. That is, our full package of unilateralfacilitation delivered to the subgroup interested in migrating still does notsignificantly increase migration. Since this is a subsample, the confidence
Beam, McKenzie, and Yang 000
This content downloaded from 23.235.32.0 on Mon, 7 Dec 2015 10:35:31 AMAll use subject to JSTOR Terms and Conditions
interval is wider than for the full sample, but at21.7%,15.1%, it still coversonly very modest absolute increases in migration rates.Appendix sections A5 and A6 and table A9 show that these results are ro-
bust to a variety of specifications and to alternate measures of migration out-comes, including a follow-up effort in 2013 to check the migration statusof those with job offers who had not yet migrated in 2012. In tables A5 andA6, we examine the distribution of positions that individuals were offered aswell as the distribution of countries in which these jobs were located. Themost common jobs offered were for domestic helper ð40.9%Þ, service workerð8.6%Þ, caregiver ð7.5%Þ, and factory worker ð7.5%Þ, and nearly half werelocated in the Middle East. Table A7 shows the migration outcomes by region,as of the 2012 survey: 31.2% of offers had led to migration.In table A8, we examine the reasons some individuals with job offers did not
migrate overall and by region.11 We do not find evidence that the jobs offeredwere reported to be undesirable overall or that jobs in the Middle East are lesslikely to be found appealing. The most common reasons given were financialand health related: 24.1% say they could not afford migration costs, and10.3% cite health issues or that they failed the medical exam. Additionally, atleast 27.5% of unaccepted offers can be attributed to a lack of demand tomigrate, either because of the conditions of the position ð8.6% not interestedin type of work, 6.9% salary too lowÞ or family obligations ð10.3%Þ or becausethe respondent was no longer interested in working abroad ð1.7%Þ.
V. ConclusionThe large gain in income possible through international migration makes it apuzzle that so few individuals migrate abroad. We conducted a randomizedimpact evaluation of migration facilitation policies designed to overcome in-formation, matching, and documentation constraints that may inhibit individ-uals from realizing these gains. These are policies that developing countries canimplement unilaterally, without needing to reach bilateral agreements withmigration destination countries.Our results suggest that information constraints are not an important
barrier to international labor migration. Despite individuals lacking completeknowledge about the incomes they could earn abroad, the costs of moving, or
11 With a large sample of job offers, an alternative approach to exploring why all people with joboffers do not move would be to examine the heterogeneity of moves with respect to differentbaseline characteristics such as access to credit, skill level, health, and presence of young children.However, since we get so few moves overall, and the sample with job offers is small, unsurprisinglywe find no significant heterogeneity in treatment impacts on migration.
000 E C O N O M I C D E V E L O P M E N T A N D C U L T U R A L C H A N G E
This content downloaded from 23.235.32.0 on Mon, 7 Dec 2015 10:35:31 AMAll use subject to JSTOR Terms and Conditions
the process involved in migrating, we find that providing such information hasno overall impact on either job search or international migration.12
In contrast, we do find that assisting individuals to match with recruitersthrough a jobs website and to overcome documentation barriers throughpassport assistance does increase job-search effort and the likelihood of ob-taining a job interview. These constraints therefore appear to inhibit indi-viduals taking steps toward international migration, although even with ourmaximum-intensity facilitation, the rate of overseas job search over a 2-yearperiod, 21.7%, is still far short of the fraction of individuals expressing interestin overseas migration at the start of that period ð33.9%Þ. We conclude thatsurvey-based elicitations of migration interest are likely to exceed actualattempts at migration, even in response to intensive migration assistance.However, these substantial impacts on job search lead to no large or sta-
tistically significant increases in actual migration. Only a minority of theadditional respondents induced to search for jobs overseas in response to ourmost intensive facilitation treatment are invited to interview for overseas jobsor receive overseas job offers. ðThat said, the effects of the treatment on theseoutcomes are statistically significant and imply large proportional effectsrelative to low control group rates of interviews and offers but are still smallin absolute magnitude.Þ Substantial fractions of those induced to search foroverseas jobs by our treatments appear to be screened out by those on thedemand side of the migrant labor market—recruitment agencies and the ul-timate overseas employers. This is consistent with recent work showing howbinding minimum wages specific to occupation and destination limits thenumber of job openings abroad for Filipinos ðMcKenzie et al. 2014Þ. It is alsoconsistent with themain barrier preventing internationalmigration being a lackof opportunities to work abroad given visa restrictions. This could in turn helpexplain the limited responsiveness to even our most intense intervention—individuals may conclude rationally that the return to looking for a job abroadeven with a passport and information is low ðeven if these jobs pay relativelyhigh wagesÞ because the likelihood of getting such jobs is so low.Perhaps the most surprising result of our study is that, while our most
intensive facilitation treatment delivers statistically significant increases inoverseas job offers ðthat are large relative to control group ratesÞ, it has zero
12 One potential reason for this is that more accurate information may dissuade overly optimisticindividuals from searching, balancing out an increase in searching by individuals who undervaluethe gains from migrating. Indeed we find ðand show in table A10Þ that providing only financialinformation or passport information without other facilitation has a small negative impact on jobsearch, consistent with individuals understating the costs and complexity of moving.
Beam, McKenzie, and Yang 000
This content downloaded from 23.235.32.0 on Mon, 7 Dec 2015 10:35:31 AMAll use subject to JSTOR Terms and Conditions
impact on actual overseas migration ðover a 2-year posttreatment windowÞ.This lack of impact serves to further underline the point that demand forinternational migration on the part of developing-country residents is likely tobe overstated—those induced by an intervention to receive actual job offerscommonly reject those offers in the end. Our survey evidence on the reasonsthese jobs are declined fails to pinpoint a dominant reason behind such job-offer rejections. The most common reason, financial constraints ðcited bynearly a quarter of job-offer declinersÞ, does not distinguish between whetherindividuals face actual financial constraints or whether they are indicative thatthe perceived benefits of migration do not exceed the perceived costs.Together, these results indicate that unilateral facilitation policies related to
information, job search, and documentation assistance are not sufficient toincrease rates of international labor migration. We find evidence of multipleremaining barriers on both the supply side ðrelatively low interest on the partof potential migrantsÞ and demand side ðhighly selective screening for in-terviews and job offersÞ for overseas work. Our findings indicate that policymakers aiming to expand access to migration, particularly for those in isolatedareas, should not expect to achieve success if relying solely on unilateral mi-gration facilitation, and they bring to the fore the role of complementary bi-lateral facilitation policies. Investigating the effectiveness of such bilateral pol-icies is an important avenue for future research.
AppendixA1. Data Collection and Sampling ProcedureBaseline Survey ð2010ÞTable A1 presents the full timeline of our project. In early 2010, we selectedsix municipalities in Sorsogon for the baseline. These were selected to includeboth wealthier and poorer municipalities and both rural and urban areas. Wethen randomly selected 42 barangays: 11 from the capital of Sorsogon City; 7each from Casiguran, Pilar, and Gubat; and 5 each from Castilla and Irosin.Because of security and logistical considerations, three initially selected bar-angays were excluded and replaced with the next randomly selected barangay.We obtained household rosters from each barangay captain, and we sorted
households randomly and then targeted the first listed households. Interviewersscreened the first person they approached in the household. To be eligible forour study, the target respondent had to be between age 20 and 45, and he or shemust not have worked abroad in the past. Households that had current or pastoverseas Filipino workers ðOFWsÞ were still eligible for the study. If the firsthousehold member was not eligible or did not want to participate in the survey,the interviewer asked whether anyone else in the household might be eligible
000 E C O N O M I C D E V E L O P M E N T A N D C U L T U R A L C H A N G E
This content downloaded from 23.235.32.0 on Mon, 7 Dec 2015 10:35:31 AMAll use subject to JSTOR Terms and Conditions
and interviewed that person instead. We surveyed 5,008 individuals betweenMarch and August 2010, and 4,153 were age 20–40.
Passport Follow-Up ð2011ÞIn 2011, we launched the second stage of our project to provide some re-spondents with assistance obtaining a passport. We revisited a subset of ourbaseline sample. Specifically, of respondents age 20–40, we included all whoreceived the website treatment ðT4Þ; all Pilijobs.org enrollees in other treat-ment groups ð32 respondentsÞ; 300 respondents randomly selected from eachinformation treatment group T1, T2, and T1 1 T2; and 300 respondentsrandomly selected from the control group. At the time of the passport survey,we also interviewed and offered passport assistance to a supplemental sampleof Sorsogon Province residents who enrolled in Pilijobs.org through othermeans that we describe in section A2 but who were not a part of our baselinesample. We do not include these respondents in our analysis.
Endline Survey ð2012ÞWe conducted an endline survey in mid-2012 to measure the impacts of ourinterventions. We visited all respondents from the baseline sample, makingtwo attempts to reach each respondent. We interviewed another householdmember and administered a proxy survey when the respondent was notavailable, enabling us to obtain full data on respondent and household mi-gration steps and job-search behavior when we could not directly reach therespondent. When no member of the household could be interviewed, weinterviewed a neighbor using a “log” survey. The information collected in thatsurvey was limited to the respondents’ whereabouts and whether he or she wascurrently working overseas. We show in section A5 that our finding of noimpacts of the treatments on migration abroad are robust to expanding thesample to include these log surveys.Using this three-pronged approach, we obtained measures of whether the
respondent migrated abroad for work from full, proxy, or log surveys for 4,089respondents, or 98.5% of our sample. Of those, 73% were surveys with the re-spondents themselves, 20% were proxy surveys, and 7% were log surveys.Excluding the log surveys, we have a 91% response rate for our full set of jobsearch and migration outcome variables.We provide full details on attrition rates in table A2. In column 1, the
dependent variable is an indicator for the endline being either completelymissing or administered only via the log survey, in which case we are missingthe premigration outcome measures we examine in columns 1–7 of tables 2and 3. We do not find evidence that either type of attrition is substantially
Beam, McKenzie, and Yang 000
This content downloaded from 23.235.32.0 on Mon, 7 Dec 2015 10:35:31 AMAll use subject to JSTOR Terms and Conditions
related to treatment assignment. Coefficients on all treatments are small inmagnitude, and although the coefficient on treatment T21 T3 is individuallysignificant, we cannot reject the null hypothesis that the treatment assign-ments are jointly unrelated to attrition.In table A2 column 2, the dependent variable is an indicator for the
respondent not being included in any of our endline surveys ðrespondent, proxy,or log surveysÞ. As in column 1, we find some evidence of differential attritionfor those assigned to treatments T21T3, significant at the 5% level. However,the difference in response rates is small in magnitude ðonly 1.7 percentagepointsÞ. We use the sample that does not include the log surveys for our mainanalysis and only use these log survey data as a robustness check.
A2. Pilijobs.orgWe developed Pilijobs.org in partnership with several Manila-based overseasrecruitment agencies and our local microfinance partner ðPALFSIÞ. Pilijobs. orgprovided applicants with the opportunity to easily contact and apply for over-seas jobs with reputable recruitment agencies and allowed those agencies todirectly post job opportunities that could be accessed by Sorsogon residents.We launched Pilijobs.org in early April 2010, within weeks of the start of thebaseline survey period. Nearly all ð91%Þ of baseline respondents who enrolledin Pilijobs.org did so using paper forms, so their enrollment is unlikely to beaffected by their brief delay between survey launch and the Pilijobs.org websitelaunch.In addition to the baseline applicants who enrolled online or through our
paper forms, we recruited other applicants through door-to-door advertising inselected municipalities and barangays of Sorsogon Province that were notincluded in our baseline sample. This was done to ensure the website hada sufficient user base to make it attractive to the recruiters. These applicantsalso received paper forms that staff encoded and uploaded to the website, andthese advertising efforts all took place after completion of the baseline surveyand interventions. We also advertised with bumper stickers and posters inmunicipalities that were not part of our baseline sample. To avoid spillovers, wedid not use these general advertising methods in any of our baseline munici-palities. Finally, we marketed Pilijobs.org broadly across the Philippines, usingtargeted Facebook advertising. All of these efforts resulted in an additional5,500 enrollees, bringing the total enrollment in Pilijobs to roughly 7,100.
A3. Impact on Passport AcquisitionThe payments we disbursed for the passport assistance treatment varied acrossapplicants, ranging from ₱ 1,250 ðUS$28Þ for just transportation and the pass-
000 E C O N O M I C D E V E L O P M E N T A N D C U L T U R A L C H A N G E
This content downloaded from 23.235.32.0 on Mon, 7 Dec 2015 10:35:31 AMAll use subject to JSTOR Terms and Conditions
port fee to ₱ 2,350 ðUS$52Þ for those with additional documentation require-ments. Some applicants had costs that could not be subsidized by the pro-gram. For example, the project did not cover the expenses of amending a birthcertificate or other documentation due to misspellings or erroneous informa-tion ðwith costs as much as ₱ 30,000Þ. Approximately 11.6% of respondentsinitiated the passport process but were not able to complete it.Because respondents may have obtained passports without directly inter-
acting with our staff, these administrative records are not sufficient to test theimpact of receiving passport information. Table A4 reports the impact of ourassigned treatments on whether respondents reported in the endline surveythat they currently had a valid passport. All treatments that include passportassistance ðT5Þ have positive effects on passport ownership that are statisti-cally significant at the 5% level or less. Effect sizes for these treatments rangefrom 7.4 to 12.6 percentage points, which are large compared with the controlgroup rate of 4.5%. In addition, the most comprehensive treatment that doesnot include passport assistance ðT5Þ, All Information1Website ðT11 T21T3 1 T4Þ, also increases passport ownership by 4.9 percentage points ðstatis-tically significant at the 5% levelÞ.
A4. Migration Outcomes by Region and Reported Reasons for Not MigratingTables A5–A8 present data from our endline survey on characteristics ofoverseas job offers that respondents reported. This includes the range of oc-cupations ðtable A5Þ, destination countries ðtable A6Þ, and migration out-comes by region ðtable A7Þ. We also include reported reasons for not mi-grating, for those individuals who did receive an overseas job offer, in table A8.We discuss these tables in the main text.
A5. Impacts on Migration, including Endline Data from Log SurveysAll estimation results presented in the main text and here so far use data fromrespondent or proxy ðother household memberÞ surveys, which account for91% of endline surveys. As noted above in column 1 of table A2, there is nosystematic pattern of differential inclusion in the respondent or proxy surveysrelated to treatment status.That said, it is important to confirm that our ðabsence ofÞ results for the
impact of the treatments on migration overseas are robust to including re-sponses from the “log” surveys of neighbors, which were administered whenneither respondent nor proxy surveys could be successfully completed. Logsurveys were very limited in content, asking only whether the respondent wascurrently living overseas and what he or she was doing abroad. Inclusion of the
Beam, McKenzie, and Yang 000
This content downloaded from 23.235.32.0 on Mon, 7 Dec 2015 10:35:31 AMAll use subject to JSTOR Terms and Conditions
log survey responses on whether the respondent was working abroad raises ourendline response rate to 98.5%.We report the impact of our treatments on whether respondents were
currently working abroad, including log survey responses, in column 1 oftable A9. The results confirm our previously reported findings that use onlythe respondent and proxy surveys: there is no evidence of positive statisticallysignificant impacts of any treatment on migration overseas. Indeed, we findthat some information treatments may have actually reduced internationalmigration. Those assigned to treatments T2 1 T3 are 2.0 percentage pointsless likely to have migrated overseas, which is significantly different from zeroat the 5% level. Some of these differences could have resulted from the dif-ferential attrition observed in table A2, column 2, although it is possible thatwe provided respondents with new information on the difficulties involvedin overseas labor migration, discouraging some respondents from seeking tomigrate. However, we cannot reject the null hypothesis that all of the treat-ment effects are jointly zero.
A6. 2013 Supplementary Survey of Job-Offer RecipientsAt the time of the endline survey, 13.8% of those who had received overseasjob offers but had not yet migrated reported that their migration was stillpending ðtable A8Þ. One possibility we sought to examine was whether ourendline survey took place too soon to capture migration effects. We conductedthe endline survey from May through August 2012, which was between9 months and 1 year after we offered respondents passport assistance. Becausethe passport process was quite time consuming, some respondents receivedtheir passports as late as 3 months before the endline survey, and they may nothave yet had time to finish the migration process they initiated when wefollowed up with them.To address this concern, in March and April 2013 we resurveyed respon-
dents who reported that anyone in their household was offered a job over-seas between 2010 and 2012, including those who had offers they had notyet accepted. We asked them about the status of the offers they listed in theendline survey, as well as any offers that were received but not listed in theendline survey, either because they were not reported or because the offer wasreceived after the endline survey took place.From our set of baseline respondents, we attempted to contact 196 house-
holds, and we successfully completed 194 surveys ð99%Þ. We completed54% with respondents and 46% with a proxy household member. ðProxysurvey rates are especially high for the 2013 offer survey because if the re-spondent was not available at the initial visit but another household member
000 E C O N O M I C D E V E L O P M E N T A N D C U L T U R A L C H A N G E
This content downloaded from 23.235.32.0 on Mon, 7 Dec 2015 10:35:31 AMAll use subject to JSTOR Terms and Conditions
was willing to participate, we interviewed that member rather than scheduleanother visit.ÞUsing this 2013 survey of baseline respondents reporting job offers in the
2012 endline, we generate a modified indicator of overseas migration, mea-sured nearly 2 years after initial passport treatment assignment. This variablemodifies the previous “migrate abroad” variable ðin col. 8 of tables 2, 3, andA10–A13Þ by additionally counting a respondent as having migrated if a joboffer they reported in the 2012 endline survey is reported as having led tomigration overseas in the 2013 survey. We did not modify the “migrateabroad” variable if in the 2013 survey we learned that a respondent migratedbut it was the result of a job offer not reported in the 2012 endline. This isbecause our objective here was simply to check whether our results wouldchange if we allowed migration pending as of the 2012 endline to actually leadto migration. ðTo have done otherwise would have led to a false inflation ofthe treatment effect of Full Assistance, because we only surveyed those withjob offers in the 2013 survey and because the Full Assistance treatment led to ahigher rate of job offers.ÞColumn 2 of table A9 reports the impacts of our treatments on this modified
“migrate abroad” variable. Our previous results are confirmed: there are nopositive statistically significant impacts on migration, and impacts are similarin magnitude to the migration outcomes reported in column 8 of table 2.
A7. Additional SpecificationsIn tables A10 and A11, we present the full set of results from the specificationsused in tables 2 and 3, respectively. Tables A12 and A13 demonstrate that ourprevious results are robust to including individuals age 41–45 in our sample.These individuals, as described earlier, were part of our baseline survey.However, we learned there are few overseas opportunities for new migrantsover 40. We restricted our passport sample to individuals age 20–40 years old,and we defined our baseline sample similarly, which better reflects the targetpopulation of unilateral migration facilitation efforts.
Beam, McKenzie, and Yang 000
This content downloaded from 23.235.32.0 on Mon, 7 Dec 2015 10:35:31 AMAll use subject to JSTOR Terms and Conditions
ð.023Þ ð.012ÞControl dependent variable mean ð%Þ 9.2 1.4P-value, coefficients jointly zero .667 .031**
Note. Sample includes all baseline respondents; N 5 4,153. Stratification cell fixed effects andbaseline covariates described in table 2 are included. Huber-White standard errors reported inparentheses.* p < .10.** p < .05.*** p < .01.
000
This content downloaded from 23.235.32.0 on Mon, 7 Dec 2015 10:35:31 AMAll use subject to JSTOR Terms and Conditions
Control dependent variable mean ð%Þ 4.5P-value, coefficients jointly zero .000***
Note. Sample includes baseline respondents with completed endline surveys; N 5 3,763.Stratification cell fixed effects and baseline covariates described in table 2 are included.Huber-White standard errors reported in parentheses. Passport status is reported for fulland proxy surveys with nonmissing responses.* p < .10.** p < .05.*** p < .01.
000
This content downloaded from 23.235.32.0 on Mon, 7 Dec 2015 10:35:31 AMAll use subject to JSTOR Terms and Conditions
ð.001Þ ð.001ÞSample size 4,089 3,802Control group dependent variable mean ð%Þ 1.1 1.0P-value, coefficients jointly zero .500 .791
Note. Column 1 sample includes baseline respondents with respondent, proxy, and log endline surveysand nonmissing outcome variables. Column 2 migration outcome is based on 2010–12 offers confirmed in2013 follow-up survey, which was conducted among all households with at least one job offer overseas at2012 endline. Stratification cell fixed effects and baseline covariates described in table 2 are included.Huber-White standard errors reported in parentheses.* p < .10.** p < .05.
000
This content downloaded from 23.235.32.0 on Mon, 7 Dec 2015 10:35:31 AMAll use subject to JSTOR Terms and Conditions
Ashenfelter, Orley C. 2012. “Comparing Real Wages.” NBER Working Paperno. 18006, National Bureau of Economic Research, Cambridge, MA.
Beaman, Lori, Jeremy Magruder, and Jonathan Robinson. 2014. “Minding SmallChange among Small Firms in Kenya.” Journal of Development Economics 108:69–86.
Bedford, Charlotte, Richard Bedford, and Elsie Ho. 2010. “Engaging with NewZealand’s Recognized Seasonal Employer Work Policy: The Case of Tuvalu.” Asianand Pacific Migration Journal 19, no. 3:421–45.
Bryan, Gharad, Shyamal Chowdhury, and Ahmed Mushfiq Mobarak. 2014. “Under-investment in a Profitable Technology: The Case of Seasonal Migration in Ban-gladesh.” Econometrica 82, no. 5:1671–1748.
BSP ðBangko Sentral ng PilipinasÞ. 2012. “Overseas Filipinos’ Cash Remittances byCountry, by Source.” http://www.bsp.gov.ph/statistics/spei_pub/Table%2034.pdf.
Center for Migrant Advocacy. 2010. “Bilateral Labor Agreements and Social SecurityAgreements.” Center for Migrant Advocacy, Quezon City.
Clemens, Michael A. 2011. “Economics and Emigration: Trillion-Dollar Bills on theSidewalk?” Journal of Economic Perspectives 25, no. 3:83–106.
Clemens, Michael A., Claudio E. Montenegro, and Lant Pritchett. 2009. “The PlacePremium: Wage Differences for Identical Workers across the US Border.” HKSFaculty Research Working Paper no. RWP09-004, Harvard Kennedy School.
Duflo, Esther, Michael Kremer, and Jonathan Robinson. 2011. “Nudging Farmers toUse Fertilizer: Theory and Experimental Evidence from Kenya.” American Eco-nomic Review 101, no. 6:2350–90.
Fafchamps, Marcel, David McKenzie, Simon Quinn, and Christopher Woodruff.2014. “Microenterprise Growth and the Fly-Paper Effect: Evidence from a Ran-domized Experiment in Ghana.” Journal of Development Economics 106:211–26.
Fandrich, Christine. 2009. “Facilitated International Egyptian Labor Migration andDevelopment: The Integrated Migration Information System as Case Study.” Amer-ican University of Cairo. http://www.aucegypt.edu/GAPP/cmrs/reports/Documents/IMISProjectEvaluation.pdf.
Fuller, Theodore, Paul Lightfoot, and Peerasit Kamnuansilpa. 1985. “Toward Mi-gration Management: A Field Experiment in Thailand.” Economic Development andCultural Change 33, no. 3:601–21.
Gallup. 2010. “Gallup World Poll.” Gallup, Washington, DC.Gibson, John, and David McKenzie. 2014. “The Development Impact of a Best Prac-tice Seasonal Worker Policy.” Review of Economics and Statistics 96, no. 2:229–43.
Grogger, Jeffrey, andGordonH.Hanson. 2011. “IncomeMaximization and the Selectionand Sorting of Immigrants.” Journal of Development Economics 95, no. 1:42–57.
Hanson, Gordon H. 2009. “The Economic Consequences of the International Migra-tion of Labor.” Annual Review of Economics 1:179–208.
000 E C O N O M I C D E V E L O P M E N T A N D C U L T U R A L C H A N G E
This content downloaded from 23.235.32.0 on Mon, 7 Dec 2015 10:35:31 AMAll use subject to JSTOR Terms and Conditions
IOM ðInternational Organization for MigrationÞ. 2009. “IOM Armenia Projects:Facilitating Migration.” IOM, Geneva. http://www.iom.int/jahia/webdav/shared/shared/mainsite/activities/countries/docs/armenia/Armenia-facilitating-migration-2009.pdf.
Jensen, Robert. 2010. “The ðPerceivedÞ Returns to Education and the Demand forSchooling.” Quarterly Journal of Economics 125, no. 2:515–48.
Lumpe, Christian, and Benjamin Weigert. 2009. “Immigration Policy, EquilibriumUnemployment, and Underinvestment in Human Capital.” Labour 23, no. 1:97–130.
McKenzie, David. 2007. “Paper Walls Are Easier to Tear Down: Passport Costs andLegal Barriers to Emigration.” World Development 35, no. 11:2026–39.
McKenzie, David, John Gibson, and Steven Stillman. 2010. “How Important IsSelection? Experimental vs. Non-experimental Measures of the Income Gains fromMigration.” Journal of the European Economic Association 8, no. 4:913–45.
———. 2013. “A Land of Milk and Honey with Streets Paved with Gold: DoEmigrants Have Over-optimistic Expectations about Incomes Abroad?” Journal ofDevelopment Economics 102:116–27.
McKenzie, David, and Hillel Rapoport. 2007. “Network Effects and the Dynamics ofMigration and Inequality: Theory and Evidence from Mexico.” Journal of Devel-opment Economics 84, no. 1:1–24.
McKenzie, David, Caroline Theoharides, and Dean Yang. 2014. “Distortions in theInternational Migrant Labor Market: Evidence from Filipino Migration and WageResponses to Destination Country Economic Shocks.” American Economic Journal 6,no. 2:49–75.
NSO ðNational Statistics OfficeÞ. 2011. “2011 Survey on Overseas Filipinos.” Table 1,Philippine Statistics Authority, Republic of the Philippines. http://www.census.gov.ph/sites/default/files/attachments/hsd/specialrelease/Tab1.pdf.
O’Neil, Kevin. 2004. “Labor Export as Government Policy: The Case of the Phil-ippines.” Migration Policy Institute, Washington, DC. http://www.migrationpolicy.org/article/labor-export-government-policy-case-philippines.
Ortega, Javier. 2000. “Pareto-Improving Immigration in an Economy with Equilib-rium Unemployment.” Economic Journal 110, no. 460:92–112.
Özden, Ça lar, Christopher R. Parsons, Maurice Schiff, and Terrie L. Walmsley. 2011.“Where on Earth Is Everybody? The Evolution of Global Bilateral Migration,1960–2000.” World Bank Economic Review 25, no. 1:12–56.
Puri, Shivani, and Tineke Ritzema. 1999. “Migrant Worker Remittances, Micro-Finance and the Informal Economy: Prospects and Issues.” ILO Working Paperno. 21, International Labour Organization, Geneva.
Ratha, Dilip, Sanket Mohapatra, and Ani Silwal. 2010. Migration and RemittancesFactbook, 2011. Washington, DC: World Bank.
Ray, Sougata, Anup Kumar Sinha, and Shekhar Chaudhuri. 2007. “Making Ban-gladesh a Leading Manpower Exporter: Chasing a Dream of US$30 Billion AnnualMigrant Remittances by 2015.” Indian Institute of Management, Calcutta.
Beam, McKenzie, and Yang 000
This content downloaded from 23.235.32.0 on Mon, 7 Dec 2015 10:35:31 AMAll use subject to JSTOR Terms and Conditions
Reyes, Fat. 2012. “14 Mall-Based Passport Offices to Serve Public by End of Year—DFA.” Philippine Daily Inquirer, July 30.
Rosenzweig, Mark R. 2012. “Thinking Small: Poor Economics; A Radical Rethinkingof the Way to Fight Global Poverty: Review Essay.” Journal of Economic Literature50, no. 1:115–27.
Sjaastad, Larry A. 1962. “The Costs and Returns of Human Migration.” Journal ofPolitical Economy 70, no. 5:80–93.
Stark, Oded, and David E. Bloom. 1985. “The New Economics of Labor Migration.”American Economic Review: Papers and Proceedings 75, no. 2:173–78.
Wilson,William Julius. 1987.The Truly Disadvantaged. Chicago: University of ChicagoPress.
World Bank. 2006. Global Economic Prospects, 2006: Economic Implications of Remit-tances. Washington, DC: World Bank.
———. 2011. “Global Bilateral Migration Database.” World Bank, Washington,DC. http://data.worldbank.org/data-catalog/global-bilateral-migration-database.
Yang, Dean. 2006. “Why Do Migrants Return to Poor Countries? Evidence fromPhilippine Migrants’ Responses to Exchange Rate Shocks.” Review of Economics andStatistics 88, no. 4:715–35.
000 E C O N O M I C D E V E L O P M E N T A N D C U L T U R A L C H A N G E
This content downloaded from 23.235.32.0 on Mon, 7 Dec 2015 10:35:31 AMAll use subject to JSTOR Terms and Conditions