36
Fixed Income Roadshow UNIQA Insurance Group AG Investor Presentation June 2015

Fixed Income Roadshow
UNIQA Insurance Group AG
Investor Presentation
June 2015

Highlights
UNIQA Group overview
Financial performance
Capital and risk management
Investment policy
Proposed transaction
Q&A
Appendix Additional information
UNIQA Investor Relations 2
Agenda

UNIQA at a glance
Key financials EURm
Organisational structure
Diversification by regions and products (GWP(b)(d) FY14) UNIQA’s geographical footprint
2012(a) 2013 2014
Gross written premiums(b) 5,543 5,886 6,064
Premiums earned (retained)(b) 5,274 5,641 5,839
Profit on ordinary activities (adjusted
for one-off items)(a) 204 308 378
Consolidated net profit 127 285 290
Combined ratio (net) (P&C) 101.3% 99.8% 99.5%
Return on Equity 8.8% 11.9% 9.9%
UNIQA Insurance Group
UNIQA Austria
Raiffeisen
Insurance
Austria
UNIQA
International
UNIQA
Reinsurance(c)
Life
Health
P&C
Health
Raiffeisen Insurance
15%
UNIQA International
39%
UNIQA Austria
46%
16%
41% Life
Health
P&C 43%
(a) Excluding Mannheimer Group in 2012, (b) Including savings portion of premiums from unit- and index-linked life insurance, (c) No active external business, (d) Excluding consolidation and UNIQA Reinsurance
UNIQA Investor Relations 3
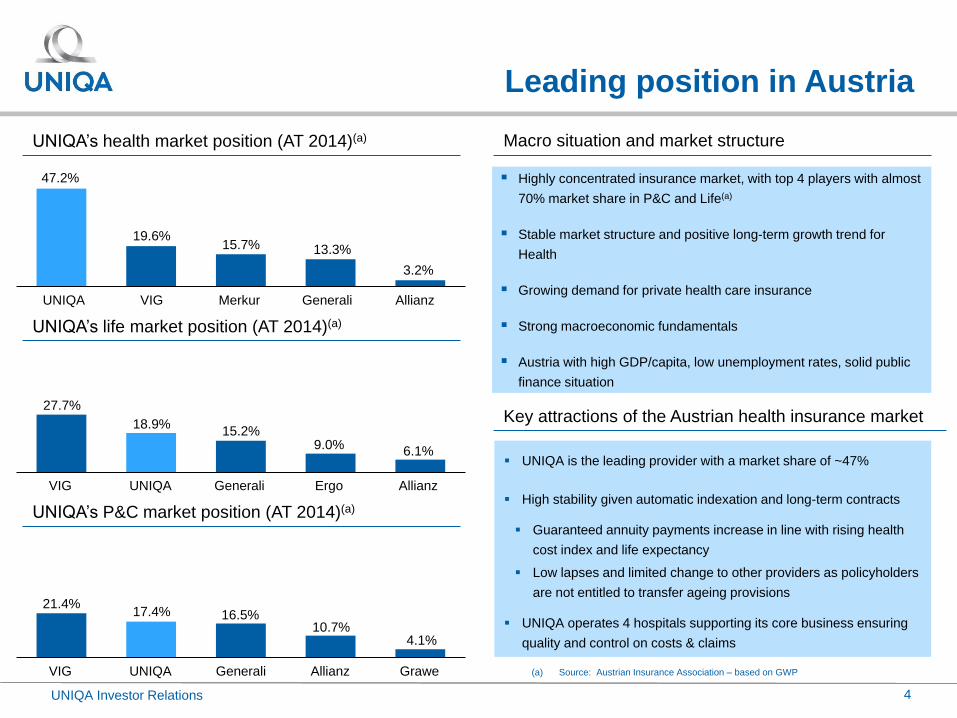
Leading position in Austria
Market shares in Austria(a) Macro situation and market structure
17.7%
20.7%
Overall
47.6% Health
Life
22.1%
P&C 2
1
2
2
Highly concentrated insurance market, with top 4 players with almost
70% market share in P&C and Life(a)
Stable market structure and positive long-term growth trend for
Health
Growing demand for private health care insurance
Strong macroeconomic fundamentals
Austria with high GDP/capita, low unemployment rates, solid public
finance situation
(a) Source: Austrian Insurance Association – based on GWP
UNIQA Investor Relations 4
Key attractions of the Austrian health insurance market
UNIQA is the leading provider with a market share of ~47%
High stability given automatic indexation and long-term contracts
Guaranteed annuity payments increase in line with rising health
cost index and life expectancy
Low lapses and limited change to other providers as policyholders
are not entitled to transfer ageing provisions
UNIQA operates 4 hospitals supporting its core business ensuring
quality and control on costs & claims
UNIQA’s health market position (AT 2014)(a)
Allianz
3.2%
Generali
13.3%
Merkur
15.7%
VIG
19.6%
UNIQA
47.2%
UNIQA’s life market position (AT 2014)(a)
Allianz
6.1%
Generali
9.0%
Ergo
15.2%
VIG
18.9%
UNIQA
27.7%
UNIQA’s P&C market position (AT 2014)(a)
Allianz
4.1%
Generali
10.7%
Grawe
16.5%
VIG
17.4%
UNIQA
21.4%

Broad CEE platform
Broad CEE platform with 15 core markets
Central Europe (CE)
GWP: €805m
Share of GWP: 62.2%
Eastern Europe (EE)
GWP: €166m
Share of GWP: 12.8%
South Eastern Europe (SEE)
GWP: €257m
Share of GWP: 19.8%
Source: Company information
(a) Annual insurance premiums per capita; 2013 data (b) Excluding Republica Srpska (c) UA exclusive Kremeny & Lemma
Source: Supervisory Authorities
(b)
(c)
2.154
2.066
1.954
503
401357275
272151
12211789827856534419
CH
5.790
DE
2.238
EU
IT
AT
UA
KS
AL
BG
ME
RO
BA
RS
MK
CZ
SK
PL
HU
HR
RU
Austria in 1955 – 1971
Austria in
1977 – 1984
Insurance(a) density
5 UNIQA Investor Relations
Russia
GWP: €66m
Share of GWP: 5.2%

Multi-channel distribution and strategic
bancassurance agreements with Raiffeisen
Austria GWP(a) by distribution channel CEE GWP(a) by distribution channel
(a) FY 2014GWP including savings portion from unit- and index-linked life insurance, excluding single premiums
24%
Direct and others
5%
Brokers and multi agencies
24%
Own employees
and exclusive agencies 47%
Bank
20%
Direct and others
6%
Brokers
36%
Own sales force and
exclusive agencies 38%
Bank
~1,700 employees
~420 locations Exclusive sales
~3,800 brokers
UNIQA is #1 in the segment Brokers
~ 2,200 locations (RBI network) Banks
UNIQA Investor Relations 6
Integrative direct sales Direct sale
~1,500 locations Exclusive sales
As strong as exclusive sales Brokers
~ 3,000 locations (RBI network) Banks
Integrative direct sales Direct sale

Consistently profitable after successful
restructuring, with capital base strengthened
UNIQA Investor Relations
Dividends per share (EUR)
FY14(a)
0.42
FY13
0.35
FY12
0.25
Economic capital ratio
FY14
150%
FY13
161%
FY12
108%
(a) Proposal to the Annual General Meeting
(b) 2.4% 1Q 2015 ROE. 9.7% annualised ROE based on average equity FY14: EUR 3bn, Mar15: EUR 3.3bn
7
41% 38% 45%
Pay out ratio
FY14
295%
FY13
287%
FY12
215%
1Q15
302%
Solvency I ratio
Return on equity
FY14
9.9%
FY13
11.9%
FY12
8.8%
1Q15(b)
9.7%

A clear long-term strategy
Our long-term ambition
Leading primary insurer in Austria and CEE, with significantly
improved efficiency and profitability
Double our number of clients from 7.5m in 2010 to 15m in 2020
Our target 2015
(embedded in UNIQA 2.0)
Focus on our business as primary insurer in our two core
markets Austria and CEE
Increase profitability through
restructuring
Increase productivity
Profitable growth in CEE
Value-oriented management
Strong and sustainable capital position
Attractive dividend policy
UNIQA Austria
Raiffeisen Insurance
Austria
UNIQA International
Risk and return profile
UNIQA Investor Relations 8

UNIQA 2.0 update
UNIQA Investor Relations
Note: 2012 figure excluding Mannheimer Group (sold in June 2012)
We aim to raise our number of customers to
15m by 2020 (from 7.5m in 2010)
10.1m customers per Mar 15
Increase
number of
clients
UNIQA Austria: increasing profitability
Raiffeisen Insurance Austria: increasing
productivity
UNIQA International: profitable growth in CEE
Risk and return profile: value oriented
management
Execute
4 priority
programs
As of Dec 2014 ECR of 150% Strengthen equity
base
Concentration on stable market Austria and growth region CEE
Simplified corporate structure
Sale of non-core participations and strategic withdrawal from Germany since 2011
Concentrate on core
insurance business
UNIQA 2.0: We keep track despite headwinds Development of profit on ordinary activities (EURm)
9
204
308
378
1Q15
Target 425-450
2014 2013 2012
94

Highlights
UNIQA Group overview
Financial performance
Capital and risk management
Investment policy
Proposed transaction
Q&A
Appendix Additional information
UNIQA Investor Relations 10
Agenda

Net profit up by 38% in 1Q15
UNIQA Investor Relations
(a) Including savings portion of premiums from unit- and index-linked life insurance
(b) Definition investment yield: annualized investment result divided by average total investments excluding self-used land and buildings.
11
EURm 1Q14 1Q15 %
Gross premiums written(a)
1,702.6 2,039.5 19.8%
Premiums earned (retained)(a)
1,492.8 1,823.9 22.2%
Premiums earned (retained) 1,370.9 1,707.7 24.6%
Net investment income 152.9 237.2 55.1%
Insurance benefits -1,098.9 -1,485.9 35.2%
Operating expenses (net) -325.8 -335.7 3.0%
thereof admin costs -101.0 -90.1 -10.7%
Insurance technical result 41.2 25.4 -38.5%
Profit on ordinary activities 81.4 94.0 15.5%
Consolidated profit 55.9 76.9 37.6%
Cost ratio group (net) 21.8% 18.4% -3.4pp
Combined ratio P&C (net) 97.9% 98.8% 0.9pp
Investment yield(b)
2.8% 3.8% 1pp
Gross written premiums(a)
increased by 19.8% (20.8%
FX-adjusted)
Net combined ratio increased
to 98.8% (97.9% in 1Q14)
Net cost ratio ahead of plan:
18.4% (21.8% in 1Q14)
Other operating expenses
reduced by 10.7% compared to
1Q14
Profit on ordinary activities up
by 15.5% to EUR 94.0m
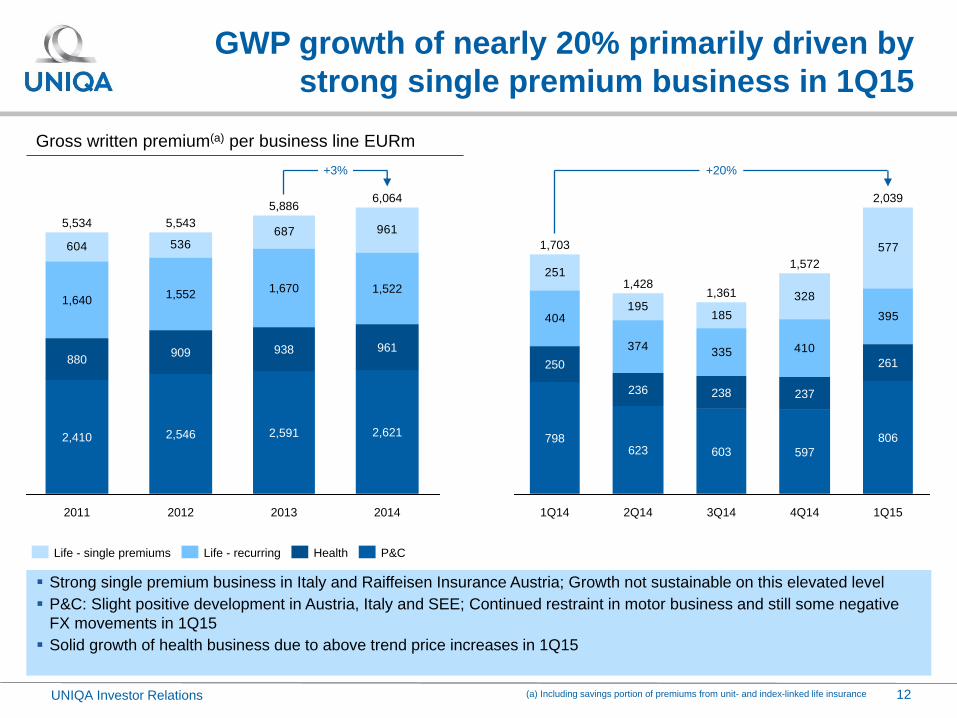
GWP growth of nearly 20% primarily driven by
strong single premium business in 1Q15
UNIQA Investor Relations
Strong single premium business in Italy and Raiffeisen Insurance Austria; Growth not sustainable on this elevated level
P&C: Slight positive development in Austria, Italy and SEE; Continued restraint in motor business and still some negative
FX movements in 1Q15
Solid growth of health business due to above trend price increases in 1Q15
Gross written premium(a) per business line EURm
(a) Including savings portion of premiums from unit- and index-linked life insurance
604 536687 961
+3%
2014
6,064
2,621
961
1,522
2013
5,886
2,591
938
1,670
2012
5,543
2,546
909
1,552
2011
5,534
2,410
880
1,640
P&C Health Life - recurring Life - single premiums
404
374335 410
395
251
195185
328
577
261
+20%
806
2,039
1Q15 4Q14
597
1,572
237
3Q14
1,361
603
238
2Q14
1,428
623
236
1Q14
1,703
798
250
12
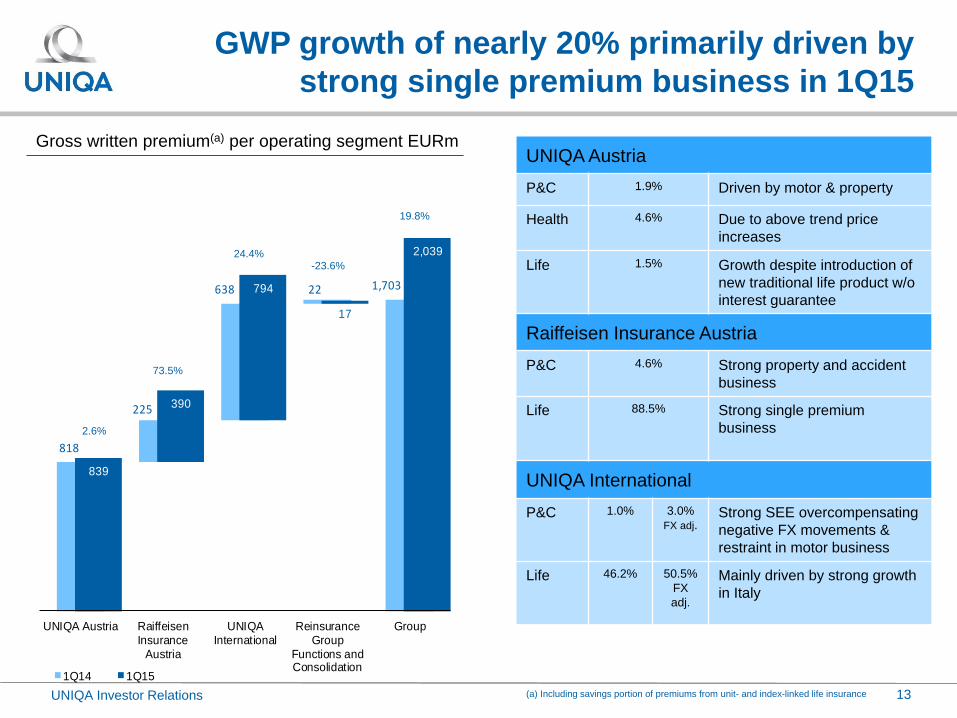
818
225
638 22 1,703
839
390
794
17
2,039
UNIQA Austria RaiffeisenInsurance
Austria
UNIQAInternational
ReinsuranceGroup
Functions andConsolidation
Group
1Q14 1Q15
UNIQA Investor Relations
Gross written premium(a) per operating segment EURm
(a) Including savings portion of premiums from unit- and index-linked life insurance
2.6%
73.5%
24.4% -23.6%
19.8%
UNIQA Austria
P&C 1.9% Driven by motor & property
Health 4.6% Due to above trend price
increases
Life 1.5% Growth despite introduction of
new traditional life product w/o
interest guarantee
Raiffeisen Insurance Austria
P&C 4.6% Strong property and accident
business
Life 88.5% Strong single premium
business
UNIQA International
P&C 1.0% 3.0%
FX adj. Strong SEE overcompensating
negative FX movements &
restraint in motor business
Life 46.2% 50.5%
FX
adj.
Mainly driven by strong growth
in Italy
13
GWP growth of nearly 20% primarily driven by
strong single premium business in 1Q15

Highlights
UNIQA Group overview
Financial performance
Capital and risk management
Investment policy
Proposed transaction
Q&A
Appendix Additional information
UNIQA Investor Relations 14
Agenda

Existing subordinated capital
15 UNIQA Investor Relations
150
100
350
Subordinated instruments (EURm)
Dec 2006 Jan 2007 Jul 2013
Subordinated capital and leverage ratio (EURm)
600 600
2013 2014
21.5% 19.3%
(a) Debt over total equity. Total equity equal shareholders’ equity plus minorities
Issuer Issue Date
Next
Call
Date
Maturity Cpn Amt
(EURm)
Subordinated
UNIQA
Insurance
Group AG
31/07/2013 31/07/2023 31/07/2043 6.875% 350
Junior
Subordinated
UNIQA
Insurance
Group AG
24/01/2007 30/12/2016 Perpetual 5.342% 100
Junior
Subordinated
UNIQA
Insurance
Group AG
20/12/2006 30/12/2016 Perpetual 5.079% 150
Source: Bloomberg
Leverage ratio(a)
Total equity
(EURm) 2,785 3,102
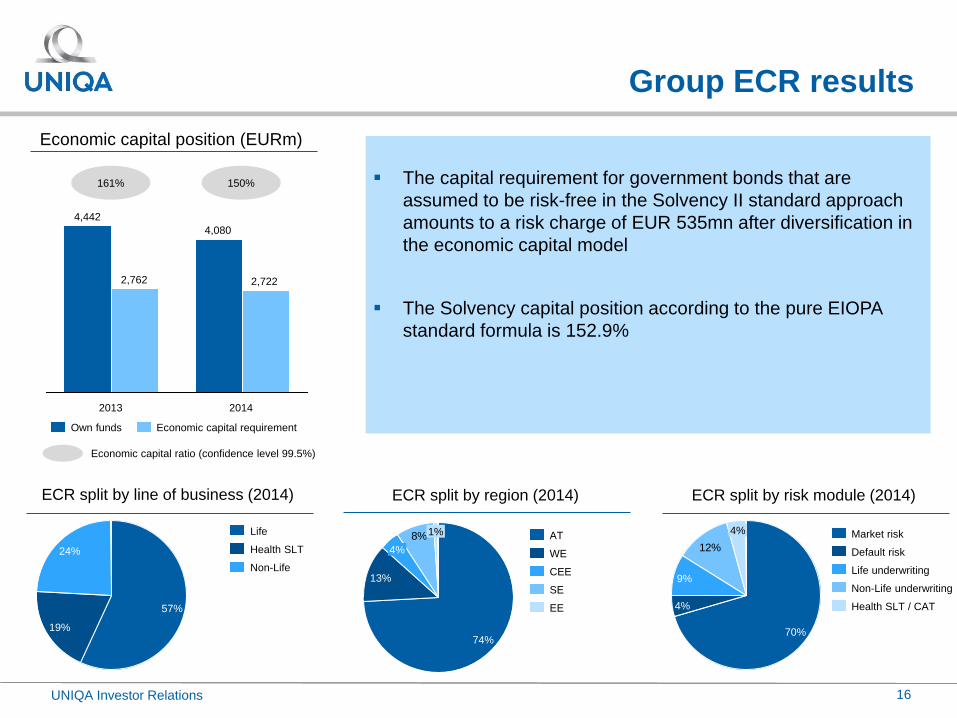
Group ECR results
2014
2,722
4,080
2013
2,762
4,442
Economic capital requirement Own funds
161%
24%
19%
57%
8%1%
4%
13%
74%
12%
4%
9%
4%
70%
ECR split by line of business (2014) ECR split by region (2014)
Non-Life
Health SLT
Life
EE
SE
CEE
WE
AT
ECR split by risk module (2014)
Health SLT / CAT
Non-Life underwriting
Life underwriting
Default risk
Market risk
The capital requirement for government bonds that are
assumed to be risk-free in the Solvency II standard approach
amounts to a risk charge of EUR 535mn after diversification in
the economic capital model
The Solvency capital position according to the pure EIOPA
standard formula is 152.9%
Economic capital position (EURm)
Economic capital ratio (confidence level 99.5%)
16
150%
UNIQA Investor Relations
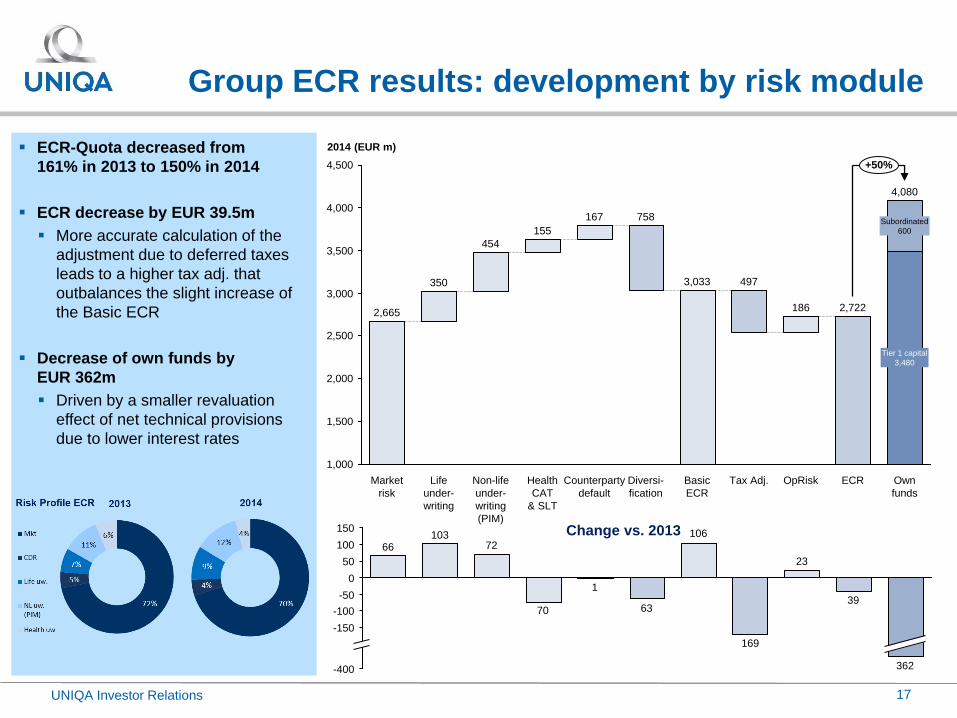
Group ECR results: development by risk module
ECR-Quota decreased from
161% in 2013 to 150% in 2014
ECR decrease by EUR 39.5m
More accurate calculation of the
adjustment due to deferred taxes
leads to a higher tax adj. that
outbalances the slight increase of
the Basic ECR
Decrease of own funds by
EUR 362m
Driven by a smaller revaluation
effect of net technical provisions
due to lower interest rates
155
Non-life
under-
writing
(PIM)
454
Life
under-
writing
350
Market
risk
2,665
Subordinated
600
ECR
2,722
3,500
186
Tax Adj.
497
Basic
ECR
3,033
Diversi-
fication
758
Counterparty
default
2014 (EUR m)
4,500
4,000
3,000
2,500
2,000
1,500
+50%
Own
funds
OpRisk
4,080
Tier 1 capital
3,480
1,000
167
Health
CAT
& SLT
150
100
50
0
-50
23
169
106
63
1
70
72 103
66
-100
-150
-400 362
39
Change vs. 2013
17 UNIQA Investor Relations
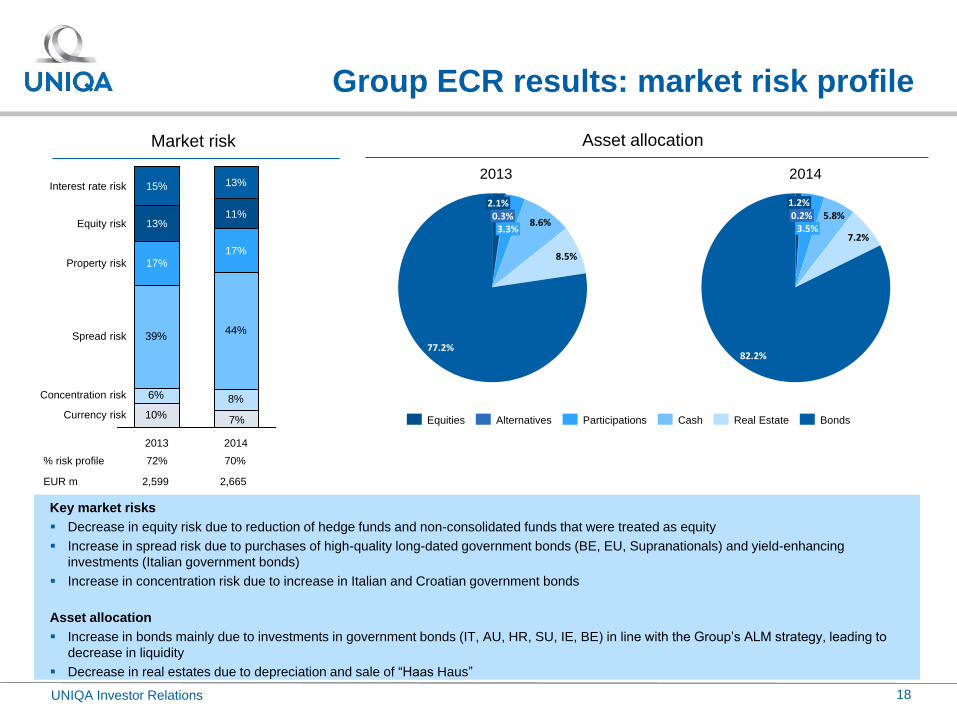
Group ECR results: market risk profile
Key market risks
Decrease in equity risk due to reduction of hedge funds and non-consolidated funds that were treated as equity
Increase in spread risk due to purchases of high-quality long-dated government bonds (BE, EU, Supranationals) and yield-enhancing
investments (Italian government bonds)
Increase in concentration risk due to increase in Italian and Croatian government bonds
Asset allocation
Increase in bonds mainly due to investments in government bonds (IT, AU, HR, SU, IE, BE) in line with the Group’s ALM strategy, leading to
decrease in liquidity
Decrease in real estates due to depreciation and sale of “Haas Haus”
Market risk
10%
6% 8%
39%44%
7%Currency risk
Concentration risk
Spread risk
Property risk
Equity risk
Interest rate risk
2014
17%
11%
13%
2013
17%
13%
15%
% risk profile 72% 70%
EUR m 2,599 2,665
Asset allocation
77.2%
8.5%
8.6% 3.3%
0.3% 2.1%
Bonds Real Estate Cash Participations Alternatives Equities
82.2%
7.2%
5.8% 3.5%
0.2% 1.2%
2013 2014
18 UNIQA Investor Relations

Highlights
UNIQA Group overview
Financial performance
Capital and risk management
Investment policy
Proposed transaction
Q&A
Appendix Additional information
UNIQA Investor Relations 19
Agenda

3.2%
1.4%
0.2%
5.8%
6.7%
82.7%
3.5%
1.2%
0.2%
5.8%
7.2%
82.2%
UNIQA Investor Relations
Investment activity
Note: Excluding unit-linked investment income Quarterly figures in 3Q2011 and prior quarters include Mannheimer Group (sold in June 2012)
In 1Q15 positive effects due to change in portfolio
structure according to new strategic asset allocation
Seasonal negative effect from participation in
STRABAG of EUR 22.0m in 1Q15 (1Q14: 19.8m)
Impairments on Heta (former HAA) senior bonds
guaranteed by Carinthia (EUR 8.7m) in 1Q15
Duration(a) increased ytd from 4.9 yrs to 5.3 yrs
Investment income EURm
Investment allocation by product
237
287
230219
153
231
159190
232
170
218204200
80103
175200
215207
250
1Q
15
4Q
14
3Q
14
2Q
14
1Q
14
4Q
13
3Q
13
2Q
13
1Q
13
4Q
12
3Q
12
2Q
12
1Q
12
4Q
11
3Q
11
-131
2Q
11
1Q
11
4Q
10
3Q
10
2Q
10
1Q
10
EUR 23.8bn
Dec14
EUR 24.9bn
Mar15
Participations Equities Alternatives Cash Real estate Bonds
20 (a) Excl. structured products and ABS; liquid assets only term deposits considered
UNIQA Investor Relations
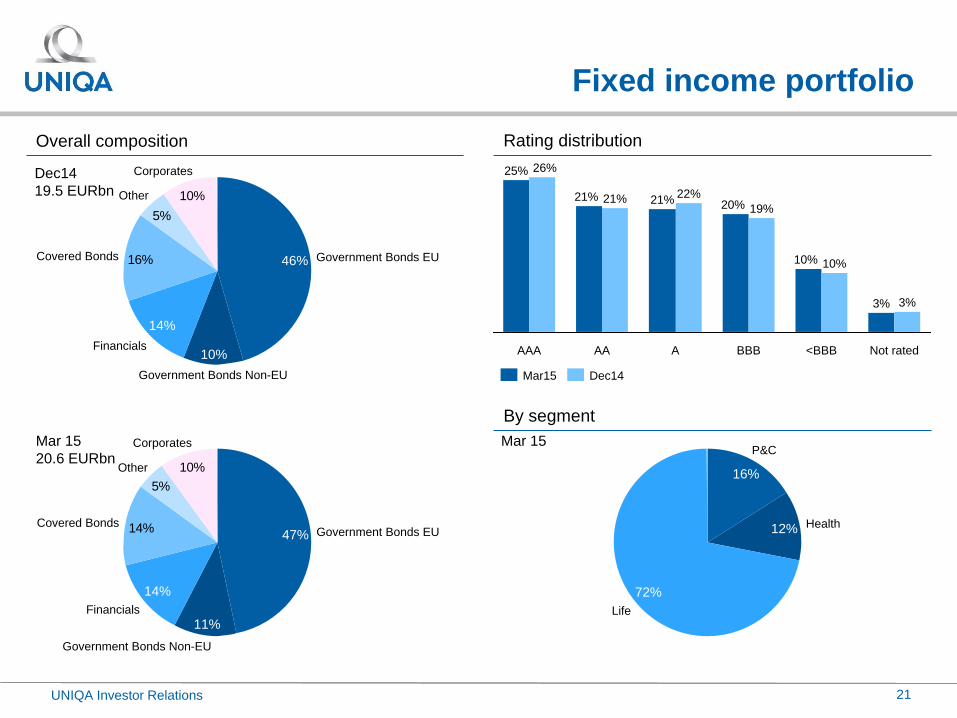
Fixed income portfolio
Overall composition Rating distribution
10%
5%
16%
Corporates
Other
Covered Bonds
Financials
14%
Government Bonds Non-EU
10%
Government Bonds EU 46%
10%
5%
14%
Corporates
Other
Covered Bonds
Financials
14%
Government Bonds Non-EU
11%
Government Bonds EU 47%
Dec14
19.5 EURbn
Mar 15
20.6 EURbn
By segment
Life
72%
Health 12%
P&C
16%
Not rated
3% 3%
<BBB
10% 10%
BBB
19% 20%
A
22% 21%
AA
21% 21%
AAA
26% 25%
Dec14 Mar15
21
Mar 15
Highlights
UNIQA Group overview
Financial performance
Capital and risk management
Investment policy
Proposed transaction
Q&A
Appendix Additional information
UNIQA Investor Relations 22
Agenda
23
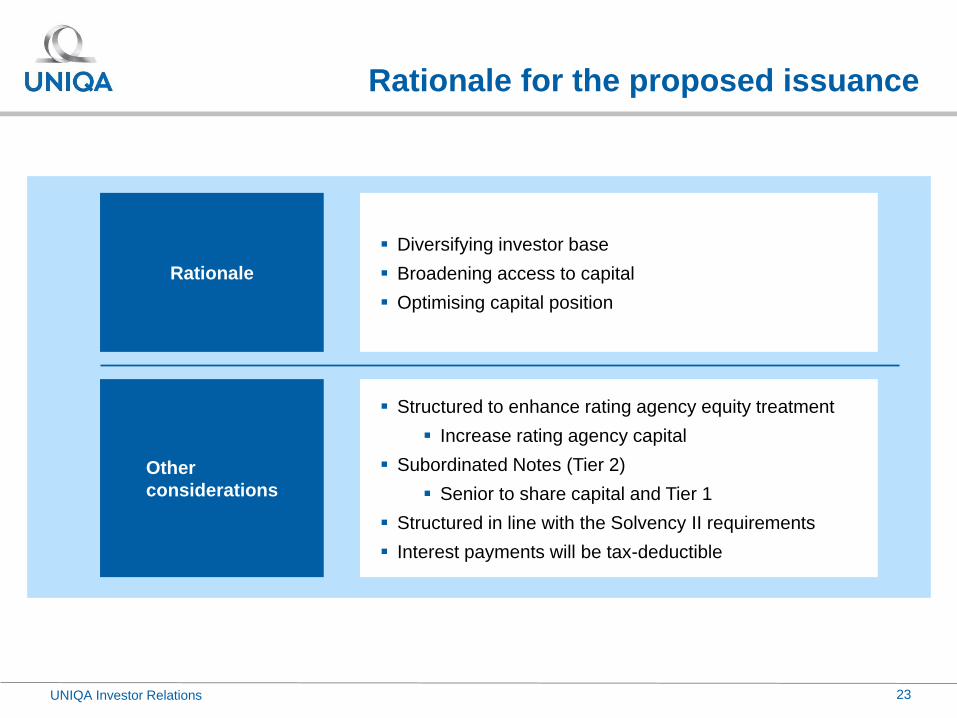
Rationale for the proposed issuance
Diversifying investor base
Broadening access to capital
Optimising capital position
Rationale
Other
considerations
Structured to enhance rating agency equity treatment
Increase rating agency capital
Subordinated Notes (Tier 2)
Senior to share capital and Tier 1
Structured in line with the Solvency II requirements
Interest payments will be tax-deductible
UNIQA Investor Relations

24
Summary of conditions of issue of the Notes
(1/2)
Issuer UNIQA Insurance Group AG
Instruments Dated Subordinated Tier 2 Notes (the “Notes“)
Ratings (S&P) Issuer rated A- by S&P
Notes expected to be rated [BBB] by S&P
Status The Notes constitute direct, unsecured and subordinated obligations of the Issuer
Final maturity date [●] [2046] (the “Scheduled Maturity Date”); or
The first floating interest payment date following the Scheduled Maturity Date on which the Redemption Conditions are fulfilled
Optional redemption [●] [2026] (“First Issuer Call Date”) and any Interest Payment Date thereafter (subject to the Redemption Conditions)
Interest [●] per cent. p.a. payable annually in arrear until First Issuer Call Date; and
[●] + [●] per cent. (3-month Euribor + initial margin and 100 bps step up) p.a. thereafter payable quarterly in arrear
Optional deferral of
Interest
Payment of Interest may be deferred at the option of the Issuer on a cumulative basis subject to no Compulsory Interest
Payment Event occurring in the prior 12 months. Interest deferred will constitute Arrears of Interest
Compulsory Interest Payment Event shall mean (i) the Issuer has resolved on, or paid, any dividend or distribution on any
class of shares, (ii) any payment on account of balance sheet profit or (iii) any repurchase of any class of shares
Mandatory
Suspension Event
Payment of Interest (or Arrears of Interest) shall be deferred on a cumulative basis (a “Mandatory Suspension Event”) if on
any interest payment date:
(a) such payment would result in the occurrence of an Insolvency Event; or
(b) an order of the supervisory authority prohibits at such time the Issuer from making payments under the Notes; or
(c) a Solvency Capital Event has occurred and is continuing or would result form such payment(1)
Interest deferred will constitute Arrears of Interest
“Insolvency Event" shall occur in respect of a payment of Interest, Arrears of Interest or principal on the Notes or a repurchase
of the Notes, if the Issuer would become insolvent in accordance with the Applicable Insolvency Law
“Solvency Capital Event” shall occur if the Issuer and/or the UNIQA Group are not sufficient to cover the required minimum
solvency margin (or a comparable term in case of a change in applicable rules) in accordance with Applicable Supervisory Law
UNIQA Investor Relations
1. Unless (i) on or prior to such date the supervisory authority has exceptionally given, and not withdrawn by such date, its prior approval to the payment of the relevant interest and/or Arrears of Interest despite the Solvency Capital Event; and (ii) the payment of the relevant interest and/or Arrears of Interest on the Notes does not further weaken the solvency position of the Issuer and/or UNIQA Group; and (iii) the minimum capital requirement (MCR) (howsoever described in the applicable supervisory law) pursuant to the applicable supervisory law is complied with after the payment of the relevant interest and/or Arrears of Interest is made.

25
Summary of conditions of issue of the Notes
(2/2)
Payment of Arrears of
Interest
The Issuer will be entitled to pay outstanding Arrears of Interest (in whole or in part) at any time if no Mandatory Suspension
Event has occurred and is continuing, and if payment would not result in an insolvency event
Arrears of Interest shall become due and payable (in whole but not in part), provided that (A) no Solvency Capital Event has
occurred or is continuing and (B) the supervisory authority has given its prior consent upon the earlier of:
(a) the date on which the Notes fall due for redemption in accordance;
(b) the calendar day on which an order is made for the winding-up, dissolution or liquidation of the Issuer;
(c) the next Compulsory Interest Payment Date
Early Redemption
Events
Subject to the Redemption Conditions, the Issuer may redeem the Notes upon the occurrence of:
(a) a gross-up event or a tax event; or
(b) a regulatory event; or
(c) an accounting event; or
(d) a ratings agency event
Redemption
Conditions
(a) a redemption payment or a repurchase of the Notes would not result in an insolvency event; and
(b) no Solvency Capital Event has occurred and is continuing or would be caused by the redemption or the repurchase of the
Notes(1); and
(c) the supervisory authority has given its prior consent; and
(d) prior to the First Issuer Call Date, the capital has been replaced by another tier 1 or tier 2 basic own-fund item of at least
the same quality
Governing law German law (except for Status under Austrian law)
Format RegS
Listing Vienna
Denomination €100,000
Regulatory treatment Tier 2 own-funds under Solvency II
Accounting treatment Liability / Debt under IFRS
UNIQA Investor Relations
1. Unless (i) the supervisory authority has exceptionally given, and not withdrawn by such date, its prior approval to the redemption of the Notes and the payment of the redemption amount or to the repurchase of the Notes despite the Solvency Capital Event; and (ii) the capital is replaced by another tier 1 or tier 2 basic own-fund item of at least the same quality with the approval of the supervisory authority; and (iii) the minimum capital requirement (MCR) (howsoever described in the applicable supervisory law) pursuant to the applicable supervisory law is complied with after the redemption of the Notes and the payment of the redemption amount or the repurchase of the Notes is made
Highlights
UNIQA Group overview
Financial performance
Capital and risk management
Investment policy
Proposed transaction
Q&A
Appendix Additional information
UNIQA Investor Relations 26
Agenda

Highlights
UNIQA Group overview
Financial performance
Capital and risk management
Investment policy
Proposed transaction
Q&A
Appendix Additional information
UNIQA Investor Relations 27
Agenda
Other operating expenses Acquisition related expenses Net commissions (including change in DAC)
54 64 56 6660
171 170 164168 185
+3.0%
1Q15
336
90
4Q14
331
97
3Q14
319
99
2Q14
324
90
1Q14
326
101
18.4%
21.0%
23.5% 22.9% 21.8%
219
247
666
673
239
235
674
680
387
-6.3%
2014
1,299
2013
1,387
472
2012
1,319
399
2011
1,413
528
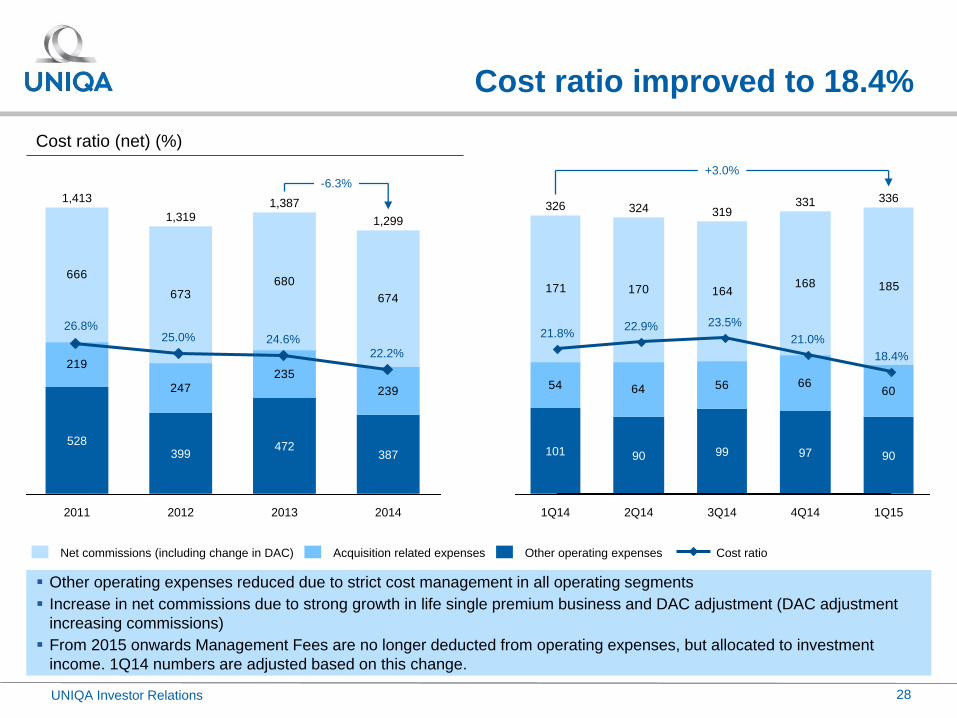
Cost ratio improved to 18.4%
UNIQA Investor Relations
Other operating expenses reduced due to strict cost management in all operating segments
Increase in net commissions due to strong growth in life single premium business and DAC adjustment (DAC adjustment
increasing commissions)
From 2015 onwards Management Fees are no longer deducted from operating expenses, but allocated to investment
income. 1Q14 numbers are adjusted based on this change.
Cost ratio (net) (%)
26.8% 25.0%
22.2% 24.6%
Cost ratio
28
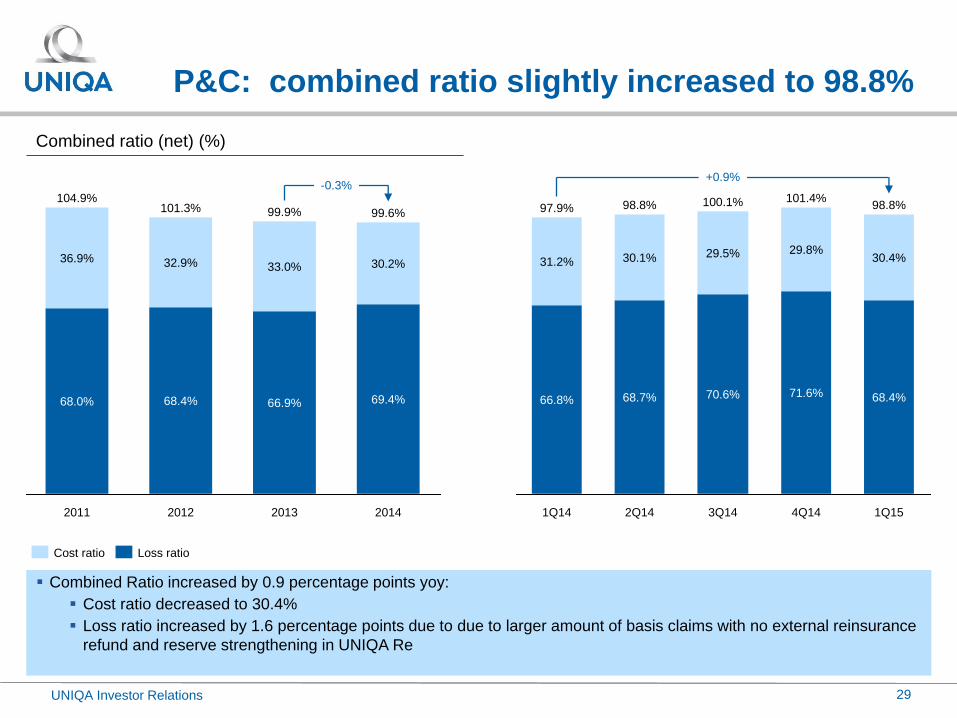
P&C: combined ratio slightly increased to 98.8%
UNIQA Investor Relations
Combined Ratio increased by 0.9 percentage points yoy:
Cost ratio decreased to 30.4%
Loss ratio increased by 1.6 percentage points due to due to larger amount of basis claims with no external reinsurance
refund and reserve strengthening in UNIQA Re
Combined ratio (net) (%)
-0.3%
2014
99.6%
69.4%
30.2%
2013
99.9%
66.9%
33.0%
2012
101.3%
68.4%
32.9%
2011
104.9%
68.0%
36.9%
Loss ratio Cost ratio
4Q14 3Q14
66.8% 68.4%
1Q15
101.4% 98.8%
+0.9%
30.4%
70.6% 71.6%
29.5% 29.8%
100.1% 98.8%
68.7%
2Q14
97.9%
30.1%
1Q14
31.2%
29

P&C: improved EBT mainly driven by higher
investment result
UNIQA Investor Relations
Net premiums earned EURm Investment result EURm Earnings before taxes EURm
30
621 630 619 613 626
+2%
FY14
2,483
FY13
2,441
4Q14 3Q14 2Q14 1Q14
18
34
45
39
45
+36%
135
99
22
29
18
-7
32
47
61
+30%
+1%
+150%
1Q15 4Q14 3Q14 2Q14 1Q14 1Q15 FY14 FY13
+45%
4Q14 3Q14 2Q14 1Q14 1Q15 FY14 FY13
Moderate growth driven by casualty and property business; Competitive motor business in CEE reduced
UNIQA International CR improved significantly to 97.0% in 1Q15 (101.4% 1Q14)
UNIQA AT net CR worsened as a result of changed internal reinsurance contracts
EBT increased mainly due to higher net investment result reflecting higher realized and unrealized gains

Health: investment result increased
UNIQA Investor Relations
Cost – benefit ratio (%) Investment result EURm Earnings before taxes EURm
31
10
33
41
36
48
+48%
117
79
15
35
42 38
48
+55%
130
84
-1%
98%
81%
17%
99%
82%
17%
99%
84%
16%
83%
15%
99%
83%
16%
98%
81%
17%
Benefit Ratio
Cost ratio
20%
79%
100%
+2%
FY14 FY13 4Q14 3Q14 2Q14 1Q14 1Q15 FY14 FY13 4Q14 3Q14 2Q14 1Q14 1Q15
+380% +220%
FY14 FY13 4Q14 3Q14 2Q14 1Q14 1Q15
99%
Health business continued to grow due to above trend adjustments to premiums
Underwriting result: Cost slightly decreased but benefit ratio increased in 1Q15 compared to very low benefit ration in 1Q14
EBT increased mainly reflecting higher net investment result driven by unrealised gains on fixed income and gains on sale
of real estate

Life: Solid investment result and increased
policyholder participation drove result
UNIQA Investor Relations
Reserve (net) EURbn Investment result EURm Earnings before taxes EURm
32
124
151 143
212
144
+2%
613 602
+6%
20.2
98
19.0
99
20.2
147
20.1
69
20.0
75
19.5
95
Margin on Reserves(a)(bps)
45
36 34
72
14
+6%
187
177
(a) Definition margin on reserves: operating result divided by average technical reserves
20.6
57
+6%
FY14 FY13 4Q14 3Q14 2Q14 1Q14 1Q15
+16%
FY14 FY13 4Q14 3Q14 2Q14 1Q14 1Q15
-69%
FY14 FY13 4Q14 3Q14 2Q14 1Q14 1Q15
Reserves increased mainly driven by strong single premium business in Italy and Raiffeisen Insurance Austria
Strategic asset allocation & real estate portfolio transformation reflected in strong investment result despite impairment of
Hypo Alpe Adria bonds
Increased deferred policyholder participation as result of different valuation methods between IFRS and local GAAP
Interest environment affecting life business to be the key issue for coming years

Group balance sheet
UNIQA Investor Relations
Assets Liabilities
EURm Mar15 Dec14
A. Tangible assets
282.8 283.5 -0.2%
B. Land and buildings held as financial
investments 1,476.0 1,504.5 -1.9%
C. Intangible assets 0.0 0.0
1,528.6 1,517.1 0.8%
D. Shares in associated companies 494.1 528.7 -6.5%
E. Investments 0.0 0.0
21,851.4 20,629.4 5.9%
F. Investments held on account and at risk
of life insurance policyholders 5,434.3 5,386.6 0.9%
G. Share of reinsurance in technical
provisions 580.0 563.5 2.9%
H. Share of reinsurance in technical
provisions held on account and at risk of
life insurance policyholders
338.6 333.0 1.7%
I. Receivables, including receivables under
insurance business 1,052.7 1,094.5 -3.8%
J. Receivables from income tax 54.6 53.9 1.3%
K. Deferred tax assets 6.2 6.6 -6.1%
L. Liquid funds 855.9 975.8 -12.3%
M. Assets in disposal groups available for
sale 0.0 161.1 0.0%
Total assets 33,955.2 33,038.2 2.8%
EURm Mar15 Dec14
A. Total equity 3,292.1 3,102.4 6.1%
I. Shareholder equity 3,267.8 3,082.2 6.0%
B. Subordinated liabilities 600.0 600.0 0.0%
C. Technical provisions 0.0 0.0
21,861.6 21,220.1 3.0%
D. Technical provisions held on account
and at risk of life insurance policyholders 5,333.7 5,306.0 0.5%
E. Financial liabilities 78.1 49.2 58.7%
F. Other provisions 853.3 833.9 2.3%
G. Payables and other liabilities 1,485.9 1,368.8 8.6%
H. Liabilities from income tax 41.7 43.3 -3.7%
I. Deferred tax liabilities 408.8 355.4 15.0%
J. Liabilities in disposal groups available
for sale 0.0 159.1 0.0%
Total equity and liabilities 33,955.2 33,038.2 2.8%
33

Group embedded value
Group embedded value Life & Health Property & Casualty Total Change
over
period after minorities, in EUR m 2014 2013 2014 2013 (*) 2014 2013 (*)
Free surplus 482 334
Required capital 538 652
Adjusted net asset value 1,019 986 1,581 1,503 2,601 2,489 4%
Present value of future profits 2,081 2,120 n/a n/a 2,081 2,120 -2%
Cost of options and guarantees -305 -217 n/a n/a -305 -217 41%
Frictional cost of required capital -52 -81 n/a n/a -52 -81 -36%
Cost of residual non-hedgeable risk -150 -119 n/a n/a -150 -119 25%
Value of in-force business 1,574 1,703 n/a n/a 1,574 1,703 -8%
GEV / MCEV 2,593 2,689 1,581 1,503 4,175 4,192 0%
GEV / MCEV (before minorities) 2,604 2,702 1,597 1,515 4,201 4,217 0%
(*)restated
GEV changed by
-0.4% to EUR 4,175m
Decrease driven by
value of in-force
business due to lower
interest rates and
higher implied volatility
Decrease in VIF partly
offset by strong
operative development
due to expenses
improvement for
Austrian Life & Health
and new business value
Return on GEV
amounts to EUR +98m
or +2.4%
34 UNIQA Investor Relations

UNIQA Investor Relations
Shareholder structure
Current shareholder structure Free float geographic distribution
Treasury shares
0.3%
Collegialität
Versicherungsverein
Privatstiftung
2.3% UNIQA
Versicherungsverein
Privatstiftung
30.6%
Raiffeisen Zentralbank
31.4%
Free float
35.4%
Rest of World
11.6%
Germany
3.9%
France
4.4%
Austria 7.7%
Poland 8.9%
United States
20.7%
United Kingdom
42.8%
Source: Company information
35

This presentation (the "Presentation"), and the information contained therein, is not directed to, or intended for viewing, release, distribution, publication or use by (directly or indirectly, in whole or in part), any person or entity that is a citizen of, or resident or located in, the United States, Australia, Canada or Japan or any jurisdiction where applicable laws prohibit its viewing, release, distribution, publication or use.
This Presentation is being provided for information purposes to selected recipients only and does not constitute or form part of, and should not be construed as an offer or invitation or recommendation to, purchase or sell or subscribe for, or any solicitation of any offer to purchase or subscribe for any securities in UNIQA Insurance Group AG, a stock corporation organised under Austrian law (the "Company"), in any jurisdiction. Neither the Presentation, nor any part of it nor anything contained or referred to in it, nor the fact of its distribution, should form the basis of or be relied on, in connection with, or act as an inducement in relation to, a decision to purchase or subscribe for or enter into any contract or make any other commitment whatsoever in relation to any such securities.
The contents of this Presentation and any information relating to the Company received (whether in written or oral form) are confidential and may not be copied, distributed, published or reproduced, directly or indirectly, in whole or in part, or disclosed or distributed by recipients to any other person.
The information contained in this Presentation has been provided by the Company and has not been verified independently. Unless otherwise stated, the Company is the source of information.
No reliance may be placed for any purpose whatsoever on the information or opinions contained in the Presentation or on its completeness, accuracy of fairness. No representation or warranty, express or implied, is made or given by or on behalf of the Company or any of its respective directors, officers, employees, agents or advisers as to the accuracy, completeness or fairness of the information or opinions contained in the Presentation and no responsibility or liability is accepted by any of them for any such information or opinions. In particular, no representation or warranty is given as to the achievement or reasonableness of, and no reliance should be placed on any projections, targets, estimates or forecasts contained in this Presentation and nothing in this Presentation is or should be relied on as a promise or representation as to the future.
This Presentation contains forward-looking statements based on the currently held beliefs and assumptions of the management of the Company, which are expressed in good faith and, in their opinion, reasonable. Forward-looking statements involve known and unknown risks, uncertainties and other factors, which may cause the actual results, financial condition, performance, or achievements of the Company, or industry results, to differ materially from the results, financial condition, performance or achievements expressed or implied by such forward-looking statements. Given these risks, uncertainties and other factors, recipients of this document are cautioned not to place undue reliance on these forward-looking statements.
All features in this Presentation are current at the time of publication but may be subject to change in the future. The Company disclaims any obligation to update or revise any statements, in particular forward-looking statements, to reflect future events or developments.
Statements contained in this Presentation regarding past events or performance should not be taken as a guarantee of future events or performance.
Prospective recipients should not treat the contents of this Presentation as advice relating to legal, taxation or investment matters, and are to make their own assessments concerning such matters and other consequences of a potential investment in the Company and its securities, including the merits of investing and related risks.
In receiving any information relating to the Company (whether in written or oral form), including information in this Presentation, you will be deemed to have represented and agreed for the benefit of the Company (i) that you will only use such information for the purposes of discussions with the Company, (ii) to hold such information in strict confidence and not to disclose it (or any discussions with the Company) to any person, except as may be required by law, regulation or court order, (iii) not to reproduce or distribute (in whole or in part, directly or indirectly) any such information, (iv) that you are permitted, in accordance with all applicable laws, to receive such information, and (v) that you are solely responsible for your own assessment of the market position of the Company and that you will conduct your own analysis and be solely responsible for forming your own view of the potential future performance of the Company's business.
Disclaimer
UNIQA Investor Relations
36


