Unit 1: Day 1: A Survey of Surveys Minds On: 20 Learning Goal : Analyze a variety of surveys or questionnaires taken from different sources Determine the characteristics of an effective survey or questionnaire Materials BLM 1.1.1 BLM 1.1.2 BLM 1.1.3 BLM 1.1.4 BLM 1.1.5 Action: 35 Consolidate :20 Total=75 min Assessment Opportunities Minds On… Whole Class Discussion Being that this is your first day with this class, start by introducing yourself and doing all the first day stuff you would normally do. Whole Class Brainstorming Introduce the first unit of the course – Working with Data, and describe the learning goals of today’s lesson. Ask students to brainstorm and discuss the following questions: What is a survey? Why are surveys used? Are all surveys good? What makes a ‘good’ survey? If you can find some magazines/ newspapers that have quizzes or surveys in them, bring them use them with the BLMs or in place of them. Literacy strategy: Brainstorming. If you have access to a computer lab, students can also evaluate online surveys: E.g., http:// www.oakton.edu/ learn/ stressvy.htm http:// medicalcenter.o su.edu/files/ survey/ stress.cfm Personality surveys are much better online because they give results. Depending on how times are modified for the first day, this lesson may need to be continued on the Action! Small Groups Activity Instructions Have students read through BLM 1.1.1, and modify or add to the list of questions to ask about a good survey/questionnaire. Tell the class about the 4 surveys/questionnaires topics on BLM1.1.2, 1.1.3, 1.1.4 and 1.1.5 and have them form groups based on the survey/questionnaire they would like to evaluate. Handout one set (there are 2 surveys for each topic) of surveys/questionnaires to each student to read through and discuss with their group. Expectations/Observation/Anecdotal comments: Circulate while students discuss their surveys as a group and give them feedback/encouragement. Mathematical Process Focus: Reflecting Students will reflect on the questions given and determine how valid they are and how helpful they will be in analysing data. MAP 4C: Unit 1 – Working with Data (Draft – August 2007) Last saved 13/03/2022 at 5:15 AM 1
Transcript
Unit 1: Day 1: A Survey of Surveys
Minds On: 20Learning Goal: Analyze a variety of surveys or questionnaires taken from different sources Determine the characteristics of an effective survey or questionnaire
Being that this is your first day with this class, start by introducing yourself and doing all the first day stuff you would normally do.
Whole Class Brainstorming Introduce the first unit of the course – Working with Data, and describe the learning goals of today’s lesson. Ask students to brainstorm and discuss the following questions: What is a survey? Why are surveys used? Are all surveys good? What makes a ‘good’ survey?
If you can find some magazines/ newspapers that have quizzes or surveys in them, bring them use them with the BLMs or in place of them.
Literacy strategy: Brainstorming.
If you have access to a computer lab, students can also evaluate online surveys: E.g., http://www.oakton.edu/learn/stressvy.htm
Personality surveys are much better online because they give results.
Depending on how times are modified for the first day, this lesson may need to be continued on the second day – in particular the presentations..
Highlight the difference between an open and a closed survey question.
Action! Small Groups Activity Instructions Have students read through BLM 1.1.1, and modify or add to the list of questions to ask about a good survey/questionnaire.Tell the class about the 4 surveys/questionnaires topics on BLM1.1.2, 1.1.3, 1.1.4 and 1.1.5 and have them form groups based on the survey/questionnaire they would like to evaluate. Handout one set (there are 2 surveys for each topic) of surveys/questionnaires to each student to read through and discuss with their group.
Expectations/Observation/Anecdotal comments: Circulate while students discuss their surveys as a group and give them feedback/encouragement.
Mathematical Process Focus: Reflecting Students will reflect on the questions given and determine how valid they are and how helpful they will be in analysing data.
Consolidate Debrief
Small Groups Presentations Have each group give a short summary of their findings.Whole Class Summary From the presentations given, have the class help you create a list of requirements for creating a good survey/questionnaire.
ExplorationApplication
Home Activity or Further Classroom ConsolidationDesign 3 open questions and 3 closed questions that can be used a survey to gather data about this class.
MAP 4C: Unit 1 – Working with Data (Draft – August 2007)Last saved 08/05/2023 at 9:06 PM 1
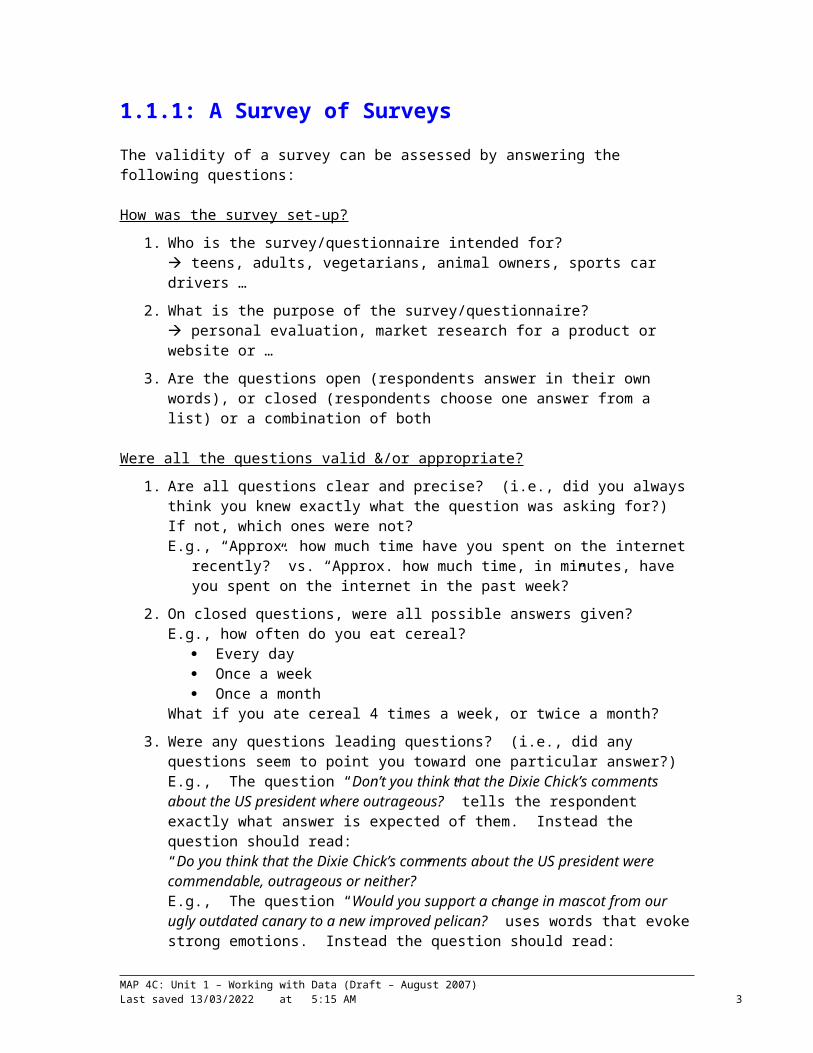
1.1.1: A Survey of SurveysThe validity of a survey can be assessed by answering the following questions:
How was the survey set-up?
1. Who is the survey/questionnaire intended for? teens, adults, vegetarians, animal owners, sports car drivers …
2. What is the purpose of the survey/questionnaire? personal evaluation, market research for a product or website or …
3. Are the questions open (respondents answer in their own words), or closed (respondents choose one answer from a list) or a combination of both
Were all the questions valid &/or appropriate?
1. Are all questions clear and precise? (i.e., did you always think you knew exactly what the question was asking for?) If not, which ones were not?E.g., “Approx. how much time have you spent on the internet recently?” vs.
“Approx. how much time, in minutes, have you spent on the internet in the past week?”
2. On closed questions, were all possible answers given?E.g., how often do you eat cereal?
Every day Once a week Once a month
What if you ate cereal 4 times a week, or twice a month?
3. Were any questions leading questions? (i.e., did any questions seem to point you toward one particular answer?)E.g., The question “Don’t you think that the Dixie Chick’s comments about the US president where outrageous?” tells the respondent exactly what answer is expected of them. Instead the question should read:“Do you think that the Dixie Chick’s comments about the US president were commendable, outrageous or neither?”E.g., The question “Would you support a change in mascot from our ugly outdated canary to a new improved pelican?” uses words that evoke strong emotions. Instead the question should read: “Would you support a change in mascot from the canary to a pelican?”
4. Are the survey questions relevant? If not, which ones are not? Why?
5. Are any questions in the survey biased?
Your Task:In your groups read through the surveys/questionnaires you have been given and think about possible answers that you and others could give.
Overall, which of the two surveys do you think was better? Why?
MAP 4C: Unit 1 – Working with Data (Draft – August 2007)Last saved 08/05/2023 at 9:06 PM 2
1.1.2: Matchmaker Matchmaker Make Me a MatchMatchmaker surveys from: http://www.matchmake.com/usa/questionnaires/quest-1.htm
Matchmaker Questionnaire #1 Fun - more radical...You are?
1) male2) female
What grade are you in?12) grade 1211) grade 1110) grade 109) grade 98) grade 87) grade 76) grade 6ST) teacher
3. What age do you prefer to hang with?1) doesn't matter2) younger3) older4) same age only5) same age and younger6) same age and older
4. Your current hair color is:1) blonde2) not-so blonde3) brown4) red5) black6) mixed
5. What hair color do you prefer on others?1) doesn't matter2) blonde3) not-so blonde4) brown5) red6) black7) mixed
6. Standing up straight you're:1) under 4'9"2) 4'9" to 5'0"3) 5'1" to 5'4"4) 5'5" to 5'8"5) 5'9" to 6'0"6) over 6'0"
7. What height do you prefer?1) doesn't matter2) under 4'9"3) 4'9" to 5'0"4) 5'1" to 5'4"5) 5'5" to 5'8"6) 5'9" to 6'0"7) over 6'0"
8. The best thing you have going is:1) incredible intelligence2) gut-splitting humour3) amazing honesty4) super looks5) compassionate caring6) exceptional enthusiasm
9. What do you look for first in others?1) doesn't matter2) intelligence3) sense of humour4) honesty5) looks6) caring7) enthusiasm
10. The most annoying sound is:1) fingernails on a chalkboard2) your parents' disco soundtrack3) busy signal on the phone4) the school buzzer
9. The most over used saying is:1) cool2) sweet3) dude4) hey baby5) f'get about it
10. During a test I:1) fire on all cylinders2) chug along3) hope the hamster in my head doesn't sleep
11. I get my news flashes from the:1) newspaper2) internet3) TV4) radio5) bathroom walls
12. My CD collection has:1) 1-10 CD's2) 20-50 CD's3) they call me DJ for short
13. When you want to meet someone you:1) call them on the phone2) send an E-mail / text them3) say hello in person4) try the mind meld
14. How many colors are in the rainbow?1) about 42) about 73) about 94) let me call my leprechaun friend
15. After school I usually:1) work2) sleep3) study4) shop5) hang out
16. If your life were a candle you would be:1) burning bright2) flickering in the wind3) still waiting to get lit4) a puddle of wax
17. If you saw a friend shop lift would you:1) turn the rat in2) look the other way3) demand a cut
18. If your bank machine gave you an extra $100, you:1) party on2) give it back3) return it and hope for a reward
19. When someone says "when pigs fly" do you:1) get mad2) get sad3) ignore it4) imagine pigs with wings
20. If you had x-ray vision would you:1) suffer in silence2) sit and smile3) study to be a surgeon
21. Rules are:1) guidelines for fair play2) ok if they are bent a little3) made to be broken
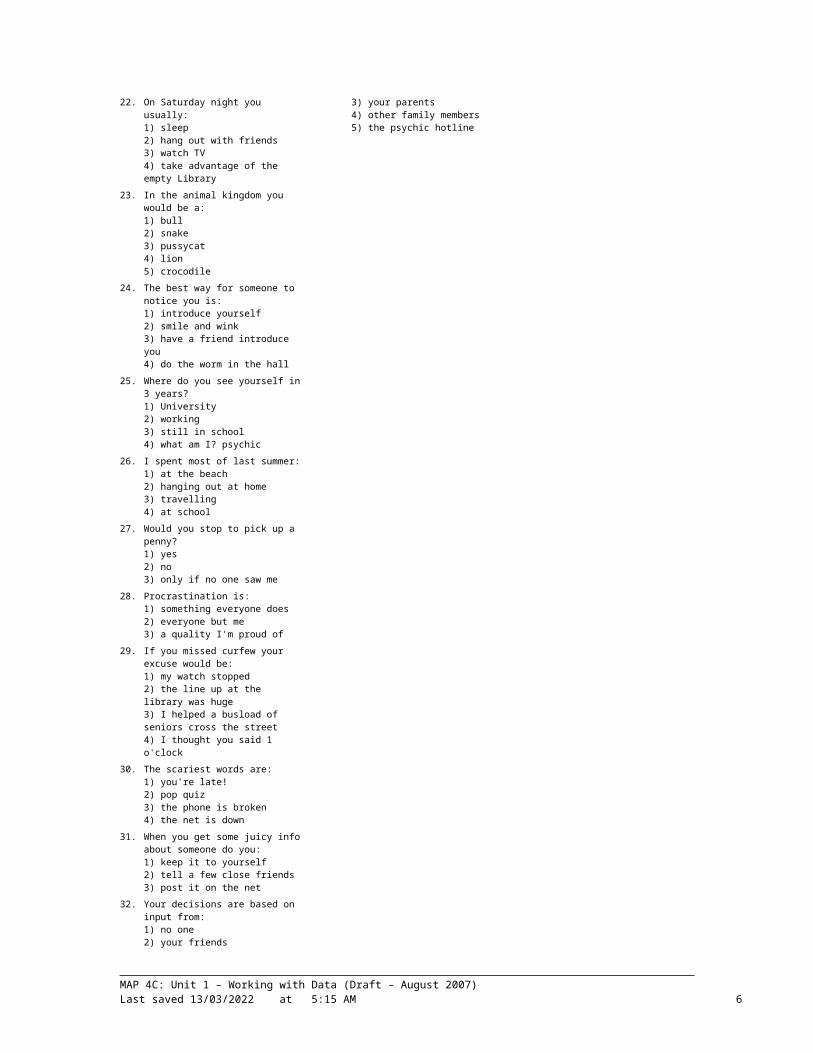
22. On Saturday night you usually:1) sleep2) hang out with friends3) watch TV4) take advantage of the empty Library
23. In the animal kingdom you would be a:1) bull2) snake3) pussycat4) lion5) crocodile
24. The best way for someone to notice you is:1) introduce yourself2) smile and wink3) have a friend introduce you4) do the worm in the hall
25. Where do you see yourself in 3 years?1) University2) working3) still in school4) what am I? psychic
26. I spent most of last summer:1) at the beach2) hanging out at home3) travelling4) at school
27. Would you stop to pick up a penny?1) yes2) no3) only if no one saw me
28. Procrastination is:1) something everyone does2) everyone but me3) a quality I'm proud of
29. If you missed curfew your excuse would be:1) my watch stopped2) the line up at the library was huge3) I helped a busload of seniors cross the street4) I thought you said 1 o'clock
30. The scariest words are:1) you're late!2) pop quiz3) the phone is broken4) the net is down
31. When you get some juicy info about someone do you:1) keep it to yourself2) tell a few close friends3) post it on the net
32. Your decisions are based on input from:1) no one2) your friends3) your parents4) other family members5) the psychic hotline
MAP 4C: Unit 1 – Working with Data (Draft – August 2007)Last saved 08/05/2023 at 9:06 PM 3
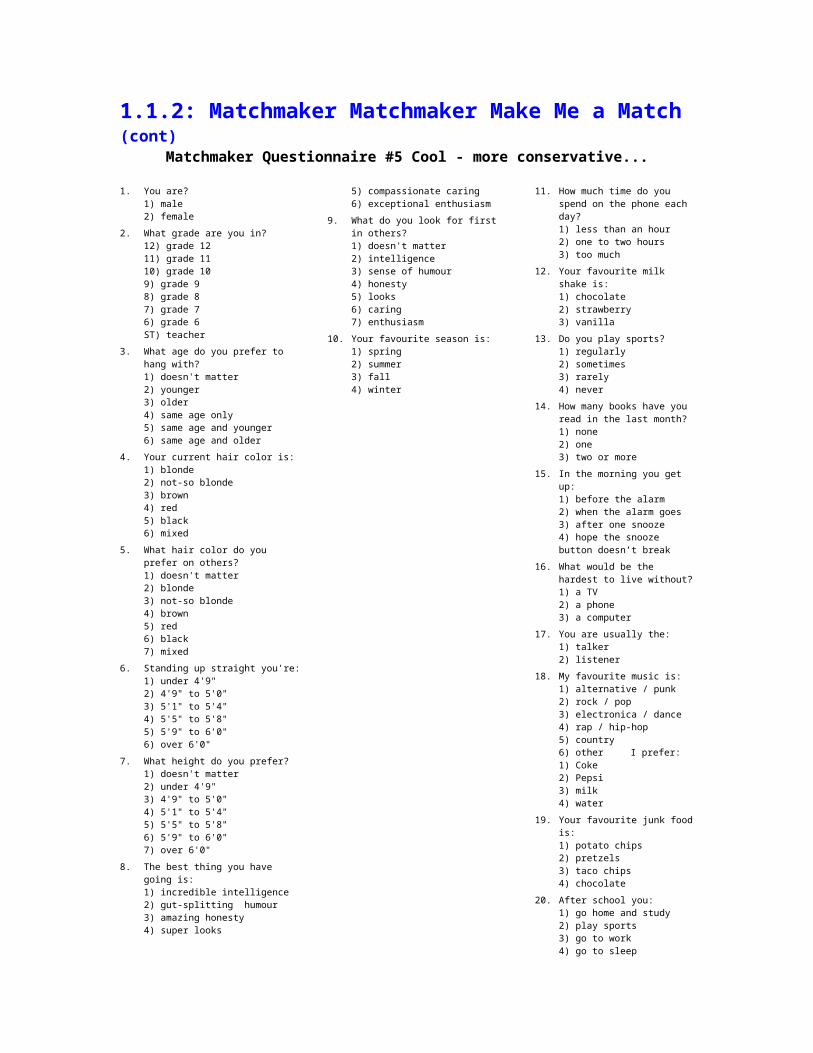
1.1.2: Matchmaker Matchmaker Make Me a Match (cont)Matchmaker Questionnaire #5 Cool - more conservative...
1. You are?1) male2) female
2. What grade are you in?12) grade 1211) grade 1110) grade 109) grade 98) grade 87) grade 76) grade 6ST) teacher
3. What age do you prefer to hang with?1) doesn't matter2) younger3) older4) same age only5) same age and younger6) same age and older
4. Your current hair color is:1) blonde2) not-so blonde3) brown4) red5) black6) mixed
5. What hair color do you prefer on others?1) doesn't matter2) blonde3) not-so blonde4) brown5) red6) black7) mixed
6. Standing up straight you're:1) under 4'9"2) 4'9" to 5'0"3) 5'1" to 5'4"4) 5'5" to 5'8"5) 5'9" to 6'0"6) over 6'0"
7. What height do you prefer?1) doesn't matter2) under 4'9"3) 4'9" to 5'0"4) 5'1" to 5'4"5) 5'5" to 5'8"6) 5'9" to 6'0"7) over 6'0"
8. The best thing you have going is:1) incredible intelligence2) gut-splitting humour3) amazing honesty4) super looks5) compassionate caring6) exceptional enthusiasm
9. What do you look for first in others?1) doesn't matter2) intelligence3) sense of humour4) honesty5) looks6) caring7) enthusiasm
10. Your favourite season is:1) spring2) summer3) fall4) winter
11. How much time do you spend on the phone each day?1) less than an hour2) one to two hours3) too much
12. Your favourite milk shake is:1) chocolate2) strawberry3) vanilla
13. Do you play sports?1) regularly2) sometimes3) rarely4) never
14. How many books have you read in the last month?1) none2) one3) two or more
15. In the morning you get up:1) before the alarm2) when the alarm goes3) after one snooze4) hope the snooze button doesn’t break
16. What would be the hardest to live without?1) a TV2) a phone3) a computer
17. You are usually the:1) talker2) listener
18. My favourite music is:1) alternative / punk2) rock / pop3) electronica / dance4) rap / hip-hop5) country6) other I prefer:1) Coke2) Pepsi3) milk4) water
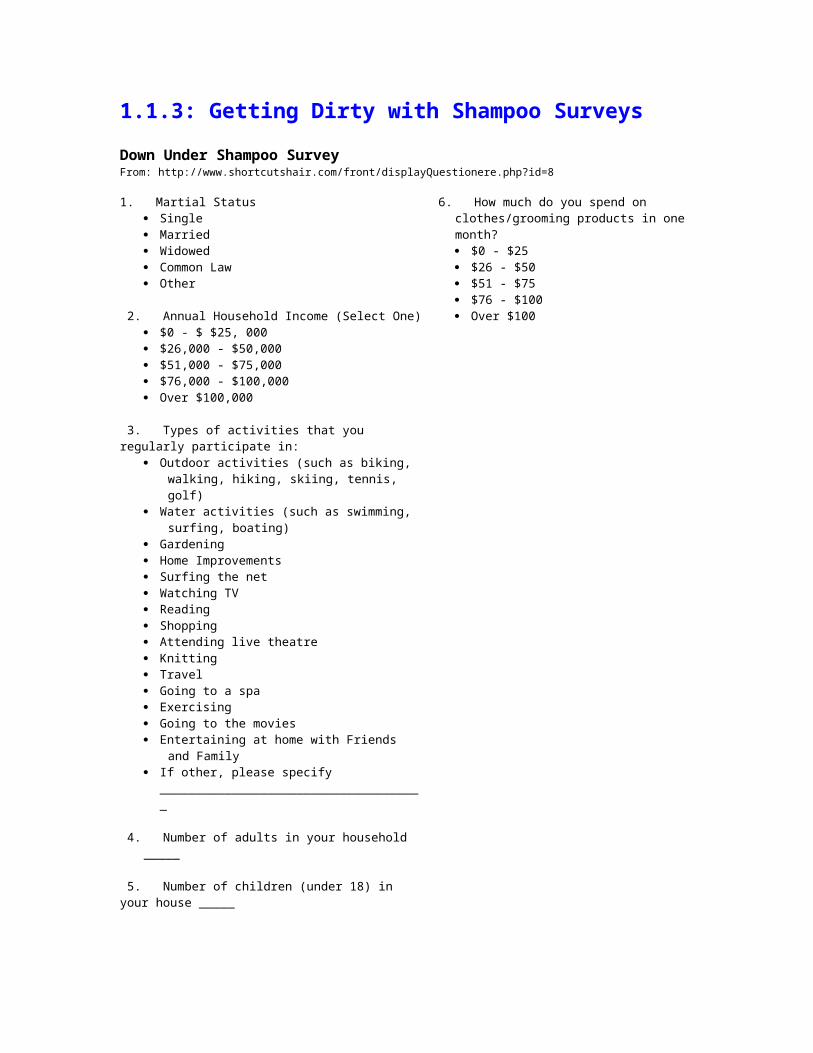
3. Types of activities that you regularly participate in:
Outdoor activities (such as biking, walking, hiking, skiing, tennis, golf)
Water activities (such as swimming, surfing, boating)
Gardening Home Improvements Surfing the net Watching TV Reading Shopping Attending live theatre Knitting Travel Going to a spa Exercising Going to the movies Entertaining at home with Friends and Family If other, please specify
_____________________________________ 4. Number of adults in your household _____ 5. Number of children (under 18) in your house _____
6. How much do you spend on clothes/grooming products in one month? $0 - $25 $26 - $50 $51 - $75 $76 - $100 Over $100
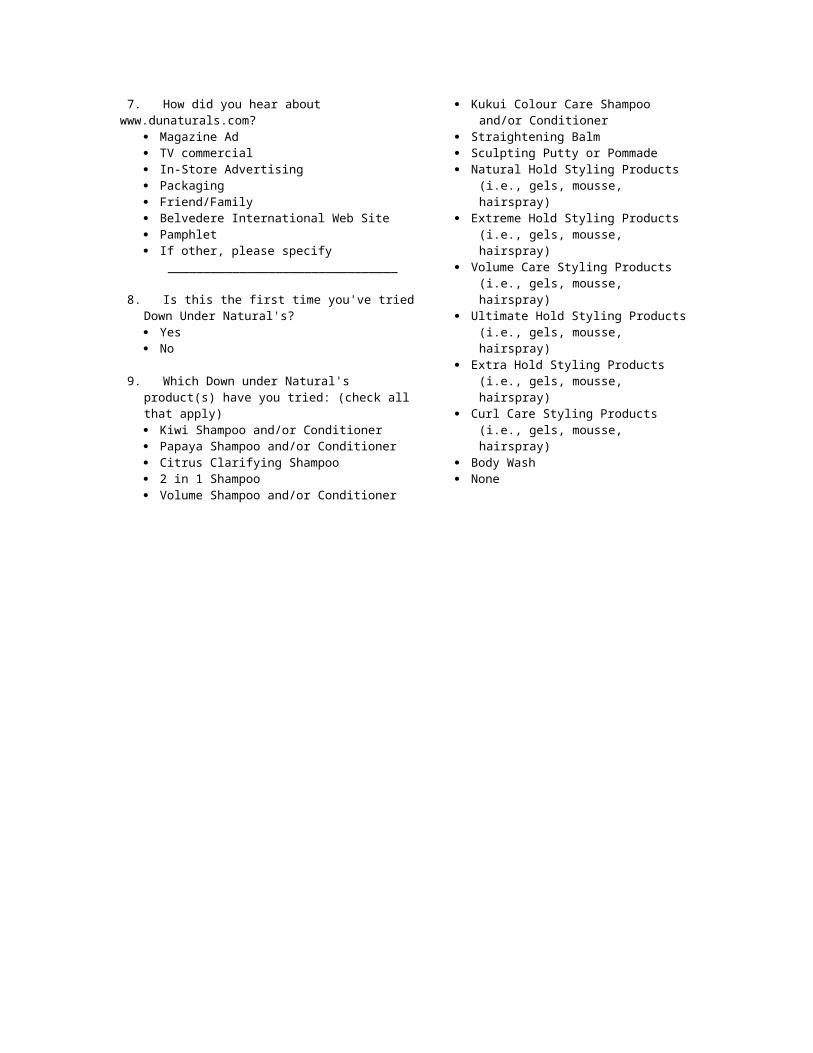
7. How did you hear about www.dunaturals.com? Magazine Ad TV commercial In-Store Advertising Packaging Friend/Family Belvedere International Web Site Pamphlet If other, please specify
________________________________ 8. Is this the first time you've tried Down Under
Natural's? Yes No
9. Which Down under Natural's product(s) have
you tried: (check all that apply) Kiwi Shampoo and/or Conditioner Papaya Shampoo and/or Conditioner Citrus Clarifying Shampoo 2 in 1 Shampoo Volume Shampoo and/or Conditioner Kukui Colour Care Shampoo and/or
Conditioner Straightening Balm Sculpting Putty or Pommade Natural Hold Styling Products (i.e., gels,
mousse, hairspray) Extreme Hold Styling Products (i.e., gels,
mousse, hairspray) Volume Care Styling Products (i.e., gels,
mousse, hairspray) Ultimate Hold Styling Products (i.e., gels,
mousse, hairspray) Extra Hold Styling Products (i.e., gels,
mousse, hairspray) Curl Care Styling Products (i.e., gels,
mousse, hairspray) Body Wash None
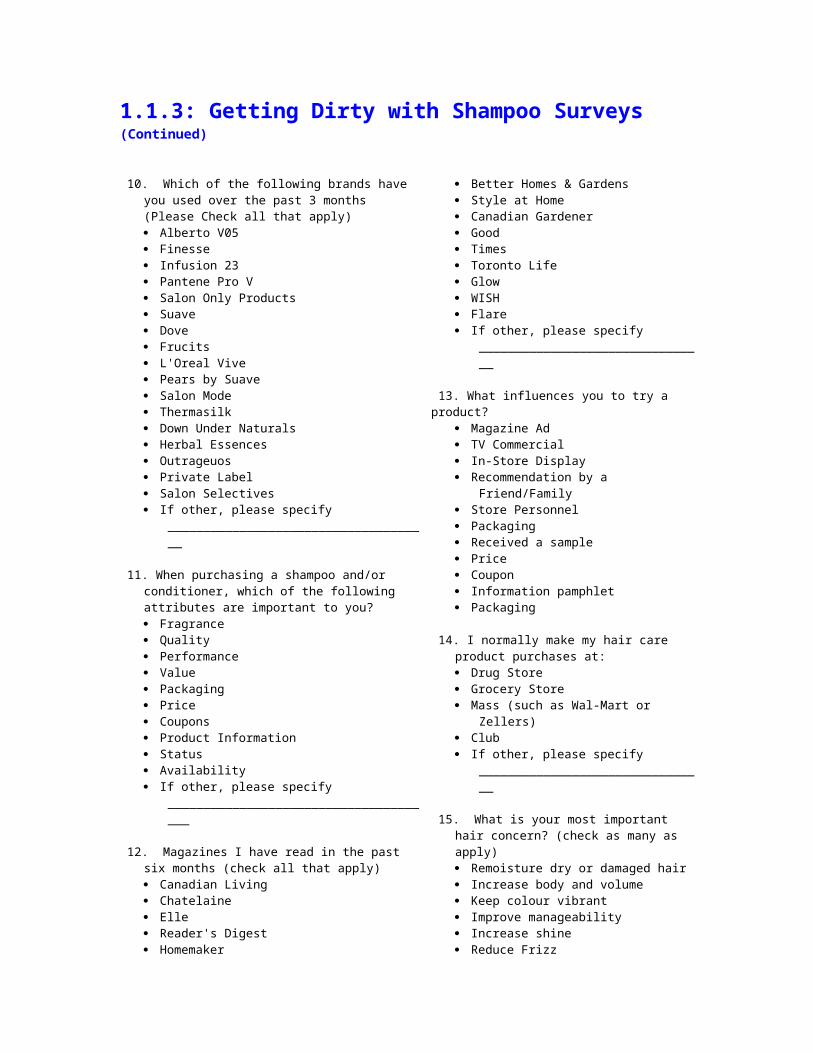
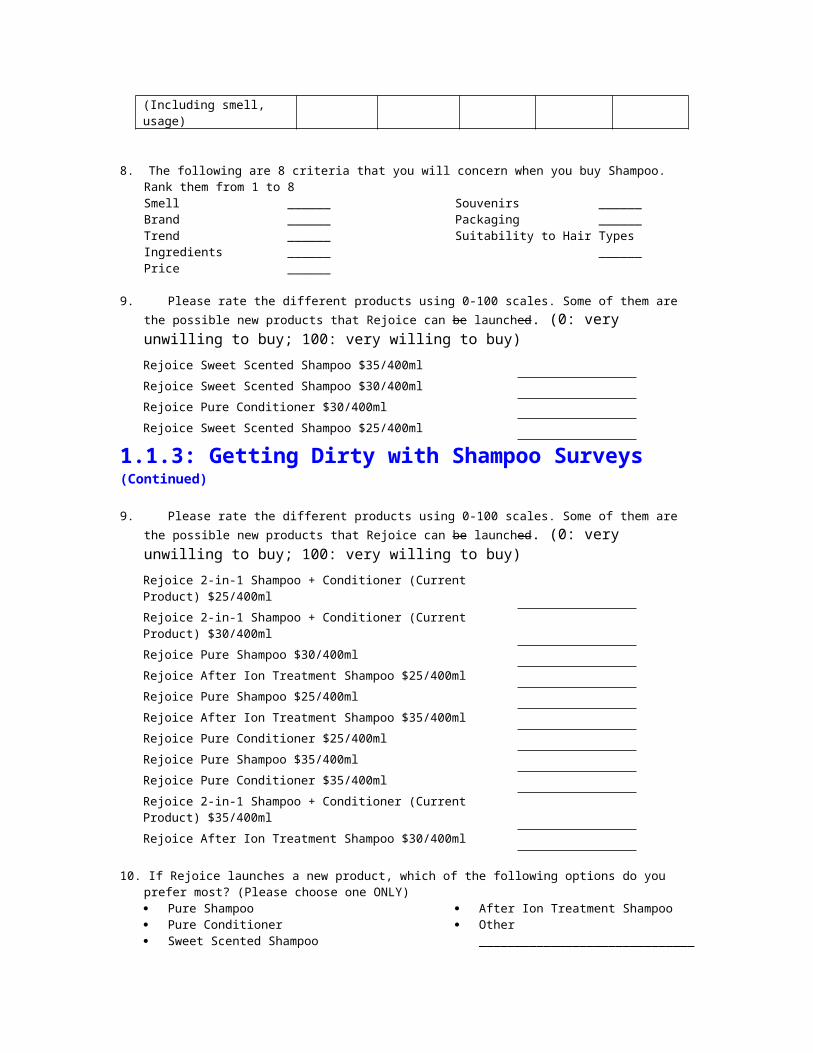
1.1.3: Getting Dirty with Shampoo Surveys (Continued)
10. Which of the following brands have you used over the past 3 months (Please Check all that apply) Alberto V05 Finesse Infusion 23 Pantene Pro V Salon Only Products Suave Dove Frucits L'Oreal Vive Pears by Suave Salon Mode Thermasilk Down Under Naturals Herbal Essences Outrageuos Private Label Salon Selectives If other, please specify
_____________________________________ 11. When purchasing a shampoo and/or conditioner,
which of the following attributes are important to you? Fragrance Quality Performance Value Packaging Price Coupons Product Information Status Availability If other, please specify
______________________________________ 12. Magazines I have read in the past six months
(check all that apply) Canadian Living Chatelaine Elle Reader's Digest Homemaker
Better Homes & Gardens Style at Home Canadian Gardener Good Times Toronto Life Glow WISH Flare If other, please specify
________________________________ 13. What influences you to try a product?
Magazine Ad TV Commercial In-Store Display Recommendation by a Friend/Family Store Personnel Packaging Received a sample Price Coupon Information pamphlet Packaging
14. I normally make my hair care product
purchases at: Drug Store Grocery Store Mass (such as Wal-Mart or Zellers) Club If other, please specify
________________________________ 15. What is your most important hair concern?
(check as many as apply) Remoisture dry or damaged hair Increase body and volume Keep colour vibrant Improve manageability Increase shine Reduce Frizz Curl Enhance Tame No concerns
1.1.3: Getting Dirty with Shampoo Surveys (Continued)
9. Please rate the different products using 0-100 scales. Some of them are the possible new products that Rejoice can be launched. (0: very unwilling to buy; 100: very willing to buy) Rejoice Sweet Scented Shampoo $35/400ml Rejoice Sweet Scented Shampoo $30/400ml Rejoice Pure Conditioner $30/400ml Rejoice Sweet Scented Shampoo $25/400ml
1.1.3: Getting Dirty with Shampoo Surveys (Continued)
9. Please rate the different products using 0-100 scales. Some of them are the possible new products that Rejoice can be launched. (0: very unwilling to buy; 100: very willing to buy) Rejoice 2-in-1 Shampoo + Conditioner (Current Product) $25/400mlRejoice 2-in-1 Shampoo + Conditioner (Current Product) $30/400mlRejoice Pure Shampoo $30/400ml Rejoice After Ion Treatment Shampoo $25/400ml Rejoice Pure Shampoo $25/400ml Rejoice After Ion Treatment Shampoo $35/400ml Rejoice Pure Conditioner $25/400ml Rejoice Pure Shampoo $35/400ml Rejoice Pure Conditioner $35/400ml Rejoice 2-in-1 Shampoo + Conditioner (Current Product) $35/400mlRejoice After Ion Treatment Shampoo $30/400ml
10. If Rejoice launches a new product, which of the following options do you prefer most? (Please choose one ONLY) Pure Shampoo Pure Conditioner Sweet Scented Shampoo
After Ion Treatment Shampoo Other
______________________________
11. Please choose the number that represents your Impression for the similarity between these brands.
Very Dissimilar --------- Very Similar1 2 3 4 5 6 7
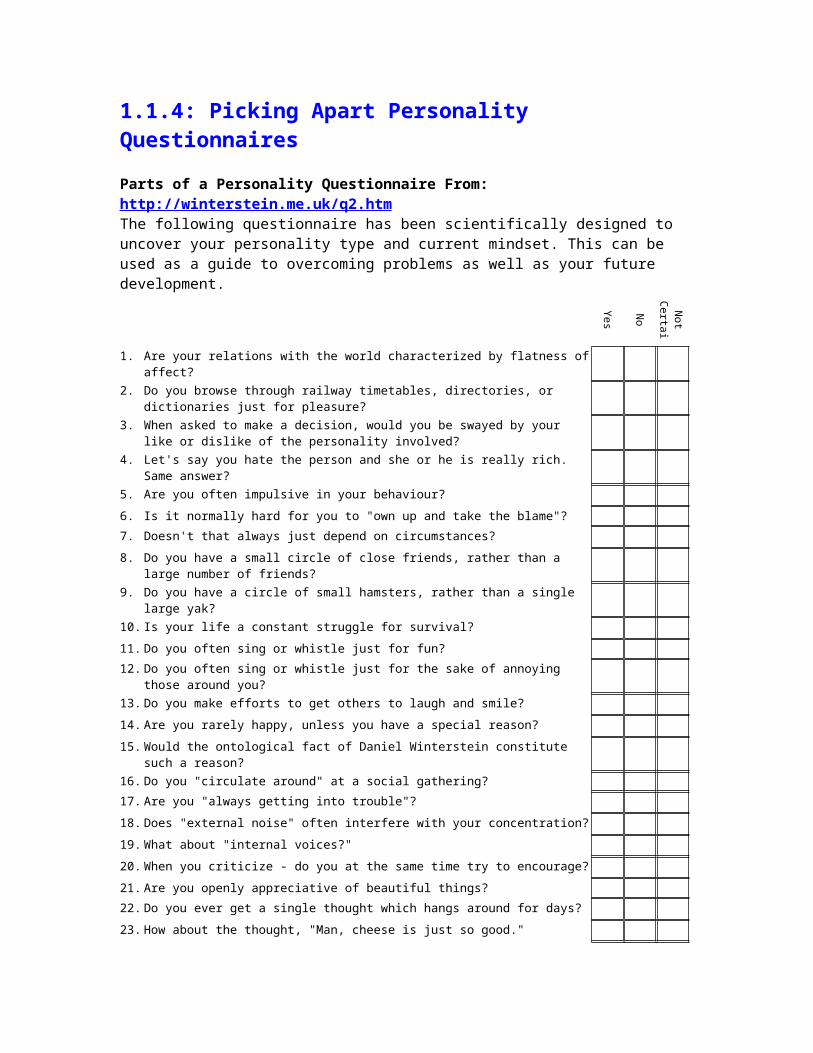
Parts of a Personality Questionnaire From: http://winterstein.me.uk/q2.htm The following questionnaire has been scientifically designed to uncover your personality type and current mindset. This can be used as a guide to overcoming problems as well as your future development.
Yes
No
Not
Certain
1. Are your relations with the world characterized by flatness of affect?
2. Do you browse through railway timetables, directories, or dictionaries just for pleasure?
3. When asked to make a decision, would you be swayed by your like or dislike of the personality involved?
4. Let's say you hate the person and she or he is really rich. Same answer?
5. Are you often impulsive in your behaviour?
6. Is it normally hard for you to "own up and take the blame"?
7. Doesn't that always just depend on circumstances?
8. Do you have a small circle of close friends, rather than a large number of friends?
9. Do you have a circle of small hamsters, rather than a single large yak?
10. Is your life a constant struggle for survival?
11. Do you often sing or whistle just for fun?
12. Do you often sing or whistle just for the sake of annoying those around you?
13. Do you make efforts to get others to laugh and smile?
14. Are you rarely happy, unless you have a special reason?
15. Would the ontological fact of Daniel Winterstein constitute such a reason?
16. Do you "circulate around" at a social gathering?
17. Are you "always getting into trouble"?
18. Does "external noise" often interfere with your concentration?
19. What about "internal voices?"
20. When you criticize - do you at the same time try to encourage?
21. Are you openly appreciative of beautiful things?
22. Do you ever get a single thought which hangs around for days?
23. How about the thought, "Man, cheese is just so good."
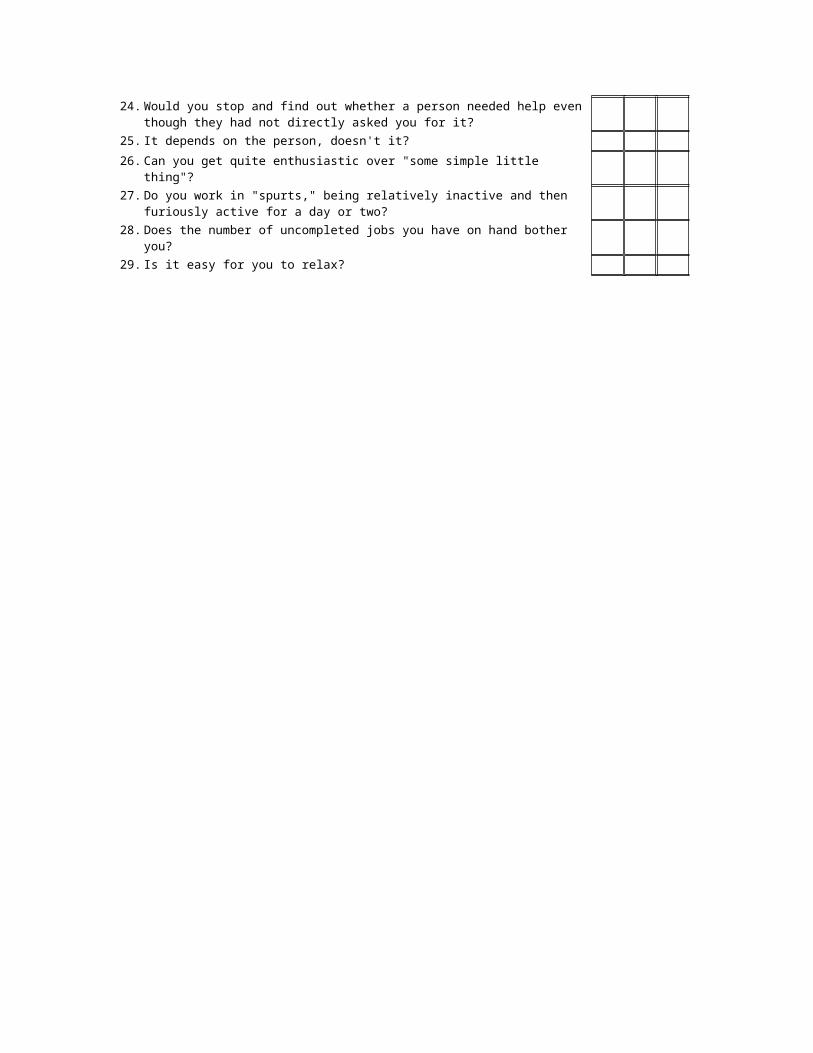
24. Would you stop and find out whether a person needed help even though they had not directly asked you for it?
25. It depends on the person, doesn't it?
26. Can you get quite enthusiastic over "some simple little thing"?
27. Do you work in "spurts," being relatively inactive and then furiously active for a day or two?
28. Does the number of uncompleted jobs you have on hand bother you?
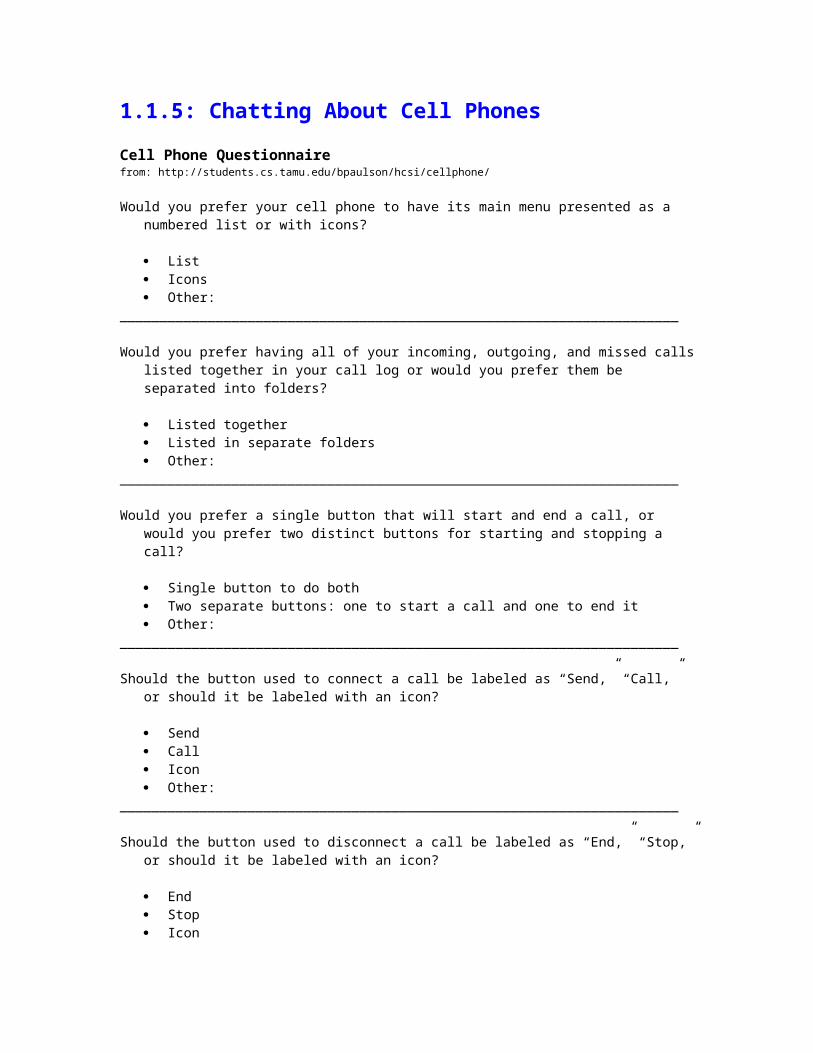
Would you prefer having all of your incoming, outgoing, and missed calls listed together in your call log or would you prefer them be separated into folders?
2. Have you used your cellular telephone to make or receive calls in the past seven days?
Yes No Don't know/remember
3. How many years have you had a cellular telephone? Less than 1 year 1-2 years
3-5 years More than 5 years
Don't know
4. How many total minutes a month (peak and off-peak combined) does your calling plan allow? <=300 minutes total 301-600 minutes 601-900 minutes
901-1200 minutes 1201-1800 minutes >1800 minutes
Calling plan does not specify minutes/month
Don't know
5. How much does your calling plan cost per month (excluding roaming or excess minutes charges)? <=$19.99 $20.00-39.99
$40.00-59.99 $60.00-79.99
>=$80.00 Don't know.
6. Who is responsible for paying your monthly cellular phone bill? I am personally
responsible My employer
My parents Some other
person/organization
Don't know
7. In the last week what percentage of your cellular phone calls were for business as compared to personal use? 100% business 75% business and 25% personal 50% business and 50% personal
25% business and 75% personal 100% personal Don't know
8. Please indicate whether your phone has each of the following features and if so, whether you use the feature.
Has
feat
ure
and
I use
it
Has
feat
ure
but
I don
't us
e it
Doe
s no
t hav
e fe
atur
e
Don
't kn
ow if
I ha
ve fe
atur
e
Ability to send/receive email. Ability to access Internet. Ability to send/receive pictures taken with digital camera. Ability to send/receive text messages. Ability to determine geographic location of person originating or
receiving call. Speaker for hands free use. Ability to play games. Ability to synchronize meeting scheduling with PDA or Palm. Ability to have multiple cellular phone numbers registered to same
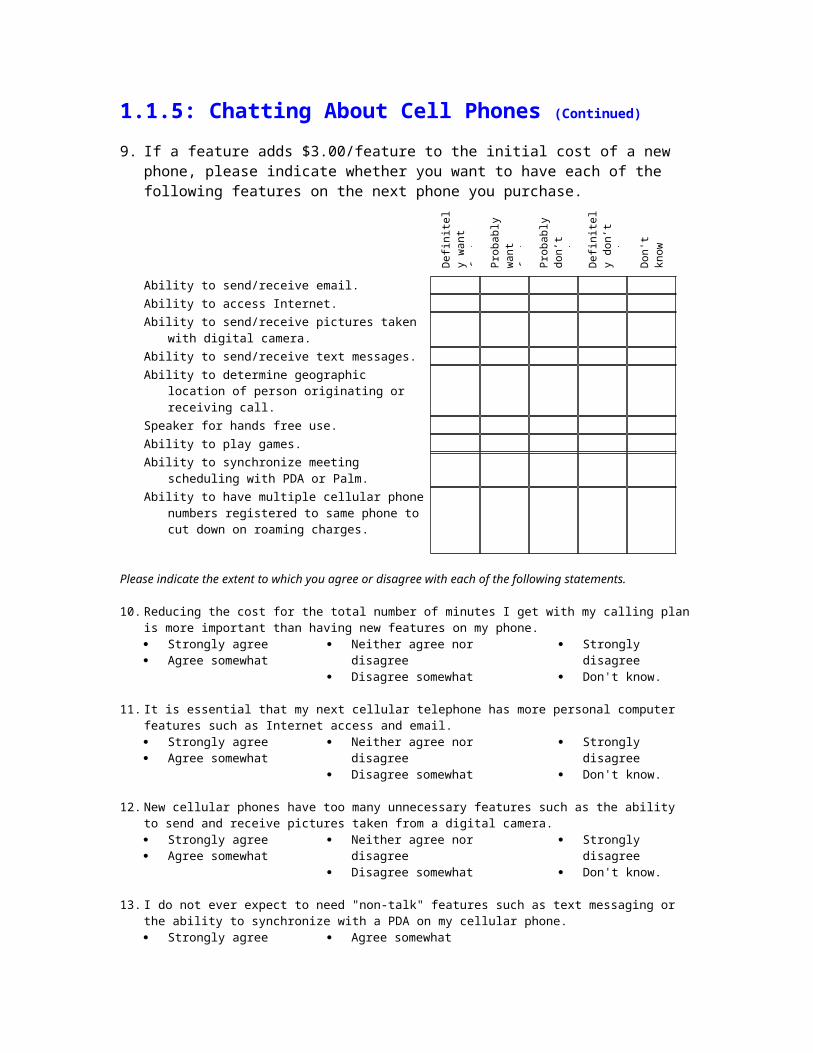
9. If a feature adds $3.00/feature to the initial cost of a new phone, please indicate whether you want to have each of the following features on the next phone you purchase.
Def
inite
ly
wan
t fea
ture
Pro
babl
y w
ant f
eatu
re
Pro
babl
y do
n’t w
ant
feat
ure
Def
inite
ly
don’
t wan
t fe
atur
e
Don
't kn
ow
Ability to send/receive email. Ability to access Internet. Ability to send/receive pictures taken with digital
camera. Ability to send/receive text messages. Ability to determine geographic location of person
originating or receiving call. Speaker for hands free use. Ability to play games. Ability to synchronize meeting scheduling with PDA
or Palm. Ability to have multiple cellular phone numbers
registered to same phone to cut down on roaming charges.
Please indicate the extent to which you agree or disagree with each of the following statements.
10. Reducing the cost for the total number of minutes I get with my calling plan is more important than having new features on my phone. Strongly agree Agree somewhat
Neither agree nor disagree Disagree somewhat
Strongly disagree Don't know.
11. It is essential that my next cellular telephone has more personal computer features such as Internet access and email. Strongly agree Agree somewhat
Neither agree nor disagree Disagree somewhat
Strongly disagree Don't know.
12. New cellular phones have too many unnecessary features such as the ability to send and receive pictures taken from a digital camera. Strongly agree Agree somewhat
Neither agree nor disagree Disagree somewhat
Strongly disagree Don't know.
13. I do not ever expect to need "non-talk" features such as text messaging or the ability to synchronize with a PDA on my cellular phone. Strongly agree Agree somewhat
Neither agree nor disagree Disagree somewhat
Strongly disagree Don't know.
14. What is your gender? Male Female
15. What is your age? 17 years or younger 18-22 23-29
30-39 40-49 50-59
60 and older Prefer not to answer
16. How many years of schooling have you completed? 12 or less 13-14
15-16 17-18
19 or more
Prefer not to answer
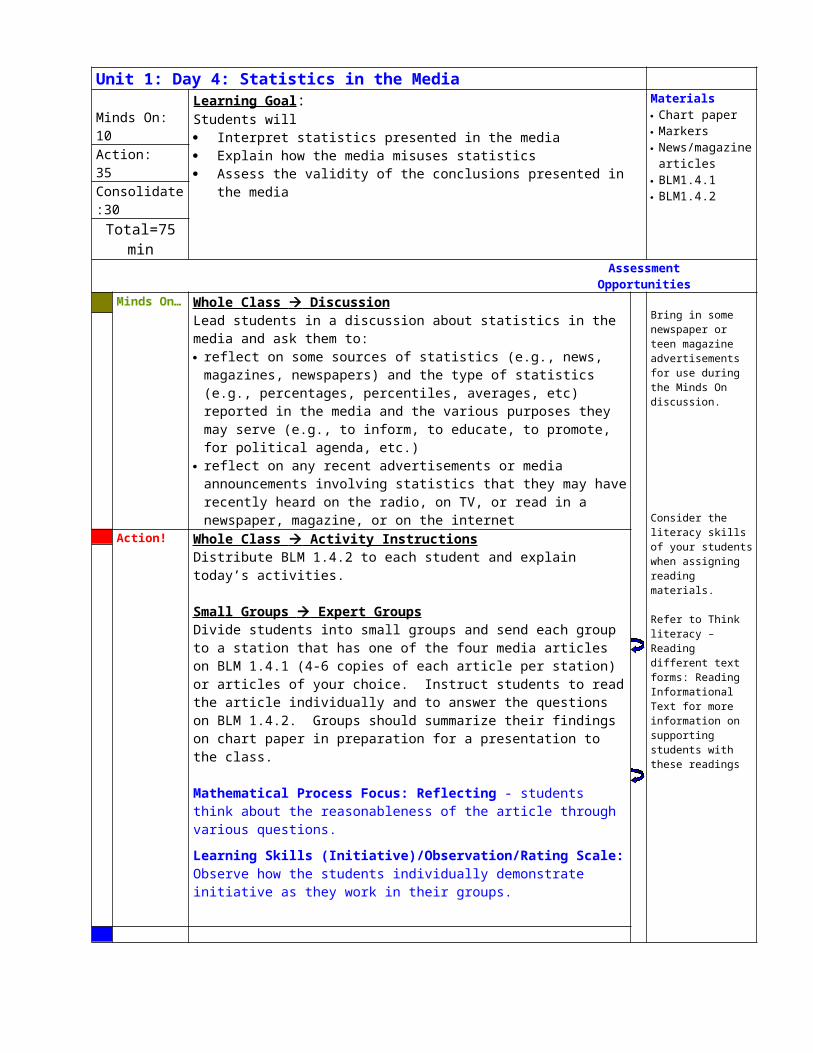
Unit 1: Day 4: Statistics in the Media
Minds On: 10Learning Goal:Students will Interpret statistics presented in the media Explain how the media misuses statistics Assess the validity of the conclusions presented in the media
Materials Chart paper Markers News/magazine
articles BLM1.4.1 BLM1.4.2
Action: 35
Consolidate:30
Total=75 minAssessment
OpportunitiesMinds On… Whole Class Discussion
Lead students in a discussion about statistics in the media and ask them to: reflect on some sources of statistics (e.g., news, magazines, newspapers) and
the type of statistics (e.g., percentages, percentiles, averages, etc) reported in the media and the various purposes they may serve (e.g., to inform, to educate, to promote, for political agenda, etc.)
reflect on any recent advertisements or media announcements involving statistics that they may have recently heard on the radio, on TV, or read in a newspaper, magazine, or on the internet
Bring in some newspaper or teen magazine advertisements for use during the Minds On discussion.
Consider the literacy skills of your students when assigning reading materials.
Refer to Think literacy – Reading different text forms: Reading Informational Text for more information on supporting students with these readings
Action! Whole Class Activity Instructions Distribute BLM 1.4.2 to each student and explain today’s activities.
Small Groups Expert Groups Divide students into small groups and send each group to a station that has one of the four media articles on BLM 1.4.1 (4-6 copies of each article per station) or articles of your choice. Instruct students to read the article individually and to answer the questions on BLM 1.4.2. Groups should summarize their findings on chart paper in preparation for a presentation to the class.
Mathematical Process Focus: Reflecting - students think about the reasonableness of the article through various questions.
Learning Skills (Initiative)/Observation/Rating Scale: Observe how the students individually demonstrate initiative as they work in their groups.
Consolidate Debrief
Small Groups Presentation Groups should present their findings about their article to the class. Allow time for the class to give feedback and discuss the ideas and statistics found in the article.
Expectations/presentation/oral feedback: Give groups oral feedback on their presentations.
Application
Home Activity or Further Classroom ConsolidationFind another article in a newspaper/magazine/online which uses statistics to support an argument/arguments. Write a summary report, similar to the one you presented to the class today, on the article you found. Use BLM 1.4.2 as a guideline for your report.
Have a variety of articles or newspapers available for students who may not have access to newspapers or internet at home
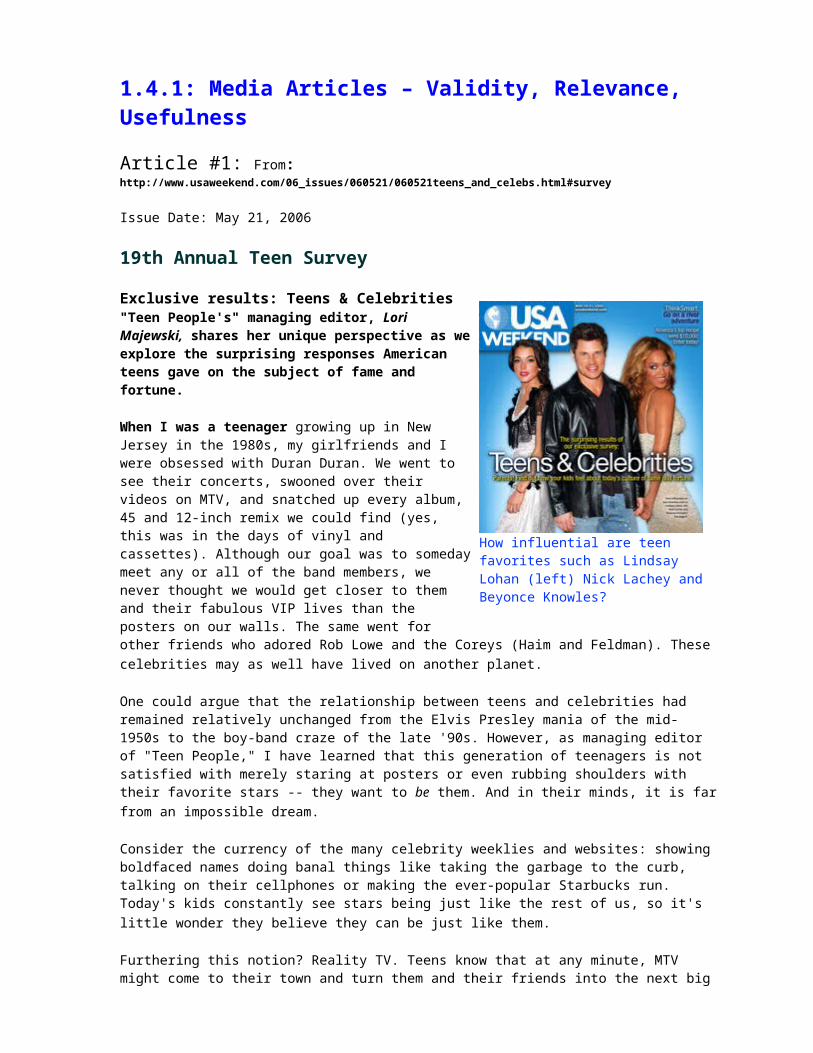
1.4.1: Media Articles – Validity, Relevance, Usefulness
Exclusive results: Teens & Celebrities "Teen People's" managing editor, Lori Majewski, shares her unique perspective as we explore the surprising responses American teens gave on the subject of fame and fortune.
When I was a teenager growing up in New Jersey in the 1980s, my girlfriends and I were obsessed with Duran Duran. We went to see their concerts, swooned over their videos on MTV, and snatched up every album, 45 and 12-inch remix we could find (yes, this was in the days of vinyl and cassettes). Although our goal was to someday meet any or all of the band members, we never thought we would get closer to them and their fabulous VIP lives than the posters on our walls. The same went for other friends who adored Rob Lowe and the Coreys (Haim and Feldman). These celebrities may as well have lived on another planet.
One could argue that the relationship between teens and celebrities had remained relatively unchanged from the Elvis Presley mania of the mid- 1950s to the boy-band craze of the late '90s. However, as managing editor of "Teen People," I have learned that this generation of teenagers is not satisfied with merely staring at posters or even rubbing shoulders with their favorite stars -- they want to be them. And in their minds, it is far from an impossible dream.
Consider the currency of the many celebrity weeklies and websites: showing boldfaced names doing banal things like taking the garbage to the curb, talking on their cellphones or making the ever-popular Starbucks run. Today's kids constantly see stars being just like the rest of us, so it's little wonder they believe they can be just like them.
Furthering this notion? Reality TV. Teens know that at any minute, MTV might come to their town and turn them and their friends into the next big things, just like it did with the young stars of the California-based "Laguna Beach: The Real Orange County." The real-life soap is so popular that one of its main players, Lauren "LC" Conrad, 20, scored her own spinoff, "The Hills;" meanwhile, her Laguna nemesis, Kristin Cavallari, 19, is being offered movie roles.
The more proactive star wannabes don't wait for fame to come to them. They try out for TV talent shows like "American Idol." Hey, even if they can't carry a tune, they can make a spectacle of themselves during the audition and score big money, like "Idol's" William Hung. Teens who don't want to subject themselves to Simon Cowell have found other paths to stardom. By uploading inexpensive homemade videos to websites such as YouTube.com, one can literally become an overnight sensation. Using her webcam to capture herself and another girl singing the Backstreet Boys' "Get Down," one girl recently received more than 152,000 hits with her cute but unremarkable clip.
Because so many teens see themselves as stars, it's no wonder they have a different relationship with bona fide celebrities than any previous generation. USA WEEKEND Magazine's Teens & Celebrities survey reveals that although more than a third (36%) believe talent is more important than personality in a celebrity, only slightly fewer teens (32%) said personality outranks talent. So of
How influential are teen favorites such as Lindsay Lohan (left) Nick Lachey and Beyonce Knowles?
course teens think they have a decent shot at stardom when they don't think it requires them to be a singer or actor of extraordinary skill.
The survey also finds that teens want to look and act like famous people, and although that has been true through the ages, they're taking more drastic steps to do so. About 60% think teens want to pierce a body part or get a tattoo because a celebrity has. Roughly half agree that their own peers drink or smoke cigarettes because they see their idols doing it. And 77% believe that when a star loses weight, teenagers are prone do the same -- although only 13% admit to having gone on a diet to look more like a celebrity.
There's a paradox in these survey results: Teens aspire to be like stars, but they don't necessarily view them as role models. When it comes to issues such as war and politics, celebrities rank dead last on the list of people teens say influence their opinions, behind parents, friends, teachers and the media. That's why they tend to tune out most stars who talk about environmental issues and world peace. According to the survey, 78% of teens say they don't think more about charitable causes when celebrities participate in fundraisers, and more than half (52%) suspect that stars use charity events for self-promotion.
These stats don't mean we're raising a generation of skeptics -- just smart kids. Dubbed by USA WEEKEND as "Generation Give" last year, today's teens are able to distinguish a passionate star from one who's just looking for good press. There are true celebrity humanitarians, like Angelina Jolie, who demonstrates her commitment to developing nations. Seeing her practice what she preaches makes teenagers, many of whom call her an inspiration, put even more energy into doing good works. Indeed, in last year's Teens & Volunteering survey, 96% of teens say they volunteer.
Every year, "Teen People's" April issue features "20 Teens Who Will Change the World." And every year, we find that the scope of what these teens are doing -- and where they're doing it -- broadens. In 2006, we found teens who volunteered in locales like Sri Lanka, Guinea and Peru. At our luncheon honoring these kids, celebrity host Nick Lachey called them an inspiration and was just as excited to meet these do-gooders as they were to meet him. It makes you wonder: Maybe by the time the next generation of teens comes around, the stars will be striving to be just like them.
Last fall, more than 17,000 students in grades 6 to 12 took USA WEEKEND's 19th annual teen survey in themagazine or at our website. Highlights from the unscientific survey are reported here.
Highlights from the Teens & Celebrities Survey Results
Do you agree or disagree with this statement: When celebrities make the following choices, a lot of teens want to do the same
Agree Disagree Lose weight 77% 23% Pierce a body part 62% 38% Get a tattoo 58% 42% Drink alcohol 48% 52% Smoke cigarettes 47% 53% Take drugs 39% 61% Have a baby 25% 75%
Have you ever dieted because you wanted to look more like a celebrity?Yes 13% No 87%
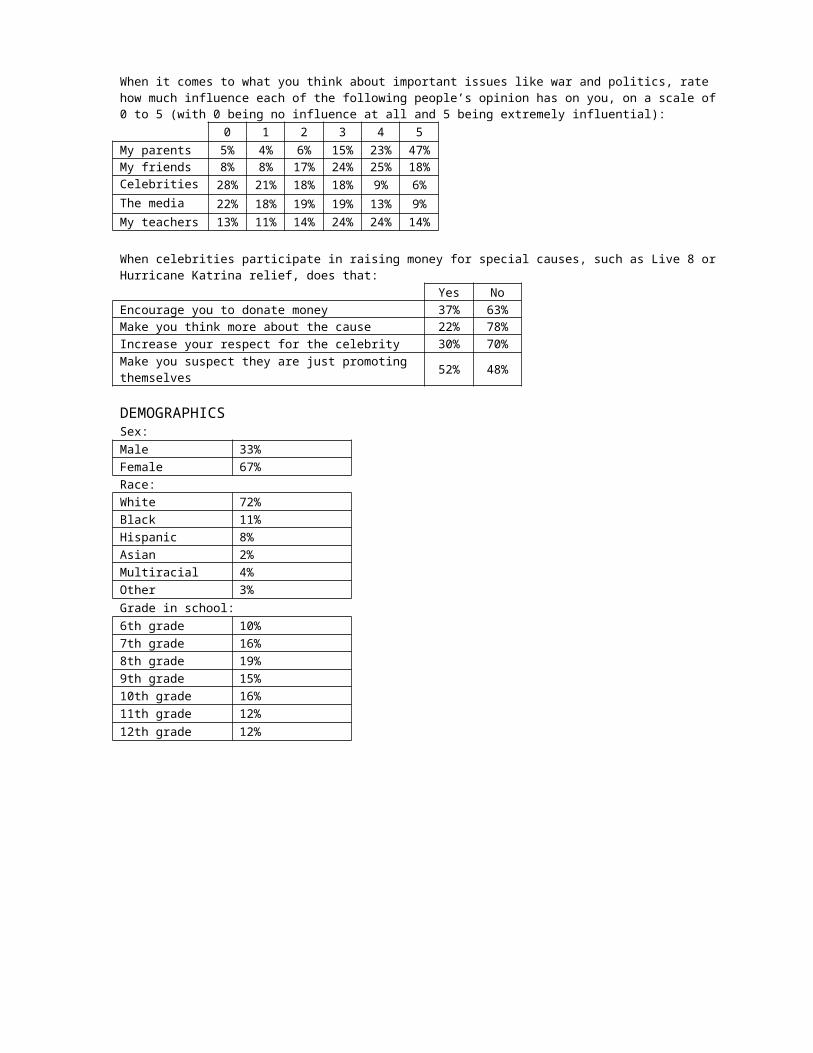
When it comes to what you think about important issues like war and politics, rate how much influence each of the following people’s opinion has on you, on a scale of 0 to 5 (with 0 being no influence at all and 5 being extremely influential):
When celebrities participate in raising money for special causes, such as Live 8 or Hurricane Katrina relief, does that: Yes NoEncourage you to donate money 37% 63%Make you think more about the cause 22% 78%Increase your respect for the celebrity 30% 70%Make you suspect they are just promoting themselves 52% 48% DEMOGRAPHICS Sex: Male 33%Female 67% Race: White 72% Black 11% Hispanic 8% Asian 2% Multiracial 4% Other 3% Grade in school: 6th grade 10% 7th grade 16% 8th grade 19% 9th grade 15% 10th grade 16% 11th grade 12% 12th grade 12%
1.4.1: Media Articles – Validity, Relevance, Usefulness (continued)
Article #2:
Issue date: May 1-3, 1998
Teens tackle their identity crisis USA WEEKEND's exclusive survey of 272,400 students shows teens are riddled with self-doubt about everything from their looks to their relationships with adults -- and determined to find answers.
he Teens & Self-Image survey attracted an unprecedented 272,400 students to write in and confess their shortcomings and chronicle their determination to improve themselves.
While the survey is non-scientific, its results support and echo those of other recent studies on topics including teens' relationships with their parents, their faith and themselves.
The overwhelming majority of teens who took USA WEEKEND's survey, conducted in partnership with Channel One, say they feel good about themselves. But almost as many express misgivings about who they are -- especially about their appearance in a media-saturated world that emphasizes good looks.
The struggle to carve out an identity and fit in remains the paradox of the teen years. Among the complex issues disclosed by USA WEEKEND's survey on Teens & Self-Image:
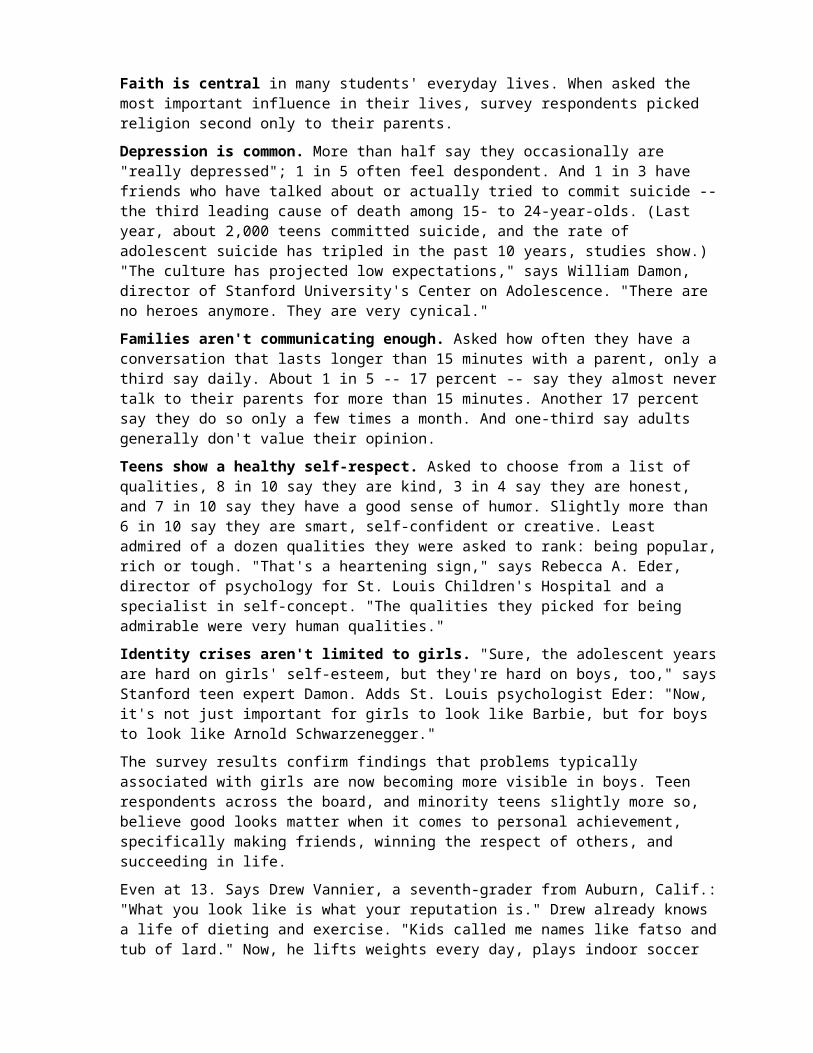
Looks are key, and only 4 in 10 respondents consider themselves attractive. Half the girls want to lose weight and, evidence that our culture's obsession with form over content is no longer limited to girls, half the boys want to tone up.
"Our culture is so nuts about this, and it's only getting worse, not better," says Susan Mackey, a therapist with the Family Institute at Northwestern
University. "Instead of getting less bad for girls, it's getting worse for boys."
Teens find lots of imperfections. Almost 9 in 10 -- 85 percent -- cite ways they'd like to improve. After losing weight and toning up, the top three are their grades, doing better in sports, and having a better relationship with their parents. Only 15 percent like themselves "the way I am."
Faith is central in many students' everyday lives. When asked the most important influence in their lives, survey respondents picked religion second only to their parents.
Depression is common. More than half say they occasionally are "really depressed"; 1 in 5 often feel despondent. And 1 in 3 have friends who have talked about or actually tried to commit suicide -- the third leading cause of death among 15- to 24-year-olds. (Last year, about 2,000 teens committed suicide, and the rate of adolescent suicide has tripled in the past 10 years, studies show.) "The culture has projected low expectations," says William Damon, director of Stanford University's Center on Adolescence. "There are no heroes anymore. They are very cynical."
Families aren't communicating enough. Asked how often they have a conversation that lasts longer than 15 minutes with a parent, only a third say daily. About 1 in 5 -- 17 percent -- say they almost never talk to their parents for more than 15 minutes. Another 17 percent say they do so only a few times a month. And one-third say adults generally don't value their opinion.
Teens show a healthy self-respect. Asked to choose from a list of qualities, 8 in 10 say they are kind, 3 in 4 say they are honest, and 7 in 10 say they have a good sense of humor. Slightly more than 6 in 10 say they are smart, self-confident or creative. Least admired of a
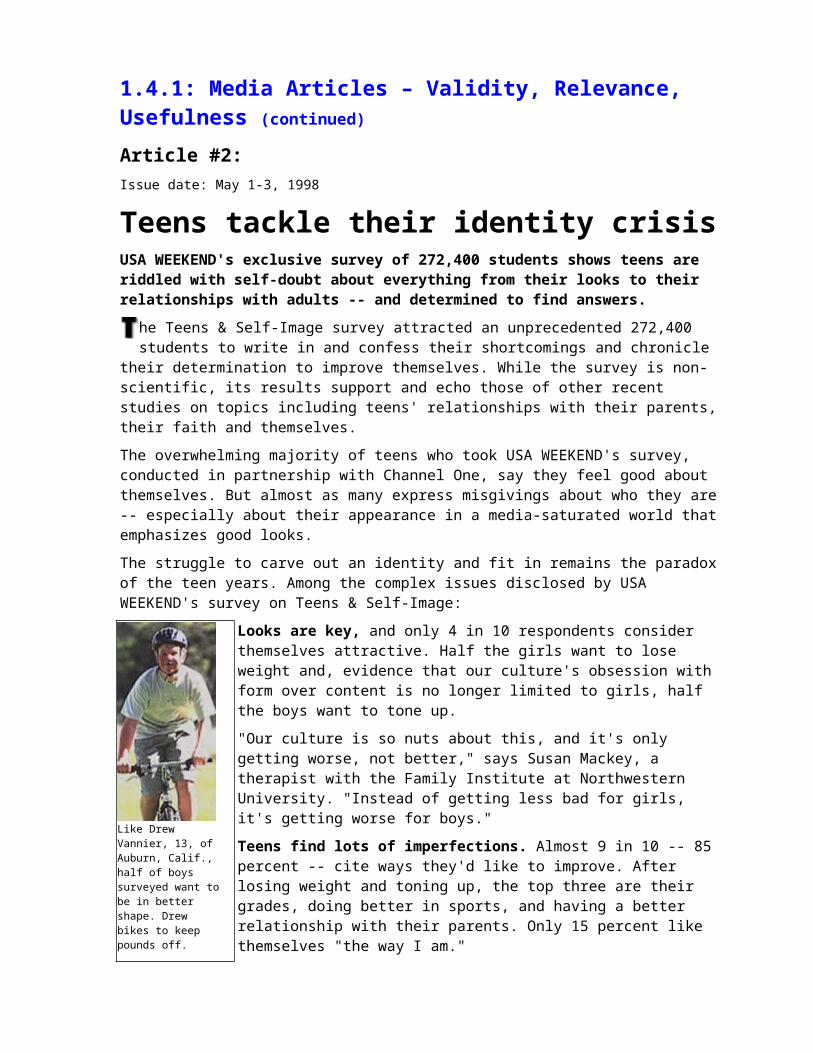
Like Drew Vannier, 13, of Auburn, Calif., half of boys surveyed want to be in better shape. Drew bikes to keep pounds off.
dozen qualities they were asked to rank: being popular, rich or tough. "That's a heartening sign," says Rebecca A. Eder, director of psychology for St. Louis Children's Hospital and a specialist in self-concept. "The qualities they picked for being admirable were very human qualities."
Identity crises aren't limited to girls. "Sure, the adolescent years are hard on girls' self-esteem, but they're hard on boys, too," says Stanford teen expert Damon. Adds St. Louis psychologist Eder: "Now, it's not just important for girls to look like Barbie, but for boys to look like Arnold Schwarzenegger."
The survey results confirm findings that problems typically associated with girls are now becoming more visible in boys. Teen respondents across the board, and minority teens slightly more so, believe good looks matter when it comes to personal achievement, specifically making friends, winning the respect of others, and succeeding in life.
Even at 13. Says Drew Vannier, a seventh-grader from Auburn, Calif.: "What you look like is what your reputation is." Drew already knows a life of dieting and exercise. "Kids called me names like fatso and tub of lard." Now, he lifts weights every day, plays indoor soccer and rides his bike a lot. At 5 feet 4 inches and 140 pounds, "I don't get called fatso anymore."
Sarah Freshley, 17, a 10th-grader in Louisville, despairs of her 5-foot-9, 150-pound frame. "When I see myself in the mirror, I don't like my body. I go to school and see these skinny girls. The guys give them more attention."
When it comes to looks, minorities' self-image is healthiest. Non-white adolescents tend to feel better about themselves physically than whites, something experts say reflects a different set of values. Asked how satisfied they are with their looks, almost 4 in 10 minority teens answer "very," compared with 3 in 10 whites.
"African Americans have a more flexible view of beauty -- the whole notion that beauty is just not skin deep," says Mark Nichter, of the University of Arizona. In a three-year study of 300 girls ages 14-17, Nichter found that "African-American girls were notably less concerned with standards for an 'ideal girl' depicted in the media." Explains Sharon Ames-Dennard of the Association of Black Psychologists, "Black children are not so hung up on [weight] because they've accentuated other aspects of themselves."
Not only are there notable differences among teens, but survey results also point to conflicts within individual teens -- conflicts emblematic of
adolescence, experts say. "Overall, most adolescents will tell you things are fine, particularly to adults and authority figures," says Mackey, the therapist at Northwestern. "But that doesn't mean there aren't issues."
WHAT 272,400 TEENS SAYThe overwhelming majority of survey respondents -- 9 in 10 -- feel good about themselves. Boys, minorities and students with strong religious beliefs feel best. Nearly as many say they feel healthy. Still, 7 in 10 say they've been depressed. Girls are more likely than boys to feel depressed ... And nearly 1 in 3 say they have a friend who has discussed or attempted suicide. 1 in 3 say they rarely or never have a conversation with a parent that lasts longer than 15 minutes. Only 1 in 3 converse daily with a parent for at least 15 minutes. Just 3 in 10 are very satisfied with their looks. And boys are as obsessed with having a perfect body as girls are. Half of boys say they want to bulk or tone up, while half of girls want to lose weight. 1 in 3 teen respondents say adults don't value their opinions. Friends, they say, are the most understanding.
1 in 2
teens participate in sports, including Carrie Marchenkoff, 16, of Adams, N.Y. She hopes basketball will help her get into college.
1.4.1: Media Articles – Validity, Relevance, Usefulness (Continued)
Article #3: From http://www.cbc.ca/canada/story/2007/07/18/crime-stats.html
Canada's crime rate lowest in 25 years: StatsCan reportOffences down in every province, territory in 2006 but youth crime rate up by three per cent Last Updated: Wednesday, July 18, 2007 1:47 PM ET Driven by a decline in non-violent felonies, Canada's crime rate reached a 25-year low in 2006, with every province and territory recording a drop, Statistics Canada said Wednesday.
The overall crime rate was 7,518 per 100,000 people, down three per cent from 2005.
However, the report also found that even though the overall rates decreased, those for more serious violent offences have remained steady from 2005. The rate of violent offences was 951 per 100,000 people in 2006, for a total of 310,307 countrywide.
More people committed violent offences, such as attempted murder, aggravated assault, assault with a weapon, robbery, kidnapping and forcible confinement. But that was offset by a 10-per-cent drop in the national homicide rate, to 1.85 homicides per 100,000 people. Police reported a total of 605 homicides in 2006, 58 fewer than in 2005. In the preceding two years, the rate had climbed.
University of Ottawa criminologist Ron Melchers told CBC Newsworld that the drop in areas such as property crime, breaking and entering and car thefts could be attributed to increased security measures for homes and cars as well changes in demographics.
"But there are some disturbing trends," Melchers said, pointing out that although minor assaults were down, the more serious ones — including those with weapons — had climbed.
"More disturbing yet," he said, "they're going up among young offenders who are 12 to 17 years of age."
The rate of youth crimes rose by three per cent in 2006, with 74,000 youth charged with a criminal offence. It was the first increase in three years, due to "increases in mischief and disturbing the peace," according to the report.
The rate of young people accused of homicide was also the highest since 1961, when statistics were first collected. Last year, 84 youths were accused of homicide involving 54 victims. Cont…
Saskatchewan has highest crime rate — againFor the ninth year in a row, Saskatchewan recorded the highest crime rate of all the provinces, with 13,711 crimes per 100,000 people. It was followed by Manitoba (11,678 per 100,000) and British Columbia (11,365 per 100,000). That was despite a four-per-cent drop in overall crime in Saskatchewan.
"It's not exactly an honour," Melchers said, adding that "it has a lot to do with a very large concentration of very disadvantaged Saskatoon residents."
Saskatchewan, with 40 homicides in 2006, also reported the highest murder rate among the provinces — 4.1 homicides per 100,000 people.
The overall crime rate dropped most in Prince Edward Island and Nunavut, where it was down 11 per cent, followed by declines of about five per cent in Alberta, New Brunswick and B.C. The lowest crime rate was recorded in Ontario (5,689 offences per 100,000 population).
According to the Statistics Canada report, the city with the highest total crime rate was Regina (12,415 crimes per 100,000 people). The city with the lowest crime rate was Quebec City (4,931 per 100,000).
Contrary to a common misconception about big cities, Melchers said, large urban areas such as Toronto are among the safest communities in the country.
"No one will believe that if you say that in a conversation with neighbours, but urban areas are generally very, very safe," he said.
Higher crime rates are more the trend in large western cities, such as Winnipeg, Regina and Saskatoon, Melcher said.
Canadian householders are making changes to be greener, but still engage in many practices that have a negative impact on the environment, a new study suggests.
The Statistics Canada study found some good habits on the rise in recent years: Almost six in 10 households now use compact fluorescent bulbs; About four in 10 have a programmable thermostat; More households composted; More had water-saving showerheads and toilets.
But other aspects of household behaviour have not changed much since the mid-1990s, the use of chemical pesticides on lawns and gardens, which was down only slightly in 2006 from 1994.
Only Quebec saw a significant reduction of pesticide use -- from 30 per cent of households in 1994 to 15 per cent. The drop is attributed to strict regulations imposed in recent years.
While vehicle emissions contributed largely to Canada's greenhouse gas emissions, according to the federal government, most motorists travelled to work alone in a car or truck.
Some 83 per cent of households had at least one motor vehicle in 2006, while more than 10 per cent had three or more vehicles.
The survey also examined drinking water habits. Almost three out of every 10 households drank bottled water predominantly in 2006, whether they had a municipal or private water supply.
The remaining households drank tap water, but half of those homes treated the water in some way. While the majority used devices to improve the taste or appearance of their water, 40 per cent did so over concerns about possible bacterial contamination.
The study found a large increase in the number of households with water-saving devices. In 2006, 60 per cent of households had a water-saving showerhead, compared to 42 per cent in 1994.
About 41 per cent had a water-saving toilet, nearly triple the 15 per cent who had one in 1994
Household recycling rates have climbed significantly, the study found, but detailed data won't be released until Friday when it's presented in the inaugural issue of EnviroStats, Statistics Canada's new publication of analysis on environmental issues.
The survey showed households are taking advantage of new power-saving devices. Between 1994 and 2006, the proportion using at least one compact fluorescent light bulb more than tripled from 19 per cent to 59 per cent.
Composting rates have grown slightly, up to 27 per cent of households from 23 per cent, with the initiative most popular in Atlantic Provinces.
Electronic waste, such as old computers and gadgets, is a growing environmental problem, the survey found. Almost 20 per cent of households threw the devices in the garbage, not at special waste depots.
The Households and the Environment Survey polled more than 28,000 households by telephone in early 2006.
1) What is the main idea of the article? Write a short summary of no more than 3 sentences.
2) Who wrote the article? Where was it published?
3) Clearly list all the statistics used in the article.
4) These statistics were calculated using data. Who collected this data?
5) Determine what information is provided about the collection of the data as follows:a) When was the data collected?
b) Why was the data collected?
c) Where was the data collected?
d) How was the data collected?
6) Is there any additional information you wish you had about the data? If so, what?
7) Do you feel that the true purpose of collecting the data was identified in the article? Explain.
8) Do you feel the statistics were used properly in the article, or misused? Explain.
9) If they were misused, why do you think they were misused?
10) What is your overall impression of the use of statistics in this article?
Unit 1: Day 5: Statistics in the Media
Minds On: 10Learning Goal: Using the data from the class, create a media advertisement that would promote
a certain point of view in order to bring awareness or support a cause Assess the validity of the conclusions presented by the class media
advertisements
Materials BLM 1.5.1 Class Data
obtained on day 2Action: 55
Consolidate:10
Total=75 minAssessment
OpportunitiesMinds On… Whole Class Brainstorming
Engage students in a brainstorming discussion on the various ways the media uses advertisement to promote a certain point of view or a certain product.Ask students to reflect on the following: “How can we use results of our class data in an advertisement? What idea(s) could our advertisement promote?”Mathematical Process Focus: Students will reflect on the media advertisement and the appropriate/inappropriate use of data.
If possible, bring in examples of advertisements found in the media that promote a certain point of view or product and ask students to comment on these. E.g. 9 out of 10 dentists prefer Colgate.
Action! Small Groups Activity Distribute BLM 1.5.1 to students and read as a class. Assign students to groups. Direct each group to write and design two advertisements based on results of the class data collected on day 2. One ad must use the results appropriately while the other must use the results inappropriately. Explain to students that their advertisements will be graded by you and by other students, using criteria outlined in BLM 1.5.1. Once completed, collect all advertisements.
Learning Skills (Works Habits/Initiative)/Observation/Anecdotal: Observe students and make anecdotal comments as students work through the writing of the advertisements.
Mathematical Process Focus: Connecting both to class data collected on day 2 and to the activities and concepts learned on day 4 in order to create valid and invalid advertisements.
Small Groups Assessments of Advertisements Mix up the advertisements and then distribute two to each group. Ensure that no group gets its own advertisement. Instruct each group to complete BLM 1.5.1 for the two advertisements. Curriculum Expectations/Performance Task/Checkbric: Collect students work and assess each group on their advertisement and their critical appraisal of other advertisements
Consolidate Debrief
Whole Class Discussion Post the advertisements on the walls of the classroom. One wall includes valid advertisements while the other includes invalid advertisements. Discuss which advertisements were the most relevant and the most unbiased. Reflect on the strategies students used to successfully complete this activity.
Application
Home Activity or Further Classroom ConsolidationWrite a journal entry, reflecting on the criteria necessary for a good advertisement.
1.5.1: Class Advertisements – Creating & AssessingGroup Members: _______________________________________________________________
Part 1 – Create an Advertisement Using Class Data Your group will create two advertisements:
Advertisement #1 Uses the collected data appropriately.Advertisement #2 Uses the collected data inappropriately (i.e. misuses the data).
To do this:1. Brainstorm what your two advertisements will be about. Each advertisement must create
awareness or support a cause.2. Divide into two smaller groups. One group will create Advertisement #1 and the other will
create Advertisement #2.3. Hand the two completed advertisements into your teacher.
Part 2 – Assess a Class AdvertisementRead the advertisement you have been given and assess it using the following CheckBric.
Class Advertisement CheckBricDo not decide if the results are used appropriately or inappropriately – just assess the advertisement! Ye
s
Pret
ty w
ell
Har
dly
No
1. Is the purpose of the advertisement clear?2. Is the design of the advertisement appropriate? 3. Is the advertisement relevant to the student body? 4. Can the results that are presented in the ad be
generalized to the entire student body at this school?5. Are the conclusions that are made in the advertisement
backed up with evidence? 6. Overall, is the advertisement effective?
In the space provided below, write a few sentences to answer the following questions:How have the results of the data been used in the advertisement? Are the results used appropriately or inappropriately? Are they biased or misinterpreted in anyway?
Check one: This ad is valid. It uses data appropriately. This ad is not valid. It uses data inappropriately.
Unit 1: Day 8: How Popular is your Program?
Minds On: 10Learning Goal: Research and collect one-variable data on the number of graduates over time
from an apprenticeship or college program of their choice Graph, analyze, interpret and draw conclusions from data
Materials Computer Lab BLM 1.8.1 BLM 1.8.2
Action: 60
Consolidate: 5
Total=75 minAssessment
OpportunitiesMinds On… Small Groups Placemat
Arrange students in groups of 4. Ask students to individually reflect on prior learning in unit 1 and write ideas of how to present and analyze one-variable data in one corner of the Placemat (i.e. tables, graphs, mean, median, mode, standard deviation, etc). Then, have students summarize their ideas in the centre of the Placemat.
Whole Class Discussion Have each group present their ideas to the class.
Whole Group Guided Instruction Inform students that they will be collecting secondary data from Statistics Canada on the number of graduates over a 10 year period from an apprenticeship or college program that the student wishes to enrol in and then graphing and analyzing the data. Distribute BLM 1.8.1 to each student and review the expectations of the Statistical Analysis and Report assignment.
Mathematical Process Focus: Representing - Students think of different ways to present and analyze data: tables, graphs, and statistics.
Literacy Strategy:Placemat
For more information on Placemats, refer to the “Think Literacy-Mathematics, Grades 7-12” document, p.67-68.
Students will need a username and password to use E-STAT – you may wish to enter these directly into their handout
When using Fathom, remind students that they should not have spaces between digits in data (i.e. 4206 not 4 206)
Action! Individual Completion of Statistical Analysis and Report Take students to a computer lab and have them work on completing the Statistical Analysis and Report. While students are working, circulate the room to assist students and ensure students are on-task.
Mathematical Process Focus: Connecting - Students apply the mathematics they learned in Unit 1 to understand and analyze the data they collected.
Curriculum Expectations/Performance Task/Anecdotal Comments: Give students verbal feedback on their work as you circulate.
Consolidate Debrief
Whole Group Teacher Instruction Inform students that they are to complete the Statistical Analysis and Report at home if it was not completed in class. Collect the Report on the decided due date and evaluate it using the rubric provided on BLM 1.8.2.
Application
Home Activity or Further Classroom ConsolidationStudents are to complete the Statistical Analysis and Report at home if not completed in class.
1.8.1: How Popular is Your Program?
Statistical Analysis and Report
In this assignment, you will: Research and collect one-variable data on the number of graduates over a 10-year period
from an apprenticeship or college program of your choice Graph, analyze, interpret and draw conclusions from data You will submit a printed report that includes the information described in parts A through D
below (make sure you include a Title Page)
Part A: Research Go to http://estat.statcan.ca Select English Click on “accept and enter” Enter your school’s login and password Under “People” select “Education, training and learning.” What type of data can you expect
to find here? Under “Cansim” select “Educational Attainment.” What is Cansim? Select table #477-0006 if you wish to pursue a Community College Program or select
table #477-0052 if you wish to pursue an Apprenticeship Training Program Generate 3 tables (Ontario for both sexes combined, Ontario for Males, and Ontario for
Females) containing the most recent 10 years of data concerning the number of graduates in your program of interest (for Community College Program this will appear under “last year completed”)
Part B: Presenting Data Use technology (Fathom or Spreadsheet) to create 3 time series graphs (one for each set
of data)
Part C: Analyzing Data Use the technology (Fathom, spreadsheet, graphing calculator) and tools you have
learned throughout the unit to analyze your data (i.e. mean, median, mode, standard deviation, percentiles)
Project the number of graduates from your program in the year 2010
Part D: Discussion and Conclusions Use your analysis and graphs to (i) describe the trends in data; (ii) compare similarities
and differences between the number of male graduates versus the number of female graduates in your program; (iii) discuss projections for the year 2010
What other variable(s) could you collect that may help to explain the trend(s) in your data? Reflect on whether your research, calculations, and projections would affect your decision
to enrol in the chosen post-secondary education. State your conclusions.