72
UNIT 1 Extending the Number System
| Date post: | 02-Jan-2016 |
| Category: |
Documents |
| Upload: | brian-johns |
| View: | 214 times |
| Download: | 0 times |

UNIT 1Extending the Number System
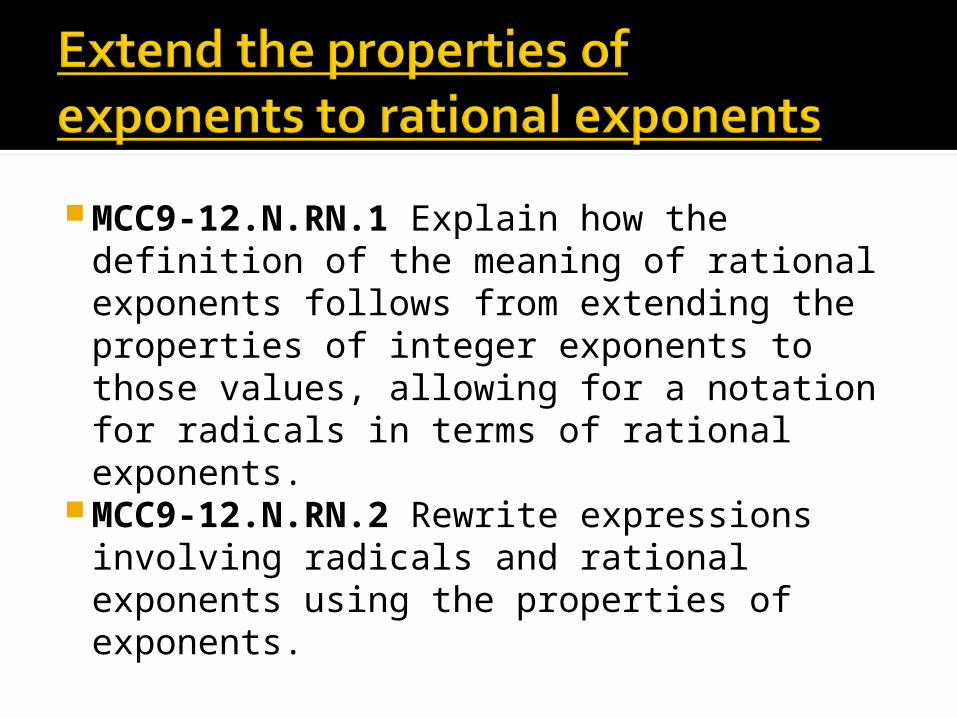
MCC9-12.N.RN.1 Explain how the definition of the meaning of rational exponents follows from extending the properties of integer exponents to those values, allowing for a notation for radicals in terms of rational exponents.
MCC9-12.N.RN.2 Rewrite expressions involving radicals and rational exponents using the properties of exponents.
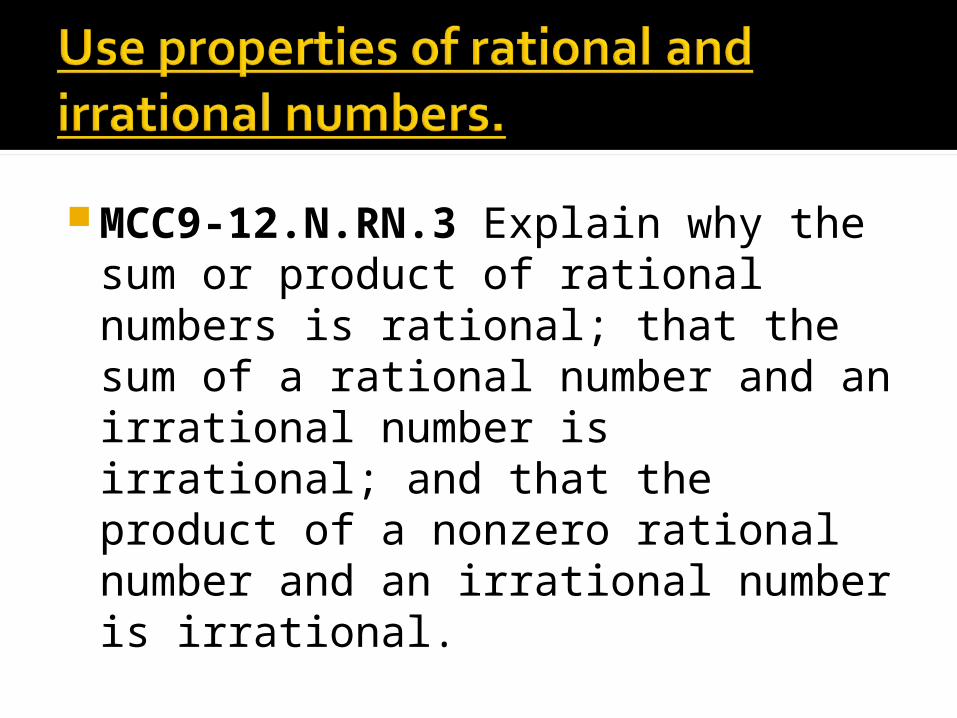
MCC9-12.N.RN.3 Explain why the sum or product of rational numbers is rational; that the sum of a rational number and an irrational number is irrational; and that the product of a nonzero rational number and an irrational number is irrational.


MCC9-12.A.APR.1 Understand that polynomials form a system analogous to the integers, namely, they are closed under the operations of addition, subtraction, and multiplication; add, subtract, and multiply polynomials.
UNIT 2Quadratic Functions
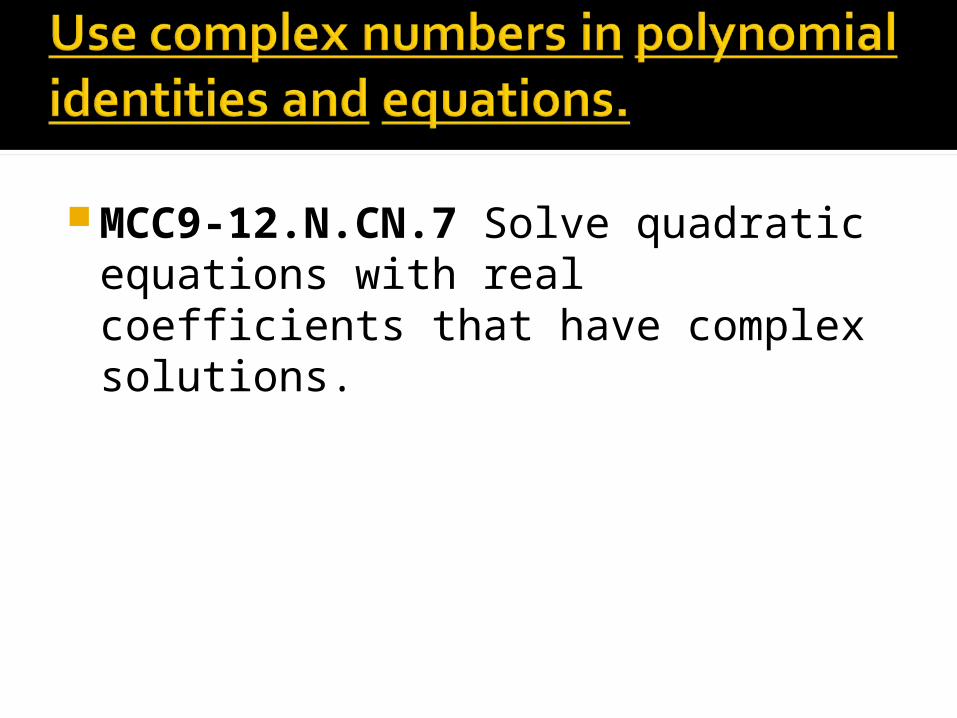
MCC9-12.N.CN.7 Solve quadratic equations with real coefficients that have complex solutions.
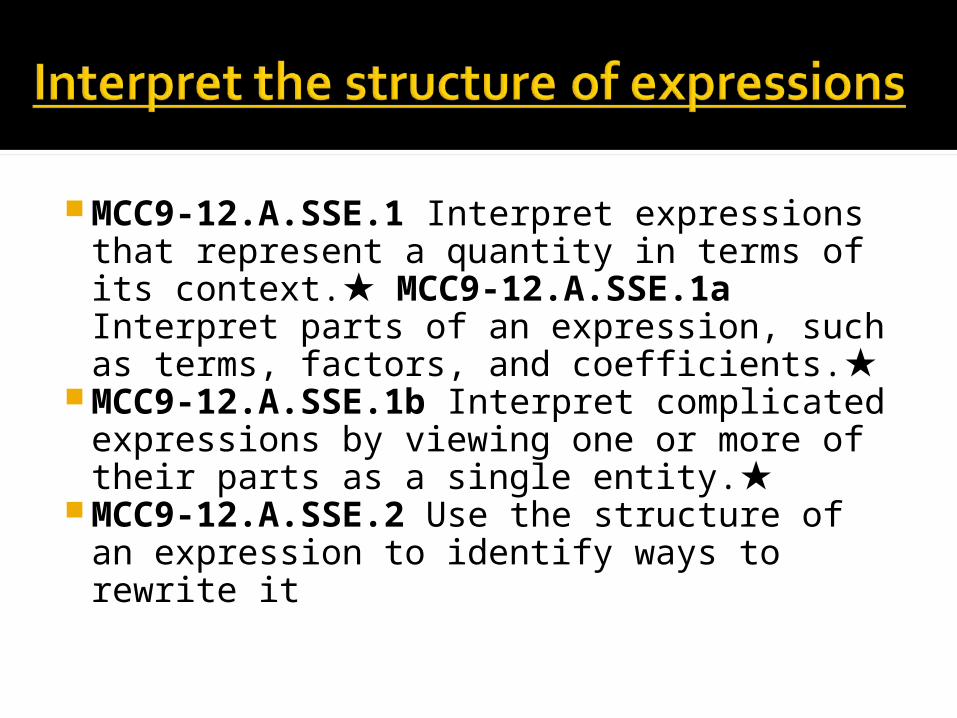
MCC9-12.A.SSE.1 Interpret expressions that represent a quantity in terms of its context.★ MCC9-12.A.SSE.1a Interpret parts of an expression, such as terms, factors, and coefficients.★
MCC9-12.A.SSE.1b Interpret complicated expressions by viewing one or more of their parts as a single entity.★
MCC9-12.A.SSE.2 Use the structure of an expression to identify ways to rewrite it
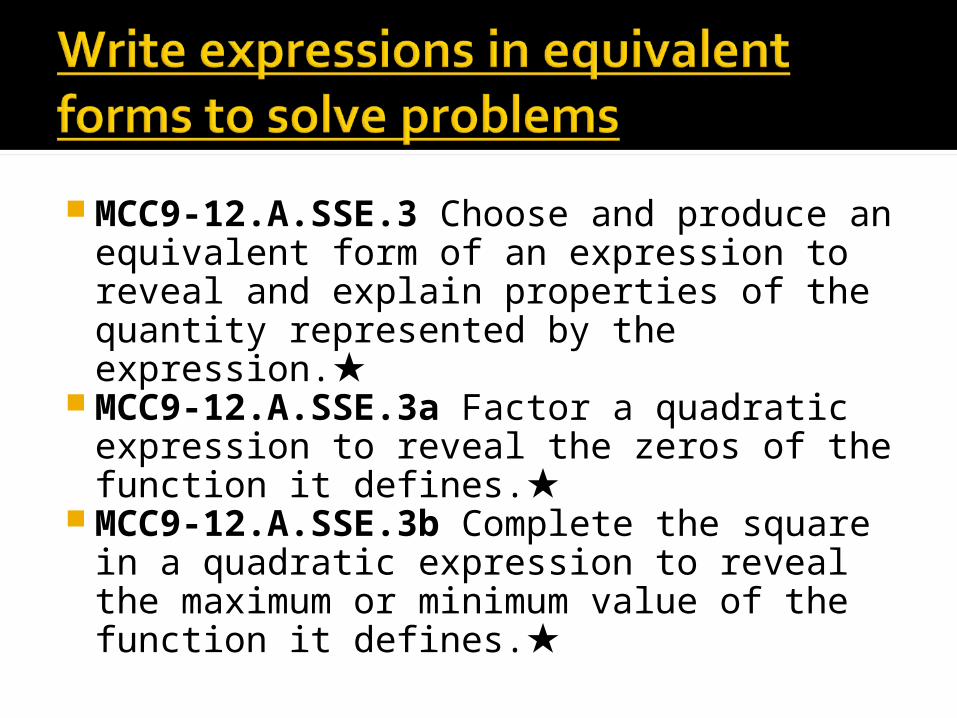
MCC9-12.A.SSE.3 Choose and produce an equivalent form of an expression to reveal and explain properties of the quantity represented by the expression.★
MCC9-12.A.SSE.3a Factor a quadratic expression to reveal the zeros of the function it defines.★
MCC9-12.A.SSE.3b Complete the square in a quadratic expression to reveal the maximum or minimum value of the function it defines.★

MCC9-12.A.CED.1 Create equations and inequalities in one variable and use them to solve problems. Include equations arising from quadratic functions.★
MCC9-12.A.CED.2 Create equations in two or more variables to represent relationships between quantities; graph equations on coordinate axes with labels and scales.★
MCC9-12.A.CED.4 Rearrange formulas to highlight a quantity of interest, using the same reasoning as in solving equations.

MCC9-12.A.REI.4 Solve quadratic equations in one variable.
MCC9-12.A.REI.4a Use the method of completing the square to transform any quadratic equation in x into an equation of the form (x – p)2 = q that has the same solutions. Derive the quadratic formula from this form.
MCC9-12.A.REI.4b Solve quadratic equations by inspection (e.g., for x2 = 49), taking square roots, completing the square, the quadratic formula and factoring, as appropriate to the initial form of the equation. Recognize when the quadratic formula gives complex solutions and write them as a ± bi for real numbers a and b.

MCC9-12.A.REI.7 Solve a simple system consisting of a linear equation and a quadratic equation in two variables algebraically and graphically.

MCC9-12.F.IF.4 For a function that models a relationship between two quantities, interpret key features of graphs and tables in terms of the quantities, and sketch graphs showing key features given a verbal description of the relationship. Key features include: intercepts; intervals where the function is increasing, decreasing, positive, or negative; relative maximums and minimums; symmetries; end behavior.★
MCC9-12.F.IF.5 Relate the domain of a function to its graph and, where applicable, to the quantitative relationship it describes.★
MCC9-12.F.IF.6 Calculate and interpret the average rate of change of a function (presented symbolically or as a table) over a specified interval. Estimate the rate of change from a graph.★
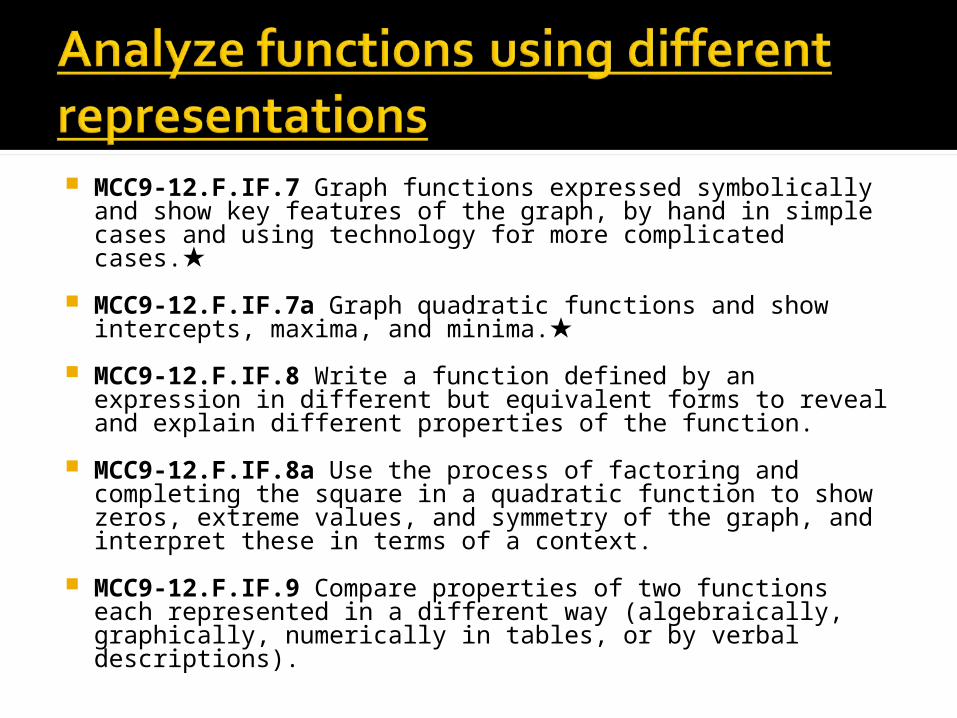
MCC9-12.F.IF.7 Graph functions expressed symbolically and show key features of the graph, by hand in simple cases and using technology for more complicated cases.★
MCC9-12.F.IF.7a Graph quadratic functions and show intercepts, maxima, and minima.★
MCC9-12.F.IF.8 Write a function defined by an expression in different but equivalent forms to reveal and explain different properties of the function.
MCC9-12.F.IF.8a Use the process of factoring and completing the square in a quadratic function to show zeros, extreme values, and symmetry of the graph, and interpret these in terms of a context.
MCC9-12.F.IF.9 Compare properties of two functions each represented in a different way (algebraically, graphically, numerically in tables, or by verbal descriptions).

MCC9-12.F.BF.1 Write a function that describes a relationship between two quantities.★
MCC9-12.F.BF.1a Determine an explicit expression, a recursive process, or steps for calculation from a context.
MCC9-12.F.BF.1b Combine standard function types using arithmetic operations.

MCC9-12.F.BF.3 Identify the effect on the graph of replacing f(x) by f(x) + k, k f(x), f(kx), and f(x + k) for specific values of k (both positive and negative); find the value of k given the graphs. Experiment with cases and illustrate an explanation of the effects on the graph using technology. Include recognizing even and odd functions from their graphs and algebraic expressions for them.

MCC9-12.F.LE.3 Observe using graphs and tables that a quantity increasing exponentially eventually exceeds a quantity increasing linearly, quadratically, or (more generally) as a polynomial function.★

MCC9-12.S.ID.6 Represent data on two quantitative variables on a scatter plot, and describe how the variables are related.★
MCC9-12.S.ID.6a Fit a function to the data; use functions fitted to data to
solve problems in the context of the data. Use given functions or choose a function suggested by the context. Emphasize quadratic models.★

UNIT 3Modeling Geometry

MCC9-12.A.REI.7 Solve a simple system consisting of a linear equation and a quadratic equation in two variables algebraically and graphically.
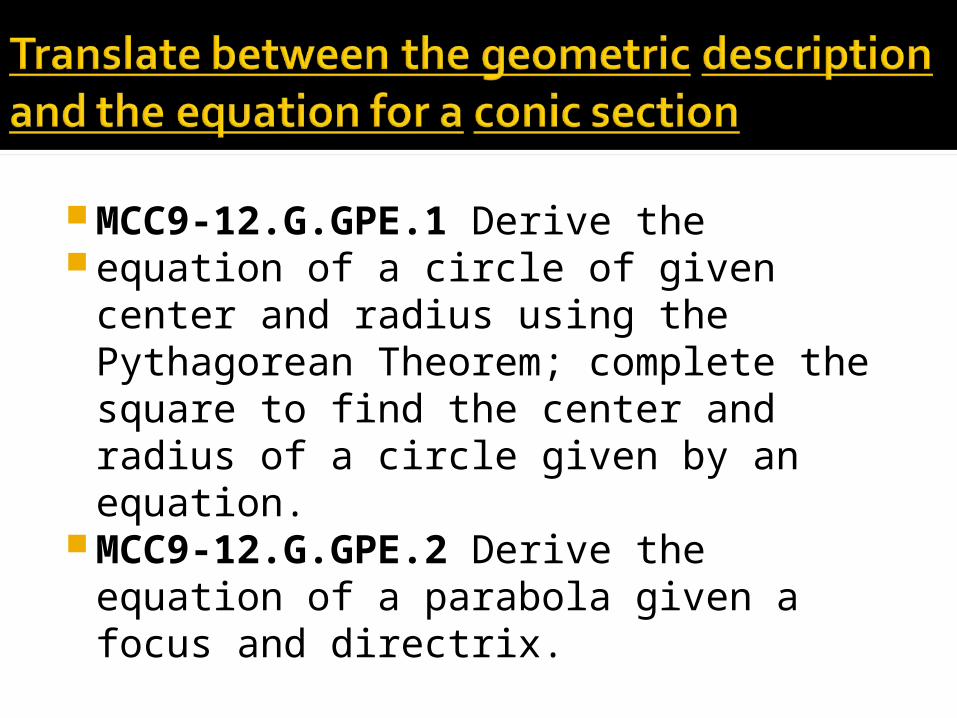
MCC9-12.G.GPE.1 Derive theequation of a circle of given center
and radius using the Pythagorean Theorem; complete the square to find the center and radius of a circle given by an equation.
MCC9-12.G.GPE.2 Derive the equation of a parabola given a focus and directrix.
MCC9-12.G.GPE.4 Use coordinates to prove simple geometric theorems algebraically. (Restrict to context of circles and parabolas)

UNIT 4Applications of Probability
MCC9-12.S.CP.1 Describe events as subsets of a sample space (the set of outcomes) using characteristics (or categories) of the outcomes, or as unions, intersections, or complements of other events (“or,” “and,” “not”).★
MCC9-12.S.CP.2 Understand that two events A and B are independent if the probability of A and B occurring together is the product of their probabilities, and use this characterization to determine if they are independent.★
MCC9-12.S.CP.3 Understand the conditional probability of A given B as P(A and B)/P(B), and interpret independence of A and B as saying that the conditional probability of A given B is the same as the probability of A, and the conditional probability of B given A is the same as the probability of B.★
MCC9-12.S.CP.4 Construct and interpret two-way frequency tables of data when two categories are associated with each object being classified. Use the two-way table as a sample space to decide if events are independent and to approximate conditional probabilities.★
MCC9-12.S.CP.5 Recognize and explain the concepts of conditional probability and independence in everyday language and everyday situations.★

MCC9-12.S.CP.6 Find the conditional probability of A given B as the fraction of B’s outcomes that also belong to A, and interpret the answer in terms of the model.★
MCC9-12.S.CP.7 Apply the AdditionRule, P(A or B) = P(A) + P(B) – P(Aand B), and interpret the answer in
terms of the model.★

UNIT 5Inferences and Conclusion from
Data
MCC9-12.S.ID.2 Use statistics appropriate to the shape of the data distribution to compare center (median, mean) and spread (interquartile range, standard deviation) of two or more different data sets.★
MCC9-12.S.ID.4 Use the mean and standard deviation of a data set to fit it to a normal distribution and to estimate population percentages. Recognize that there are data sets for which such a procedure is not appropriate. Use calculators, spreadsheets, and tables to estimate areas under the normal curve.★
MCC9-12.S.IC.1 Understand statistics as a process for making inferences about population parameters based on a random sample from that population.★
MCC9-12.S.IC.2 Decide if a specified model is consistent with results from a given data-generating process, e.g., using simulation
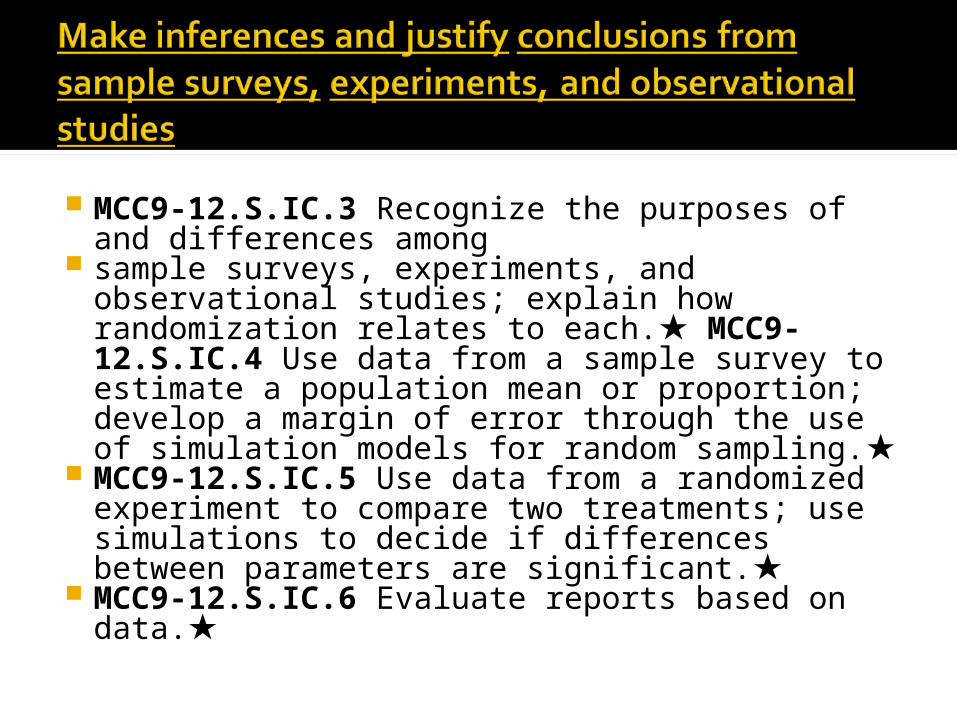
MCC9-12.S.IC.3 Recognize the purposes of and differences among
sample surveys, experiments, and observational studies; explain how randomization relates to each.★ MCC9-12.S.IC.4 Use data from a sample survey to estimate a population mean or proportion; develop a margin of error through the use of simulation models for random sampling.★
MCC9-12.S.IC.5 Use data from a randomized experiment to compare two treatments; use simulations to decide if differences between parameters are significant.★
MCC9-12.S.IC.6 Evaluate reports based on data.★

UNIT 6Polynomial Functions
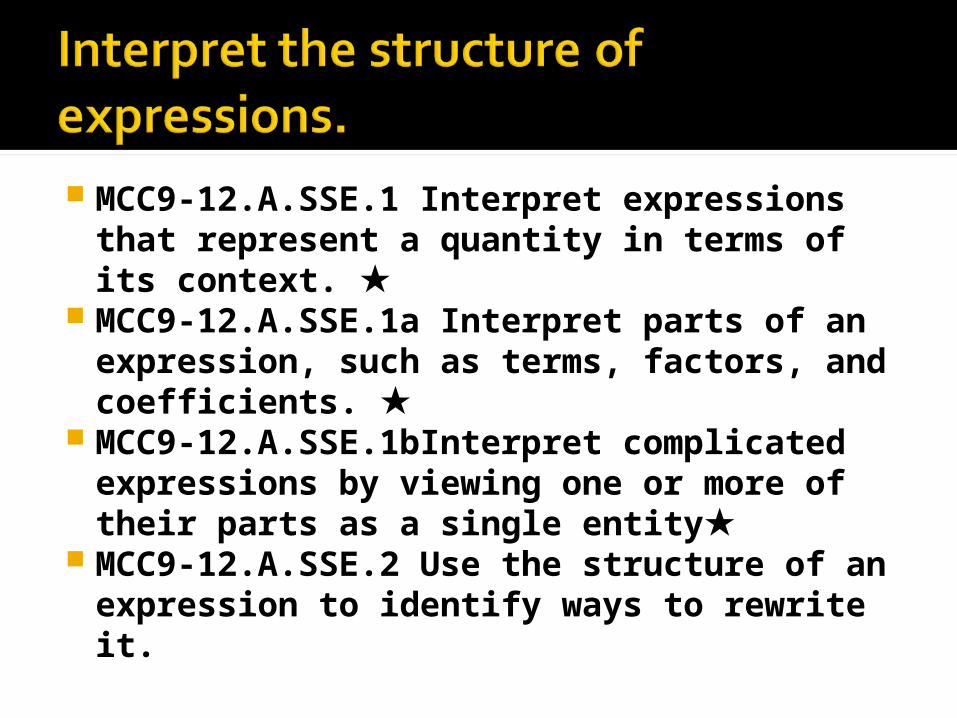
MCC9‐12.A.SSE.1 Interpret expressions that represent a quantity in terms of its context. ★
MCC9‐12.A.SSE.1a Interpret parts of an expression, such as terms, factors, and coefficients. ★
MCC9‐12.A.SSE.1bInterpret complicated expressions by viewing one or more of their parts as a single entity★
MCC9‐12.A.SSE.2 Use the structure of an expression to identify ways to rewrite it.
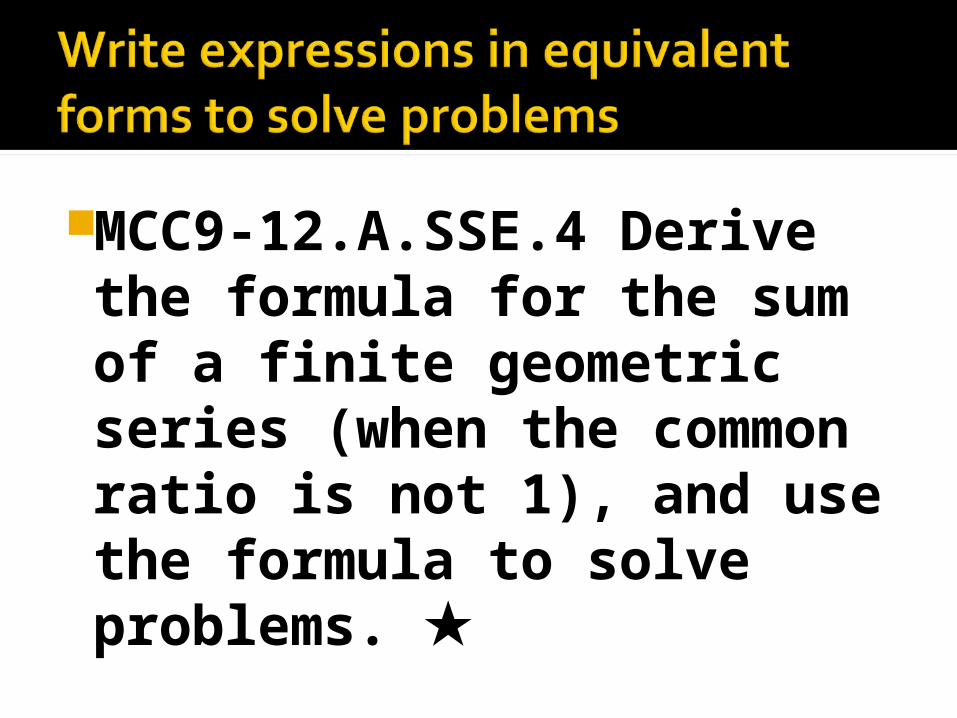
MCC9‐12.A.SSE.4 Derive the formula for the sum of a finite geometric series (when the common ratio is not 1), and use the formula to solve problems. ★
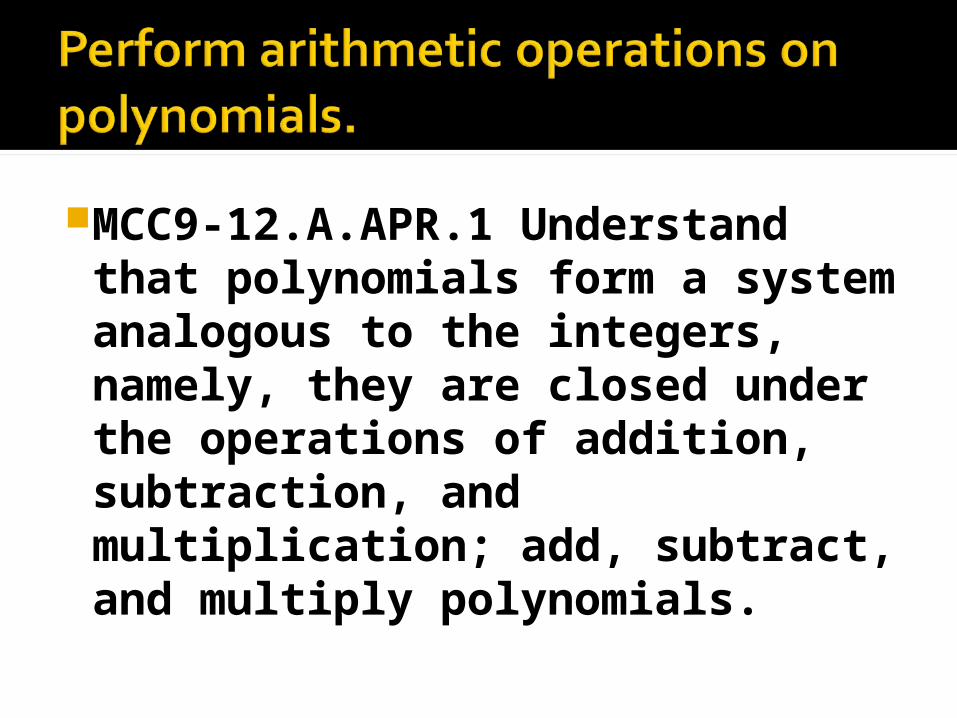
MCC9‐12.A.APR.1 Understand that polynomials form a system analogous to the integers, namely, they are closed under the operations of addition, subtraction, and multiplication; add, subtract, and multiply polynomials.
MCC9‐12.A.APR.4 Prove polynomial identities and use them to describe numerical relationships.
MCC9‐12.A.APR.5 (+) Know and apply that the Binomial Theorem gives the expansion of (x + y)n in powers of x and y for a positive integer n, where x and y are any numbers, with coefficients determined for example by Pascal’s Triangle. (The Binomial Theorem can be proved by mathematical induction or by a combinatorial argument.)
MCC9‐12.N.CN.8 (+) Extend polynomial identities to the complex numbers.
MCC9‐12.N.CN.9 (+) Know the Fundamental Theorem of Algebra; show that it is true for quadratic polynomials.

MCC9‐12.A.REI.11 Explain why the x‐coordinates of the points where the graphs of the equations y = f(x) and y = g(x) intersect are the solutions of the equation f(x) = g(x); find the solutions approximately, e.g., using technology to graph the functions, make tables of values, or find successive approximations. Include cases where f(x) and/or g(x) are linear, polynomial, rational, absolute value, exponential, and logarithmic functions.★

MCC9‐12.A.REI.7 Solve a simple system consisting of a linear equation and a quadratic polynomial equation in two variables algebraically and graphically.
MCC9‐12.A.APR.2 Know and apply the Remainder Theorem: For a polynomial p(x) and a number a, the remainder on division by x – a is p(a), so p(a) = 0 if and only if (x – a) is a factor of p(x).
MCC9‐12.A.APR.3 Identify zeros of polynomials when suitable factorizations are available, and use the zeros to construct a rough graph of the function defined by the polynomial.

MCC9‐12.F.IF.7 Graph functions expressed symbolically and show key features of the graph, by hand in simple cases and using technology for more complicated cases. ★
MCC9‐12.F.IF.7c Graph polynomial functions, identifying zeros when suitable factorizations are available, and showing end behavior. ★

UNIT 7Rational and Radical
Relationships
MCC9‐12.A.APR.6 Rewrite simple rational expressions in different forms; write a(x)/b(x) in the form q(x) + r(x)/b(x), where a(x), b(x), q(x), and r(x) are polynomials with the degree of r(x) less
MCC9‐12.A.APR.7 (+) Understand that rational expressions form a system analogous to the rational numbers, closed under addition, subtraction, multiplication, and division by a nonzero rational expression; add, subtract, multiply, and divide rational expressions.
MCC9‐12.A.CED.1 Create equations and inequalities in one variable and use them to solve problems. Include equations arising from simple rational functions.★
MCC9‐12.A.CED.2 Create equations in two or more variables to represent relationships between quantities; graph equations on coordinate axes with labels and scales.★ (Limit to radical and rational functions.)
MCC9‐12.A.REI.2 Solve simple rational and radical equations in one variable, and give examples showing how extraneous solutions may arise.
MCC9‐12.A.REI.11 Explain why the x‐coordinates of the points where the graphs of the equations y = f(x) and y = g(x) intersect are the solutions of the equation f(x) = g(x); find the solutions approximately, e.g., using technology to graph the functions, make tables of values, or find successive approximations. Include cases where f(x) and/or g(x) are rational.★

MCC9‐12.F.IF.4 For a function that models a relationship between two quantities, interpret key features of graphs and tables in terms of the quantities, and sketch graphs showing key features given a verbal description of the relationship. Key features include: intercepts; intervals where the function is increasing, decreasing, positive, or negative; relative maximums and minimums; symmetries; and end behavior.★ (Limit to radical and rational functions.)
MCC9‐12.F.IF.5 Relate the domain of a function to its graph and, where applicable, to the quantitative relationship it describes. (Limit to radical and rational functions.)

MCC9‐12.F.IF.7 Graph functions expressed symbolically and show key features of the graph, by hand in simple cases and using technology for more complicated cases.★ (Limit to radical and rational functions.)
MCC9‐12.F.IF.7b Graph square root, cube root functions.★
MCC9‐12.F.IF.7d (+) Graph rational functions, identifying zeros and asymptotes when suitable factorizations are available, and showing end behavior.★
MCC9‐12.F.IF.9 Compare properties of two functions each represented in a different way (algebraically, graphically, numerically in tables, or by verbal descriptions). (Limit to radical and rational functions.)

MCC9‐12.A.SSE.1a Interpret parts of an expression by viewing one or more of their parts as a single entity.
MCC9‐12.A.SSE.2 Use the structure of an expression to identify ways to rewrite it.

UNIT 8Exponential and Logarthims
MCC9‐12.A.SSE.3 Choose and produce an equivalent form of an expression to reveal and explain properties of the quantity represented by the expression. (Limit to exponential and logarithmic functions.)
MCC9‐12.A.SSE.3c Use the properties of exponents to transform expressions for exponential functions.

MCC9‐12.F.IF.7 Graph functions expressed symbolically and show key features of the graph, by hand in simple cases and using technology for more complicated cases. (Limit to exponential and logarithmic functions.)
MCC9‐12.F.IF.7e Graph exponential and logarithmic functions, showing intercepts and end behavior.

MCC9‐12.F.IF.8 Write a function defined by an expression in different but equivalent forms to reveal and explain different properties of the function. (Limit to exponential and logarithmic functions.)
MCC9‐12.F.IF.8b Use the properties of exponents to interpret expressions for exponential functions. (Limit to exponential and logarithmic functions.)
MCC9‐12.F.BF.5 (+) Understand the inverse relationship between exponents and logarithms and use this relationship to solve problems involving logarithms and exponents.

MCC9‐12.F.LE.4 For exponential models, express as a logarithm the solution to ab(ct) = d where a, c, and d are numbers and the base b is 2, 10, or e; evaluate the logarithm using technology.
UNIT 9Trigonometric Functions
MCC9‐12.F.IF.7 Graph functions expressed symbolically and show key features of the graph, by hand in simple cases and using technology for more complicated cases. ★ (Limit to trigonometric functions.)
MCC9‐12.F.IF.7e Graph exponential and logarithmic functions, showing intercepts and end behavior, and trigonometric functions, showing period, midline, and amplitude. ★
MCC9‐12.F.TF.1 Understand radian measure of an angle as the length of the arc on the unit circle subtended by the angle.
MCC9‐12.F.TF.2 Explain how the unit circle in the coordinate plane enables the extension of trigonometric functions to all real numbers, interpreted as radian measures of angles traversed counterclockwise around the unit circle.

MCC9‐12.F.TF.5 Choose trigonometric functions to model periodic phenomena with specified amplitude, frequency, and midline. ★
MCC9‐12.F.TF.8 Prove the Pythagorean identity (sin A)2 + (cos A)2 = 1 and use it to find sin A, cos A, or tan A, given sin A, cos A, or tan A, and the quadrant of the angle.
UNIT 10Mathematical Modeling

MCC9‐12.A.CED.1 Create equations and inequalities in one variable and use them to solve problems. Include equations arising from linear and quadratic functions, and simple rational and exponential functions.
MCC9‐12.A.CED.2 Create equations in two or more variables to represent relationships between quantities; graph equations on coordinate axes with labels and scales.

MCC9‐12.A.CED.3 Represent constraints by equations or inequalities, and by systems of equations and/or inequalities, and interpret solutions as viable or non‐viable options in a modeling context.
MCC9‐12.A.CED.4 Rearrange formulas to highlight a quantity of interest, using the same reasoning as in solving equations.

MCC9‐12.F.IF.4 For a function that models a relationship between two quantities, interpret key features of graphs and tables in terms of the quantities, and sketch graphs showing key features given a verbal description of the relationship. Key features include: intercepts; intervals where the function is increasing, decreasing, positive, or negative; relative maximums and minimums; symmetries; end behavior; and periodicity.
MCC9‐12.F.IF.5 Relate the domain of a function to its graph and, where applicable, to the quantitative relationship it describes
MCC9‐12.F.IF.6 Calculate and interpret the average rate of change of a function (presented symbolically or as a table) over a specified interval. Estimate the rate of change from a graph

MCC9‐12.F.IF.7 Graph functions expressed symbolically and show key features of the graph, by hand in simple cases and using technology for more complicated cases.
MCC9‐12.F.IF.7a Graph linear and quadratic functions and show intercepts, maxima, and minima.

MCC9‐12.F.IF.7b Graph square root, cube root, and piecewise defined functions, including step functions and absolute value functions.
MCC9‐12.F.IF.7c Graph polynomial functions, identifying zeros when suitable factorizations are available, and showing end behavior.
MCC9‐12.F.IF.7d Graph rational functions, identifying zeros and asymptotes when suitable factorizations are available, and showing end behavior.
MCC9‐12.F.IF.7e Graph exponential and logarithmic functions, showing intercepts and end behavior, and trigonometric functions, showing period, midline, and amplitude
MCC9‐12.F.IF.8 Write a function defined by an expression in different but equivalent forms to reveal and explain different properties of the function.
MCC9‐12.F.IF.8a Use the process of factoring and completing the square in a quadratic function to show zeros, extreme values, and symmetry of the graph, and interpret these in terms of a context.

MCC9‐12.F.IF.8b Use the properties of exponents to interpret expressions for exponential functions.
MCC9‐12.F.IF.9 Compare properties of two functions each represented in a different way (algebraically, graphically, numerically in tables, or by verbal descriptions).

MCC9‐12.F.BF.1 Write a function that describes a relationship between two quantities.
MCC9‐12.F.BF.1a Determine an explicit expression, a recursive process, or steps for calculation from a context.
MCC9‐12.F.BF.1b Combine standard function types using arithmetic operations.
MCC9‐12.F.BF.1c Compose functions.

MCC9‐12.F.BF.3 Identify the effect on the graph of replacing f(x) by f(x) + k, k f(x), f(kx), and f(x + k) for specific values of k(both positive and negative); find the value of k given the graphs. Experiment with cases and illustrate an explanation of the effects on the graph using technology. Include recognizing even and odd functions from their graphs and algebraic expressions for them.

MCC9‐12.F.BF.4 Find inverse functions. MCC9‐12.F.BF.4a Solve an equation of
the form f(x) = c for a simple function f that has an inverse and write an expression for the inverse.
MCC9‐12.F.BF.4b Verify by composition that one function is the inverse of another.
MCC9‐12.F.BF.4c Read values of an inverse function from a graph or a table, given that the function has an inverse.

MCC9‐12.G.GMD.4 Identify the shapes of two‐dimensional cross‐sections of three‐dimensional objects, and identify three‐dimensional objects generated by rotations of twodimensional objects.
MCC9‐12.G.MG.1 Use geometric shapes, their measures, and their properties to describe objects (e.g., modeling a tree trunk or a human torso as a cylinder).
MCC9‐12.G.MG.2 Apply concepts of density based on area and volume in modeling situations (e.g., persons per square mile, BTUs per cubic foot).
MCC9‐12.G.MG.3 Apply geometric methods to solve design problems (e.g., designing an object or structure to satisfy physical constraints or minimize cost; working with typographic grid systems based on ratios).


