Downloaded From www.singhranendra.com.np 1 Course code: SFM 603 Research note prepared byYPT Course title: Research methods and scientific writing Level: B.Sc. 4th year/1 st semester UNIT 1: Meaning and Philosophy of research Research: Research means to search or investigation the problem again and again to find out something more about the phenomena. The first glance may not always be adequate. It may be prone to the error. Therefore, we look into the phenomena again and again and study the problem differently and thoroughly each time. Research therefore is an on-going and ever going activity. In other word, Research is a human activity based on intellectual investigation and aimed at discovering, interpreting, and revising human knowledge on different aspects of the world. Some views research in terms of theoretical knowledge, others view it as application of knowledge. Definitions: It is a formal, systematic and intensive process of scientific method. __ John W.Best It is systematic, controlled, empirical & critical investigation. ___Kerlinger It is a structured problem solving, disciplined inquiry and discovery, reinforcement or refinement of knowledge. In general, Research is a systematic careful inquiry or examination done to discover new information or relationship and to expand, verify existing knowledge for some specific purpose. The specific purpose may be academic (i.e. a problem of theory) or applied (i.e. problem of practice) or both. Research methods and Research methodology Research methods are those methods or techniques which are used by the researcher to perform research operations. Generally, the methods of data collection (questionnaire, interviews etc.) and data analysis (qualitative and quantitative analysis) are used by the researcher during the course of studying his/her research problems. A Research methodology is a system of explicit rules and procedures upon which research is based. Research methodology is a systematic and an organized way to solve the research problems. It may be understood as a science of studying how research is conducted scientifically. It studies the steps adopted by a researcher in studying his/her research problem along with the logic behind them. Research methodology explains why particular methods are used & why the others are not used & the logic behind the selection of those particular methods. On the whole, research methodology outlines the systematic path towards solving the research problems by the way answering the following questions: Why a research study has been undertaken? How the research problem has been defined? In what way & why the hypothesis has been formulated? What data have been collected? Which particular method of data collection has been adopted& why? Why a particular technique of data analysis has been used? A large numbers of similar other questions are usually answered in research methodology concerning a research problem. Thus, from the above definitions of research methods & research methodology, we can say that research methodology has many dimensions & research methods do constitute a part of the research methodology or research method is the subset of research methodology. The scope of research methodology is wider than that of research methods.
Transcript
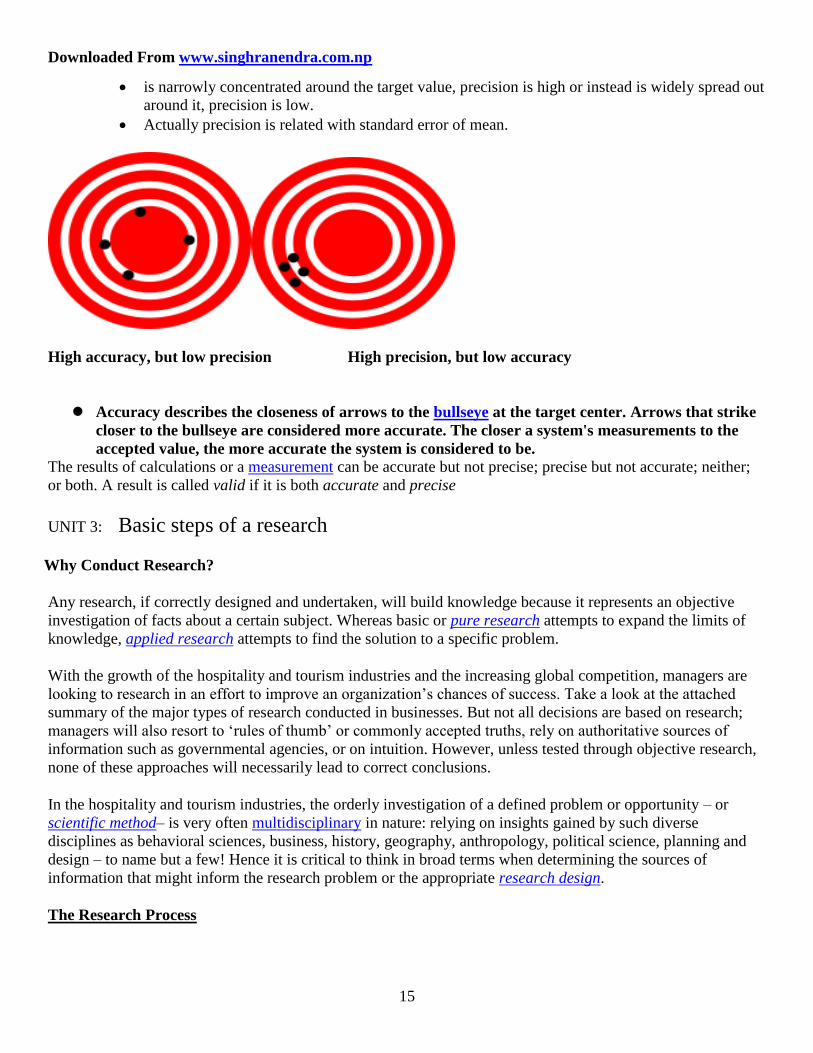
Downloaded From www.singhranendra.com.np
1
Course code: SFM 603 Research note prepared byYPT
Course title: Research methods and scientific writing
Level: B.Sc. 4th year/1st semester
UNIT 1: Meaning and Philosophy of research Research: Research means to search or investigation the problem again and again to find out something more
about the phenomena. The first glance may not always be adequate. It may be prone to the error. Therefore, we
look into the phenomena again and again and study the problem differently and thoroughly each time. Research
therefore is an on-going and ever going activity.
In other word, Research is a human activity based on intellectual investigation and aimed at discovering,
interpreting, and revising human knowledge on different aspects of the world.
Some views research in terms of theoretical knowledge, others view it as application of knowledge.
Definitions:
It is a formal, systematic and intensive process of scientific method. __ John W.Best
It is systematic, controlled, empirical & critical investigation. ___Kerlinger
It is a structured problem solving, disciplined inquiry and discovery, reinforcement or refinement of
knowledge.
In general, Research is a systematic careful inquiry or examination done to discover new information or
relationship and to expand, verify existing knowledge for some specific purpose. The specific purpose may be
academic (i.e. a problem of theory) or applied (i.e. problem of practice) or both.
Research methods and Research methodology
Research methods are those methods or techniques which are used by the researcher to perform research
operations. Generally, the methods of data collection (questionnaire, interviews etc.) and data analysis
(qualitative and quantitative analysis) are used by the researcher during the course of studying his/her research
problems.
A Research methodology is a system of explicit rules and procedures upon which research is based.
Research methodology is a systematic and an organized way to solve the research problems. It may be
understood as a science of studying how research is conducted scientifically. It studies the steps adopted by a
researcher in studying his/her research problem along with the logic behind them. Research methodology
explains why particular methods are used & why the others are not used & the logic behind the selection of
those particular methods.
On the whole, research methodology outlines the systematic path towards solving the research problems by the
way answering the following questions:
Why a research study has been undertaken?
How the research problem has been defined?
In what way & why the hypothesis has been formulated?
What data have been collected?
Which particular method of data collection has been adopted& why?
Why a particular technique of data analysis has been used?
A large numbers of similar other questions are usually answered in research methodology concerning a research
problem.
Thus, from the above definitions of research methods & research methodology, we can say that research
methodology has many dimensions & research methods do constitute a part of the research methodology or
research method is the subset of research methodology. The scope of research methodology is wider than that of
research methods.
Downloaded From www.singhranendra.com.np
2
End sought or aim of research
In general, aims of research are:
Discover new information or relationships, to expand & to verify knowledge.
Gathers new knowledge; discovers new principle.
Increases our power to understand, predict and control/manage outcome.
Ultimate purpose of research is the formulation of theories. As kerlinger puts: “End sought by science is
theory”.
Characteristics of research
Research involves gathering new data or using existing data for a new purpose.
Research is directed toward the solution of a problem.
It is systematic, carefully designed & replicable.
Research places emphasis upon the development of sound theories or upon the discovery of general principles.
Research requires expertise. The researcher knows what is already known about the problem under
investigation.
Research involves accurate observation & description.
Research is logical, objective and attempts to minimize bias.
It is carefully recorded and reported.
Methods of knowing
To know about the research as a scientific method, first of all, we have to understand four methods of
knowing.
1. The method of tenacity
In this method, people know some thing to be true simply because a lot of people fervently say or
believe it to be true. The more it is so the more valid the truth becomes. This means that frequent repetition of
such``truths‟‟ seems to enhance their validity.
2. The method of Authority
If well respected or authoritative sources say that something is so, then it must be so. The Bible & Geeta are
some of such sources. This is the method of established belief. We must take a large body of facts and
information on the basis of authority.
3. The method of Intuition
This is based on the notion that people will reach to the truth because their natural inclination will be to do so.
It is based on the notion that intuition proposition should agree with reasons & not necessarily with experiences.
4. The method of science
In this method, the ultimate conclusion of every man will be same. This method deals with real things whose
characteristics are entirely independent of our opinions about them. Personal beliefs, perceptions, biases, values,
attitudes and emotions have no place in this method.
Characteristics of scientific method
Verifiability: This means that the conclusion drawn through a scientific method is subjected (focused)
to verification at any time.
Generality: The law derived through scientific methods is not limited to individuals & useful for
universe as a generalization form.
Downloaded From www.singhranendra.com.np
3
Predictability: The results obtained from scientific methods can be further predicted with sufficient
accuracy.
Objectivity: The results obtained from a scientific method must be subjected to objective observation.
The main criterion of objectivity is that all persons come to the same conclusion about phenomenon.
System: In every scientific study, there is an accepted mode of investigation. The result arrived by
means of a haphazard method, even true, cannot be called scientific because its accuracy is purely
accidental.
Types of research: On the categorization of science, Bio-physical and social sciences research differs from each other in the
following respects:
Bio-physical research Social science research
1. Bio physical searches for biophysical laws in
natural phenomena.
1. Social sciences investigate laws related to
human or it‟s social behaviors.
2 The basic elements of it can be separated by
analysis.
2 The basic elements of it cannot be separated
analytically.
3 It possesses greater exactness. 3 Being related to the study of society, it can
make less exactness.
4 It can make more prediction due to a higher
degree of exactness
4 Because of it lesser exactness, it can make
comparately fewer predictions.
5 Objectivity is achieved with easily in it. 5 For this reason, Objectivity is achieved with
difficulty in social sciences.
6 It is not so difficult to construct laboratories
for bio-physical sciences.
6 It is difficult to construct laboratories for
social sciences.
7 The fundamental elements of it are
physically related.
7 The fundamental elements of it are
psychologically/socially related.
Qualitative and quantitative research Qualitative research differs from quantitative research in the following ways:
The data is usually gathered using less structured research instruments.
The findings are more in-depth since they make greater use of open-ended questions.
The results provide much more detail on behaviour, attitudes and motivation.
The research is more intensive/rigorous and more flexible, allowing the researcher to probe or
investigate since she/he has greater latitude (autonomy) to do so.
The results are based on smaller sample sizes and are often not representative of the population.
The research can usually not be replicated or repeated, giving it low reliability; and
The analysis of the results is much more subjective.
Because of the nature of the interaction with respondents, the training and level of expertise required by
the person engaging in the direct communication with the respondents must be quite high.
By nature of the problem, there are two types of research:
Exploratory research and Conclusive research
The level of uncertainty or difficulty in clearly identifying the problem will determine whether the research is
exploratory or conclusive in nature.
Downloaded From www.singhranendra.com.np
4
Exploratory research is conducted as the first step in determining appropriate action. It helps delimit the
problem and clearly outline the information needed as part of future research. Exploratory research tends to rely
on secondary research or data, and qualitative research techniques such as pilot study, case study and focus
groups.
In exploratory research, the researcher is involved in investigating the subject in which he/she has not sufficient
knowledge to formulate the hypothesis about the problem. Exploratory research is conducted without a formal
research design and is flexible and open to all possible ideas to solve the problem. It investigates all alternatives
until a better idea is formed.
Methods of exploratory research
-Study of secondary sources of information
-Pilots survey/experience (review) survey)/survey of individuals with ideas
- Analysis of selected cases
Conclusive research provides a reliable or representative picture of the population. Conclusive research tends
to be quantitative research in nature, whether the source is secondary or primary research.
It can further be sub-divided into two major categories:
1. Descriptive Research
2. Causal Research
Descriptive Research: Descriptive research or statistical research provides data about the population or
universe being studied. But it can only describe the "who, what, when, where and how" of a situation, not what
caused it. Observation technique and survey techniques are most commonly employed to obtain the descriptive
data.
Causal Research: To determine whether there is a cause and effect relationship between variables, causal
research must be undertaken. In this type of research, the objective is to determine which variable might be
causing certain behaviour, e.g. is the increase in sales due to price, packaging, advertising, etc? One variable
would be changed with the others being kept constant to allow for the determination in changes in behaviour.
UNIT 2: Language of Social research
Concept and construct Before any theory to be tested, first of all the terms in that theory must be defined clearly. In addition, they must
be linked in some meaningful way with the empirical world. This means that the terms used must be amenable
to some kind of measurement or quantification.
One way of looking at the terminology of social science is to make a distinction between concepts and
constructs.
Concept: Definitions:-
A concept expresses an abstraction formed by generalization from particulars. Concepts are abstractions
and represent only certain aspects of reality. --F.N. Kerlinger
Concepts are logical constructs created from sense, impressions, percepts or even fairly complex
experiences of individual or society. --Goode and Hatt
From the above definitions, it is clear that concepts have direct empirical reality and we can point out and make
some figure in our mind.Foreg, when we say „‟book”, we can point to numerous properties of books such as
length, weight, thickness, colour, subject matter and the like. Similarly, red color, fruits, vegetable, height,
weight, length, mass, energy etc. are concepts. Such terms are most amenable for measurement of some kind.
Other conceptual variables might be race, nationality, political party, achievement, religion affiliations
etc.Although these terms are less a part of our empirical reality than a book or chair however they can be taken
into account readily into our theories.
Downloaded From www.singhranendra.com.np
5
Categories of Concept: The concept can broadly be divided into two categories, namely:
1. Postulated Concept: It does not possess rigid meaning. It may be changeable and gives different meaning
according to time and context. This means when these concepts are used in two different theories, these
communicate two different meanings, sometimes even dramatically different and opposite from each other.
Such as "Elasticity" has one meaning in Economics and another meaning in Physics.Similarrly``Mass” has one
meaning in social sciences and different in physical or natural sciences.
2. Intuitive Concept: It has particular (rigid) meaning which never change in different context. The meanings
of these concepts are constant whoever one uses it. The meaning is abstracted from wider empirical context i.e.
red color.
The important features of concepts are:
Each field of science develops its own concepts. Concepts are the basic elements of scientific research.
Each concept communicates an enormous amount of experience and information to the specialists.
A scientific concept avoids multiple meanings in the same field.
With the development of knowledge and passage of time, a concept may change its meaning which may
be narrowed or broadened.
Concept is symbolic and short.
A good concept possesses the following features:-
The concept should be clear and definite i.e. good concept must be precise.
It should be comprehensive clear in formulation and understanding.
It should avoid multiple meanings in the same field.
It should be based on logic and law.
If the concept does not possess above features, they create problems and do harm than good to the
researcher.
Construct: A construct is a concept that is deliberately invented for a special scientific purpose. It is a term
invented to account for internal and indirectly observable psychological processes that in turn account for
behavior. It cannot be seen, heard or felt. It is inferred from behavior. Constructs are not directly part of our
empirical world. Scientists consciously and systematically use it in two ways:-
First, it enters into theoretical schemes and is related into various ways to other constructs.
Second, it is so defined and specified that it can be observed and measured.
To clear above ways, consider the construct "Intelligence". It can be used as:
1st, School achievement is in part a function of intelligence.
2nd
, we make observations of the intelligent of children by administering X intelligent test to them.
Other examples of construct are:-
Anxiety, faith, social class, prestige etc.
There are two definitions about construct.
1. A constitutive or nominal or conceptual definition explains the same meaning which is frequently found in
the usual dictionary. It defines a construct with other constructs. For instance, we can define “Anxiety” by
saying that it is the “subjectified fear‟‟.
2. An operational definition is the quantification of nominal definition and assigns meaning to a construct by
specifying the necessary activities/operations to measure it.
Most of the terms used by social scientists are in constructual form. When one use these terms, he must supply
set of attributes to constructs to bring them closer in the empirical world. He must bring them more into
measurable form similar to concepts that already have relatively convenient and direct empirical referents.
Downloaded From www.singhranendra.com.np
6
SCALE OF MEASUREMENT
Definitions
Measurement is the assignment of numerals to objects or events or persons according to some prescribed rules.
- F.N. Kerlinger
Measurement consists of rules for assigning numbers to objects such a way as to represent quantities of
attributes. - J.C. Nunnally
A scale of measurement is the type of variable being measured and the way it is measured. It is imperative that
the type of scale is known since different statistics are appropriate for different scales of measurement.
There are 4 types of scale of measurement:
1. Nominal (classification) scale:-
It is that lowest level of scale in which numbers (or symbols) are given to various objects just to distinguish one
object from other. The numbers or symbols used have no numerical meanings and they cannot be added or
ordered. Generally, observations are assigned to categories based on equivalence.
For e.g., Assignment of numerical symbols to the football players.
Personal attributes: - Sex, eye color, race
Demographic attributes: - State of residence, institution.
"Contrived" group: - Attendance at this class (Yes/No categories)
Other examples are: Religious affiliation, Political affiliation, school affiliation, ethnic background etc.
2. Ordinal Scale (Ranking Scale)
In this scale, observations are ranked in order of some measure of magnitude. Then, numbers assigned to groups
to show that, one is more (higher) than other but how much greater is not implied. Numerical values are used to
indicate simply rank order.
For e.g. Grading of service personals as: Professor, reader, lecturer, teaching assistant,
1 2 3 4
Here,1>2>3>4 but, 2-1 ≠ 3-2 etc.
Letter grades (in exam): A, B, C or D
Achievement such as: low, medium, high
Age category such as: infant, child, adult, senior
Other examples are: Social class, social distance, prestige rankings, rating of universities, organization
and many attitudinal phenomena etc.
(3)Interval Scale
Intervals on the scale represent equal distances on the properly being measured; there is no absolute zero (It is
with relative zero point). Zero does not represent the absence of the characteristics being measured.
Foe eg. Temperature=00C, it is meaningful & not true or absolute zero point]
(4) Ratio-Scale. (Most important and widely used scale in Research)
Same characteristics as interval scales, but the zero represents the absence of the characteristics being measured.
Or an interval scale with an absolute zero point is called Ratio-scale. Ratio between measures becomes
meaningful.
For e.g. Years of experience, monthly income, time, height, weight, length etc.
If a stick has 3 cm length of another B stick has 6 cm length. It means both are measured from 0. B has double
length than A.
Ratio of two weights in Gms of anything is identical to the ratio of two weights in pounds of the same thing.
A sentence to help remember all 4 types of scale of measurement:
A horse no.7 finished in 3rd
place in 300C heats, with a time of 4 minutes.
Nominal: Race horse NO.7 (identifies)
Ordinal: - finished in 3rd
place (orders)
Downloaded From www.singhranendra.com.np
7
Interval: - in 30 degree heat [temp, (no true zero point)]
Ratio: - with a time of 4 min. (clocked time; true zero point from start)
A dichotomous variable measured as 0 & 1 can be considered to be any of these scales
Likert Scale: It is summated rating Scale. When an individual responds to the statements, he expresses his
attitude on a scale of 1 to 5 (or some times 1to 3 or 1to 7) with 1 represents strongly disagree and 5 represents
strongly agree of the statements (can consider opposite of this). These scales can be arranged with many other
similar items. When the items all are summated the total number is an indication of some general attitude.
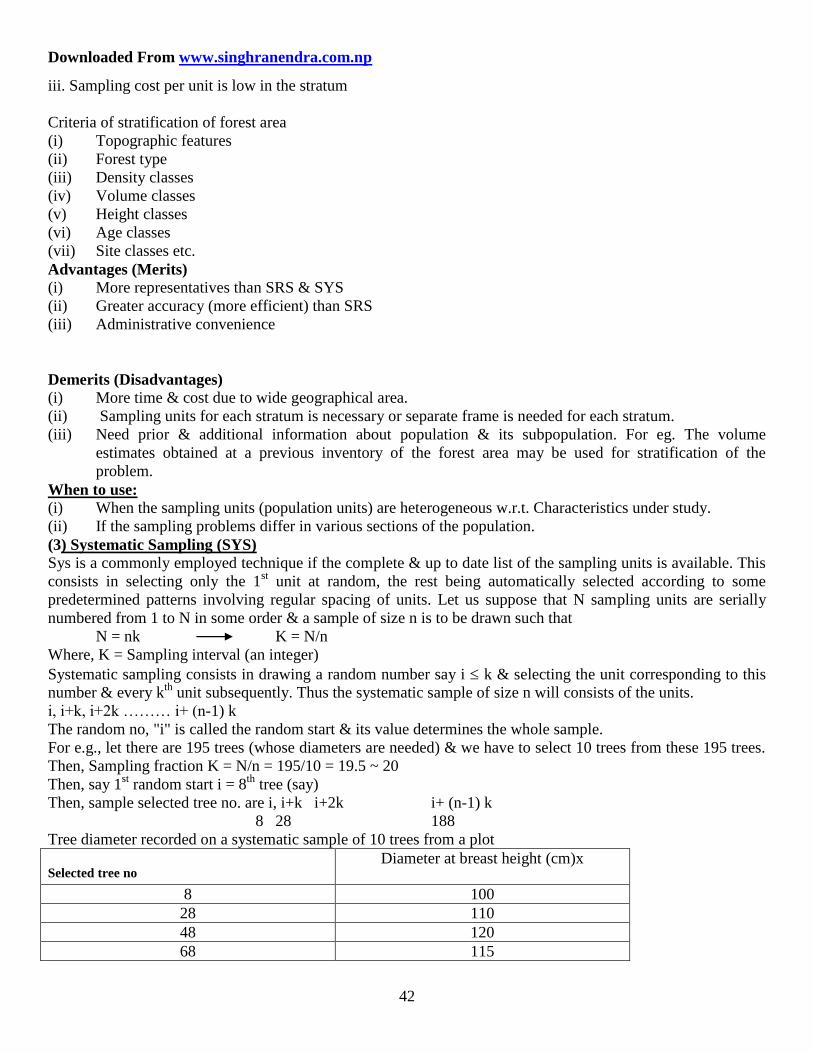
Then, sample selected tree no. are i, i+k i+2k i+ (n-1) k
8 28 188
Tree diameter recorded on a systematic sample of 10 trees from a plot
Selected tree no Diameter at breast height (cm)x
8 100
28 110
48 120
68 115
Downloaded From www.singhranendra.com.np
43
88 120
108 110
128 100
148 120
168 110
188 115
Measure of every kth tree along a certain compass bearing is an example of systematic sampling. A common
sampling unit in forest surveys is a narrow strip at right angles to a base line and running completely across the
forest. If the sampling units are strips, the scheme is known as systematic sampling by strips. Another
possibility is known as systematic line plot sampling where plots of fixed size and shape are taken at equal
intervals along equally spaced parallel lines. In the latter case, the sample could as well be systematic in two
directions.
Notice that the precision increases with the number of independent systematic samples. A theoretically valid
method of using the idea of systematic samples and at the same time leading to unbiased estimates of the
sampling error is to draw a minimum of two systematic samples with independent random starts.
Advantages (Merits)
(i) This method is simple, administrative easier, cheaper & quicker or, It is very easy to operate & checking can
be done quickly.
(ii) It is possible to select a sample in the field without as sampling frame.
Disadvantages (Demerits)
(i) If the population is not in random order, one cannot validly estimate parameter of the population.
(ii) Not suitable for more heterogeneous data.
(iii) Not suitable for infinite population
When to use
(i) If the complete & up to date lists of the sampling units are available, it is suitable.
(ii) Suitable for chronological (classification according to time), alphabetical or numerically ordered data for
e.g. Names in a telephone directory, Hospital records etc.
(iii). When we wish to draw documents from a file, particularly if the file is in chronological order.
4. Cluster Sampling
The population is divided into non-overlapping groups called clusters. A
sample of clusters are selected.
The clusters are the primary units of sampling. The members of the
clusters are the secondary units.
Cluster sampling refers to a sampling method that has the following properties.
The population is divided into N groups, called clusters.
The researcher randomly selects n clusters to include in the sample.
The number of observations within each cluster Mi is known, and M = M1 + M2 + M3 + ... + MN-1 + MN.
Each element of the population can be allocated to one, and only one, cluster.
Downloaded From www.singhranendra.com.np
44
Two types of cluster sampling methods.
One-stage cluster sampling. All of the elements within selected clusters are included in the sample.
Two-stage cluster sampling. A subset of elements within selected clusters are randomly selected for
inclusion in the sample.
Cluster Sampling: Advantages and Disadvantages
Assuming the sample size is constant across sampling methods; cluster sampling generally provides less
precision than either simple random sampling or stratified sampling. This is the main disadvantage of cluster
sampling.
Given this disadvantage, it is natural to ask: Why use cluster sampling? Sometimes, the cost per sample point is
less for cluster sampling than for other sampling methods. Given a fixed budget, the researcher may be able to
use a bigger sample with cluster sampling than with the other methods. When the increased sample size is
sufficient to balance the loss in precision, cluster sampling may be the best choice.
When to Use Cluster Sampling
Cluster sampling should be used only when it is economically justified - when reduced costs can be used to
overcome losses in precision. This is most likely to occur in the following situations.
Constructing a complete list of population elements is difficult, costly, or impossible. For example, it
may not be possible to list all of the customers of a chain of hardware stores. However, it would be
possible to randomly select a subset of stores (stage 1 of cluster sampling) and then interview a random
sample of customers who visit those stores (stage 2 of cluster sampling).
The population is concentrated in "natural" clusters (city blocks, schools, hospitals, etc.). For example,
to conduct personal interviews of operating room nurses, it might make sense to randomly select a
sample of hospitals (stage 1 of cluster sampling) and then interview all of the operating room nurses at
that hospital. Using cluster sampling, the interviewer could conduct many interviews in a single day at a
single hospital. Simple random sampling, in contrast, might require the interviewer to spend all day
traveling to conduct a single interview at a single hospital.
Even when the above situations exist, it is often unclear which sampling method should be used. Test
different options, using hypothetical data if necessary. Choose the most cost-effective approach; that is,
choose the sampling method that delivers the greatest precision for the least cost.
The Difference between Strata and Clusters
Although strata and clusters are both non-overlapping subsets of the population, they differ in several ways.
All strata are represented in the sample; but only a subset of clusters are in the sample.
Downloaded From www.singhranendra.com.np
45
With stratified sampling, the best survey results occur when elements within strata are internally
homogeneous. However, with cluster sampling, the best results occur when elements within clusters are
internally hetergeneous.
MULTISTAGE CLUSTER SAMPLING
The population is divided in non-overlapping groups called clusters. A
sample of clusters are selected.
The clusters are the primary units of sampling. The memebrs of the
clusters are the secondary units. If all the members of each selected
cluster are included in our sample (of secondary units), the method is
called a one-stage cluster sampling. If we take a random sample of
each selected cluster, the method is called a two-stage cluster sampling.
The secondary units may themselves be groups of tertiary units, and
we carry on into subsampling tertiary units from the selected secondary
unit, etc. this is called a multi-stage cluster sampling scheme.
For example, in surveying the performance of school children, the country
may be divided into areas (which form the primary units), schools within
the areas form the secondary units, the classes within the schools form
the tertiary units and the children within the classes form the main
objects of the study population.
Reasons for cluster sampling
1. It may be very expensive to compile a list of all the members of the
population we want to interview, but relatively cheap to form a list
of all the clusters, e.g. all the schools.
2. The cost is reduced, if the cost increases as the distance between
the members increases.
Size of the sample (different Formulas) The no. of sample units in the sample is known as sample size. In sampling analysis one question is always arise
"What should be the size of the sample or how large or small should be "n"? If n is too small, it may not serve to
achieve the objectives & if it is too large, we may face huge cost & waste resources.
As a general rule, sample must be of an optimum size ie it should neither be excessively large nor too small.
With this optimum sample size one can achieve reliable, efficient & representatives of the estimation of the
population.
Factors affecting the size of the sample
(1) Nature of population (Universe)
If the items of the population are homogenous, a small sample can fulfill the objective but if heterogeneous,
a large sample is necessary.
(2) No. of classes. The larger the no. of classes (or sub classes), larger should be the size of the sample.
(3) Nature of the study
For intensive & continuously studying, sample should be small. For a general survey, the size of the sample
should be large.
For extensive & not repeated nature – large sample gives good result.
(4) Type of sampling
For SRS, large sample size
But for stratified & sys RS, small sample size gives good result.
(5) Standard of accuracy (or precision) required
Downloaded From www.singhranendra.com.np
46
If the standard of accuracy or the level of precision is to be kept high, we shall require relatively large
sample.
(6) Other considerations
Nature of units, size of population, availability of finance, size of questionnaire, availability of trained
investigators, the conditions under which the sample is being conducted, the time available for completion
of study are other considerations to which a researcher must pay attention while selecting the size of the
sample
There are some methods to determine the optimum sample size for a given level of
Significance.
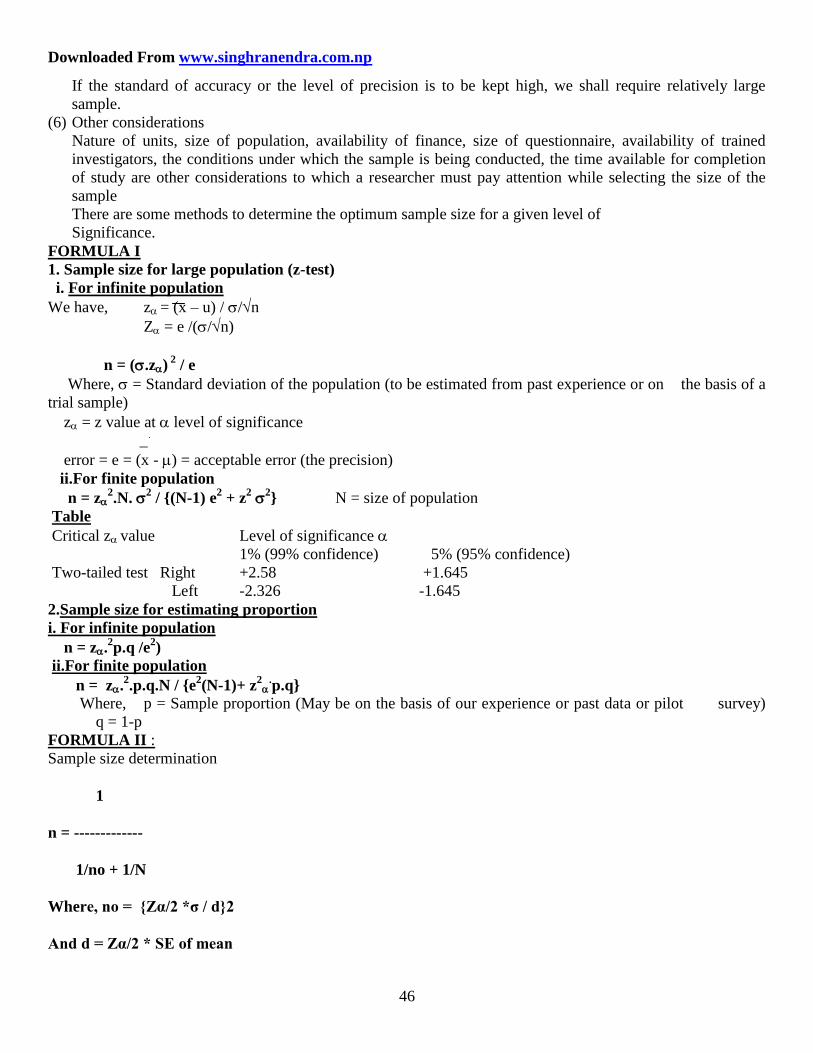
FORMULA I
1. Sample size for large population (z-test)
i. For infinite population
We have, z = (x – u) / /n
Z = e /(/n)
n = (.z) 2 / e
Where, = Standard deviation of the population (to be estimated from past experience or on the basis of a
trial sample)
z = z value at level of significance
_
error = e = (x - ) = acceptable error (the precision)
ii.For finite population
n = z2.N.
2 / {(N-1) e
2 + z
2
2} N = size of population
Table
Critical z value Level of significance
1% (99% confidence) 5% (95% confidence)
Two-tailed test Right +2.58 +1.645
Left -2.326 -1.645
2.Sample size for estimating proportion
i. For infinite population
n = z.2p.q /e
2)
ii.For finite population
n = z.2.p.q.N / {e
2(N-1)+ z
2
.p.q}
Where, p = Sample proportion (May be on the basis of our experience or past data or pilot survey)
q = 1-p
FORMULA II :
Sample size determination
1
n = -------------
1/no + 1/N
Where, no = {Zα/2 *σ / d}2
And d = Zα/2 * SE of mean
Downloaded From www.singhranendra.com.np
47
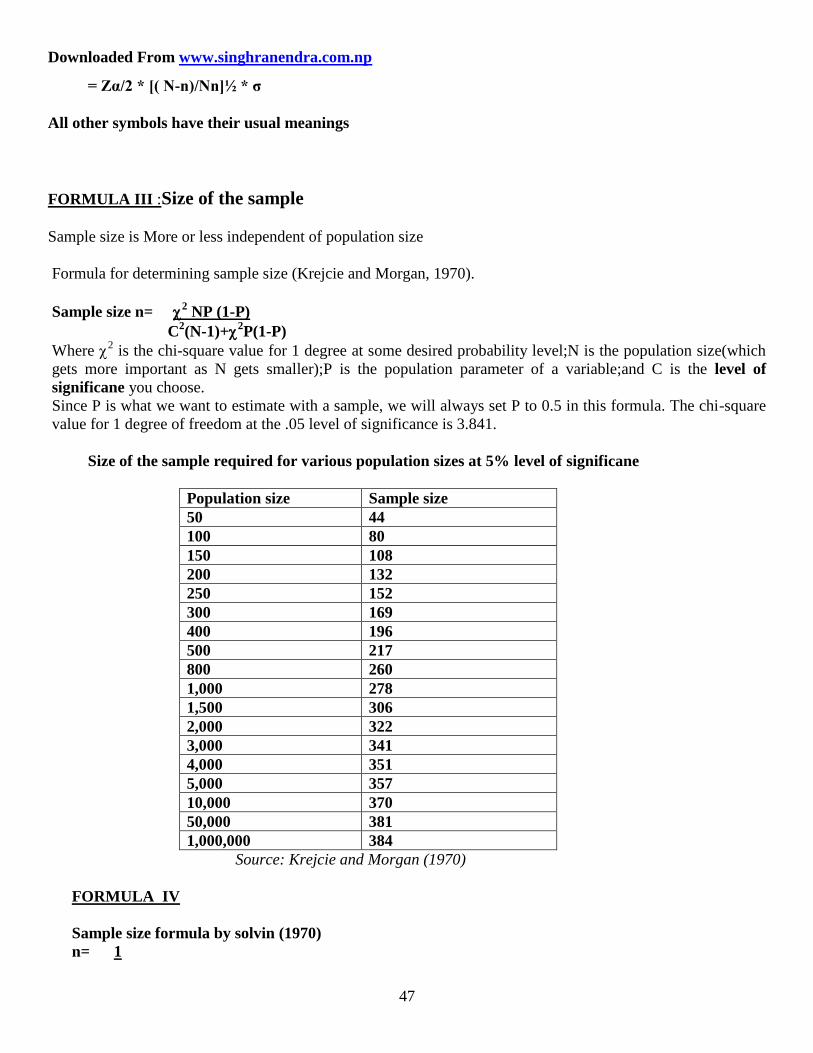
= Zα/2 * [( N-n)/Nn]½ * σ
All other symbols have their usual meanings
FORMULA III :Size of the sample
Sample size is More or less independent of population size
Formula for determining sample size (Krejcie and Morgan, 1970).
Sample size n= 2 NP (1-P)
C2(N-1)+
2P(1-P)
Where 2 is the chi-square value for 1 degree at some desired probability level;N is the population size(which
gets more important as N gets smaller);P is the population parameter of a variable;and C is the level of
significane you choose.
Since P is what we want to estimate with a sample, we will always set P to 0.5 in this formula. The chi-square
value for 1 degree of freedom at the .05 level of significance is 3.841.
Size of the sample required for various population sizes at 5% level of significane
Population size Sample size
50 44
100 80
150 108
200 132
250 152
300 169
400 196
500 217
800 260
1,000 278
1,500 306
2,000 322
3,000 341
4,000 351
5,000 357
10,000 370
50,000 381
1,000,000 384
Source: Krejcie and Morgan (1970)
FORMULA IV
Sample size formula by solvin (1970)
n= 1
Downloaded From www.singhranendra.com.np
48
1+Ne2, Where P= population size and e is margin of error.
5.2:Social Survey
The basic procedure in survey is that people are asked a number of questions on that aspect of behavior which
the sociologist is interested in. A number of people carefully selected so that their representation of their
population being studied are asked to answer exactly the same question so that the replies to different categories
of respondents may be examined for differences. One type of survey relies on contacting the respondents by
letter and asking them to complete the questionnaire themselves before returning it. These are called Mail
questionnaires. Sometimes questionnaires are not completed by individuals separately but by people in a group
under the direct supervision of the research worker. A variation of the procedure can be that a trained
interviewer asks the questions and records the responses on a schedule from each respondent.
These alternate procedures have different advantages and disadvantages. Mail questionnaires are relatively
cheap and can be used to contact respondents who are scattered over a wide area. But at the same time the
proportion of people who return questionnaires sent through post is usually rather small. The questions asked in
main questionnaires have also to be very carefully worded in order to avoid ambiguity since the respondents
cannot ask to have questions clarified for them. Using groups to complete questionnaires means that the return
rate is good and that information is assembled quickly and fairly. Administrating the interview schedules to the
respondents individually is probably the most reliable method. Several trained interviewers may be employed to
contact specific individuals. The questionnaires and schedules can consist of both close-ended and open-ended
questions. Also a special attention needs to be paid to ensure that the questionnaires are filled in logical order.
Where aptitude questions are included, great care must be exercised to ensure the proper words are used. In case
of schedules, emphasis and interactions may also be standardized between different individuals and from
respondents to respondents. Finally proper sampling techniques must be used to ensure that the sample under
study represents the universe of study. In order to enhance the reliability of data collected through
questionnaires and schedules, these questionnaires and schedules must be pretested through pilot studies.
The Survey Method of Research
Surveys are used to measure people‟s:
Opinion
Attitudes
Beliefs
Behaviors
Reactions
And attributes in response to specific questions.
Surveys can provide distribution of characteristics in a population and can accomplish this through
surveying only a portion of the people (or units) in that population.
Some qualitative methods such as focus group interviews, in-depth case studies and ethnography cannot do
the job which surveys can.
Advantages of Survey
Relatively moderate in cost
Downloaded From www.singhranendra.com.np
49
Relatively easy to large numbers
Allow for anonymity of response
Researchers can ask complex questions about respondents attitudes and behaviors.
Data can be requested from records and other sources
Allow time for respondents to reflect on events and report changes and feelings
The success of survey is enhanced if combined with other methods
1. Observation
2. Case study, etc.
Methods of Survey Research
Using mail technique
Telephone
Mixed-mode
Both mail and telephone technique
Administered under a group setting
Workshops
Classroom setting
Each has its own advantages and disadvantages
Mail method of Survey Research
Mail is the method of choice when:
Size of sample is large
Visual display of questions is needed
Educational level of respondents is high
Respondents are dispersed in a large geographical area
The budget is low (cost effective to use mail)
If designed properly, mail can generate valid and reliable information
Mail method should be avoided when:
Target population has low education
Survey questions are open-ended
Sampling frames are inadequate or not available
Recommended steps in conducting a mailed survey
Mail a pre-card
Informing respondents of forthcoming questionnaire
Mail first packet
First Packet should include:
Cover letter
Appropriately constructed letterhead, cosigned (If joint research project), individually signed, etc.
Questionnaire
Booklet, saddleback stapled, figure on front page, back page blank, etc.
Pre-addressed, stamped return envelope
First Packet should include:
Incentive - as appropriate
“Return card”, mailed flat, commemorative stamp, etc.
Recommended steps in conducting a mailed survey
Postcard reminder - with rationalization
First follow-up
Second complete packet with new cover letter
Postcard reminder - with rationalization
Downloaded From www.singhranendra.com.np
50
Phone call reminders
Other follow-ups if deemed appropriate
Control non-response error (bias)
Telephone method of Survey
Telephone is the method of choice when:
Respondents are widely dispersed geographically
Speed in data collection is essential
Sample size is small
Cost is not a big factor
Telephone surveys may yield a higher response rate than mail surveys
Interviewers can explain questions not understood by respondents
Telephone surveys should be avoided when:
We need to ask long and complex questions and/or bias from people without telephones cannot be tolerated
Low budget (cost may be higher than mail)
Telephone surveys require good interviewing skills
There is a natural bias in favor of those with listed numbers and who are usually at home.
Telephone surveys require clear and simple questions
If respondent is unfamiliar with a caller, it may cause indifference and poor cooperation
Mixed-Mode Survey Method of Research
Mixed-Mode survey is the method of choice when:
One method won‟t get an adequate response rate
Faced with sampling problems
Mixed-mode surveys should be avoided when:
Key evaluation question involve attitude and/or social desirability
5.3: Questionnaire method
It is a most popular and widely used technique in which information is obtained with the help of a
questionnaire, which is prepared exclusively for the purpose. In the other words with the help of asset of
questions, all the required data is collected. In this method, the investigator doesn‟t go to any respondents for
the collection of information.
There are various definitions about questionnaire methods which are given below:
In general, the word questionnaire refers to a device for securing answers to questions by using a form which
the respondent fills in him/herself. ----------------- Goode and Hatt
A questionnaire is a list of questions sent to a numbers of persons for them to answers. It secures
standardized result that can be tabulated and treated statistically. ------Bogardus
A questionnaire is generally sent through the mail to the informants to be answered as specified in a covering
letter. --- P.V. Young
From above definitions, one can trace the following uniqueness (individuality) of questionnaire:
It is an indirect technique of primary data collection.
Mailing process is essentials in questionnaire technique.
Questionnaire technique is self –administered.
Respondents must be literate to use this technique.
Larger number of respondents can be included.
Wide area can be covered by questionnaire technique.
It is a quantitative technique rather than qualitative.
Advantages and Disadvantages of questionnaire method
Advantages
Downloaded From www.singhranendra.com.np
51
Through the help of post office and drop-and-collect technique a single researcher can gather data from
a large and representative sample at a relatively low cost.
Questionnaires ensure the anonymity (secrecy) of the respondents and provide sufficient time to the
respondents to think, fill- up and sent it back.
It is less expensive than other technique of primary data collection. The researcher can save his/her
time, resources and efforts by proper handling of questionnaire.
All the respondents get the same questions with a self –administered (self-managed or controlled)
questionnaire; therefore there is no possibility of interviewer bias.
Questionnaire stimulates free though and is convenient to fill up; it provides a chance for respondents to