0 Unit 1: Probability Standards Addressed: Understand independence and conditional probability and use them to interpret data MGSE9-12.S.CP.1 Describe categories of events as subsets of a sample space using unions, intersections, or complements of other events (or, and, not). MGSE9-12.S.CP.2 Understand that if two events A and B are independent, the probability of A and B occurring together is the product of their probabilities, and that if the probability of two events A and B occurring together is the product of their probabilities, the two events are independent. MGSE9-12.S.CP.3 Understand the conditional probability of A given B as P (A and B)/P(B). Interpret independence of A and B in terms of conditional probability; that is the conditional probability of A given B is the same as the probability of A and the conditional probability of B given A is the same as the probability of B. MGSE9-12.S.CP.4 Construct and interpret two-way frequency tables of data when two categories are associated with each object being classified. Use the two-way table as a sample space to decide if events are independent and to approximate conditional probabilities. For example, use collected data from a random sample of students in your school on their favorite subject among math, science, and English. Estimate the probability that a randomly selected student from your school will favor science given that the student is in tenth grade. Do the same for other subjects and compare the results. MGSE9-12.S.CP.5 Recognize and explain the concepts of conditional probability and independence in everyday language and everyday situations. For example, compare the chance of having lung cancer if you are a smoker with the chance of being a smoker if you have lung cancer. Use the rules of probability to compute probabilities of compound events in a uniform probability model MGSE9-12.S.CP.6 Find the conditional probability of A given B as the fraction of B’s outcomes that also belong to A, and interpret the answer in context. MGSE9-12.S.CP.7 Apply the Addition Rule, P(A or B) = P(A) + P(B) – P(A and B), and interpret the answers in context.
Transcript
0
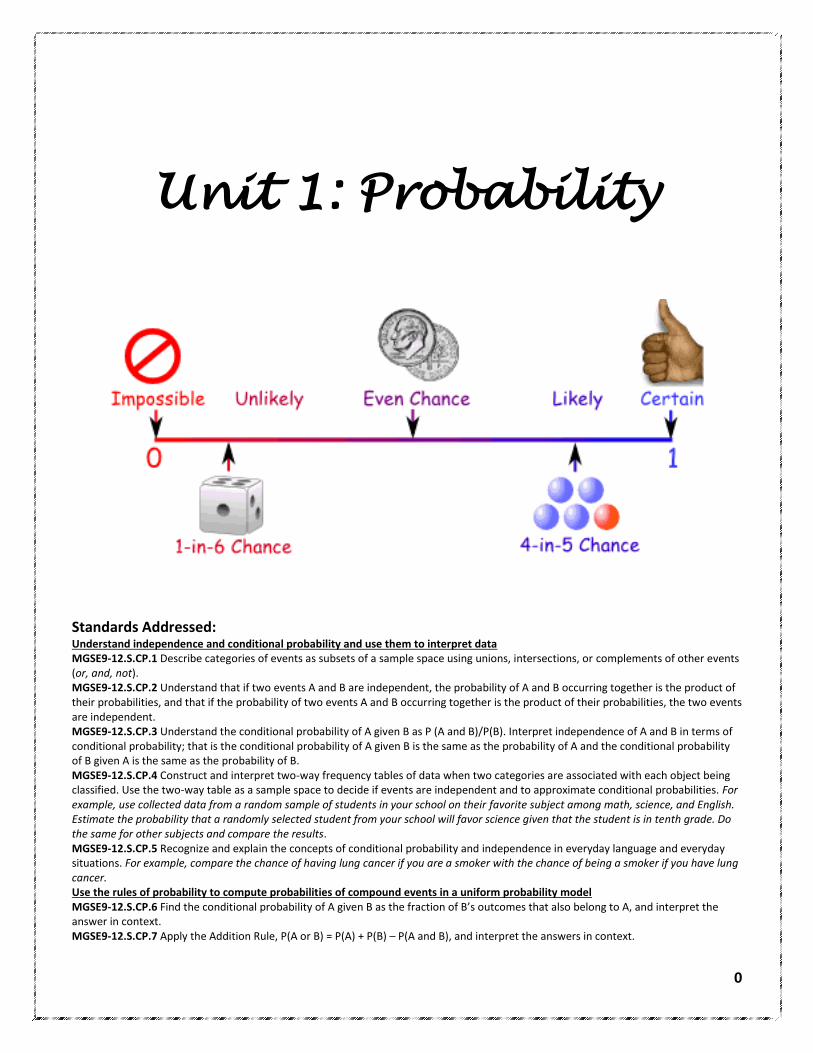
Unit 1: Probability
Standards Addressed: Understand independence and conditional probability and use them to interpret data MGSE9-12.S.CP.1 Describe categories of events as subsets of a sample space using unions, intersections, or complements of other events (or, and, not). MGSE9-12.S.CP.2 Understand that if two events A and B are independent, the probability of A and B occurring together is the product of their probabilities, and that if the probability of two events A and B occurring together is the product of their probabilities, the two events are independent. MGSE9-12.S.CP.3 Understand the conditional probability of A given B as P (A and B)/P(B). Interpret independence of A and B in terms of conditional probability; that is the conditional probability of A given B is the same as the probability of A and the conditional probability of B given A is the same as the probability of B. MGSE9-12.S.CP.4 Construct and interpret two-way frequency tables of data when two categories are associated with each object being classified. Use the two-way table as a sample space to decide if events are independent and to approximate conditional probabilities. For example, use collected data from a random sample of students in your school on their favorite subject among math, science, and English. Estimate the probability that a randomly selected student from your school will favor science given that the student is in tenth grade. Do the same for other subjects and compare the results. MGSE9-12.S.CP.5 Recognize and explain the concepts of conditional probability and independence in everyday language and everyday situations. For example, compare the chance of having lung cancer if you are a smoker with the chance of being a smoker if you have lung cancer. Use the rules of probability to compute probabilities of compound events in a uniform probability model MGSE9-12.S.CP.6 Find the conditional probability of A given B as the fraction of B’s outcomes that also belong to A, and interpret the answer in context. MGSE9-12.S.CP.7 Apply the Addition Rule, P(A or B) = P(A) + P(B) – P(A and B), and interpret the answers in context.
1
Learning Task: How odd? For this task you will need a pair of six-sided dice. You are interested in the probability that one (or both) of the dice show odd values.
1. Roll your pair of dice 30 times, each time recording a success if one (or both) of the dice show an odd number and a failure if the dice do not show an odd number.
Number of Successes
Number of Failures
2. Based on your trials, what would you estimate the probability of two dice showing at least one
odd number? Explain your reasoning.
3. You have just calculated an empirical probability. 30 trials is generally sufficient to estimate the theoretical probability, the probability that you expect to happen based upon fair chance. For instance, if you flip a coin ten times you expect the coin to land heads and tails five times apiece; in reality, we know this does not happen every time you flip a coin ten times.
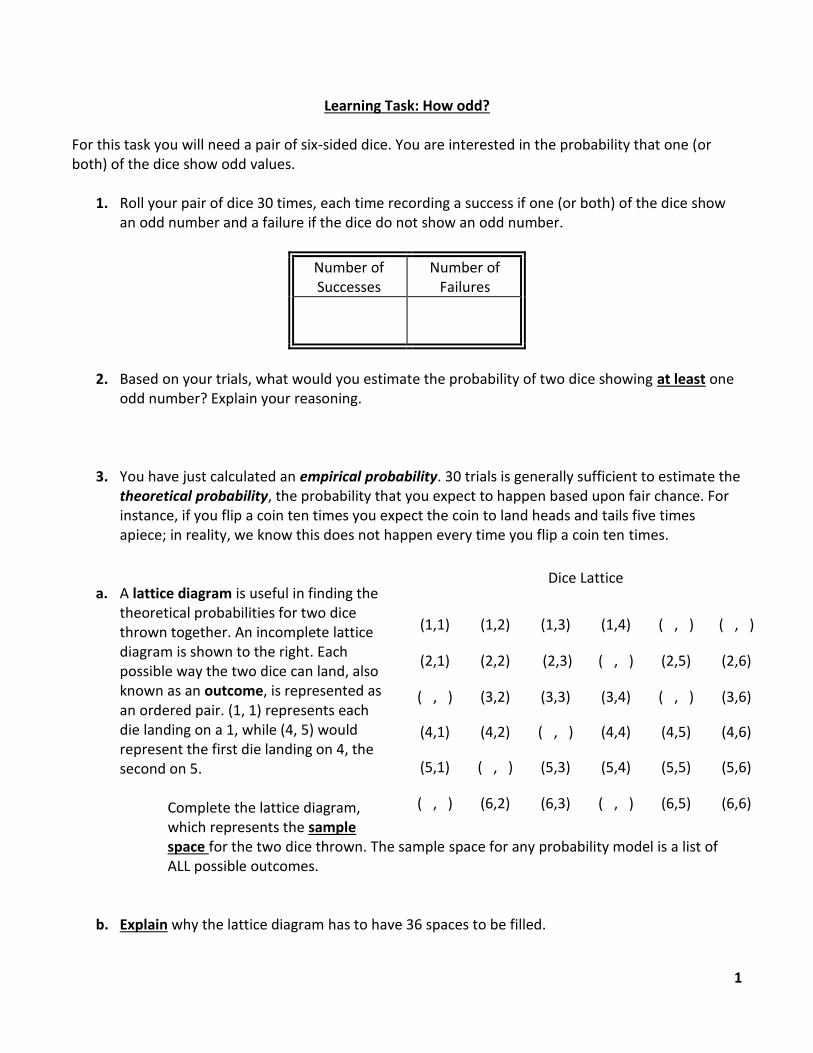
a. A lattice diagram is useful in finding the theoretical probabilities for two dice thrown together. An incomplete lattice diagram is shown to the right. Each possible way the two dice can land, also known as an outcome, is represented as an ordered pair. (1, 1) represents each die landing on a 1, while (4, 5) would represent the first die landing on 4, the second on 5.
Complete the lattice diagram, which represents the sample space for the two dice thrown. The sample space for any probability model is a list of ALL possible outcomes.
b. Explain why the lattice diagram has to have 36 spaces to be filled.
Dice Lattice
(1,1) (1,2) (1,3) (1,4) ( , ) ( , )
(2,1) (2,2) (2,3) ( , ) (2,5) (2,6)
( , ) (3,2) (3,3) (3,4) ( , ) (3,6)
(4,1) (4,2) ( , ) (4,4) (4,5) (4,6)
(5,1) ( , ) (5,3) (5,4) (5,5) (5,6)
( , ) (6,2) (6,3) ( , ) (6,5) (6,6)
2
c. Using your lattice, write the set of outcomes that the sum of two die rolled will be a 9.
d. Using your lattice, find the probability that the sum of two die rolled will be 9. Justify your
reasoning.
e. Using your lattice, determine the probability of rolling doubles.
f. Using your lattice, determine the probability that the sum is a multiple of four.
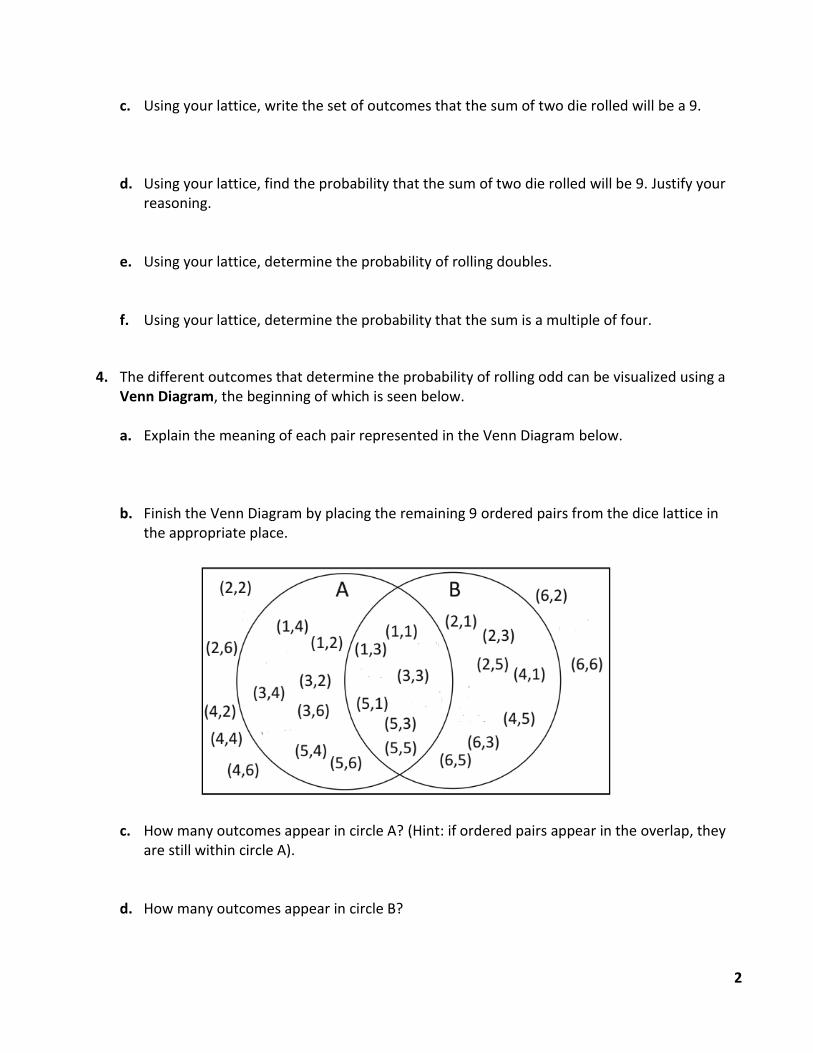
4. The different outcomes that determine the probability of rolling odd can be visualized using a Venn Diagram, the beginning of which is seen below.
a. Explain the meaning of each pair represented in the Venn Diagram below.
b. Finish the Venn Diagram by placing the remaining 9 ordered pairs from the dice lattice in the appropriate place.
c. How many outcomes appear in circle A? (Hint: if ordered pairs appear in the overlap, they are still within circle A).
d. How many outcomes appear in circle B?
3
e. The portion of the circles that overlap (i.e. events that can occur at the same time) is called the intersection. The notation used for intersections is , read as “A and B.” How many outcomes are in ?
f. When you look at different parts of a Venn Diagram together, you are considering the union of the two outcomes. The notation for unions is , read as “A or B.” In the Venn Diagram you created, represents all the possible outcomes where an odd number shows. How many outcomes are in the union?
g. Record your answers to (b), (c), (d), and (e) in the table below.
b. Circle A c. Circle B d. e.
h. Using the table above, how is your answer to e related to b, c, and d?
i. Based on what you have seen, make a conjecture about the relationship of A, B, A B andA B using notation you just learned.
j. What outcomes have we not used yet and why?
In a Venn Diagram the set of outcomes that are not included in some set is called the
complement of that set. The notation used for the complement of set A is A (which is read “A bar”) or A’ (which is read “not A”). For example, in the Venn Diagram you completed above, the
outcomes that are outside of A B are denoted AÈB.
k. Which outcomes appear in BA' ?
l. Which outcomes appear in BA ?
A B
A B
A B A B
4
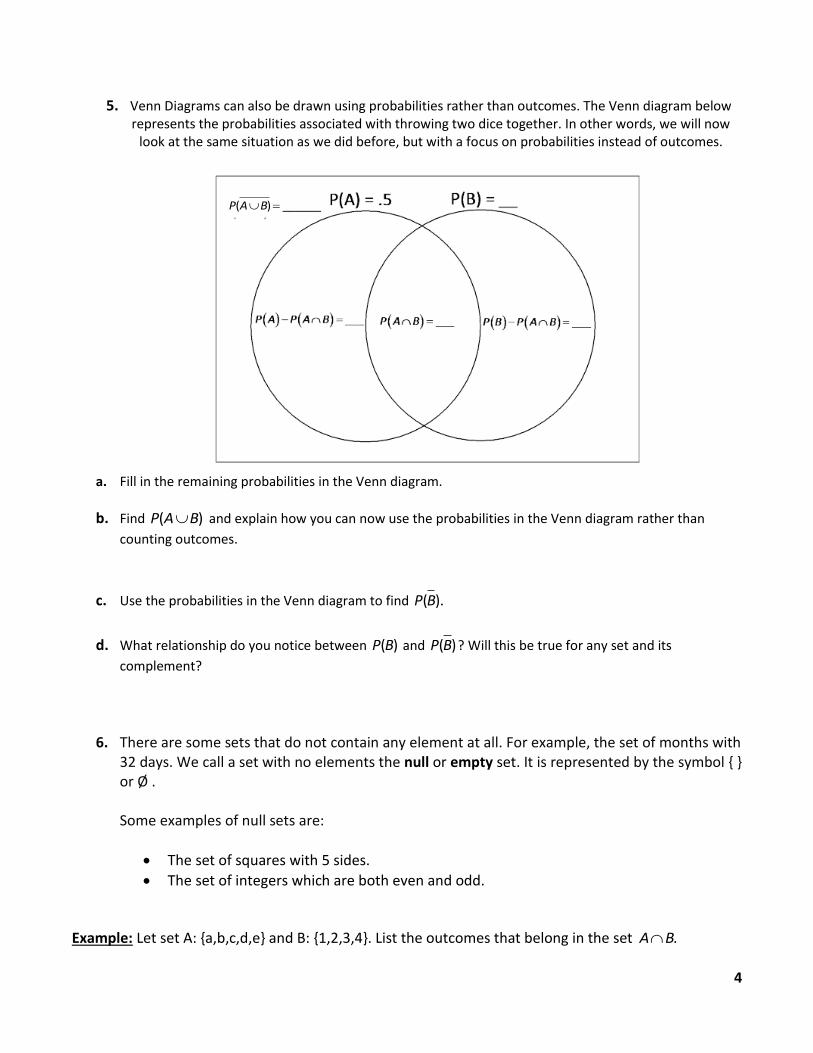
5. Venn Diagrams can also be drawn using probabilities rather than outcomes. The Venn diagram below represents the probabilities associated with throwing two dice together. In other words, we will now
look at the same situation as we did before, but with a focus on probabilities instead of outcomes.
a. Fill in the remaining probabilities in the Venn diagram.
b. Find P A B( ) and explain how you can now use the probabilities in the Venn diagram rather than
counting outcomes.
c. Use the probabilities in the Venn diagram to find P B( ).
d. What relationship do you notice between P B( ) and P B( )? Will this be true for any set and its
complement?
6. There are some sets that do not contain any element at all. For example, the set of months with 32 days. We call a set with no elements the null or empty set. It is represented by the symbol { } or Ø . Some examples of null sets are:
The set of squares with 5 sides.
The set of integers which are both even and odd.
Example: Let set A: {a,b,c,d,e} and B: {1,2,3,4}. List the outcomes that belong in the set A B.
P A B( ) ______
5
Skills Practice: Sets
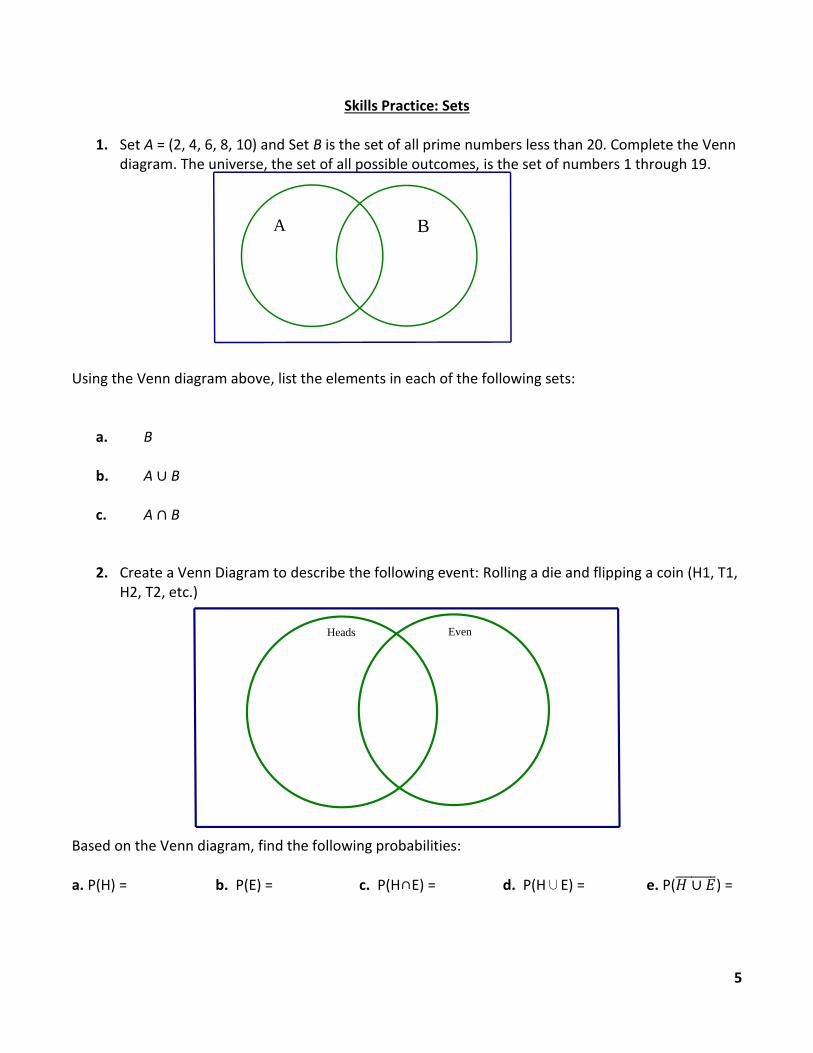
1. Set A = (2, 4, 6, 8, 10) and Set B is the set of all prime numbers less than 20. Complete the Venn diagram. The universe, the set of all possible outcomes, is the set of numbers 1 through 19.
Using the Venn diagram above, list the elements in each of the following sets:
a. B
b. A ∪ B
c. A ∩ B
2. Create a Venn Diagram to describe the following event: Rolling a die and flipping a coin (H1, T1,
H2, T2, etc.)
Based on the Venn diagram, find the following probabilities: a. P(H) = b. P(E) = c. P(H∩E) = d. P(H∪E) = e. P(𝐻 ∪ 𝐸̅̅ ̅̅ ̅̅ ̅̅ ) =
EvenHeads
A B
6
3. Suppose P(A) = 0.15 and P(B) = 0.64, find the following:
a. 𝑃(�̅�) = b. 𝑃(�̅� − �̅�) = c. 𝑃(𝐵′) + 𝑃(𝐴) =
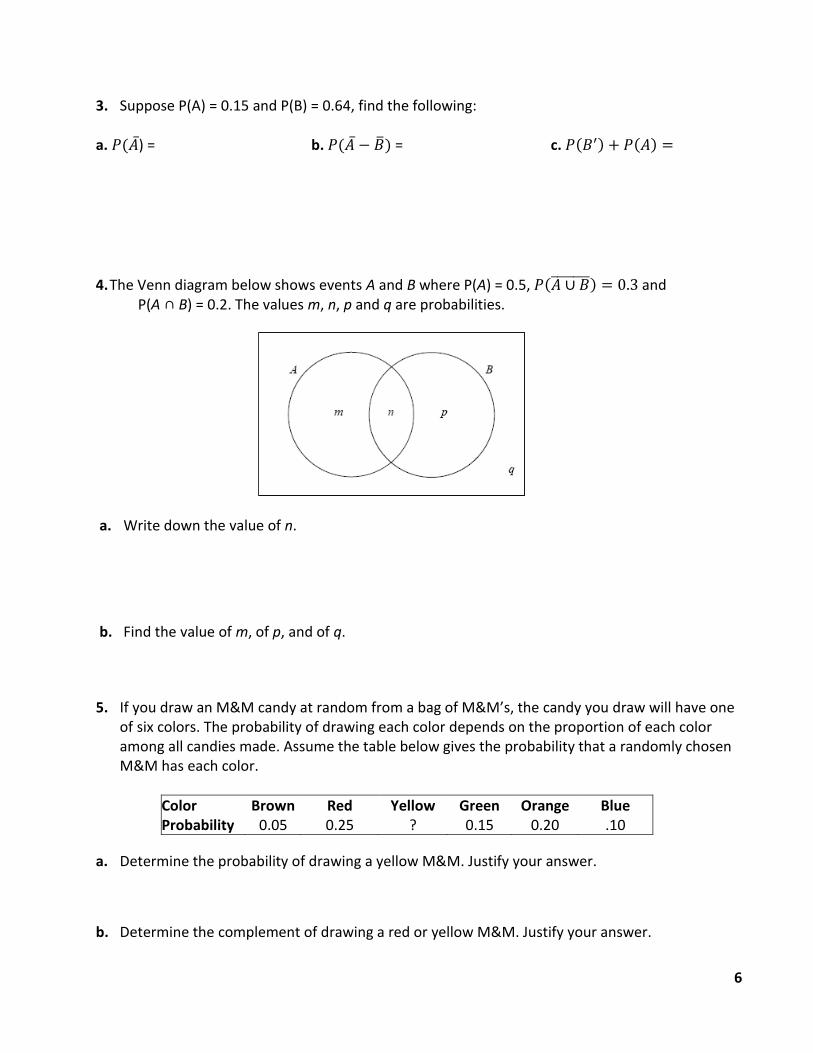
4. The Venn diagram below shows events A and B where P(A) = 0.5, 𝑃(𝐴 ∪ 𝐵̅̅ ̅̅ ̅̅ ̅) = 0.3 and P(A ∩ B) = 0.2. The values m, n, p and q are probabilities.
a. Write down the value of n.
b. Find the value of m, of p, and of q.
5. If you draw an M&M candy at random from a bag of M&M’s, the candy you draw will have one of six colors. The probability of drawing each color depends on the proportion of each color among all candies made. Assume the table below gives the probability that a randomly chosen M&M has each color.
Color Brown Red Yellow Green Orange Blue Probability 0.05 0.25 ? 0.15 0.20 .10
a. Determine the probability of drawing a yellow M&M. Justify your answer.
b. Determine the complement of drawing a red or yellow M&M. Justify your answer.
7
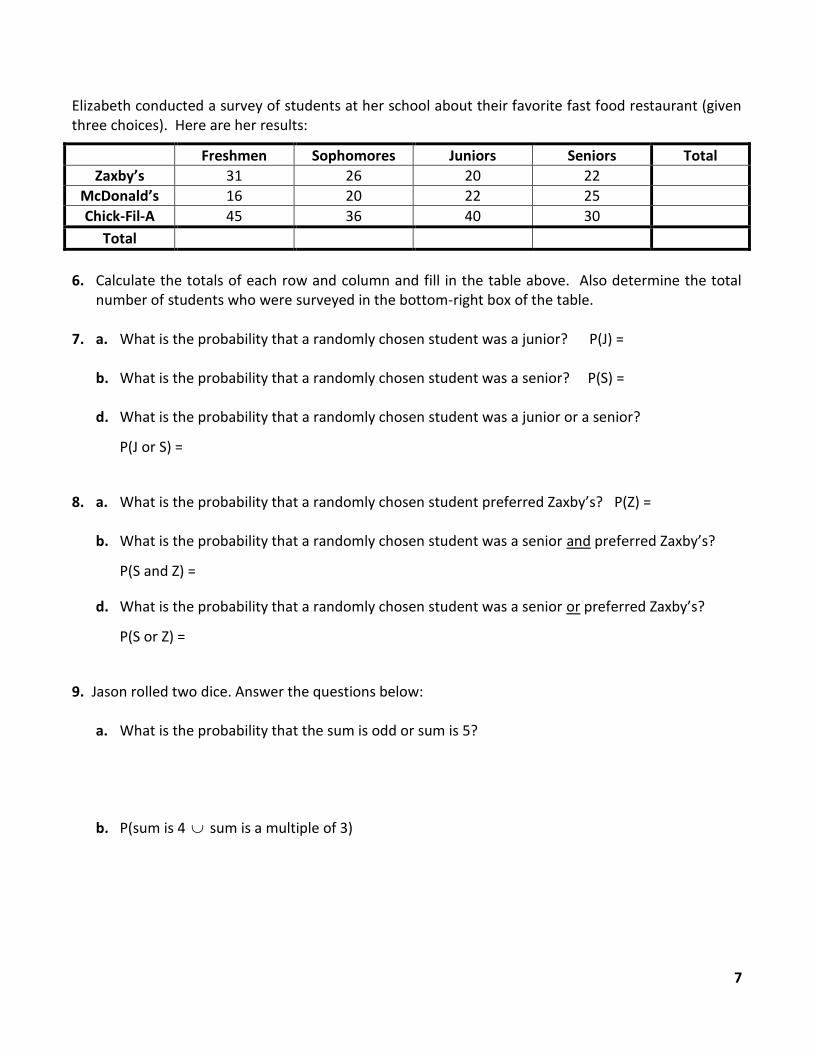
Elizabeth conducted a survey of students at her school about their favorite fast food restaurant (given three choices). Here are her results:
Freshmen Sophomores Juniors Seniors Total
Zaxby’s 31 26 20 22
McDonald’s 16 20 22 25
Chick-Fil-A 45 36 40 30
Total
6. Calculate the totals of each row and column and fill in the table above. Also determine the total
number of students who were surveyed in the bottom-right box of the table.
7. a. What is the probability that a randomly chosen student was a junior? P(J) =
b. What is the probability that a randomly chosen student was a senior? P(S) = d. What is the probability that a randomly chosen student was a junior or a senior?
P(J or S) =
8. a. What is the probability that a randomly chosen student preferred Zaxby’s? P(Z) =
b. What is the probability that a randomly chosen student was a senior and preferred Zaxby’s?
P(S and Z) =
d. What is the probability that a randomly chosen student was a senior or preferred Zaxby’s?
P(S or Z) =
9. Jason rolled two dice. Answer the questions below:
a. What is the probability that the sum is odd or sum is 5?
b. P(sum is 4 sum is a multiple of 3)
8
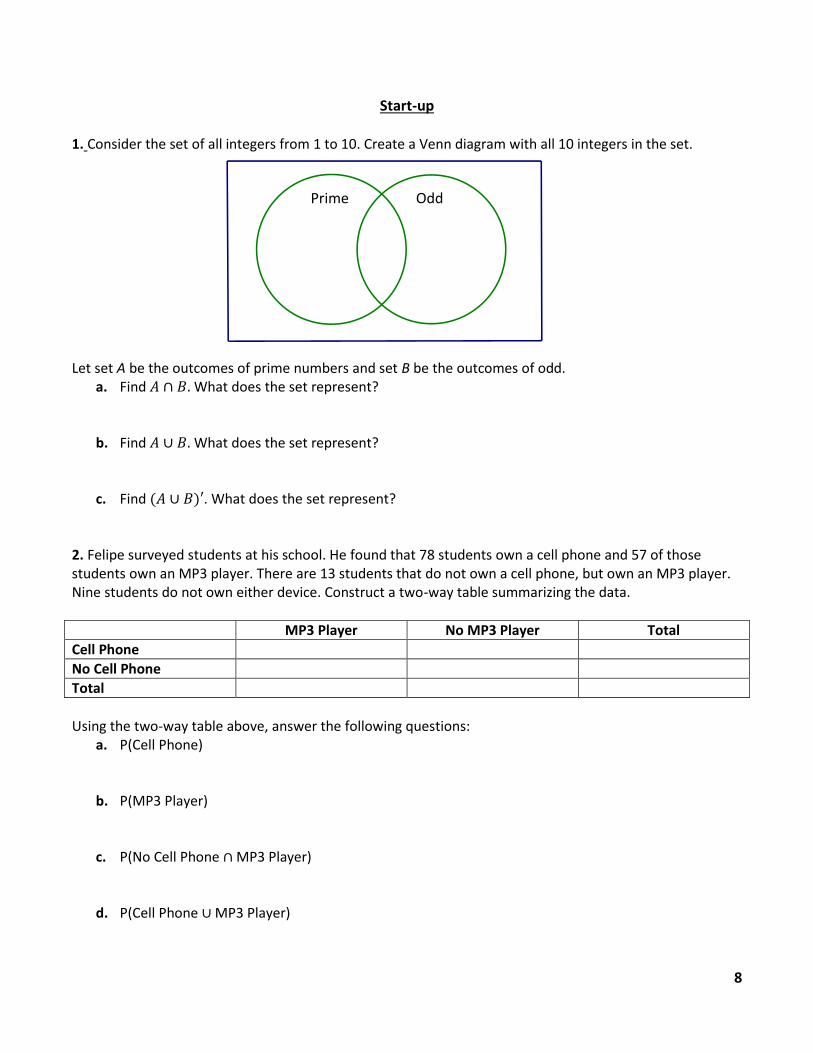
Start-up 1. Consider the set of all integers from 1 to 10. Create a Venn diagram with all 10 integers in the set. Let set A be the outcomes of prime numbers and set B be the outcomes of odd.
a. Find 𝐴 ∩ 𝐵. What does the set represent?
b. Find 𝐴 ∪ 𝐵. What does the set represent?
c. Find (𝐴 ∪ 𝐵)′. What does the set represent?
2. Felipe surveyed students at his school. He found that 78 students own a cell phone and 57 of those students own an MP3 player. There are 13 students that do not own a cell phone, but own an MP3 player. Nine students do not own either device. Construct a two-way table summarizing the data.
MP3 Player No MP3 Player Total
Cell Phone
No Cell Phone
Total
Using the two-way table above, answer the following questions:
a. P(Cell Phone)
b. P(MP3 Player)
c. P(No Cell Phone ∩ MP3 Player)
d. P(Cell Phone ∪ MP3 Player)
Prime Odd
9
Learning Task: Conditional Probability
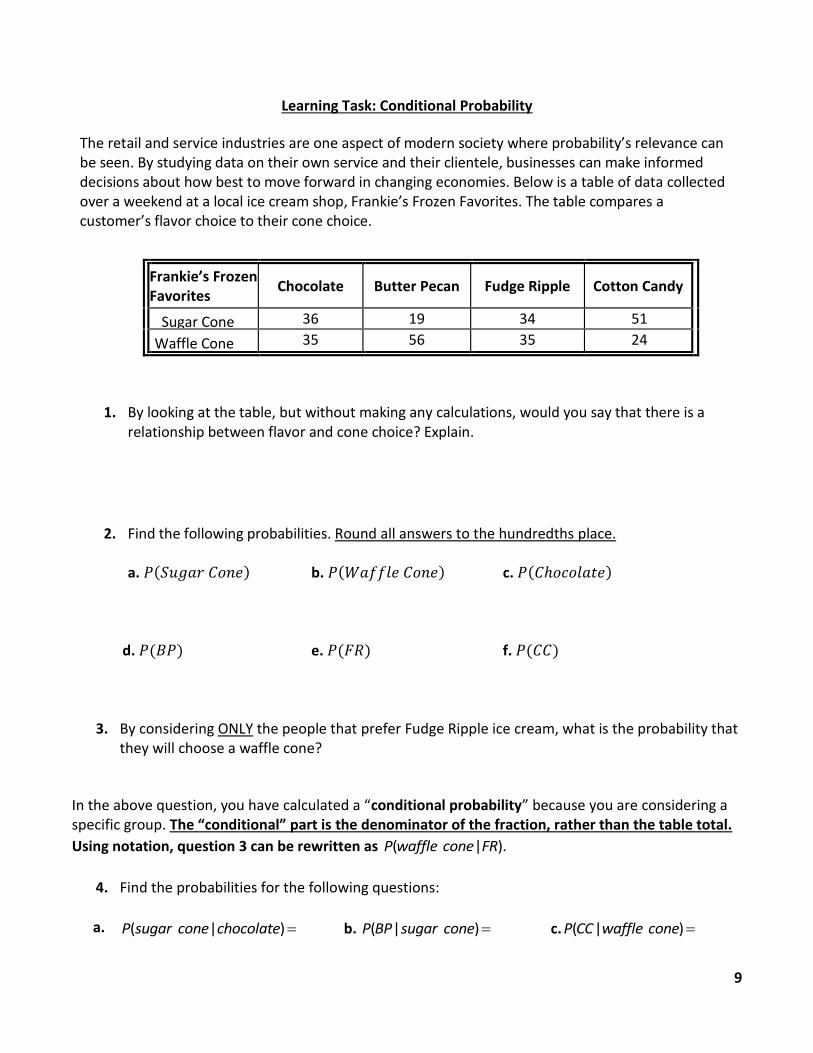
The retail and service industries are one aspect of modern society where probability’s relevance can be seen. By studying data on their own service and their clientele, businesses can make informed decisions about how best to move forward in changing economies. Below is a table of data collected over a weekend at a local ice cream shop, Frankie’s Frozen Favorites. The table compares a customer’s flavor choice to their cone choice.
Frankie’s Frozen Favorites
Chocolate Butter Pecan Fudge Ripple Cotton Candy
Sugar Cone 36 19 34 51
Waffle Cone 35 56 35 24
1. By looking at the table, but without making any calculations, would you say that there is a relationship between flavor and cone choice? Explain.
2. Find the following probabilities. Round all answers to the hundredths place.
a. 𝑃(𝑆𝑢𝑔𝑎𝑟 𝐶𝑜𝑛𝑒) b. 𝑃(𝑊𝑎𝑓𝑓𝑙𝑒 𝐶𝑜𝑛𝑒) c. 𝑃(𝐶ℎ𝑜𝑐𝑜𝑙𝑎𝑡𝑒)
d. 𝑃(𝐵𝑃) e. 𝑃(𝐹𝑅) f. 𝑃(𝐶𝐶)
3. By considering ONLY the people that prefer Fudge Ripple ice cream, what is the probability that they will choose a waffle cone?
In the above question, you have calculated a “conditional probability” because you are considering a specific group. The “conditional” part is the denominator of the fraction, rather than the table total.
Using notation, question 3 can be rewritten as P waffle cone FR( | ).
4. Find the probabilities for the following questions:
a. P sugar cone chocolate( | ) b. P BP sugar cone( | ) c. P CC waffle cone( | )
10
Guided Practice:
1. All of the upperclassmen (juniors and seniors) at a high school were classified according to grade level and response to the question "How do you usually get to school?" The resulting data are summarized in the two-way table below. Rewrite all questions using the proper notation. Round all answers to the hundredths place.
Car Bus Walk Totals
Juniors 122 56 274
Seniors 184 30 272
Totals 280 180 546
a. If an upperclassman at this school is selected at random, what is the probability that he or she
is a junior?
b. If an upperclassman at this school is selected at random, what is the probability that this student usually takes a bus to school?
c. If a randomly selected upperclassman says he or she is a junior, what is the probability that he or she usually walks to school?
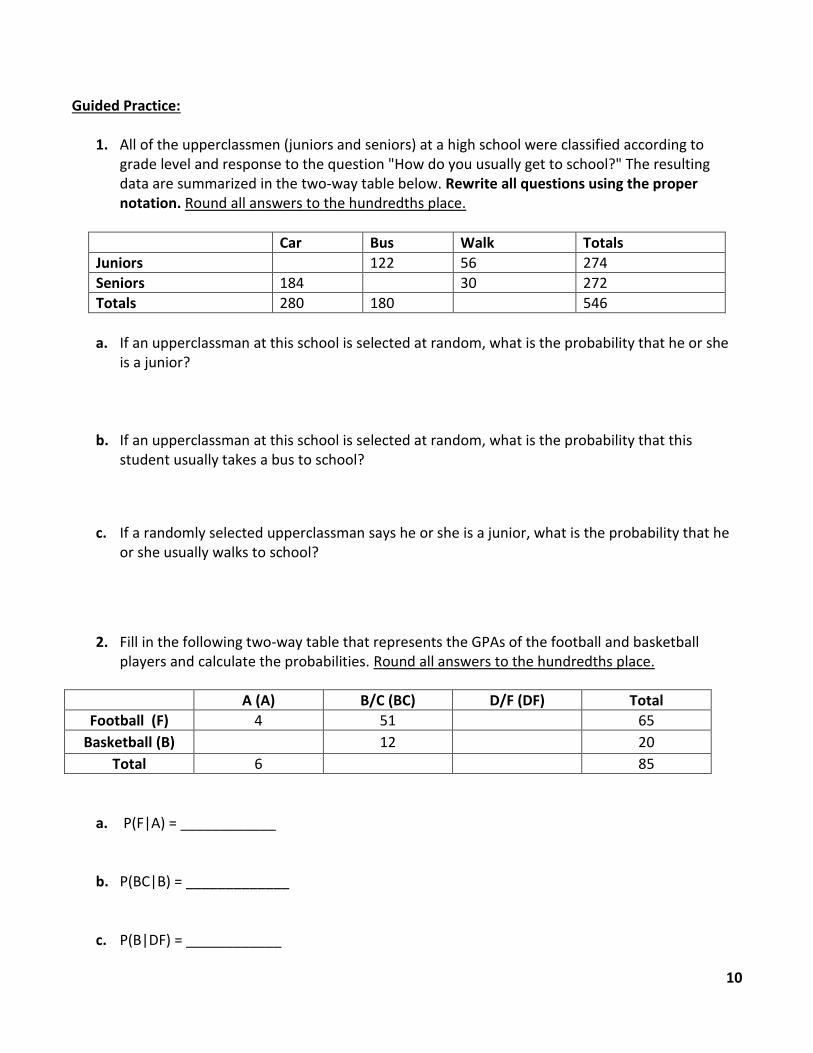
2. Fill in the following two-way table that represents the GPAs of the football and basketball
players and calculate the probabilities. Round all answers to the hundredths place.
a. P(F|A) = ____________
b. P(BC|B) = _____________
c. P(B|DF) = ____________
A (A) B/C (BC) D/F (DF) Total
Football (F) 4 51 65
Basketball (B) 12 20
Total 6 85
11
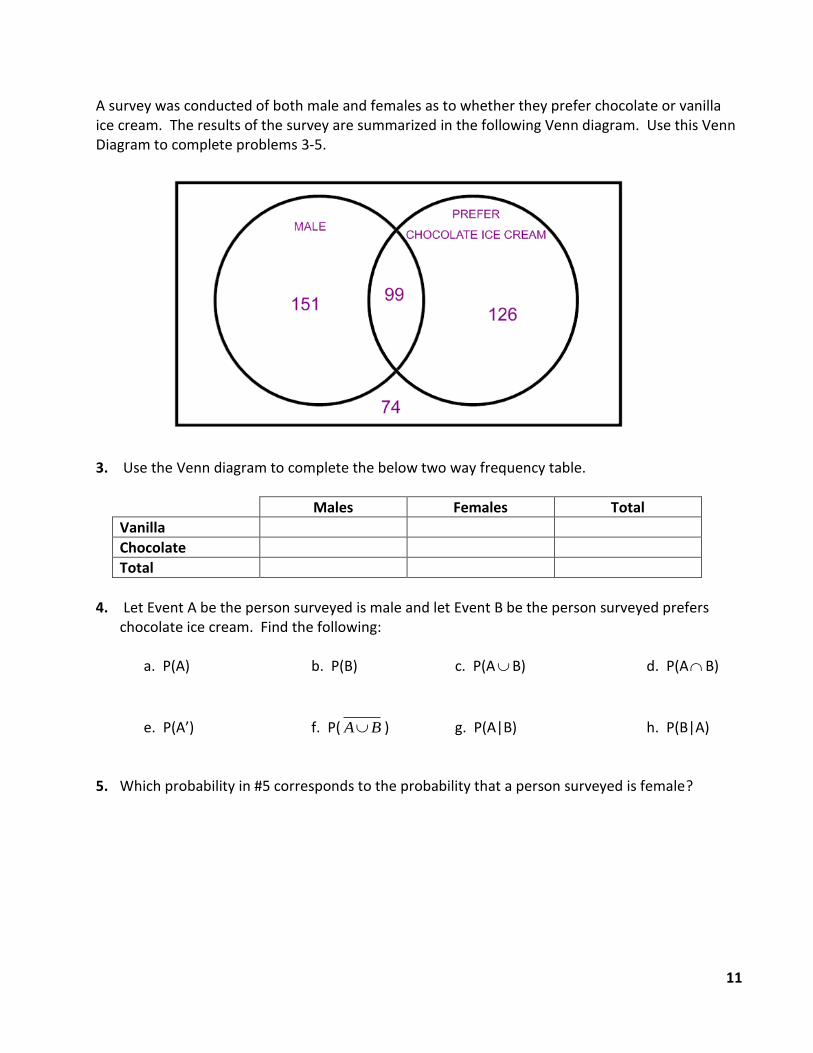
A survey was conducted of both male and females as to whether they prefer chocolate or vanilla ice cream. The results of the survey are summarized in the following Venn diagram. Use this Venn Diagram to complete problems 3-5.
3. Use the Venn diagram to complete the below two way frequency table.
Males Females Total
Vanilla
Chocolate
Total
4. Let Event A be the person surveyed is male and let Event B be the person surveyed prefers
chocolate ice cream. Find the following:
a. P(A) b. P(B) c. P(AB) d. P(AB)
e. P(A’) f. P( A B ) g. P(A|B) h. P(B|A)
5. Which probability in #5 corresponds to the probability that a person surveyed is female?
12
Skills Practice: Conditional Probability using Two-Way Frequency Tables
Directions: For all questions, round answers to the hundredths place.
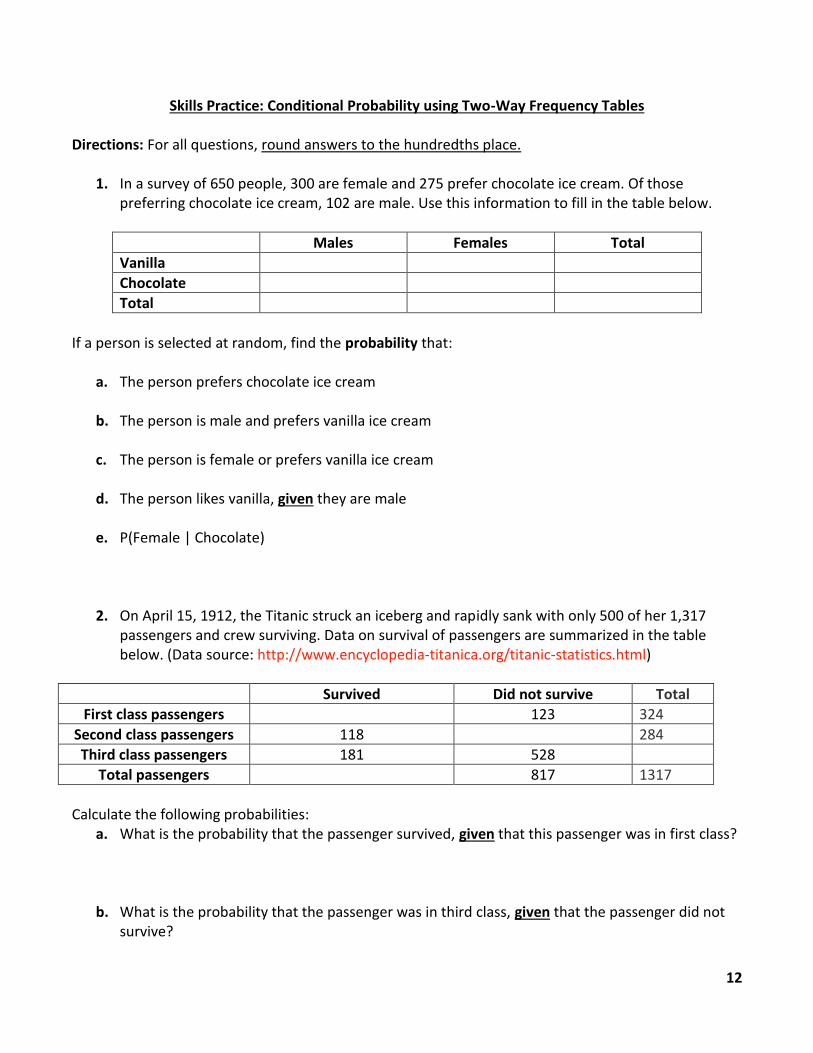
1. In a survey of 650 people, 300 are female and 275 prefer chocolate ice cream. Of those preferring chocolate ice cream, 102 are male. Use this information to fill in the table below.
Males Females Total
Vanilla
Chocolate
Total
If a person is selected at random, find the probability that:
a. The person prefers chocolate ice cream
b. The person is male and prefers vanilla ice cream
c. The person is female or prefers vanilla ice cream
d. The person likes vanilla, given they are male
e. P(Female | Chocolate)
2. On April 15, 1912, the Titanic struck an iceberg and rapidly sank with only 500 of her 1,317 passengers and crew surviving. Data on survival of passengers are summarized in the table below. (Data source: http://www.encyclopedia-titanica.org/titanic-statistics.html)
Survived Did not survive Total
First class passengers 123 324
Second class passengers 118 284
Third class passengers 181 528
Total passengers 817 1317
Calculate the following probabilities:
a. What is the probability that the passenger survived, given that this passenger was in first class?
b. What is the probability that the passenger was in third class, given that the passenger did not survive?
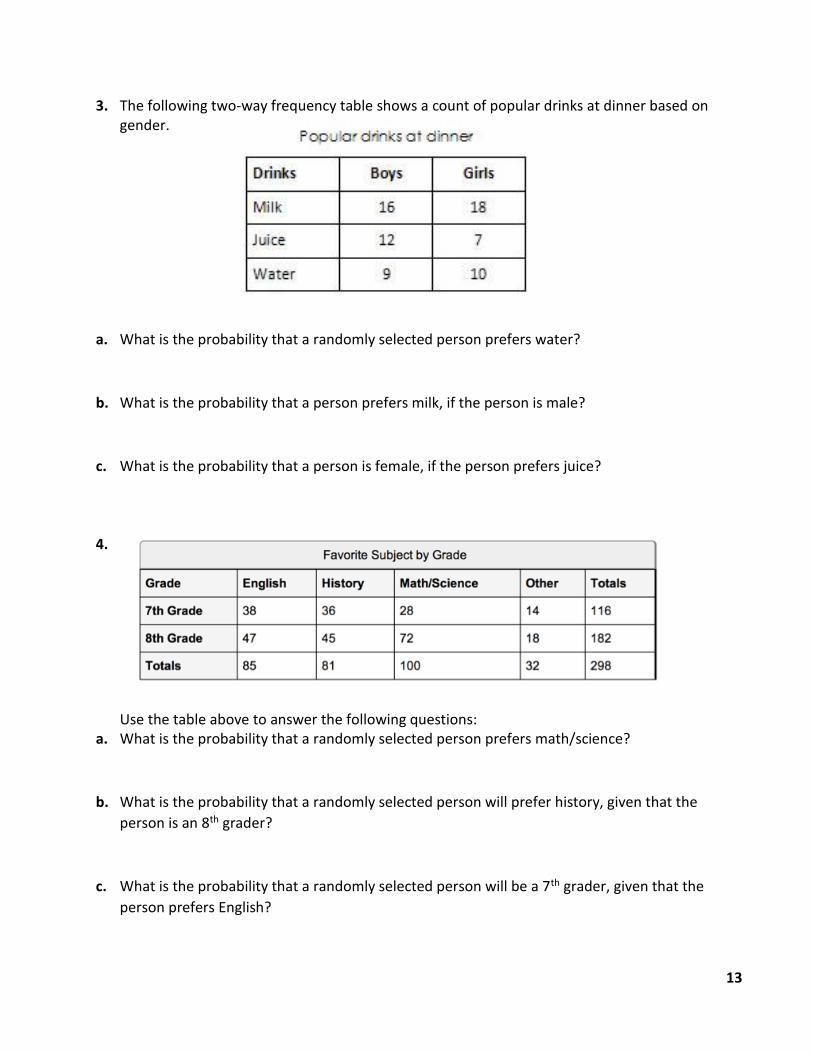
3. The following two-way frequency table shows a count of popular drinks at dinner based on gender.
a. What is the probability that a randomly selected person prefers water?
b. What is the probability that a person prefers milk, if the person is male?
c. What is the probability that a person is female, if the person prefers juice?
4.
Use the table above to answer the following questions:
a. What is the probability that a randomly selected person prefers math/science?
b. What is the probability that a randomly selected person will prefer history, given that the
person is an 8th grader?
c. What is the probability that a randomly selected person will be a 7th grader, given that the
person prefers English?
14
Start-up
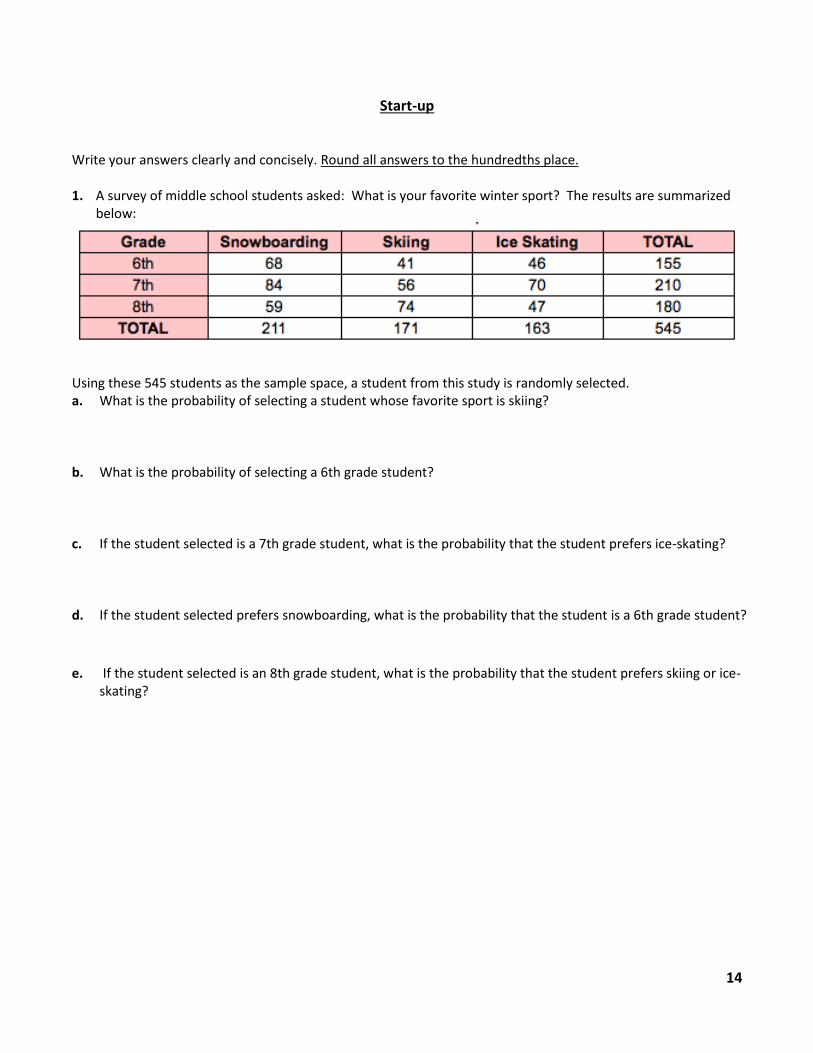
Write your answers clearly and concisely. Round all answers to the hundredths place. 1. A survey of middle school students asked: What is your favorite winter sport? The results are summarized
below:
Using these 545 students as the sample space, a student from this study is randomly selected. a. What is the probability of selecting a student whose favorite sport is skiing?
b. What is the probability of selecting a 6th grade student?
c. If the student selected is a 7th grade student, what is the probability that the student prefers ice-skating?
d. If the student selected prefers snowboarding, what is the probability that the student is a 6th grade student?
e. If the student selected is an 8th grade student, what is the probability that the student prefers skiing or ice-skating?
15
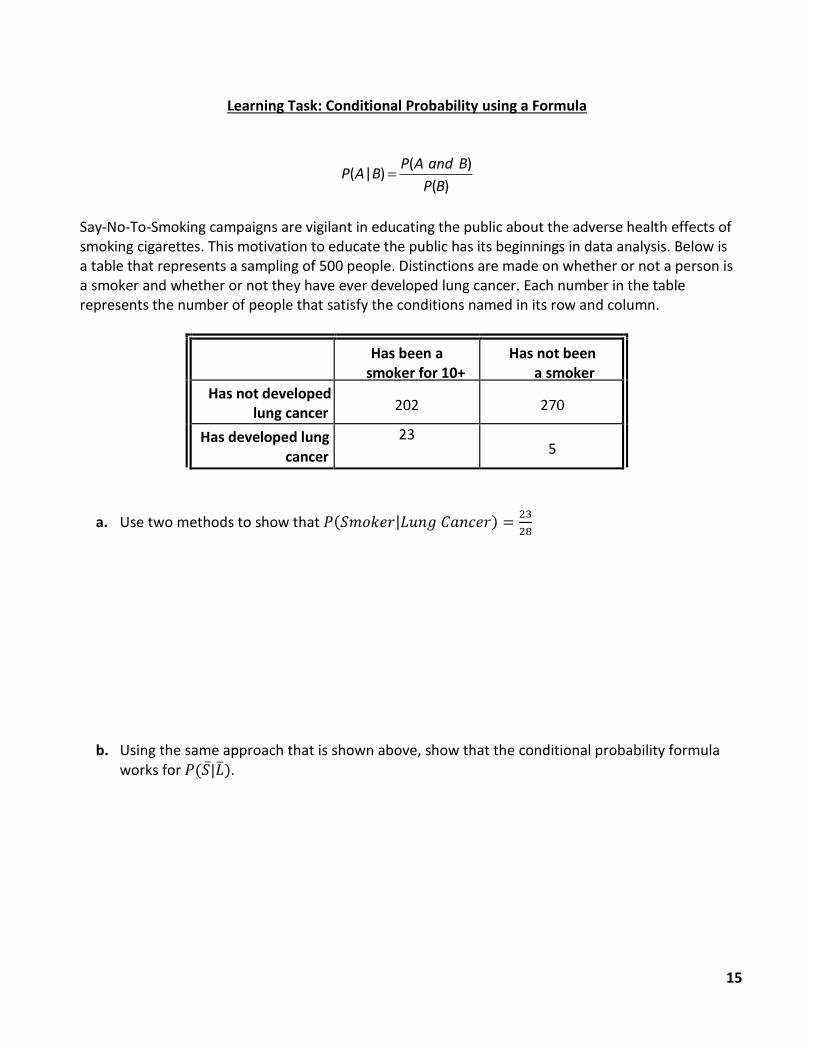
Learning Task: Conditional Probability using a Formula
P A and BP A B
P B
( )( | )
( )
Say-No-To-Smoking campaigns are vigilant in educating the public about the adverse health effects of smoking cigarettes. This motivation to educate the public has its beginnings in data analysis. Below is a table that represents a sampling of 500 people. Distinctions are made on whether or not a person is a smoker and whether or not they have ever developed lung cancer. Each number in the table represents the number of people that satisfy the conditions named in its row and column.
Has been a smoker for 10+
years
Has not been a smoker
Has not developed lung cancer
202
270
Has developed lung cancer
23
5
a. Use two methods to show that 𝑃(𝑆𝑚𝑜𝑘𝑒𝑟|𝐿𝑢𝑛𝑔 𝐶𝑎𝑛𝑐𝑒𝑟) =23
28
b. Using the same approach that is shown above, show that the conditional probability formula
works for 𝑃(𝑆̅|�̅�).
16
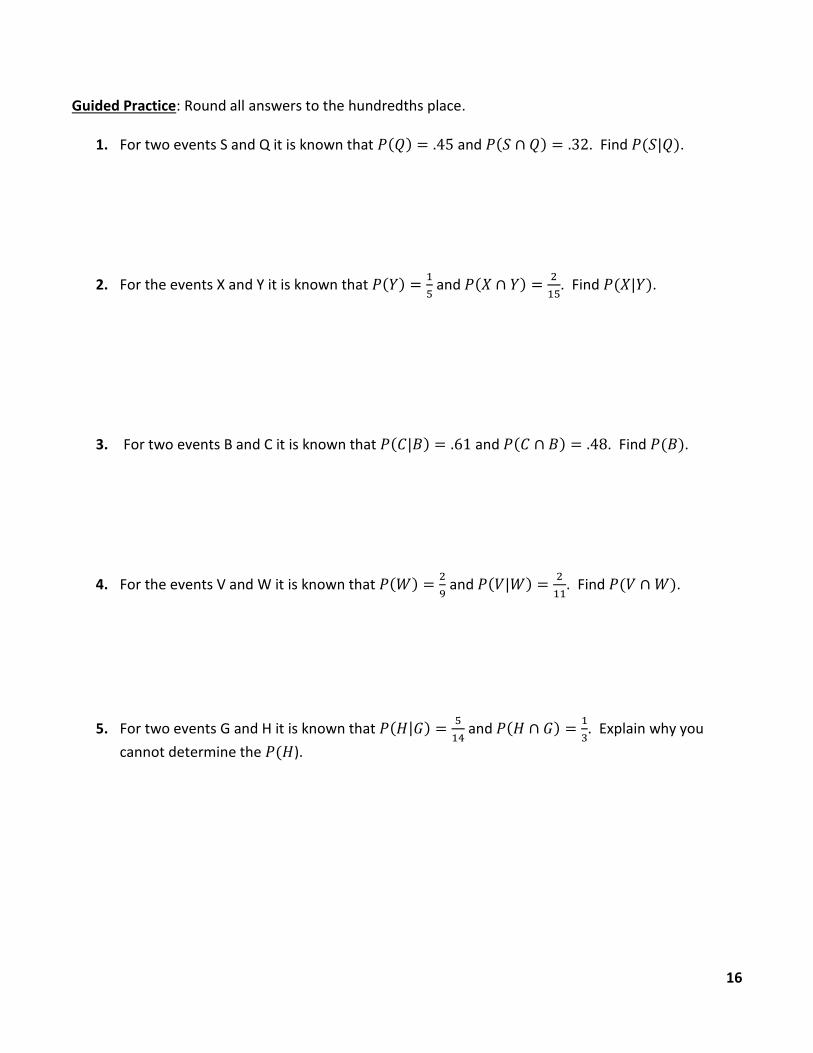
Guided Practice: Round all answers to the hundredths place.
1. For two events S and Q it is known that 𝑃(𝑄) = .45 and 𝑃(𝑆 ∩ 𝑄) = .32. Find 𝑃(𝑆|𝑄).
2. For the events X and Y it is known that 𝑃(𝑌) =1
5 and 𝑃(𝑋 ∩ 𝑌) =
2
15. Find 𝑃(𝑋|𝑌).
3. For two events B and C it is known that 𝑃(𝐶|𝐵) = .61 and 𝑃(𝐶 ∩ 𝐵) = .48. Find 𝑃(𝐵).
4. For the events V and W it is known that 𝑃(𝑊) =2
9 and 𝑃(𝑉|𝑊) =
2
11. Find 𝑃(𝑉 ∩ 𝑊).
5. For two events G and H it is known that 𝑃(𝐻|𝐺) =5
14 and 𝑃(𝐻 ∩ 𝐺) =
1
3. Explain why you
cannot determine the 𝑃(𝐻).
17
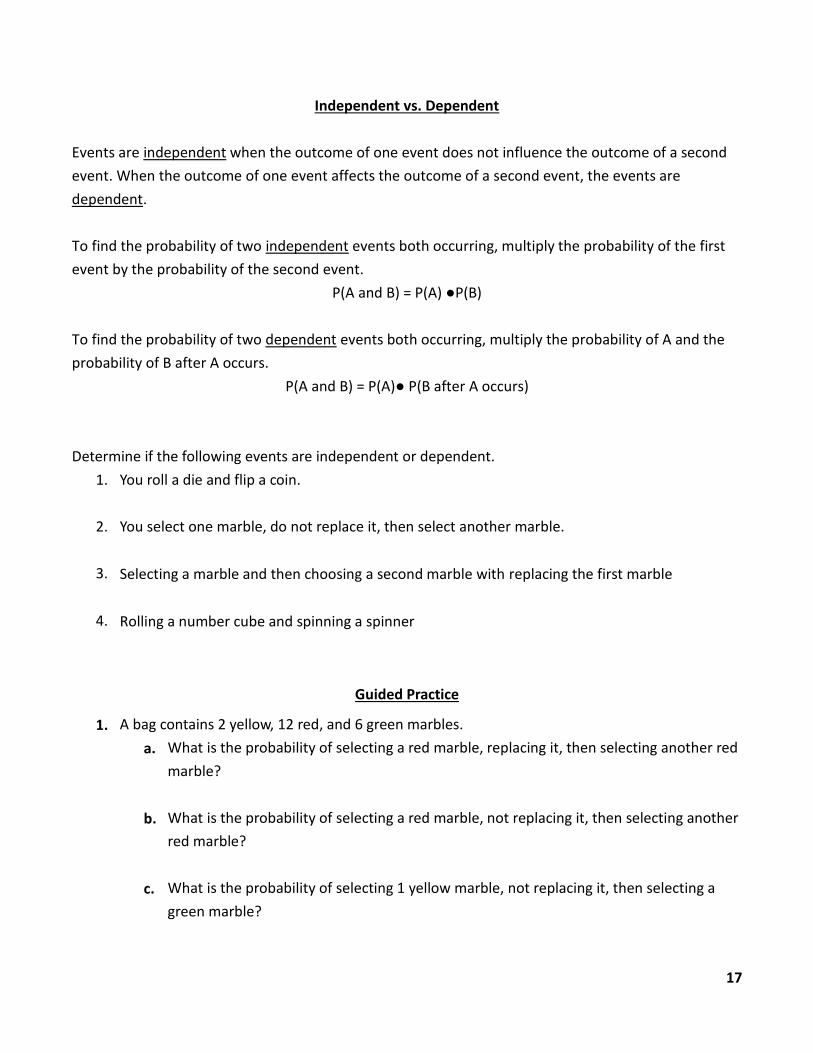
Independent vs. Dependent
Events are independent when the outcome of one event does not influence the outcome of a second
event. When the outcome of one event affects the outcome of a second event, the events are
dependent.
To find the probability of two independent events both occurring, multiply the probability of the first
event by the probability of the second event.
P(A and B) = P(A) ●P(B)
To find the probability of two dependent events both occurring, multiply the probability of A and the
probability of B after A occurs.
P(A and B) = P(A)● P(B after A occurs)
Determine if the following events are independent or dependent.
1. You roll a die and flip a coin.
2. You select one marble, do not replace it, then select another marble.
3. Selecting a marble and then choosing a second marble with replacing the first marble
4. Rolling a number cube and spinning a spinner
Guided Practice
1. A bag contains 2 yellow, 12 red, and 6 green marbles.
a. What is the probability of selecting a red marble, replacing it, then selecting another red
marble?
b. What is the probability of selecting a red marble, not replacing it, then selecting another
red marble?
c. What is the probability of selecting 1 yellow marble, not replacing it, then selecting a
green marble?
18
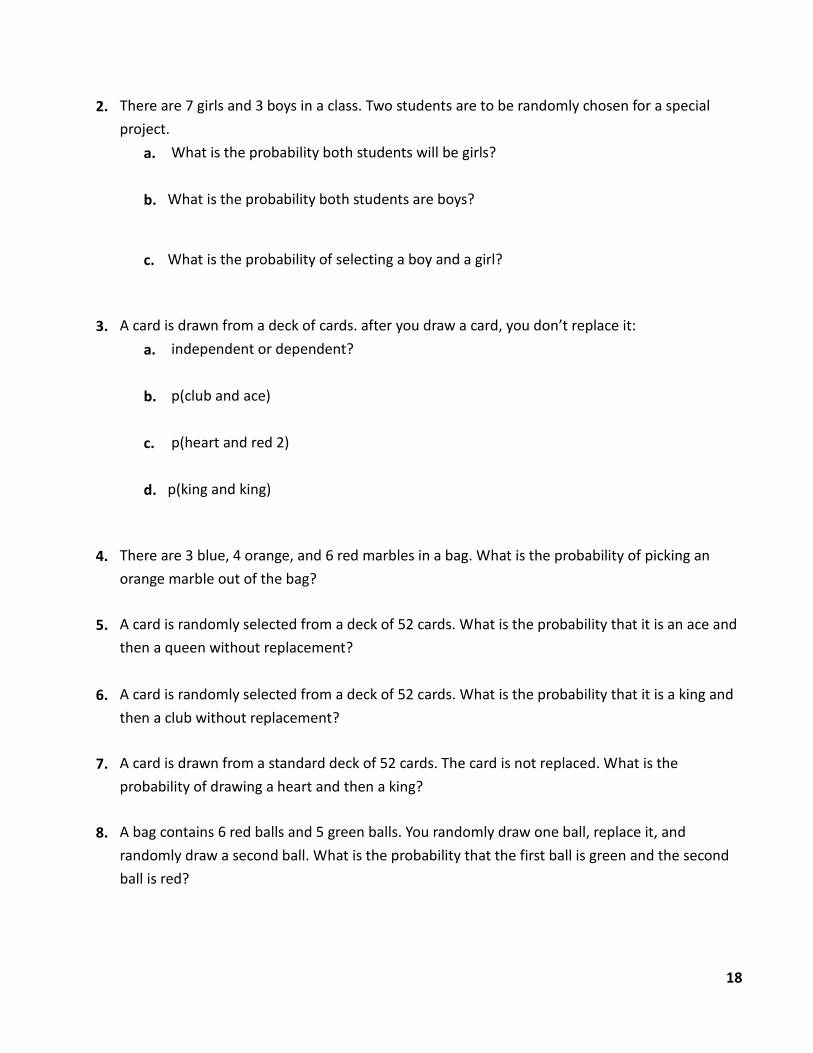
2. There are 7 girls and 3 boys in a class. Two students are to be randomly chosen for a special
project.
a. What is the probability both students will be girls?
b. What is the probability both students are boys?
c. What is the probability of selecting a boy and a girl?
3. A card is drawn from a deck of cards. after you draw a card, you don’t replace it:
a. independent or dependent?
b. p(club and ace)
c. p(heart and red 2)
d. p(king and king)
4. There are 3 blue, 4 orange, and 6 red marbles in a bag. What is the probability of picking an
orange marble out of the bag?
5. A card is randomly selected from a deck of 52 cards. What is the probability that it is an ace and
then a queen without replacement?
6. A card is randomly selected from a deck of 52 cards. What is the probability that it is a king and
then a club without replacement?
7. A card is drawn from a standard deck of 52 cards. The card is not replaced. What is the
probability of drawing a heart and then a king?
8. A bag contains 6 red balls and 5 green balls. You randomly draw one ball, replace it, and
randomly draw a second ball. What is the probability that the first ball is green and the second
ball is red?
19
9. An aquarium contains 6 male goldfish and 4 female goldfish. You randomly select a fish from the
tank, do not replace it, and then randomly select a second fish. What is the probability that
both fish are male?
10. A basket of apples contains 6 red apples, 2 green apples, and 3 yellow apples. You randomly
select 2 apples, one at a time. Find the probability that both are yellow if
a. you replace the first apple, then select the second
b. you eat the first apple (yellow), then select a red
11. There are 12 blue, 7 red, and 10 green markers in a box.
a. What is the probability of randomly selecting a red marker, replacing it, and then
selecting a green marker out of the box?
b. What is the probability of randomly selecting a blue marker, not replacing it, and then
selecting another blue marker?
Skills Practice:
1. What is the probability of drawing a 6 from a deck of 52 cards, replacing it, then drawing King?
2. Draw 4 cards from a standard deck of 52 playing cards. Do not replace the cards. What is the
probability of drawing a 5, then drawing a King, then drawing a 10, then drawing a black 8?
3. A jar of marbles contain 4 red marbles, 3 green marbles, 4 blue marbles, and 1 pink marble.
What is the probability of drawing a blue marble, then a red marble, then a pink marble
replacing the marbles?
4. Draw 4 cards from a standard 52 card deck. Replace the card after each draw. What is the
probability of drawing a black number card, then a red ace, then a king, then a red jack?
20
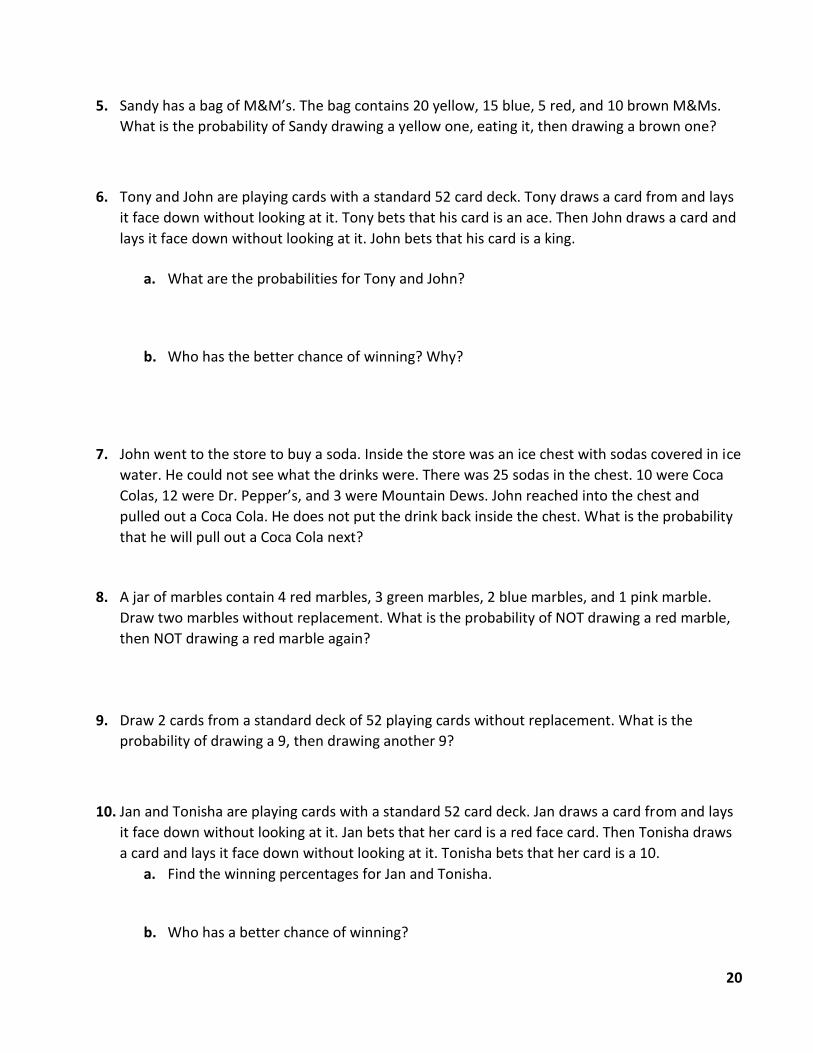
5. Sandy has a bag of M&M’s. The bag contains 20 yellow, 15 blue, 5 red, and 10 brown M&Ms.
What is the probability of Sandy drawing a yellow one, eating it, then drawing a brown one?
6. Tony and John are playing cards with a standard 52 card deck. Tony draws a card from and lays
it face down without looking at it. Tony bets that his card is an ace. Then John draws a card and
lays it face down without looking at it. John bets that his card is a king.
a. What are the probabilities for Tony and John?
b. Who has the better chance of winning? Why?
7. John went to the store to buy a soda. Inside the store was an ice chest with sodas covered in ice
water. He could not see what the drinks were. There was 25 sodas in the chest. 10 were Coca
Colas, 12 were Dr. Pepper’s, and 3 were Mountain Dews. John reached into the chest and
pulled out a Coca Cola. He does not put the drink back inside the chest. What is the probability
that he will pull out a Coca Cola next?
8. A jar of marbles contain 4 red marbles, 3 green marbles, 2 blue marbles, and 1 pink marble.
Draw two marbles without replacement. What is the probability of NOT drawing a red marble,
then NOT drawing a red marble again?
9. Draw 2 cards from a standard deck of 52 playing cards without replacement. What is the
probability of drawing a 9, then drawing another 9?
10. Jan and Tonisha are playing cards with a standard 52 card deck. Jan draws a card from and lays
it face down without looking at it. Jan bets that her card is a red face card. Then Tonisha draws
a card and lays it face down without looking at it. Tonisha bets that her card is a 10.
a. Find the winning percentages for Jan and Tonisha. b. Who has a better chance of winning?
21
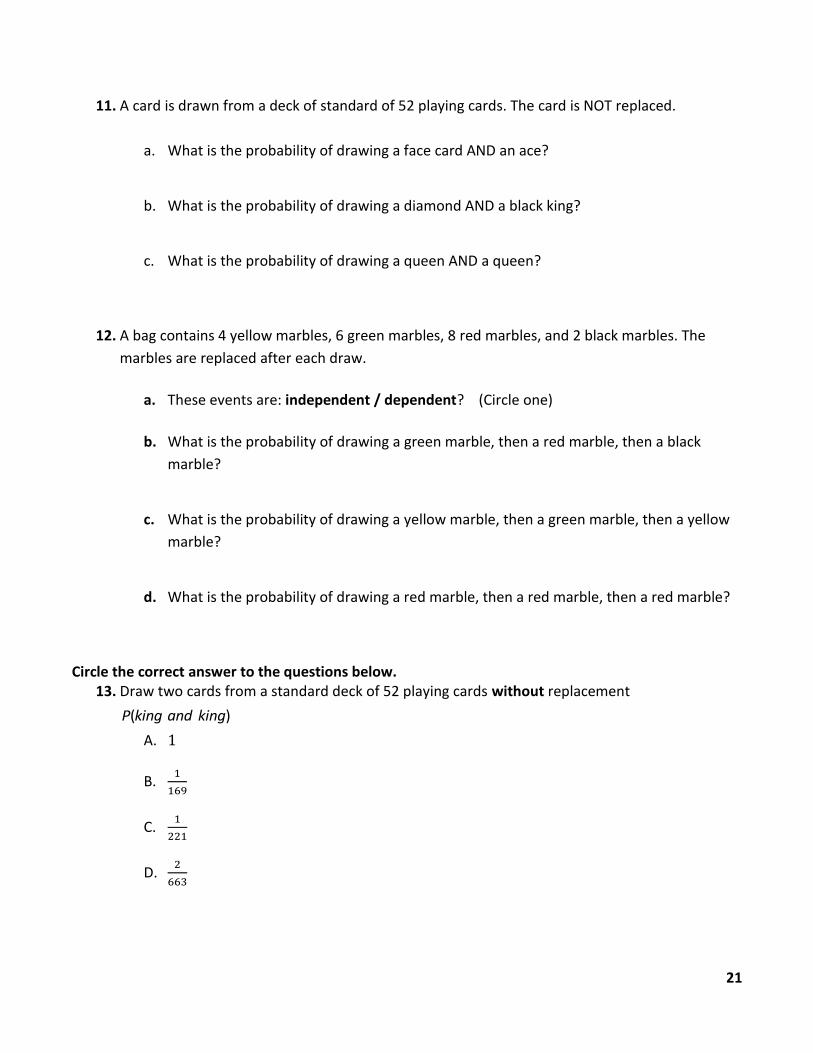
11. A card is drawn from a deck of standard of 52 playing cards. The card is NOT replaced.
a. What is the probability of drawing a face card AND an ace?
b. What is the probability of drawing a diamond AND a black king?
c. What is the probability of drawing a queen AND a queen?
12. A bag contains 4 yellow marbles, 6 green marbles, 8 red marbles, and 2 black marbles. The
marbles are replaced after each draw.
a. These events are: independent / dependent? (Circle one)
b. What is the probability of drawing a green marble, then a red marble, then a black
marble?
c. What is the probability of drawing a yellow marble, then a green marble, then a yellow
marble?
d. What is the probability of drawing a red marble, then a red marble, then a red marble?
Circle the correct answer to the questions below.
13. Draw two cards from a standard deck of 52 playing cards without replacement
P king and king( )
A. 1
B. 1
169
C. 1
221
D. 2
663
22
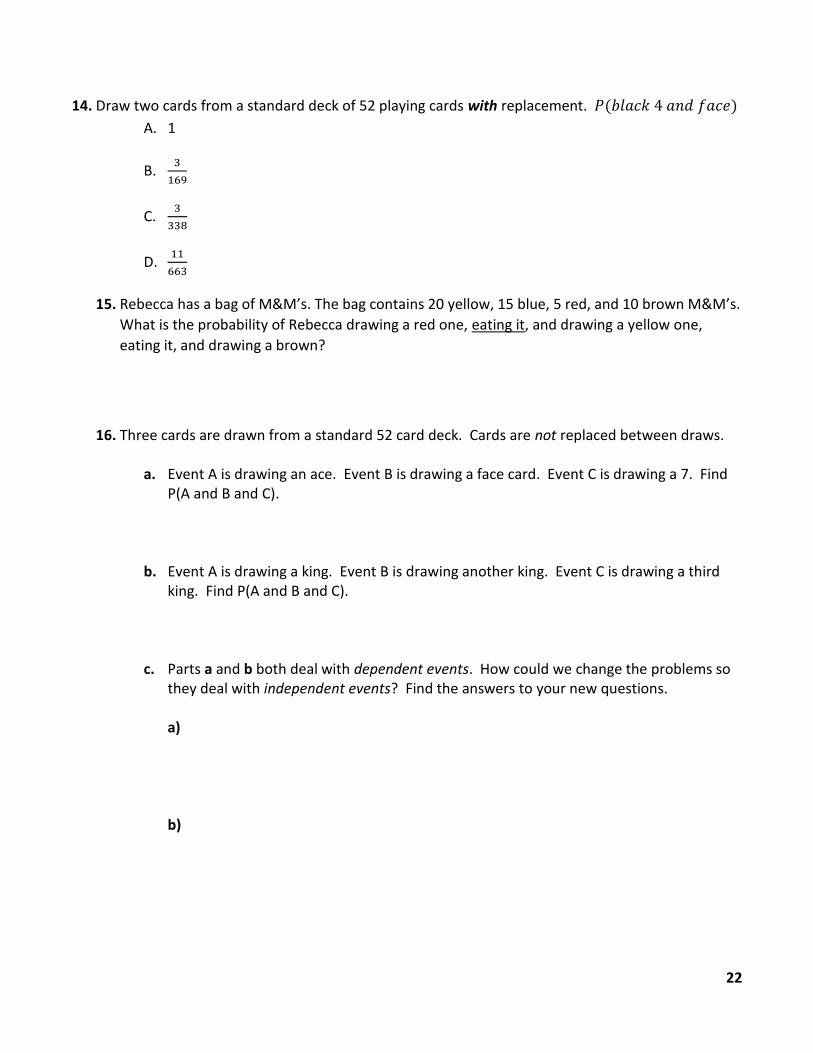
14. Draw two cards from a standard deck of 52 playing cards with replacement. 𝑃(𝑏𝑙𝑎𝑐𝑘 4 𝑎𝑛𝑑 𝑓𝑎𝑐𝑒)
A. 1
B. 3
169
C. 3
338
D. 11
663
15. Rebecca has a bag of M&M’s. The bag contains 20 yellow, 15 blue, 5 red, and 10 brown M&M’s.
What is the probability of Rebecca drawing a red one, eating it, and drawing a yellow one,
eating it, and drawing a brown?
16. Three cards are drawn from a standard 52 card deck. Cards are not replaced between draws.
a. Event A is drawing an ace. Event B is drawing a face card. Event C is drawing a 7. Find P(A and B and C).
b. Event A is drawing a king. Event B is drawing another king. Event C is drawing a third king. Find P(A and B and C).
c. Parts a and b both deal with dependent events. How could we change the problems so they deal with independent events? Find the answers to your new questions.
a) b)
23
Start Up
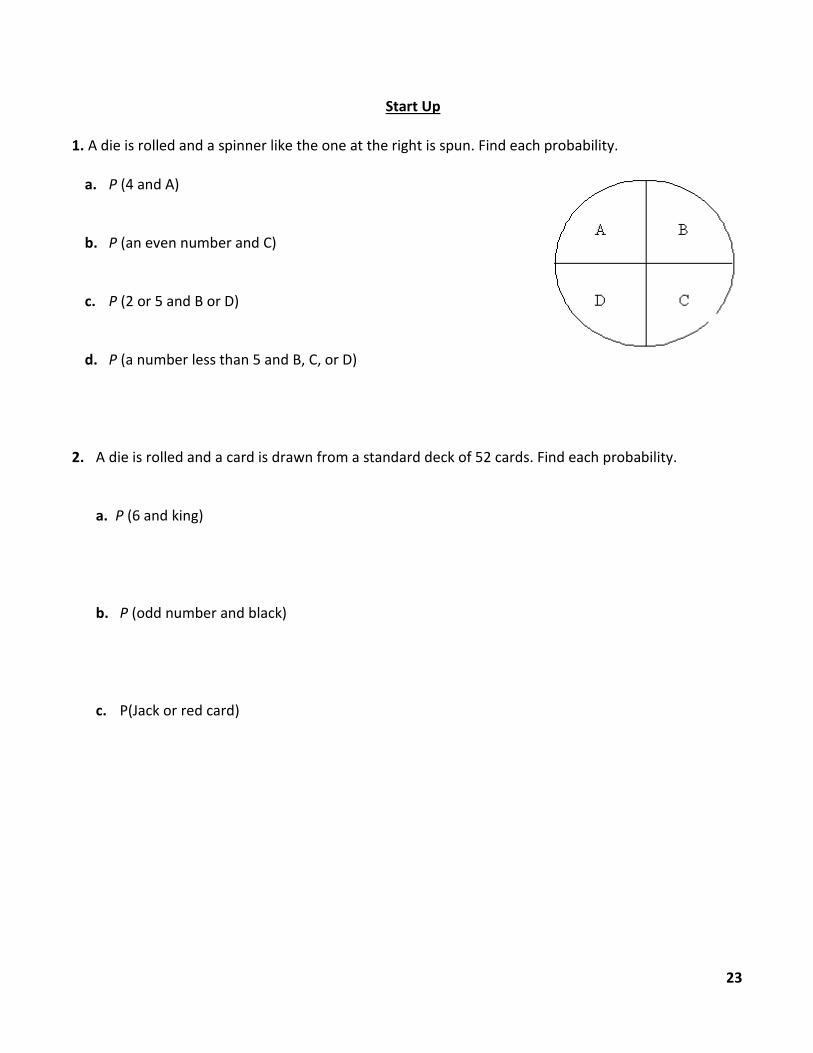
1. A die is rolled and a spinner like the one at the right is spun. Find each probability.
a. P (4 and A)
b. P (an even number and C)
c. P (2 or 5 and B or D)
d. P (a number less than 5 and B, C, or D) 2. A die is rolled and a card is drawn from a standard deck of 52 cards. Find each probability.
a. P (6 and king)
b. P (odd number and black)
c. P(Jack or red card)
24
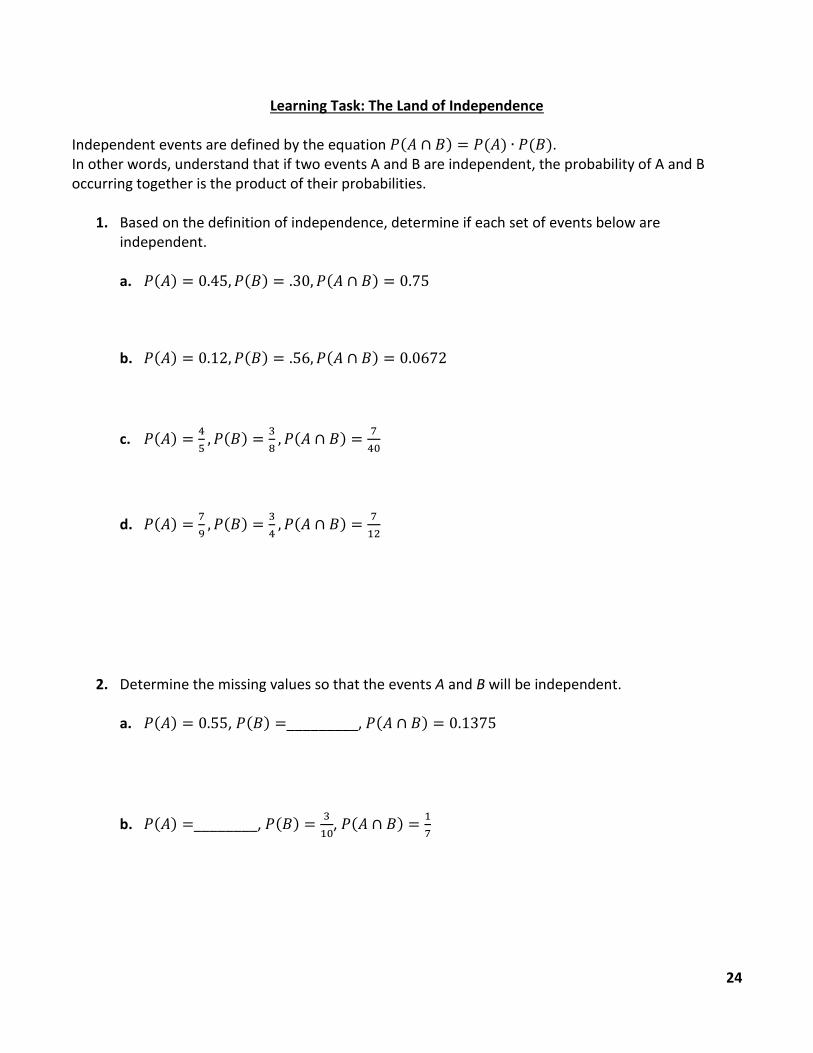
Learning Task: The Land of Independence
Independent events are defined by the equation 𝑃(𝐴 ∩ 𝐵) = 𝑃(𝐴) ∙ 𝑃(𝐵). In other words, understand that if two events A and B are independent, the probability of A and B occurring together is the product of their probabilities.
1. Based on the definition of independence, determine if each set of events below are independent. a. 𝑃(𝐴) = 0.45, 𝑃(𝐵) = .30, 𝑃(𝐴 ∩ 𝐵) = 0.75
b. 𝑃(𝐴) = 0.12, 𝑃(𝐵) = .56, 𝑃(𝐴 ∩ 𝐵) = 0.0672
c. 𝑃(𝐴) =4
5, 𝑃(𝐵) =
3
8, 𝑃(𝐴 ∩ 𝐵) =
7
40
d. 𝑃(𝐴) =7
9, 𝑃(𝐵) =
3
4, 𝑃(𝐴 ∩ 𝐵) =
7
12
2. Determine the missing values so that the events A and B will be independent. a. 𝑃(𝐴) = 0.55, 𝑃(𝐵) =_________, 𝑃(𝐴 ∩ 𝐵) = 0.1375
b. 𝑃(𝐴) =________, 𝑃(𝐵) =3
10, 𝑃(𝐴 ∩ 𝐵) =
1
7
25
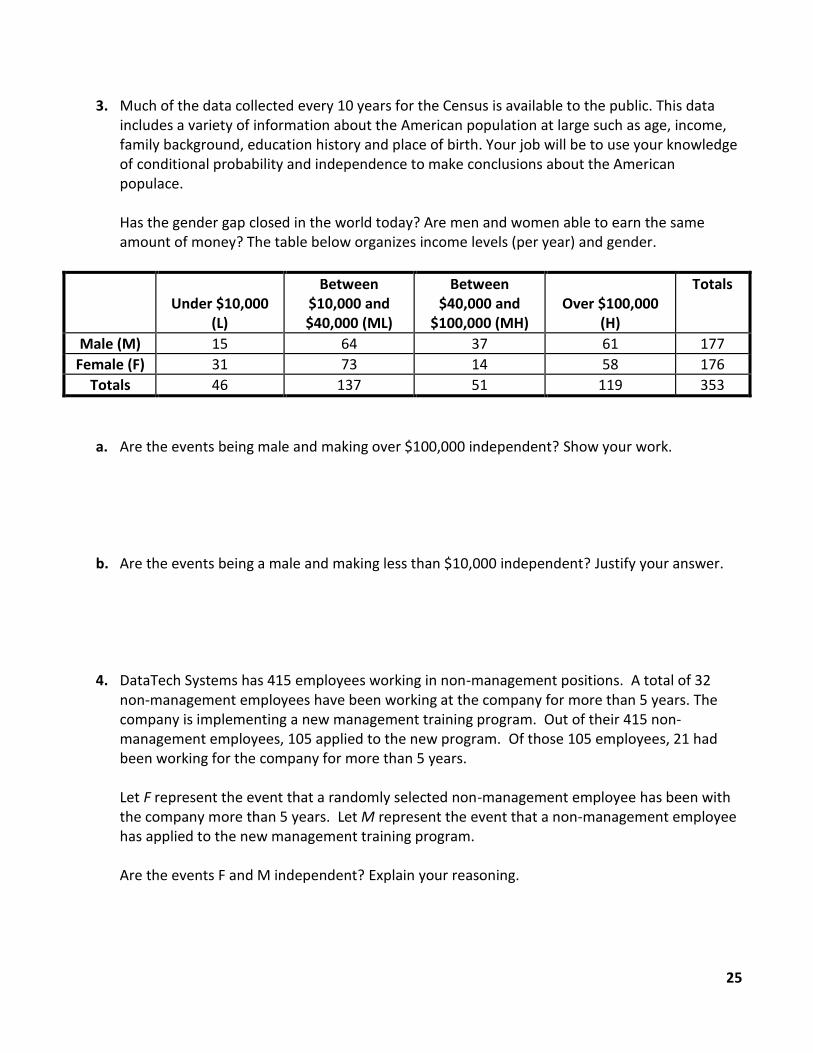
3. Much of the data collected every 10 years for the Census is available to the public. This data includes a variety of information about the American population at large such as age, income, family background, education history and place of birth. Your job will be to use your knowledge of conditional probability and independence to make conclusions about the American populace.
Has the gender gap closed in the world today? Are men and women able to earn the same amount of money? The table below organizes income levels (per year) and gender.
Under $10,000
(L)
Between $10,000 and $40,000 (ML)
Between $40,000 and
$100,000 (MH)
Over $100,000
(H)
Totals
Male (M) 15 64 37 61 177
Female (F) 31 73 14 58 176
Totals 46 137 51 119 353
a. Are the events being male and making over $100,000 independent? Show your work.
b. Are the events being a male and making less than $10,000 independent? Justify your answer.
4. DataTech Systems has 415 employees working in non-management positions. A total of 32
non-management employees have been working at the company for more than 5 years. The company is implementing a new management training program. Out of their 415 non-management employees, 105 applied to the new program. Of those 105 employees, 21 had been working for the company for more than 5 years.
Let F represent the event that a randomly selected non-management employee has been with the company more than 5 years. Let M represent the event that a non-management employee has applied to the new management training program. Are the events F and M independent? Explain your reasoning.
26
Skills Practice: Independent Events
1. Based on the definition of independence, determine if each set of events below are independent.
a. 𝑃(𝐴) = 0.55, 𝑃(𝐵) = .12, 𝑃(𝐴 ∩ 𝐵) = 0.78
b. 𝑃(𝐴) =2
3, 𝑃(𝐵) =
4
7, 𝑃(𝐴 ∩ 𝐵) =
8
21
2. The following events are independent. Find the missing values.
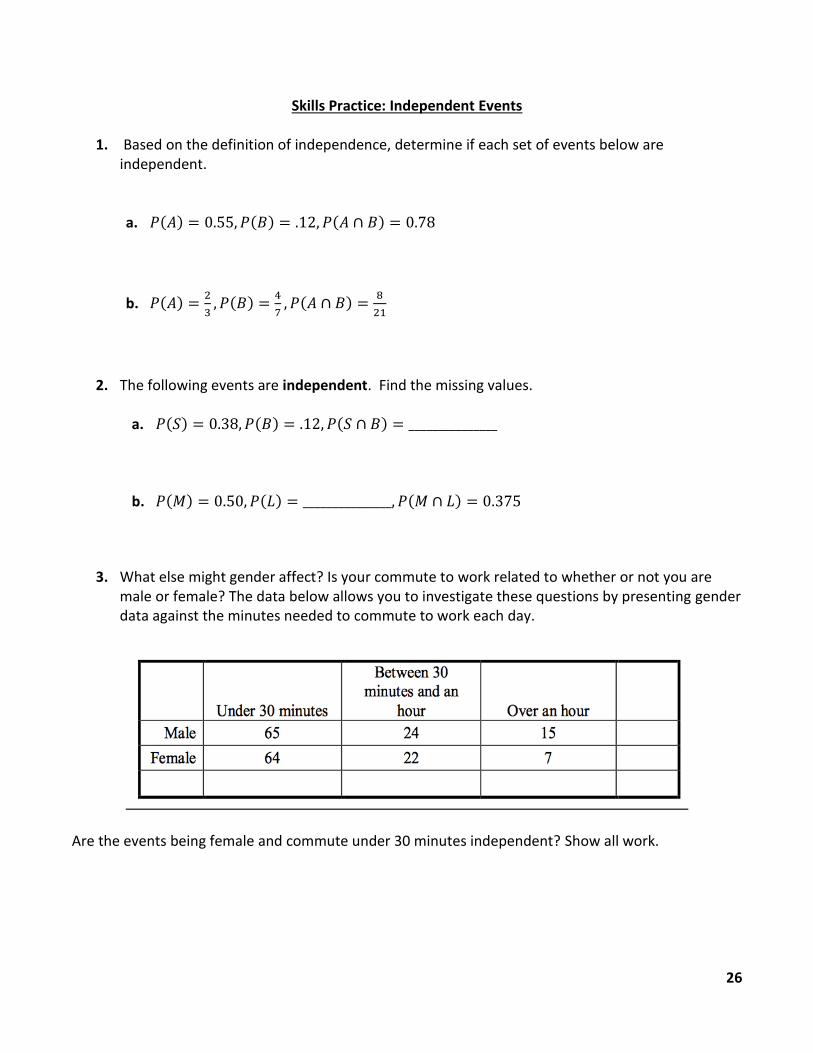
3. What else might gender affect? Is your commute to work related to whether or not you are male or female? The data below allows you to investigate these questions by presenting gender data against the minutes needed to commute to work each day.
Are the events being female and commute under 30 minutes independent? Show all work.
27
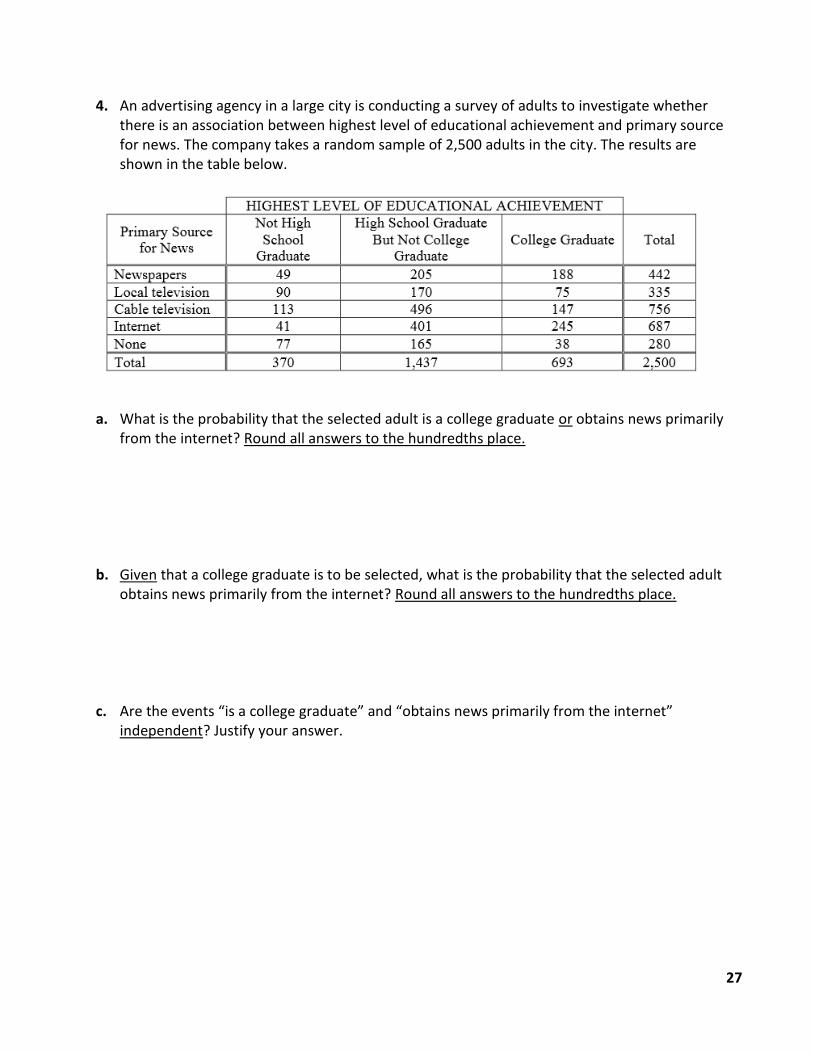
4. An advertising agency in a large city is conducting a survey of adults to investigate whether there is an association between highest level of educational achievement and primary source for news. The company takes a random sample of 2,500 adults in the city. The results are shown in the table below.
a. What is the probability that the selected adult is a college graduate or obtains news primarily from the internet? Round all answers to the hundredths place.
b. Given that a college graduate is to be selected, what is the probability that the selected adult obtains news primarily from the internet? Round all answers to the hundredths place.
c. Are the events “is a college graduate” and “obtains news primarily from the internet” independent? Justify your answer.