Minnesota Alliance for Geographic Education ▪ Macalester College ▪ 1600 Grand Avenue, St. Paul, Minnesota 55105 Phone: 651.696.6731 Fax: 651.696.6116 Email: [email protected]Website: http://lt.umn.edu/mage/ Unit 1 Test (Version B) 1. The city of Lewisville has a population of 1,000 people living in 100 square miles. What is the population density of Lewisville? a. 10 people per square mile b. 50 people per square mile c. 100 people per square mile d. 500 people per square mile e. 1000 people per square mile 2. Which of the following maps has the greatest distortion? a. city map b. county map c. state map d. continent map e. world map 3. What occurs when the earth’s surface is represented on a two-dimensional map? a. distortion b. distribution c. density d. dispersion e. duplication 4. Which of the following BEST corresponds to the concept of site? a. physical characteristics/features b. accessibility c. political system d. direction e. diffusion 5. What is another name for any line of latitude? a. meridian b. Equator c. International Date Line d. parallel e. Prime Meridian 6. What is the name for the line of 0˚ longitude? a. Prime Meridian b. North Pole c. Equator d. International Date Line e. South Pole
Transcript
Minnesota Alliance for Geographic Education ▪ Macalester College ▪ 1600 Grand Avenue, St. Paul, Minnesota 55105 Phone: 651.696.6731 Fax: 651.696.6116 Email: [email protected] Website: http://lt.umn.edu/mage/
Unit 1 Test (Version B)
1. The city of Lewisville has a population of 1,000 people living in 100 square miles. What is the population density of Lewisville?
a. 10 people per square mile b. 50 people per square mile c. 100 people per square mile d. 500 people per square mile e. 1000 people per square mile
2. Which of the following maps has the greatest distortion?
a. city map b. county map c. state map d. continent map e. world map
3. What occurs when the earth’s surface is represented on a two-dimensional map?
a. distortion b. distribution c. density d. dispersion e. duplication
4. Which of the following BEST corresponds to the concept of site?
a. physical characteristics/features b. accessibility c. political system d. direction e. diffusion
5. What is another name for any line of latitude?
a. meridian b. Equator c. International Date Line d. parallel e. Prime Meridian
6. What is the name for the line of 0˚ longitude?
a. Prime Meridian b. North Pole c. Equator d. International Date Line e. South Pole
Minnesota Alliance for Geographic Education ▪ Macalester College ▪ 1600 Grand Avenue, St. Paul, Minnesota 55105 Phone: 651.696.6731 Fax: 651.696.6116 Email: [email protected] Website: http://lt.umn.edu/mage/
7. What is the ratio between the distance on a map and the corresponding distance on the earth’s surface?
a. projection b. resolution c. scale d. density e. dispersion
8. Which of the following would increase the accessibility of a place?
a. eliminating a forest or wood resource b. closing a factory c. building a new police station d. completing a new highway e. adding more land for agriculture
9. “45˚N, 93˚ W” refers to which of the following?
a. absolute location b. street address c. relative location d. IRS coordinates e. internet address
10. “110 miles north of the Iowa border” refers to which of the following? a. absolute location b. street location c. relative location d. IRS coordinates e. internet address
11. What is the name for the line of 0˚ latitude?
a. Prime Meridian b. North Pole c. Equator d. International Date Line e. Tropic of Cancer
12. Which of the following maps has the smallest scale?
a. city park map b. county map c. state map d. continent map e. world map
Minnesota Alliance for Geographic Education ▪ Macalester College ▪ 1600 Grand Avenue, St. Paul, Minnesota 55105 Phone: 651.696.6731 Fax: 651.696.6116 Email: [email protected] Website: http://lt.umn.edu/mage/
13. The building of the Three Gorges Dam on the Yangtze River (Chang Jiang River) is an
example of which geographic theme or term? a. Location b. Place c. Movement d. Human – Environment Interaction e. Region
14. The United States is located in which two hemispheres?
a. Northern and Eastern b. Northern and Western c. Southern and Eastern d. Southern and Western e. Northern and Southern
15. North Dakota, South Dakota and Kansas all produce large amounts of wheat. These states have similar climates and soil types. Which geographic theme or term would be used to explain this pattern?
a. Location b. Place c. Movement d. Human-Environment Interaction e. Region
16. How many of the countries in the chart below (Most Populous Counties, 2008) are
located in the Western Hemisphere? a. 1 b. 2 c. 3 d. 4 e. 5
MOST POPULOUS COUNTRIES, 2008
Country Population (millions) China 1,324.7 India 1,149.3 United States 304.5 Indonesia 239.9 Brazil 195.1 Pakistan 172.8 Nigeria 148.1 Bangladesh 147.3 Russia 141.9 Japan 127.7
Minnesota Alliance for Geographic Education ▪ Macalester College ▪ 1600 Grand Avenue, St. Paul, Minnesota 55105 Phone: 651.696.6731 Fax: 651.696.6116 Email: [email protected] Website: http://lt.umn.edu/mage/
17. Which of the following is the BEST example of a perceptual, or vernacular, region?
a. the Midwest b. Minnesota c. Australia d. the market area of a shopping mall e. the broadcast area of a radio station
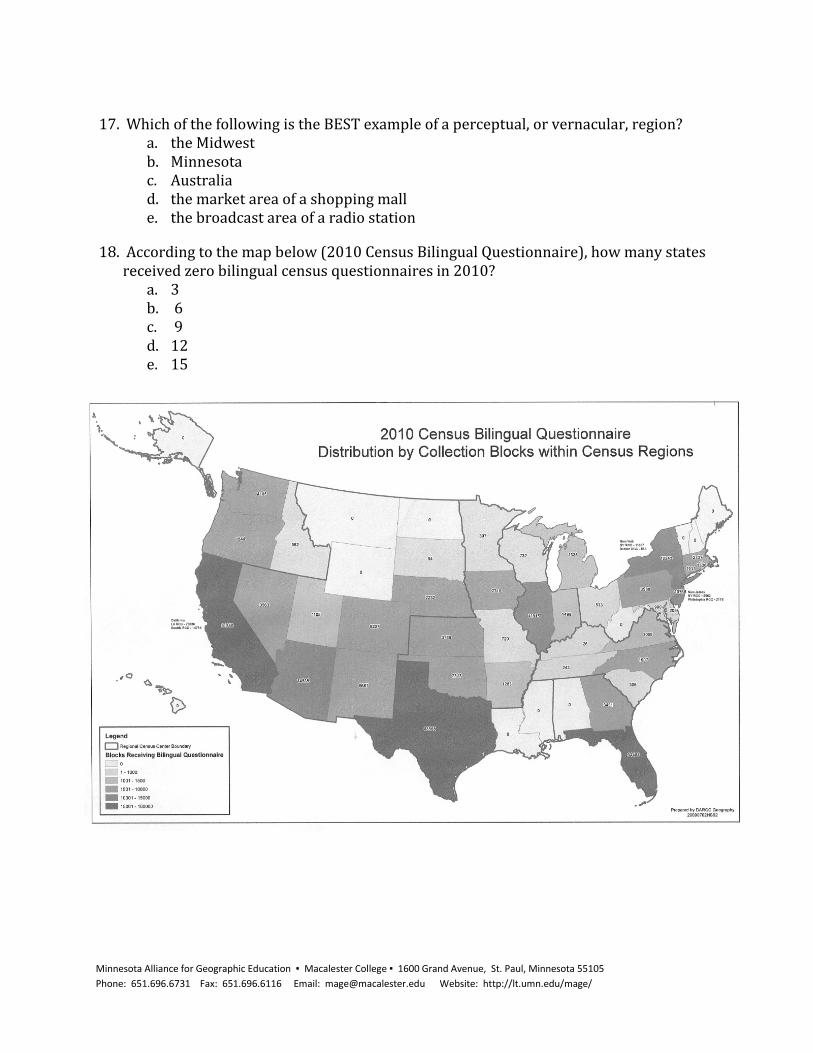
18. According to the map below (2010 Census Bilingual Questionnaire), how many states
received zero bilingual census questionnaires in 2010? a. 3 b. 6 c. 9 d. 12 e. 15
Minnesota Alliance for Geographic Education ▪ Macalester College ▪ 1600 Grand Avenue, St. Paul, Minnesota 55105 Phone: 651.696.6731 Fax: 651.696.6116 Email: [email protected] Website: http://lt.umn.edu/mage/
19. According to the map below (1900 City Population), in which region of the United
States would you find the most cities with a population over 1 million in 1900? a. Northeast b. Southeast c. Midwest d. Southwest e. Northwest
Minnesota Alliance for Geographic Education ▪ Macalester College ▪ 1600 Grand Avenue, St. Paul, Minnesota 55105 Phone: 651.696.6731 Fax: 651.696.6116 Email: [email protected] Website: http://lt.umn.edu/mage/
20. According to the chart below (Federal Spending, United States – FY 2011), which
statement listed below is true? a. The United States spent the same amount on welfare as it does pensions. b. The United States spent the same amount on health as it does on welfare. c. The United States spent twice as much on defense as it does on welfare. d. The United States spent the same amount on pensions as it does defense. e. The United States spent twice as much on welfare as it does on defense.
Minnesota Alliance for Geographic Education ▪ Macalester College ▪ 1600 Grand Avenue, St. Paul, Minnesota 55105 Phone: 651.696.6731 Fax: 651.696.6116 Email: [email protected] Website: http://lt.umn.edu/mage/
21. Which of the following best explains the location of shaded areas on the map below
(2010 Census Bilingual Questionnaire)? a. Migration of Scottish to Appalachia b. Migration of Cajuns from Canada to Louisiana c. Migration of Hispanics from Mexico to Southwest United States d. Migration of Germans to the Upper Midwest e. Migration of Vietnamese to the Pacific Coast
Minnesota Alliance for Geographic Education ▪ Macalester College ▪ 1600 Grand Avenue, St. Paul, Minnesota 55105 Phone: 651.696.6731 Fax: 651.696.6116 Email: [email protected] Website: http://lt.umn.edu/mage/
22. According to the chart below (Crude Oil Imports), from which country did the United
States receive the most crude oil imports per day in 2010? a. Mexico b. Saudi Arabia c. Nigeria d. Canada e. Venezuela
Crude Oil Imports (Top 15 Countries) to the United States
(Thousand Barrels per Day) Country Apr-10 Mar-10 YTD 2010 Apr-09 YTD 2009
Minnesota Alliance for Geographic Education ▪ Macalester College ▪ 1600 Grand Avenue, St. Paul, Minnesota 55105 Phone: 651.696.6731 Fax: 651.696.6116 Email: [email protected] Website: http://lt.umn.edu/mage/
23. Based on the chart below (Percentage Distribution of Students Enrolled in Degree-
Granting Institutions), which statement best describes the pattern in regards to Asian enrollment in institutions of higher education from 1976 to 1990?
a. The percent of Asians enrolled has increased. b. The percent of Asians enrolled has decreased. c. The percent of Asians enrolled has tripled. d. The percent of Asians enrolled has remained the same. e. The percent of Asians enrolled has decreased by 50%.
Percentage distribution of students enrolled in degree-granting institutions, by race/ethnicity: Selected years, fall 1976 through fall 2007
Race/ethnicity
Institutions of higher education Degree-granting institutions
Minnesota Alliance for Geographic Education ▪ Macalester College ▪ 1600 Grand Avenue, St. Paul, Minnesota 55105 Phone: 651.696.6731 Fax: 651.696.6116 Email: [email protected] Website: http://lt.umn.edu/mage/
24. Based on the maps below (Congressional District 6 and Minnesota (8 Districts)), what
statement BEST describes Minnesota’s Congressional Districts? a. The largest Congressional District in regards to land area is found in St. Paul. b. Along Minnesota’s western border is where you would find its longest
Congressional District. c. Minnesota has two congressional districts along the southern border of the
state. d. 5 Congressional Districts are found in the cities of Minneapolis and St. Paul. e. Congressional District 6 contains four counties.
Minnesota Alliance for Geographic Education ▪ Macalester College ▪ 1600 Grand Avenue, St. Paul, Minnesota 55105 Phone: 651.696.6731 Fax: 651.696.6116 Email: [email protected] Website: http://lt.umn.edu/mage/
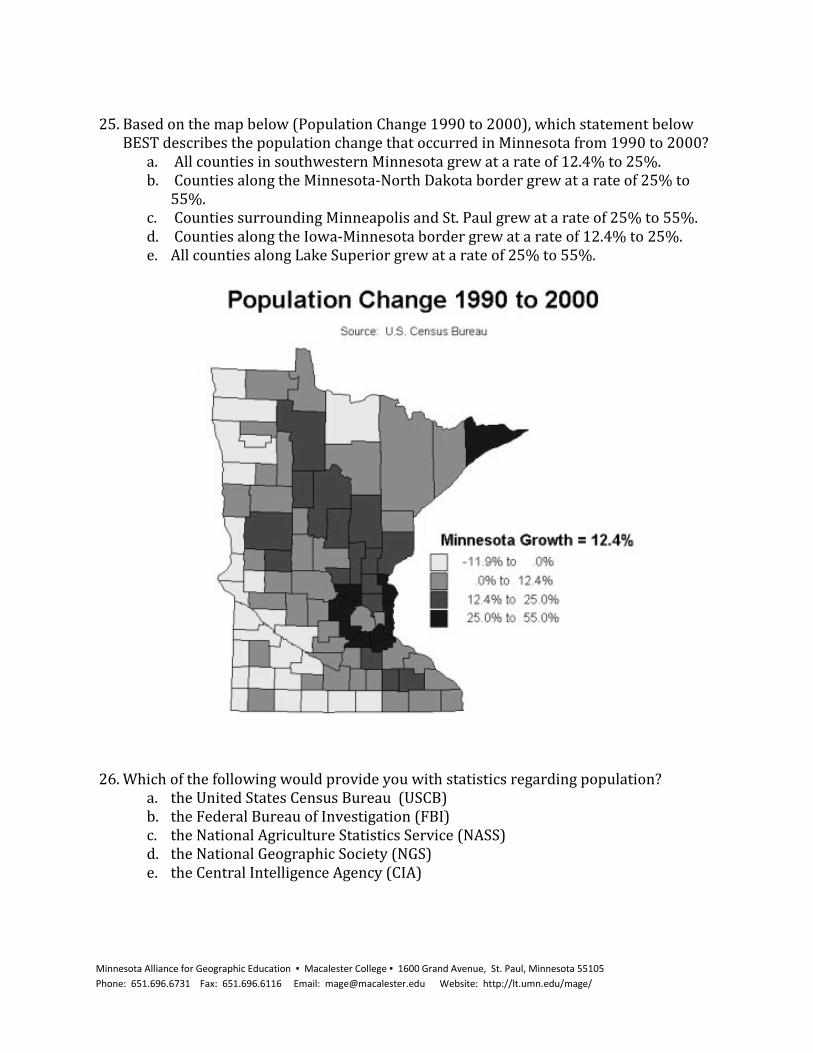
25. Based on the map below (Population Change 1990 to 2000), which statement below
BEST describes the population change that occurred in Minnesota from 1990 to 2000? a. All counties in southwestern Minnesota grew at a rate of 12.4% to 25%. b. Counties along the Minnesota-North Dakota border grew at a rate of 25% to
55%. c. Counties surrounding Minneapolis and St. Paul grew at a rate of 25% to 55%. d. Counties along the Iowa-Minnesota border grew at a rate of 12.4% to 25%. e. All counties along Lake Superior grew at a rate of 25% to 55%.
26. Which of the following would provide you with statistics regarding population?
a. the United States Census Bureau (USCB) b. the Federal Bureau of Investigation (FBI) c. the National Agriculture Statistics Service (NASS) d. the National Geographic Society (NGS) e. the Central Intelligence Agency (CIA)
Minnesota Alliance for Geographic Education ▪ Macalester College ▪ 1600 Grand Avenue, St. Paul, Minnesota 55105 Phone: 651.696.6731 Fax: 651.696.6116 Email: [email protected] Website: http://lt.umn.edu/mage/
27. Which two (2) individual states in the map below (2008 Electoral Votes), have the most electoral votes in the United States?
a. California and Florida b. New York and Florida c. California and New York d. Texas and New York e. California and Texas
2008 Electoral Votes
Minnesota Alliance for Geographic Education ▪ Macalester College ▪ 1600 Grand Avenue, St. Paul, Minnesota 55105 Phone: 651.696.6731 Fax: 651.696.6116 Email: [email protected] Website: http://lt.umn.edu/mage/
28. Based on the chart above (Total Deer Harvest by Season, 1993 - 2009), between which
two years did the deer harvest increase the most in the State of Minnesota? a. 1994 to 1995 b. 1997 to 1998 c. 1999 to 2000 d. 2002 to 2003 e. 2005 to 2006
Minnesota Alliance for Geographic Education ▪ Macalester College ▪ 1600 Grand Avenue, St. Paul, Minnesota 55105 Phone: 651.696.6731 Fax: 651.696.6116 Email: [email protected] Website: http://lt.umn.edu/mage/
29. Based on the graph above (Average Earnings in Relationship to Educational
Attainment), which statement is true? a. Adults with high school diplomas earn less than those with less than a high
school diploma. b. Adults with less than a high school diploma earn 50% less than those with a
master’s degree. c. Adults with a master’s degree earn four times more than those with less than a
high school diploma. d. Adults with high school diplomas earn 50% more than those with a bachelor’s
degree. e. Adults with bachelor’s degrees earn 50% less than those with a masters’
degree. 30. The northern part of Minnesota contains the majority of Minnesota’s forests. Which of
the following economic activities would most likely occur in northern Minnesota? a. Dairy farming b. Logging c. Poultry production d. Swine production e. Gold mining