Unit 2 NOTES Honors Math 2 20 Day 7: The Quadratic Formula and Discriminants Warm-Up: 1. Solve each of the quadratic functions by graphing and algebraic reasoning a. x 2 – 3 = 0 b. x 2 + 5x – 8= 0 c. Why is it important to have alternative methods of solving? 2. Simplify the radicals. a. 50 b. 3 80 3. Find the equation of the graph in standard form. Show all work. Day 7: The Quadratic Formula and Discriminants Standard form of a quadratic equation: ________________________ The solutions of some quadratic equations are not rational, or are too messy to obtain by factoring. For such equations, the most common method of solution is the quadratic formula. The quadratic formula: X = 2 4 2 b b ac a is used to solve ANY quadratic function for its zeros (x- intercepts). Notice that there is a +/- sign in the formula. There are actually _____________________ for any quadratic formula. X = 2 4 2 b b ac a AND X = 2 4 2 b b ac a Solve using the quadratic formula. Example 1: 2 9 20 0 x x Example 2: 2 5 9 x x x
Transcript
Unit 2 NOTES Honors Math 2 20
Day 7: The Quadratic Formula and Discriminants
Warm-Up:
1. Solve each of the quadratic functions by graphing and algebraic reasoning
a. x2 – 3 = 0 b. x2 + 5x – 8= 0 c. Why is it important to have alternative methods of solving?
2. Simplify the radicals.
a. 50 b. 3 80
3. Find the equation of the graph in standard form. Show all work.
Day 7: The Quadratic Formula and Discriminants
Standard form of a quadratic equation: ________________________
The solutions of some quadratic equations are not rational, or are too messy to obtain by factoring. For such equations, the most common method of solution is the quadratic formula.
The quadratic formula: X = 2 4
2
b b ac
a
is used to solve ANY quadratic function for its zeros (x-
intercepts).
Notice that there is a +/- sign in the formula. There are actually _____________________ for any quadratic formula.
X = 2 4
2
b b ac
a
AND X =
2 4
2
b b ac
a
Solve using the quadratic formula.
Example 1: 2 9 20 0x x Example 2:
2 5 9x x x
Unit 2 NOTES Honors Math 2 21
Example 3: 2 2 2x x Example 4:
27 12 3 0x x
Example 5: 24 12 9 0 x x Example 6:
2 5 5 0 x x
Types of Zeroes
Given the following quadratic functions, use the quadratic formula to find the zeros:
Given the following graphs of quadratic functions:
a) Determine the sign of the discriminant and b) whether the solutions are real or non-real.
EVERYTHING I NEED TO KNOW ABOUT QUADRATICS
Fill in the following chart based on what you need to know about quadratics
Value of the discriminant (b2 – 4ac) Number and type of roots What does the graph look like?
b2 – 4ac is positive and a perfect square b2 – 4ac > 0
b2 – 4ac is positive and a NOT perfect square b2 – 4ac > 0
b2 – 4ac = 0
b2 – 4ac is negative b2 – 4ac < 0
Practice
Calculate the discriminant and determine the number and types of solutions.
Unit 2 NOTES Honors Math 2 24
Function Discriminant Number/Type of Solutions
Ex:
2
2
3 4 0
1, 3, 4
( 3) 4(1)( 4)
9 ( 16) 9 16 25
x x
a b c
25 2 real rational solutions
1. x2 – 6x + 9 = 0
2. x2 + 6x = -9
3. x2 – 6x – 16 = 0
4. 2x2 – 6x – 13 = 0
5. -x2 + 2x – 1 = 0
6. 2x2 + 3 = 2x
7. x2 + 2x + 1 = 0
8. x2 + 2x = –3
9. x2 – 6x + 9 = 0
10. x2 + 5x + 8 = 0
11. 2x2 – 5x + 6 = 0
12. x2 – 5x = 10
13. x2 – 6x + 3x = 4 – 11
Day 8: Quiz Day
Warm-Up:
1.Find the zeros of the following. Show all your work using the appropriate method. Leave in simplest radical
form when necessary.
a. x2 – 9x + 12 = 0 b. x2 – 16 = -4x c. 2x2 + 8x = 13 d. x2 + 3x = 28
**continue on next page**
Unit 2 NOTES Honors Math 2 25
2.Show your work in the boxes to find the requested values of y = 2x2 – 5x – 3 algebraically. Then graph.
Solve by factoring
x-intercepts
Vertex
y-intercepts
Maximum or minimum?
Axis of symmetry
Day 9: FRED Functions
Warm-Up: Graphing Quadratic Inequalities and Applications Practice
STEPS: 1.) Graph the boundary. Determine if it should be solid (≤ , ≥) or dashed (> , <).
2.) Test a point. (0, 0) is a good point to use IF it’s not on the line!
3.) If the point works (ends in a true statement), shade the region where the point lies.
If the point does not work (ends in a false statement), shade the opposite region.
1: Graph 2 2 8y x x 2: Graph 2 4 5y x x
3. Factor Completely a. 4x2 - 12x + 9 b. 4x2 - 36
Unit 2 NOTES Honors Math 2 26
4. An electronics company has a new line of portable radios with CD players. Their research suggests that the daily sales, s, for the new product can be modeled by s = -p2 + 120p + 1400, where p is the price of each unit.
a. What is the maximum daily sales total for the new product?
b. What price should the company charge to make this profit?
5. The shape of the Gateway Arch in St. Louis is a catenary curve, which closely resembles a parabola. The function
xxy 4315
2 2 closely models the shape of the arch, where y is the height in feet and x is the horizontal
distance from the base of the left side of the arch in feet. a. What is the width of the arch at the
base?
b. What is the maximum height of the arch?
Day 9: FRED Functions Part 1
To the right is a graph of a “Fred” function. We can use Fred functions to explore transformations in the coordinate plane.
I. Let’s review briefly.
1. a. Explain what a function is in your own words.
b. Using the graph, how do we know that Fred is a function?
2. a. Explain what we mean by the term domain.
b. Using the graph, what is the domain of Fred?
3. a. Explain what we mean by the term range. b. Using the graph, what is the range of Fred?
4. Let’s explore the points on Fred. a. How many points lie on Fred? Can you list them all?
b. What are the key points that would help us graph Fred?
We are going to call these key points “characteristic” points. It is important when graphing a function that you are able to identify these characteristic points.
c. Use the graph of graph to evaluate the following.
II. Remember that F(x) is another name for the y-values.
Therefore the equation of Fred is y = F(x).
X F(x)
–1
1
2
4
1. Why did we choose those x-values to put in the table?
Now let’s try graphing Freddie Jr.: y = F(x) + 4. Complete the table below for this new function and then graph
Freddie Jr. on the coordinate plane above.
y = F(x) + 4
x y
–1
1
2
4
2. What type of transformation maps Fred, F(x), to Freddie Jr., F(x) + 4? (Be specific.)
3. How did this transformation affect the x-values? (Hint: Compare the characteristic points of Fred and Freddie Jr.)
4. How did this transformation affect the y-values? (Hint: Compare the characteristic points of Fred and Freddie Jr.)
5. In y = F(x) + 4, how did the “+4” affect the graph of Fred? Did it affect the domain or the range?
Unit 2 NOTES Honors Math 2 28
III. Suppose Freddie Jr’s equation is: y = F(x) – 3. Complete the table below for this new function and then graph
Freddie Jr. on the coordinate plane above.
y = F(x) – 3
x y
–1
1
2
4
1. What type of transformation maps Fred, F(x), to Freddie Jr., F(x) – 3? Be specific.
2. How did this transformation affect the x-values? (Hint: Compare the characteristic points of Fred and Freddie Jr.)
3. How did this transformation affect the y-values? (Hint: Compare the characteristic points of Fred and Freddie Jr.)
4. In y = F(x) – 3, how did the “– 3” affect the graph of Fred? Did it affect the domain or the range?
IV. Checkpoint: Using the understanding you have gained so far, describe the affect to Fred for the following
functions.
Equation Effect to Fred’s graph Example: y=F(x) + 18 Translate up 18 units
1. y = F(x) – 100
2. y = F(x) + 73
3. y = F(x) + 32
4. y = F(x) – 521
Unit 2 NOTES Honors Math 2 29
V. Suppose Freddie Jr’s equation is: y = F(x + 4).
1. Complete the table.
x X + 4 y
–5 –1 1
1 –1
2 –1
4 –2
(Hint: Since, x + 4 = –1, subtract 4 from both sides
of the equation, and x = –5. Use a similar method
to find the missing x values.)
2. On the coordinate plane above, graph the 4 ordered pairs (x, y). The first point is (–5, 1).
3. What type of transformation maps Fred, F(x), to Freddie Jr., F(x + 4)? (Be specific.)
4. How did this transformation affect the x-values? (Hint: Compare the characteristic points of Fred and Freddie Jr.) 5. How did this transformation affect the y-values? (Hint: Compare the characteristic points of Fred and Freddie Jr.) 6. In y = F(x + 4), how did the “+4” affect the graph of Fred? Did it affect the domain or the range?
VI. Suppose Freddie Jr’s equation is: y = F(x – 3). Complete the table below for this new function and then graph
Freddie Jr. on the coordinate plane above.
1. Complete the table.
y = F(x – 3)
x x – 3 Y –1
1
2
4
2. On the coordinate plane above, graph the 4 ordered pairs (x, y). [Hint: The 1st point should be (2, 1).]
Unit 2 NOTES Honors Math 2 30
3. What type of transformation maps Fred, F(x), to Freddie Jr., F(x – 3)? (Be specific.)
4. How did this transformation affect the x-values? (Hint: Compare the characteristic points of Fred and Freddie Jr.)
5. How did this transformation affect the y-values? (Hint: Compare the characteristic points of Fred and Freddie Jr.)
6. In y = F(x – 3), how did the “ –3” affect the graph of Fred? Did it affect the domain or the range?
VII. Checkpoint: Using the understanding you have gained so far, describe the effect to Fred for the following
functions.
Equation Effect to Fred’s graph
Example: y=F(x + 18) Translate left 18 units
1. y = F(x – 10)
2. y = F(x) + 7
3. y = F(x + 48)
4. y = F(x) – 22
5. y = F(x + 30) + 18
VIII. Checkpoint: Using the understanding you have gained so far, write the equation that would have the following
effect on Fred’s graph.
Equation Effect to Fred’s graph
Example: y=F(x + 8) Translate left 8 units
1. Translate up 29 units
2. Translate right 7
3. Translate left 45
4. Translate left 5 and up 14
5. Translate down 2 and right 6
Unit 2 NOTES Honors Math 2 31
IX. Now let’s look at a new function.
Its notation is H(x), and we will call it Harry.
Use Harry to demonstrate what you have learned
so far about the transformations of functions.
1. What are Harry’s characteristic points?
__________________________________________
2. Describe the effect on Harry’s graph for each
of the following.
a. H(x – 2) _______________________________________________
b. H(x) + 7 _______________________________________________
c. H(x+2) – 3 _______________________________________________
3. Use your answers to questions 1 and 2 to help you sketch each graph without using a table.
a. y = H(x – 2) b. y = H(x) + 7
c. y = H(x+2) – 3
Unit 2 NOTES Honors Math 2 32
Day 10: Transformations of Quadractics
Warm-Up:
Graphing quadratic systems -> Graph both quadratics, then darkly shade the area of overlap. 2 2
2 2
1) 12 2) 4 3
7 12 6 8
y x x y x x
y x x y x x
Factor completely
3) 81x4 – 16 4) 12x2 + 26x – 10
Day 10: FRED Functions Part 2
I. Let’s suppose that Freddie Jr. is y = – F(x)
7. Complete the table.
y = – F(x)
x F(x) y
–1 1 –1
1
2
4
8. On the coordinate plane above, graph the 4 ordered pairs (x, y). [Hint: The 1st point should be (–1, –1).]
9. What type of transformation maps Fred, F(x), to Freddie Jr., –F(x)? (Be specific.)
10. How did this transformation affect the x-values? (Hint: Compare the characteristic points of Fred and Freddie Jr.)
11. How did this transformation affect the y-values? (Hint: Compare the characteristic points of Fred and Freddie Jr.)
12. In y = – F(x), how did the negative coefficient of “F(x)” affect the graph of Fred? How does this relate to our study of
transformations earlier this semester?
F(x)
Unit 2 NOTES Honors Math 2 33
II. Now let’s suppose that Freddie Jr. is y = F(–x)
1. Complete the table.
y = F(–x)
x –x y
–1
1
2
4
2. On the coordinate plane above, graph the 4 ordered pairs (x, y). [Hint: The 1st point should be (1, 1).]
3. What type of transformation maps Fred, F(x), to Freddie Jr., F(–x)? (Be specific.)
4. How did this transformation affect the x-values? (Hint: Compare the characteristic points of Fred and Freddie Jr.)
5. How did this transformation affect the y-values? (Hint: Compare the characteristic points of Fred and Freddie Jr.)
6. In y = F(–x), how did the negative coefficient of “x” affect the graph of Fred? How does this relate to our study of
transformations earlier this semester?
III. Checkpoint: Harry is H(x) and is shown on each grid. Use Harry’s characteristic points to graph Harry’s
children without making a table.
1. y = H(–x) 2. y = – H(x)
F(x)
Unit 2 NOTES Honors Math 2 34
IV. Let’s suppose that Freddie Jr. is y = 4 F(x)
1. Complete the table.
y = 4 F(x)
x F(x) y
–1
1
2
4
2. On the coordinate plane above, graph the 4 ordered pairs (x, y). [Hint: The 1st one should be (–1, 4).]
3. How did this transformation affect the x-values? (Hint: Compare the characteristic points of Fred and Freddie Jr.)
4. How did this transformation affect the y-values? (Hint: Compare the characteristic points of Fred and Freddie Jr.)
5. In y = 4 F(x), the coefficient of “F(x)” is 4. How did that affect the graph of Fred? Is this one of the transformations
we studied? If so, which one? If not, explain.
V. Now let’s suppose that Freddie Jr. is y = ½ F(x).
1. Complete the table.
y = ½ F(x)
x F(x) y
–1
1
2
4
2. On the coordinate plane above, graph the 4 ordered pairs (x, y). [Hint: The 1st one should be (–1, ½).]
F(x)
F(x)
Unit 2 NOTES Honors Math 2 35
3. How did this transformation affect the x-values? (Hint: Compare the characteristic points of Fred and Freddie Jr.)
4. How did this transformation affect the y-values? (Hint: Compare the characteristic points of Fred and Freddie Jr.)
5. In y = ½ F(x), the coefficient of “F(x)” is ½. How did that affect the graph of Fred? How is this different from the
graph of y = 4 F(x) on the previous page?
VI. Checkpoint:
1. Complete each chart below. Each chart starts with the characteristic points of Fred.
2. Compare the 2nd and 3rd columns of each chart above. The 2nd column is the y-value for Fred. Can you make a
conjecture about how a coefficient changes the parent graph?
VII. Now let’s suppose that Freddie Jr. is y = –3 F(x).
1. Complete the table.
y = –3 F(x)
x F(x) y
–1
1
2
4
2. On the coordinate plane above, graph the 4 ordered pairs (x, y). [Hint: The 1st one should be (–1, –3).]
3. Reread the conjecture you made in part VI. Does it hold true or do you need to refine it?
If it does need some work, restate it more correctly here.
X F(x) 3 F(x)
–1 1
1 –1
2 –1
4 –2
x F(x) ¼ F(x)
–1 1
1 –1
2 –1
4 –2
F(x)
Unit 2 NOTES Honors Math 2 36
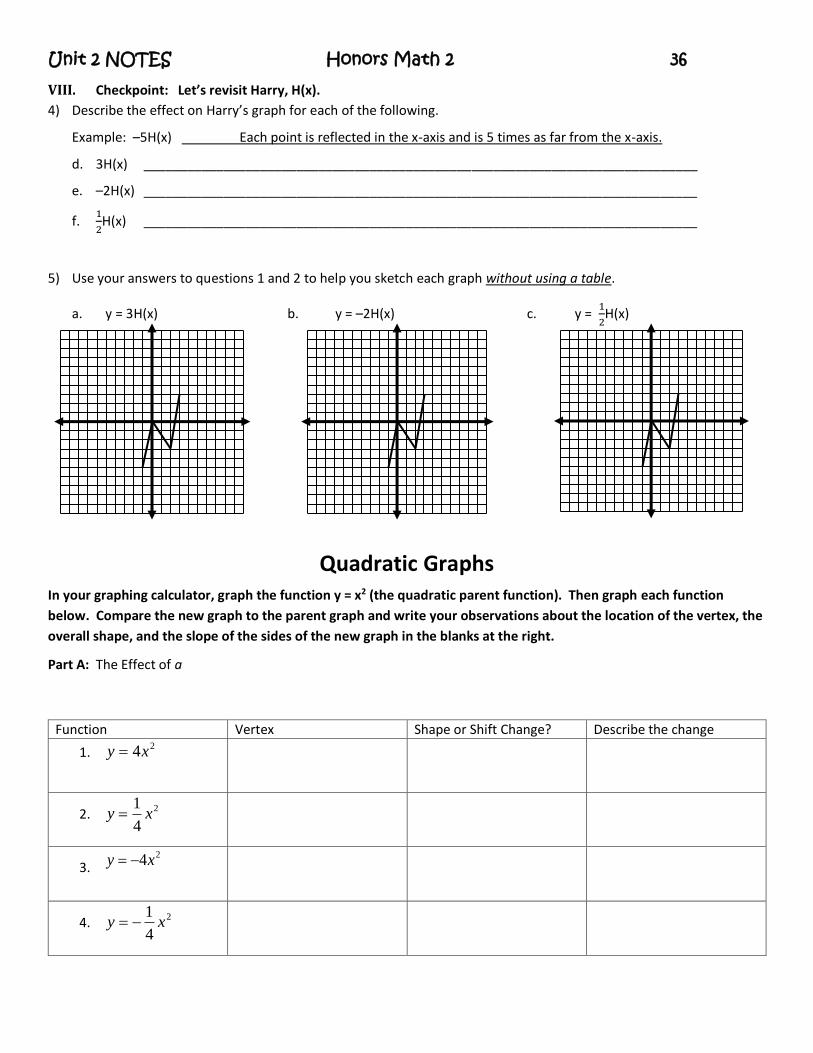
VIII. Checkpoint: Let’s revisit Harry, H(x).
4) Describe the effect on Harry’s graph for each of the following.
Example: –5H(x) Each point is reflected in the x-axis and is 5 times as far from the x-axis.
d. 3H(x) ____________________________________________________________________________
e. –2H(x) ____________________________________________________________________________