1 Unit 2 – Part 2 – Special Functions Name: ____________________________ Piecewise Functions - Graphing Shipping Rates The following information comes from the United States Postal Service website, www.usps.com You will use your calculator to generate 5 random package weights, which you will place on the axes on the front board. To get your package weights: In the scratchpad on your calculator, choose MENU 5: Probablility 4: Random 6: Seed Enter your cell phone number and hit enter MENU 5: Probablility 4: Random 1: Number Bump out of the parentheses, multiply by 8, and hit enter 5 times Enter your 5 points into the class Desmos table: Weight Cost 1. What do you notice about our graph? 2. What do you wonder? 3. What characteristics of this graph are similar or different from graphs you’ve seen before? What about the context causes these similarities/differences? 4. Is this relation a function? If so, state the domain and range.
Transcript
1
Unit 2 – Part 2 – Special Functions Name: ____________________________
Piecewise Functions - Graphing Shipping Rates
The following information comes from the United States Postal Service website, www.usps.com
You will use your calculator to generate 5 random package weights, which you will place on the axes on the front board.
To get your package weights:
In the scratchpad on your calculator, choose MENU 5: Probablility 4: Random 6: Seed Enter your cell phone number and hit enter MENU 5: Probablility 4: Random 1: Number Bump out of the parentheses, multiply by 8, and hit enter 5 times
Enter your 5 points into the class Desmos table:
Weight Cost
1. What do you notice about our graph?
2. What do you wonder?
3. What characteristics of this graph are similar or different from graphs you’ve seen before?
What about the context causes these similarities/differences?
4. Is this relation a function? If so, state the domain and range.
Piecewise Functions Introduction 1) You have a summer job that pays time and a half overtime. That is, if you work more than 40 hours per week, your hourly wage for the extra hours is 1.5 times your normal hourly wage of $7.
a) How much will you make if you work 35 hours? 40 hours? 45 hours? b) Write an expression for wages earned if you work up to 40 hours. c) Write an expression for waged earned if you work over 40 hours. d) Let’s practice writing the piecewise function:
Number of Hours
worked
Money
earned
0
10
20
30
35
40
41
42
43
44
45
3
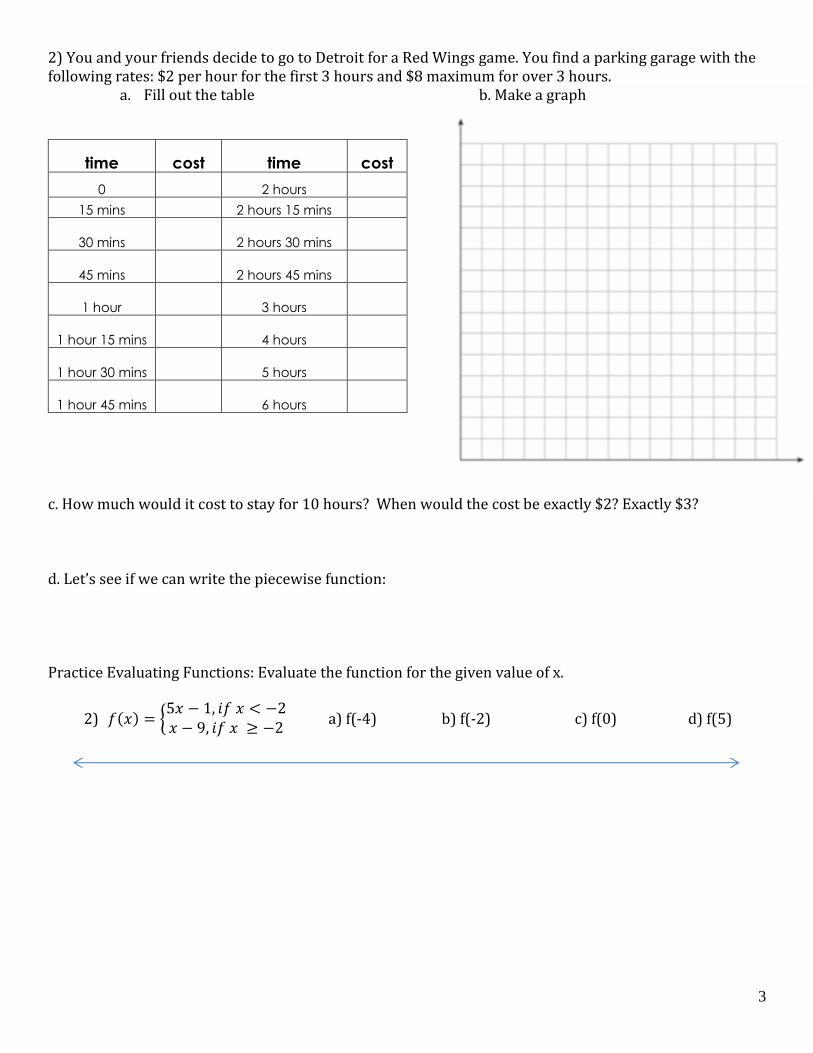
2) You and your friends decide to go to Detroit for a Red Wings game. You find a parking garage with the following rates: $2 per hour for the first 3 hours and $8 maximum for over 3 hours.
a. Fill out the table b. Make a graph
c. How much would it cost to stay for 10 hours? When would the cost be exactly $2? Exactly $3? d. Let’s see if we can write the piecewise function: Practice Evaluating Functions: Evaluate the function for the given value of x.
2) 𝑓(𝑥) = {5𝑥 − 1, 𝑖𝑓 𝑥 < −2𝑥 − 9, 𝑖𝑓 𝑥 ≥ −2
a) f(-4) b) f(-2) c) f(0) d) f(5)
time cost time cost
0 2 hours
15 mins 2 hours 15 mins
30 mins 2 hours 30 mins
45 mins 2 hours 45 mins
1 hour 3 hours
1 hour 15 mins 4 hours
1 hour 30 mins 5 hours
1 hour 45 mins 6 hours
4
3) ℎ(𝑥) = {2𝑥, 𝑖𝑓 𝑥 ≥ 1
−𝑥 + 3, 𝑖𝑓 𝑥 < 1 a) h(1) b) h(-10) c) h(6) d) h(0)
Piecewise Functions
Piecewise Function - _____________________________________________________________________
Example: 1. Evaluate the function for the given value of x.
𝑓(𝑥) = {3𝑥 − 1, 𝑖𝑓 𝑥 ≤ 42𝑥 + 7, 𝑖𝑓 𝑥 > 4
a. x = 10 b. x = 4 c. x = -2 d. x = 1
3
2. Evaluate the function for the given value of x.
𝑓(𝑥) = {5𝑥 − 1, 𝑖𝑓 𝑥 ≤ 1−𝑥 + 4, 𝑖𝑓 𝑥 > 1
a. x = 1 b. x = 4 c. x = -2 d. x = 1
3
5
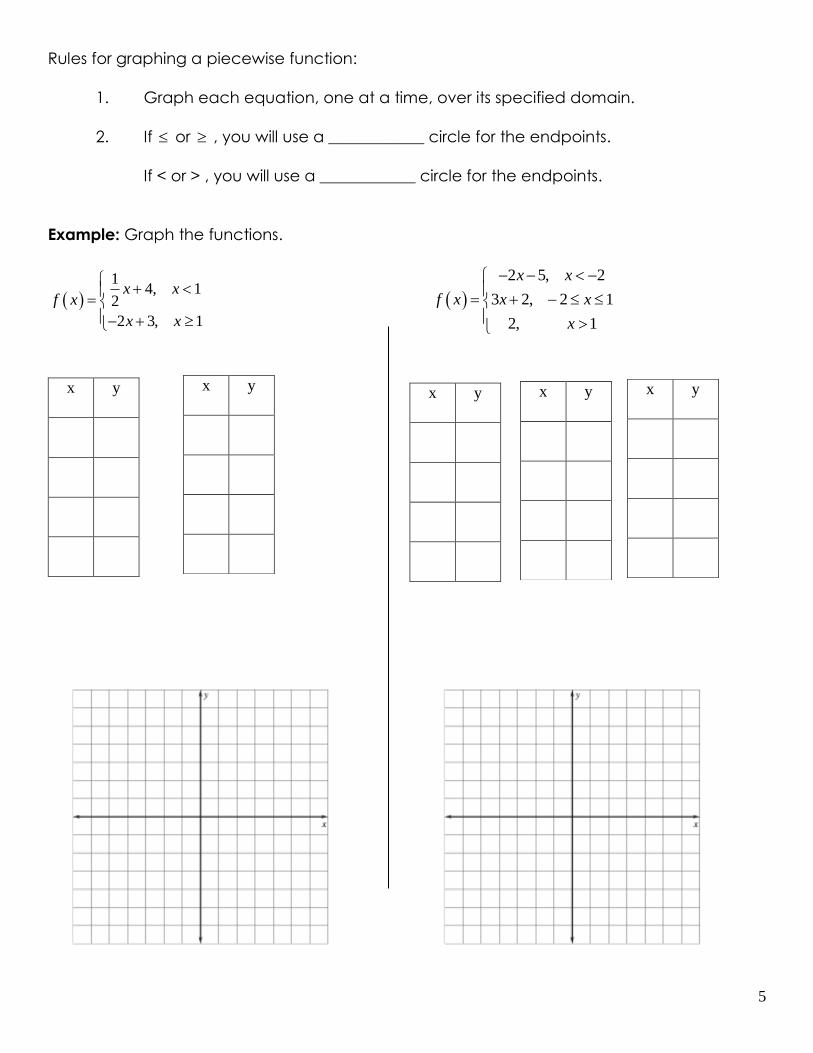
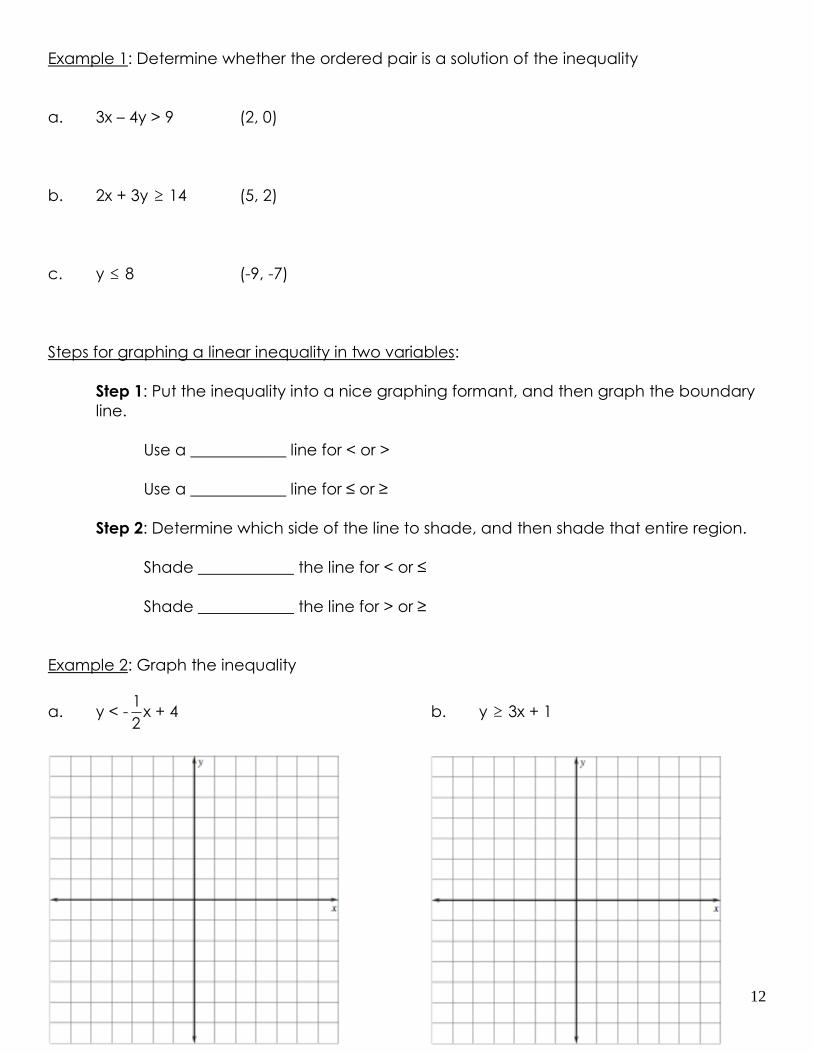
Rules for graphing a piecewise function:
1. Graph each equation, one at a time, over its specified domain.
2. If or , you will use a ____________ circle for the endpoints.
If < or > , you will use a ____________ circle for the endpoints.
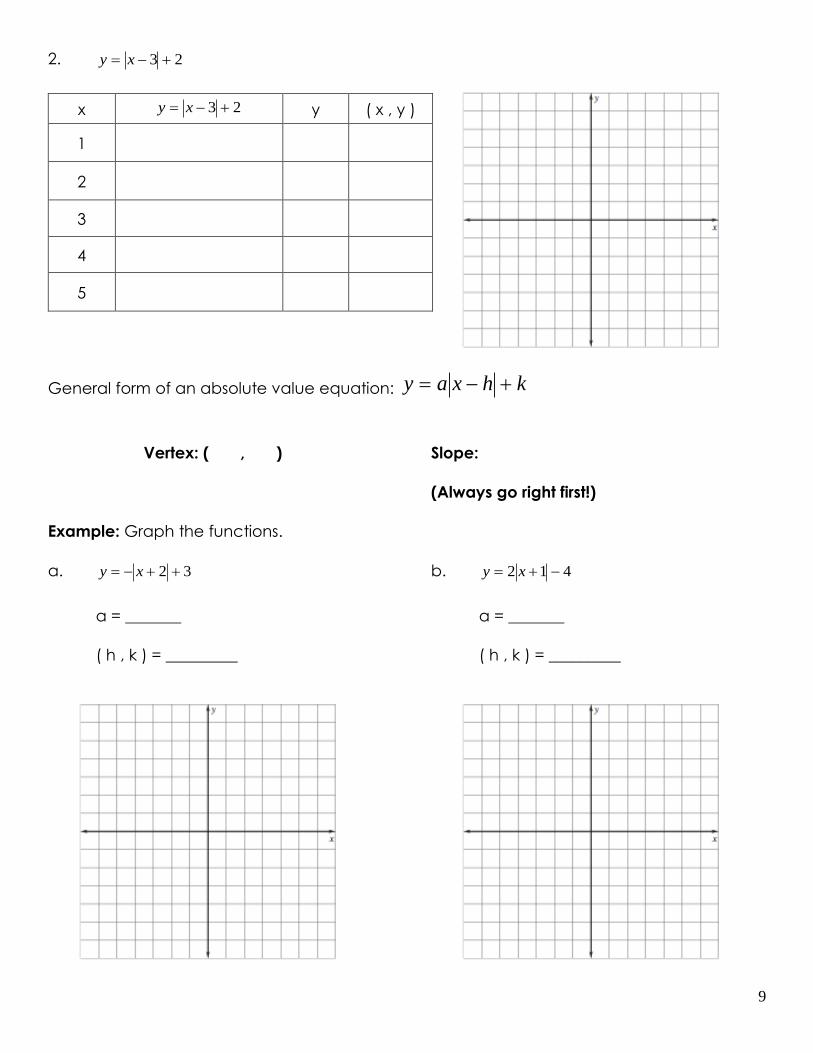
Example: Graph the functions.
1
4, 12
2 3, 1
x xf x
x x
2 5, 2
3 2, 2 1
2, 1
x x
f x x x
x
x y
x y
x y
x y
x y
6
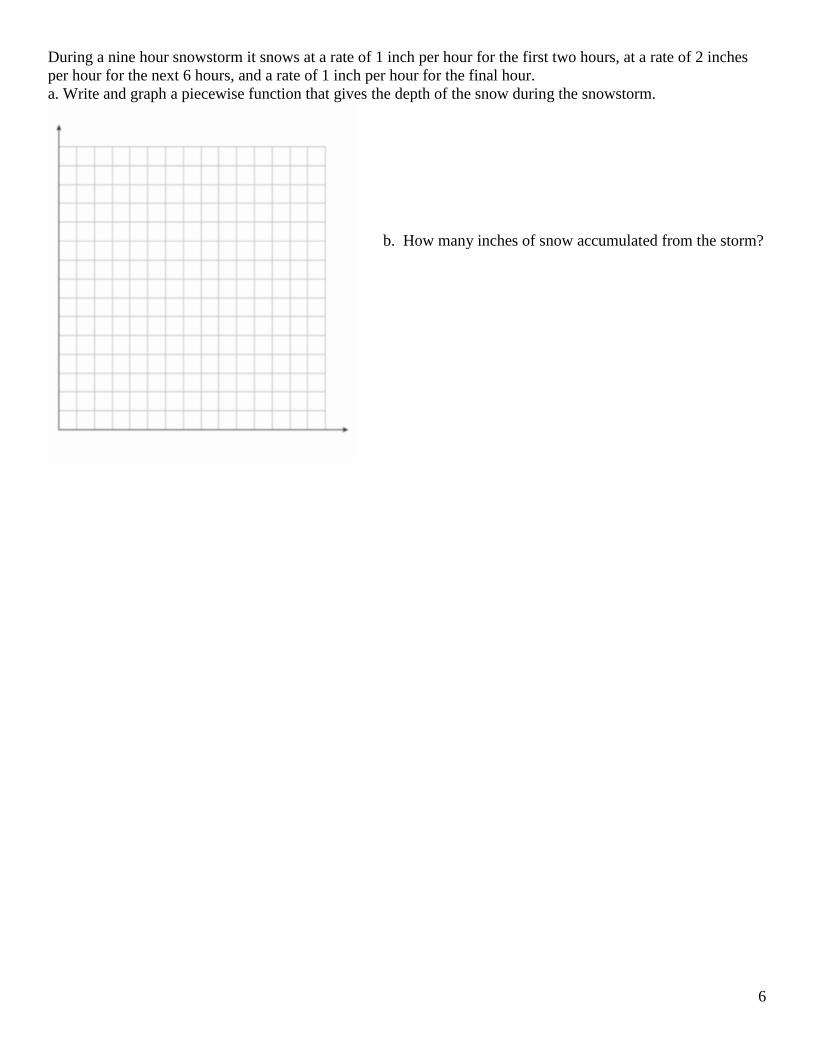
During a nine hour snowstorm it snows at a rate of 1 inch per hour for the first two hours, at a rate of 2 inches
per hour for the next 6 hours, and a rate of 1 inch per hour for the final hour.
a. Write and graph a piecewise function that gives the depth of the snow during the snowstorm.
b. How many inches of snow accumulated from the storm?
7
Introduction to Absolute Value Graphs – Card Sort Examine all of the graphs, tables, and equations you have. 1. What do all of the graphs have in common?
Sort all of the graphs according to some commonality among the graphs. Find at least three different ways to sort the graphs. You have been provided with space for 4 different groupings, but you may only need 2 or 3 spaces, depending on your commonality. Sort #1 We grouped the following graphs together (give the letter of the graphs you grouped together): Grouping 1: _________________________ Grouping 2: _________________________ Grouping 3: _________________________ Grouping 4: _________________________ We grouped the graphs together, because ______________________________________________________ ________________________________________________________________________________________ ________________________________________________________________________________________ Sort #2 We grouped the following graphs together (give the letter of the graphs you grouped together): Grouping 1: _________________________ Grouping 2: _________________________ Grouping 3: _________________________ Grouping 4: _________________________ We grouped the graphs together, because ______________________________________________________ ________________________________________________________________________________________ ________________________________________________________________________________________
8
Sort #3 We grouped the following graphs together (give the letter of the graphs you grouped together): Grouping 1: _________________________ Grouping 2: _________________________ Grouping 3: _________________________ Grouping 4: _________________________ We grouped the graphs together, because ______________________________________________________ ________________________________________________________________________________________ ________________________________________________________________________________________