29
Unit 2 Review: Population
| Date post: | 02-Jan-2016 |
| Category: |
Documents |
| Upload: | derek-stafford |
| View: | 235 times |
| Download: | 0 times |

Unit 2 Review: Population

Vocab• Demography• Arithmetic population density: number of
people/km2 (or mile)• Physiologic population density: number of
people/km2 (or mile) of arable land• Agricultural density – number of farmers
per arable land• Ecumene – portion of Earth’s surface
occupied by permanent human settlement• Nonecumene – uninhabited or sparsely
populated

Highest Population Density
Region Country – pop/km2
East Asia
South Asia
Southeast Asia
Western Europe
1.
2.
3.
4.
Monaco – 23,6601.
2.
3.
4.
5.
Singapore -6,369
Malta – 1,272
Maldives-1,105
Bahrain-1,047
Bangladesh -1,0456.
• Some areas of North America’s population have clusters of high density areas – such as the megalopolis extending from Boston to Washington, DC. (de Blij 43) approx. with a population density of 7000+ per sq. km
• New York Country has a population density of 67,000 / sq. mile (Rubenstein)

• Overpopulation• Carrying Capacity• J-Curve – a graph representing
exponential growth• S-Curve – the flattened out part of the
curve represents a population size consistent with and supportable by the exploitable resource base – have reached the homeostatic plateau

Time
Stage 1 Stage 2 Stage 3 Stage 4
Naturalincrease
Birth rate
Death rate
Note: Natural increase is produced from the excess of births over deaths.www.prb.org
DTM: The Classic Stages
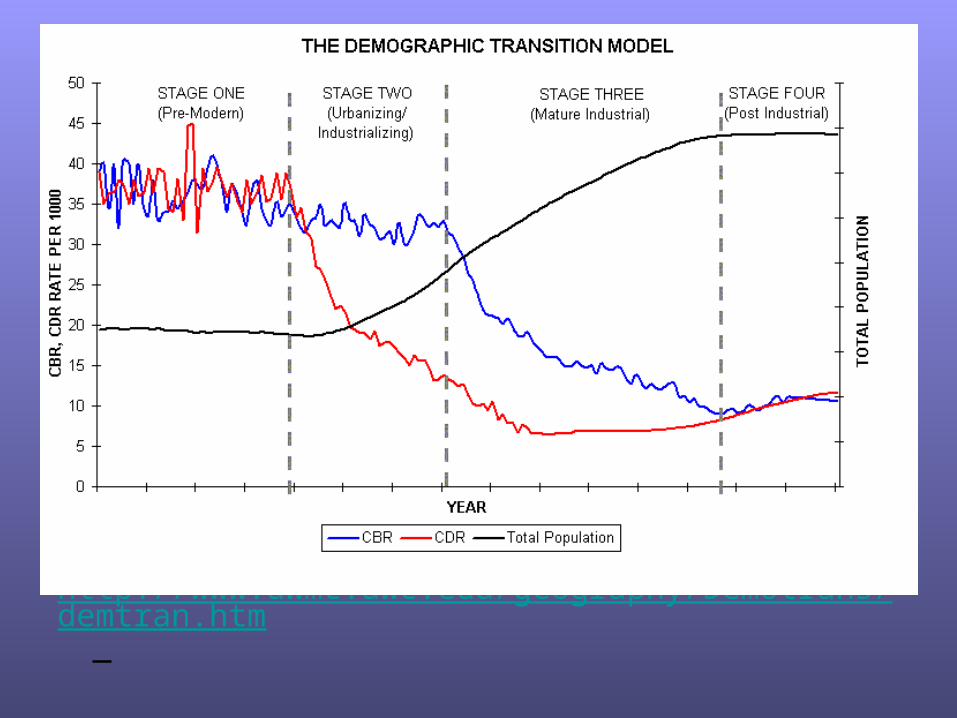
http://www.uwmc.uwc.edu/geography/Demotrans/demtran.htm

http://www.geographyalltheway.com/ib_geography/ib_population/ib_demographic_transition_model.htm


Statistics for England
Year CBR CDR Population
1750 40 40 6
1800 34 20 9
1850 34 22 18
1900 28 16 32
1950 16 12 44
2000 11 10 60

Population Statistics
• NIR• TFR• CDR• CBR• IMR• Doubling Times• Life Expectancy• ZPG

Decline or Growth, 2005-2050Percent
8
10
13
-23
-11
-6
Russia (1.4)
Italy (1.3)
Trinidad & Tobago (1.6)
Armenia (1.3)
China (1.6)
Country (average number of children per woman)
Source: Population Reference Bureau, 2005 World Population Data Sheet.
Countries with Low Fertility
Thailand (1.7)
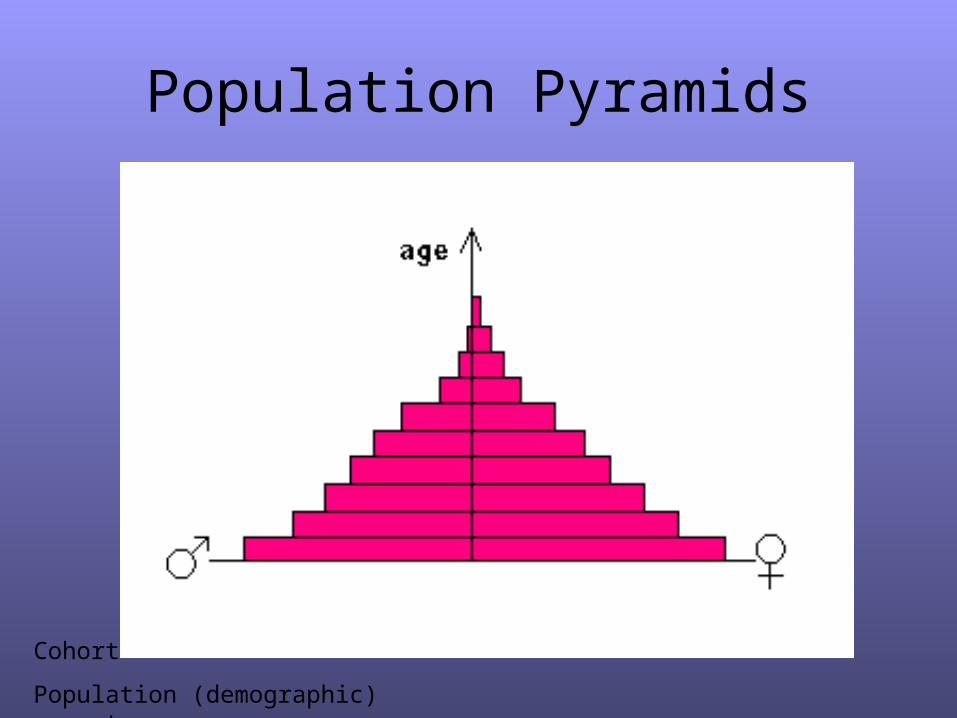
Population Pyramids
Cohort
Population (demographic) momentum
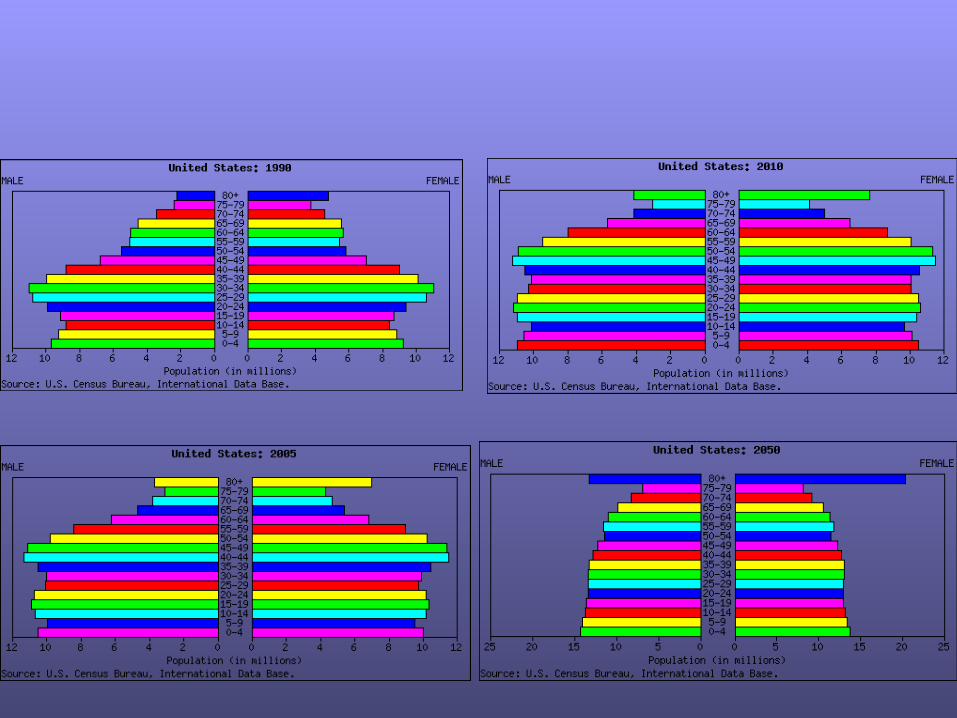
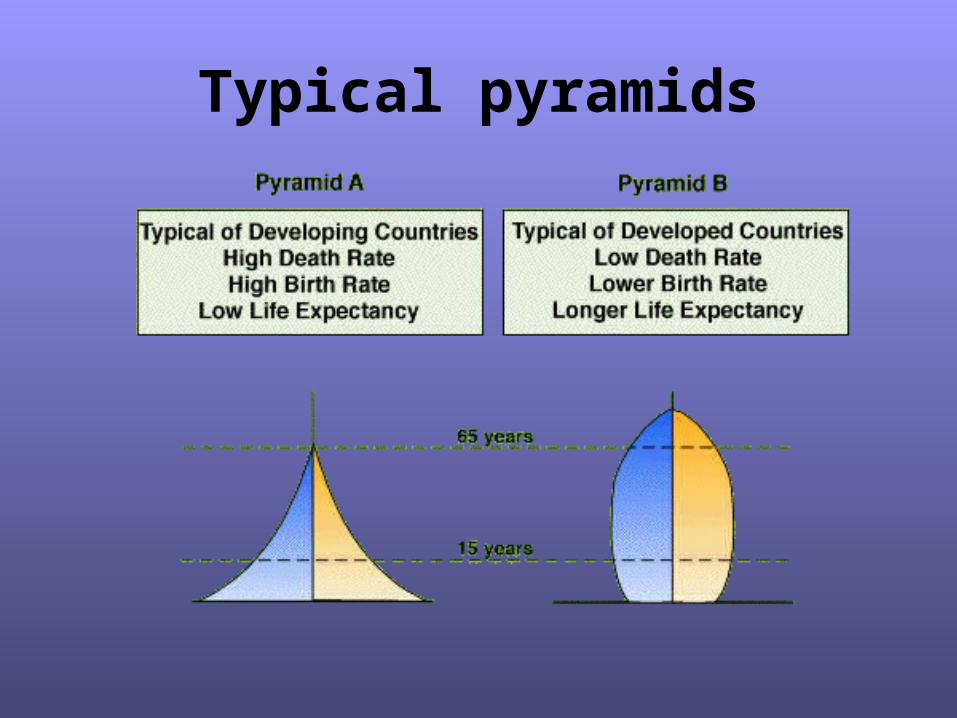
Typical pyramids


Government Population Policies
• Expansive Population Policies – ex. Europe• Eugenic Population Policies – designed to favor
one racial or cultural sector, ex. Japan• Restrictive Population Policies – range from
toleration of officially unapproved means of birth control to China’s one child only policy (de Blij)
• Swedish gov’t encouraging w/ little results• Catholic countries prohibit birth control yet have
slow growth in close by countries, higher growth farther away. Islamic countries experience opposite.

Malthus & Neo-Malthusian
• Malthus – English economist – without checks on the population, it will inevitably increase faster than the food supplies
• Neo-Malthusians – advocates of population control
Vocab• Age distribution • Carrying capacity • Demographic equation • Demographic regions • Dependency ratio • Diffusion of fertility control • Disease diffusion • Epidemiological
Transition model • Gendered space • Maladaptation
• Mortality • Natality • Overpopulation • Population explosion • Population projection • Rate of natural increase • Sex ratio • Standard of living • Sustainability • Underpopulation

Unit 2 Review: Migration

Types of Movement
• Cyclic Movement – daily routine takes them through a regular sequence of short moves within a local area – activity spaces– Commuting– Nomadism
• Periodic Movement – a longer routine but still results in returning home– Migrant labor– Transhumance – system of pastoral farming in which
ranchers move with the livestock

Migration
• International / Internal (inter-regional)– THINK SCALE– Migration transition – stage 2 migrants
(source countries) move to stage 4 countries (destination countries)
• Forced / Voluntary
• Chain Migration

Migration ??? Explanations/models/yada yada
• Push & Pull Factors– Economic (remittances)– Environmental– Cultural– Distance decay & intervening opportunities– Chain migration
• Ravenstein’s Law• Gravity Model – size and distance affects
number of migrants

Im- or E-migration Patterns
• US Immigration Wave Chart!
• European Immigration– Guest workers
• Emigrants from– Cuba– Vietnam– Haiti

Internal Migration
• Urban to Suburban – (counterurbanization)
• Or Rural to Urban

Immigration Restrictions
• 1920’s Quota Laws and National Origins Act – 2% of number already here
• Immigration Act of 1965 – hemisphere quotas
• 1978 global quota
• Preferences for family sponsored immigrants & Skilled workers or exceptionally talented professionals
Vocab
• Activity space • Forced • Gravity model • Internal migration • Intervening opportunity • Migration patterns • • Intercontinental • • Interregional • • Rural-urban
• Migratory movement • Periodic movement • Personal space • Place utility • Space-time prism • Step migration • Transhumance • Transmigration • Voluntary


