71
Unit 3 Motion Page 119
Unit 3
Motion
Page 119

Just How Fast Were They?
Average speed is defined as:
So just how fast were these athletes on race day?
Case 1: Rio 2016 Olympics: Penny Oleksiak Wins Gold, Sets Olympic RecordYouTube link: https://www.youtube.com/watch?v=Yej6QDEoZzk
Event: _________________________________________
Distance Travelled: _________________
Time of Penny Oleksiak's Gold / Olympic Record Performance: _________________
Question:What was Penny Oleksiak's speed in units of:(a) metres-per-second, "m/s"?
(b) kilometres-per-hour, km/h"?
Case 2: Rio 2016: Usain Bolt Wins Gold, Andre De Grasse Wins Bronze in Men's 100MYouTube link: https://www.youtube.com/watch?v=z2tXiPOgX80&t=259s
Event: _________________________________________
Distance Travelled: _________________
Time of Usain Bolt's gold medal Performance: _________________
Time of Andre De Grasse's bronze medal Performance: _________________
Questions:
1. What was Usain Bolt's speed in units of:(a) metres-per-second, "m/s"?
(b) kilometres-per-hour, "km/h"?
Page 120

2. What was Andre De Grasse's speed in units of:(a) metres-per-second, "m/s"?
(b) kilometres-per-hour, "km/h"?
Case 3: Rio 2016: Penny Oleksiak's Silver Medal Race in Women's 100m ButterflyYouTube link: https://www.youtube.com/watch?v=3-5D43TeAMM
Event: _________________________________________
Distance Travelled: _________________
Time of Penny's silver medal performance: _________________
Question:What was Penny Oleksiak's speed in units of:(a) metres-per-second, "m/s"?
(b) kilometres-per-hour, "km/h"?
Practice Problems1. For each case below, quote the speed of the athlete or athletes in units of:
(i) metres-per second, "m/s" (ii) kilometres-per-hour, "km/h"(a) Rio 2016: Canada's Bronze Medal Race in Women's Swimming 4x200M Freestyle Final
YouTube link: https://www.youtube.com/watch?v=ZWl0pWpZ1JM(b) Rio 2016: Canada's Silver Medal Race in Women's Rowing Lightweight Double Sculls
YouTube link: https://www.youtube.com/watch?v=qitS-zDHGyU(c) Atlanta 1996: Canada's Donovan Bailey sets a World Record and Gold in 100m Final
YouTube link: https://www.youtube.com/watch?v=_Z64K8kznYs
2. Compare Donovan Bailey's 1996 gold medal speed to Usain Bolt's 2016 gold medal speed. Beyond human ability, what may have changed since 1996 to lead to a faster speed for arunner?
Page 121

Units and Unit Conversions
This "physics" unit will commonly make measurements regarding the motion of an object.
With any measurement in science, there are two important parts:
1)
2)
Each part is of equal importance! Get used to quoting BOTH PARTS as we work through thesestudies of motion.
Quite often, we make a measurement in one unit, yet will wish to convert the value to anotherunit.
Length MeasurementsFor length (and distance) measurements, we need to know the SI prefixes which convert from thebase unit of metres, "m" to a derived unit such as kilometres, km.
The list of prefixes are below, with their full names, their prefix symbol, and the factor of 10that they represent.
name: Mega kilo hecta deca (Base Unit) deci centi milli micro
prefix: M k h da (Base Unit) d c m ì
factor of 10: 106 103 102 101 (Base Unit) 10-1 10-2 10-3 10-6 i.e. 1000000 1000 100 10 0.1 0.01 0.001 0.000001
We can remember the prefixes using the memory device:
Quite often we will be given a value, with its given units. We will want new units, which willhave a new value. The new units is our goal, our "target" units.
Page 122

To convert between one unit and another:Method 1: Unit factorsIdea: 1. Given a value, with its "given" units.
2. Note the "target" or new units, that we want.3. Set up a conversion factor, using the "factors of 10". Important: In our conversion
factor, the new "target" units (that we want) go on the top (numerator). The "given"units (which must cancel) go on the bottom (denominator).
Sample Problem 1Convert 2.15m to centimetres, cm.
Sample Problem 2Convert 3500mm (millimetres) to kilometres, km. (Note: Do this in two steps - or the next method!)
Method 2: Moving the decimal placeIdea: 1. Given a value, with its "given" units.
2. Note the "target" or new units, that we want.3. Move the decimal as many places as required, according to the "factors of 10" between
the two units. Important: Make sure you move the decimal in the correct direction. If thetarget "want" unit is a larger unit than the "given" unit, move the decimal to the left. If thetarget "want" unit is a smaller unit than the "given" unit, move the decimal to the right.
IMPORTANT: Note the "JUMPS" for the decimal place:
Name: Mega kilo hecta deca (Base Unit) deci centi milli micro
prefix: M k h da (Base Unit) d c m ì
factor of 10: 106 103 102 101 (Base Unit) 10-1 10-2 10-3 10-6 i.e. 1000000 1000 100 10 0.1 0.01 0.001 0.000001
Sample Problem 1Convert 2.15m to centimetres, cm.
Sample Problem 2Convert 3500mm (millimetres) to kilometres, km.
Page 123
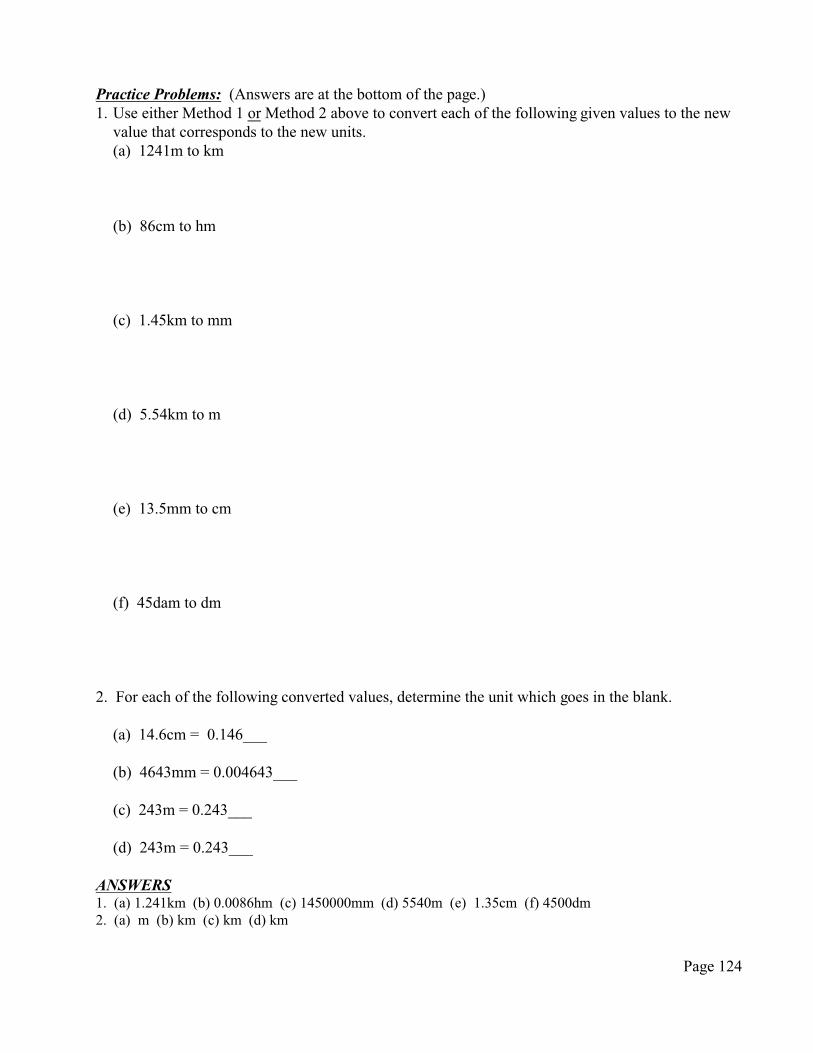
Practice Problems: (Answers are at the bottom of the page.)1. Use either Method 1 or Method 2 above to convert each of the following given values to the new
value that corresponds to the new units.(a) 1241m to km
(b) 86cm to hm
(c) 1.45km to mm
(d) 5.54km to m
(e) 13.5mm to cm
(f) 45dam to dm
2. For each of the following converted values, determine the unit which goes in the blank.
(a) 14.6cm = 0.146___
(b) 4643mm = 0.004643___
(c) 243m = 0.243___
(d) 243m = 0.243___
ANSWERS1. (a) 1.241km (b) 0.0086hm (c) 1450000mm (d) 5540m (e) 1.35cm (f) 4500dm2. (a) m (b) km (c) km (d) km
Page 124

Time Unit Conversions
Converting between the various units of time is an important skill in the study of motion. Rememberthese "time unit facts":
1 minute = _____ seconds 1 hour = _____ minutes
To convert between values using different units of time, the unit factor method is useful. Also note that if a time unit is given as a decimal, the conversion is a little different than if a timevalue is given as a "mixture of two time units" (compare Sample Problem 1 to Sample Problem 2below).
Sample Problem 1Convert 3.5minutes to seconds.
Sample Problem 2Convert 2 minutes and 14 seconds to seconds only.
Sample Problem 3Convert 2.1 hours to seconds.
Page 125

Instead of using the conversion factor method above, we may wish to use the "time unit facts" aboveto convert between time units. Consider:
1 minute = ____ seconds. So: For minutes to seconds, ________________ by ____
For seconds to minutes, ________________ by ____.
1 hour = ______ minutes. So: For hours to minutes, _________________ by ____
For minutes to hours, _________________ by ____.
1 hour = ______ seconds. So: For hours to seconds, _________________ by ____
For seconds to hours, _________________ by ____.
* Note that for each of the conversions above, to go to the smaller time unit we multiply.To go to the bigger time unit we divide.
Practice Problems1. Convert each of the following time measurements to the new units.
(a) 17.3 minutes to seconds.
(b) 17 minutes and 3 seconds to minutes.
(c) 2.2 hours to minutes.
(d) 2.2 hours to seconds.
Page 126

kilometres-per-hour (km/h) versus metres-per-second (m/s)Quite often, we want to convert between "km/h" and "m/s". In this case, both a distance unit and atime unit are involved. We can use the unit factor method to determine a quick conversion factorrule for converting between these units.
For "km/h" converted to "m/s":
So: For km/h to m/s, we __________________________________.
For "m/s" converted to "km/h":
So: For m/s to km/h, we __________________________________.
Sample ProblemComplete each conversion..
(a) 50.0km/h to m/s
(b) 12m/s to km/h
Page 127

Scientific Notation
Scientific Notation converts regular (decimal) notation for a reported value to a base and a power of10.
This means: 0.0034m = 3.4 x 10G3 m
The base is found by moving the decimal place until a number between 1 and 10 is obtained. (In our example above, we had to move the decimal 3 times to the left to get "3.4", which is anumber between one and ten.)
The power of ten is just "10x" where "x" is the number of times you move the decimal.
NOTE: When going FROM regular notation TO scientific notation:- moving the decimal to the LEFT means "x" is positive;- moving the decimal to the RIGHT means "x" is negative.
This means that very large numbers AND very small numbers can be conveniently quoted withscientific notation.
Problems:1. Convert the following into scientific notation.
(a) 300 000 000 m/s = _______________________________
(b) 0.0003634 km/h = _______________________________
(c) 7543 mm = ______________________
2. Convert the following from scientific notation to decimal notation.
(a) 2.75 x 10G4 m = _____________________________________________________________
(b) $2 x 106 = _________________________________________________________________
(c) 1.602 x 10G19 J = ____________________________________________________________
Page 128

Scientific Notation and Math OperationsMake sure that you know how to enter scientific notation in to your calculator, and be able to add,subtract, multiply and divide these values.
Problems:Calculate each of the following. Quote your final answer in scientific notation.
(a) 3.85 cm - 2.1x10G1 cm
(b) 3.0x10² m 15.4 s
Page 129

Worksheet Unit Conversions and Scientific Notation
1. Convert each of the following distance values.(a) 2.45km to m (e) 756mm to km(b) 5.4km to cm (f) 44.2km to m(c) 185cm to m (g) 165m to km (d) 185cm to km (h) 3.28m to km
2. Convert each of the following time values. (a) 3.45min to seconds(b) 3 minutes and 45 seconds to seconds only(c) 5.20 hours to minutes(d) 5465seconds to minutes(e) 6463seconds to hours(f) 7.15 hours to seconds(g) 7 hours and 15 minutes to seconds only
3. Convert each of the following to scientific notation.(a) 454.3m(b) 0.00034m(c) 0.851 seconds(d) 305km(e) 0.000009m(f) 8000000000mm
4. Convert each of the following to decimal form.(a) 3.5 x 10G4m(b) 2.6 x 10³m(c) 1.8 x 10G2m(d) 7.4 x 10⁵m
5. Calculate the following values. Quote your final answer in scientific notation, with correct units.(a) 2.340 x 10²m + 1.000 x 10³m(b) 51.20km + 3.2 x 10G1km (c) (2.45h)@(1.10 x 10²km/h)(d) 7.7m 2.1 x 10G2 s
Answers:1. (a) 2450m 2. (a) 207s 3. (a) 4.543 x 10²m 4. (a) 0.00035m
(b) 540000cm (b) 225s (b) 3.4 x 10G4m (b) 2600m (c) 1.85m (c) 312min (c) 8.51 x 10G1s (c) 0.018m(d) 0.00185km (d) 91.08min (d) 3.05 x 10²km (d) 740000m(e) 0.000756km (e) 1.795h (e) 9 x 10G6m(f) 44200m (f) 25740s (f) 8 x 109mm 5. (a) 1.234 x 10³m(g) 0.165km (g) 26100s (b) 51.52m = 5.152 x 101km(h) 0.00328km (c) 269.5km = 2.695 x 10²km
(d) 3.7 x 10²m/s
Page 130
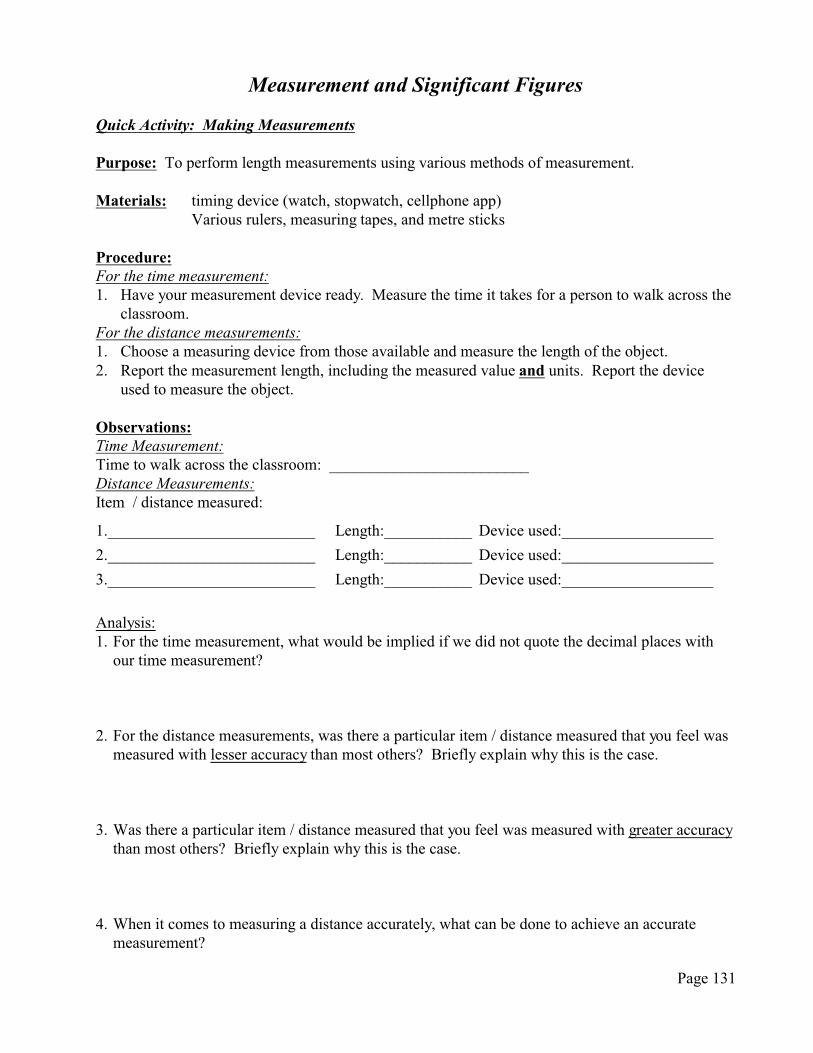
Measurement and Significant Figures
Quick Activity: Making Measurements
Purpose: To perform length measurements using various methods of measurement.
Materials: timing device (watch, stopwatch, cellphone app)Various rulers, measuring tapes, and metre sticks
Procedure:For the time measurement:1. Have your measurement device ready. Measure the time it takes for a person to walk across the
classroom.For the distance measurements:1. Choose a measuring device from those available and measure the length of the object.2. Report the measurement length, including the measured value and units. Report the device
used to measure the object.
Observations:Time Measurement:Time to walk across the classroom: _________________________Distance Measurements:Item / distance measured:
1.__________________________ Length:___________ Device used:___________________
2.__________________________ Length:___________ Device used:___________________
3.__________________________ Length:___________ Device used:___________________
Analysis: 1. For the time measurement, what would be implied if we did not quote the decimal places with
our time measurement?
2. For the distance measurements, was there a particular item / distance measured that you feel wasmeasured with lesser accuracy than most others? Briefly explain why this is the case.
3. Was there a particular item / distance measured that you feel was measured with greater accuracythan most others? Briefly explain why this is the case.
4. When it comes to measuring a distance accurately, what can be done to achieve an accuratemeasurement?
Page 131
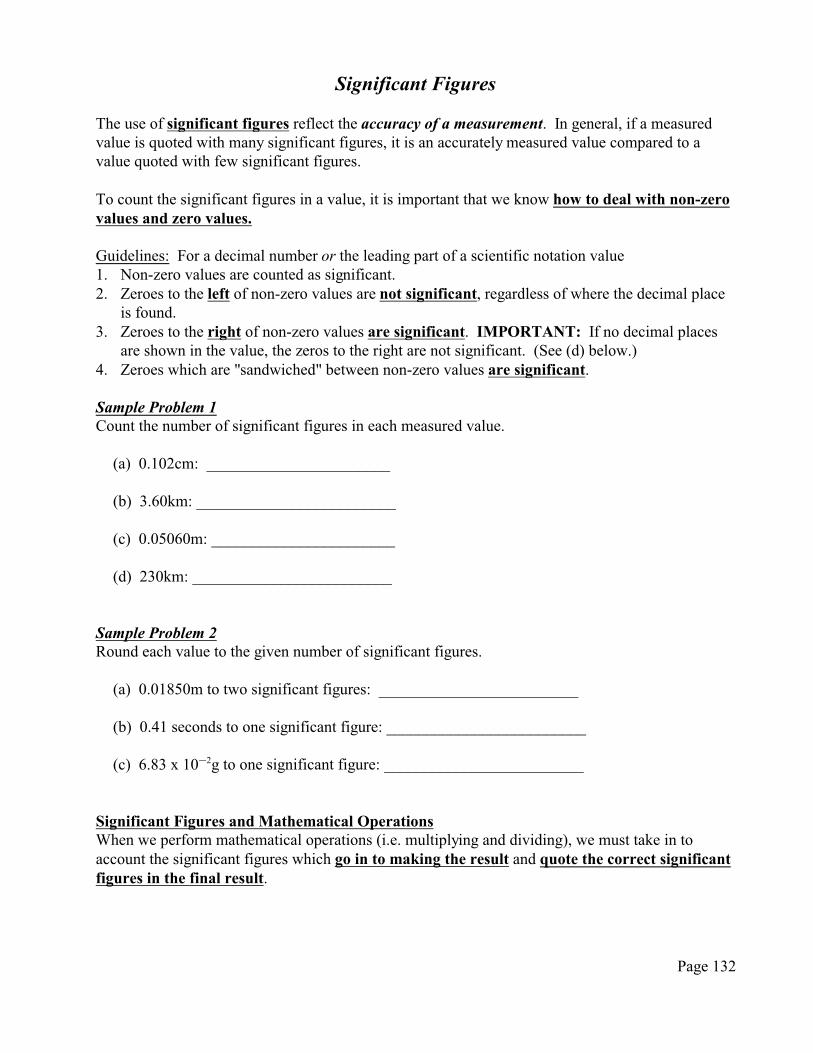
Significant Figures
The use of significant figures reflect the accuracy of a measurement. In general, if a measuredvalue is quoted with many significant figures, it is an accurately measured value compared to avalue quoted with few significant figures.
To count the significant figures in a value, it is important that we know how to deal with non-zerovalues and zero values.
Guidelines: For a decimal number or the leading part of a scientific notation value1. Non-zero values are counted as significant.2. Zeroes to the left of non-zero values are not significant, regardless of where the decimal place
is found.3. Zeroes to the right of non-zero values are significant. IMPORTANT: If no decimal places
are shown in the value, the zeros to the right are not significant. (See (d) below.)4. Zeroes which are "sandwiched" between non-zero values are significant.
Sample Problem 1Count the number of significant figures in each measured value.
(a) 0.102cm: _______________________
(b) 3.60km: _________________________
(c) 0.05060m: _______________________
(d) 230km: _________________________
Sample Problem 2Round each value to the given number of significant figures.
(a) 0.01850m to two significant figures: _________________________
(b) 0.41 seconds to one significant figure: _________________________
(c) 6.83 x 10G2g to one significant figure: _________________________
Significant Figures and Mathematical OperationsWhen we perform mathematical operations (i.e. multiplying and dividing), we must take in toaccount the significant figures which go in to making the result and quote the correct significantfigures in the final result.
Page 132

Rule: Addition and SubtractionReport the final result to have the least decimal places as the values which went in to producingthat result.
Rule: Multiplication and DivisionReport the final result to have the least total significant figures as the values which went in toproducing that result.
Rounding: When rounding, for five (5) and above, round up. For values below 5, round down.
Sample Problem 3Report each final value with correct units and significant figures.
(a) 12.5cm - 3.12cm
(b) 0.80m + 0.221m
(c) 3.5m / 2.06s
(d) 9cm2 x 9.34cm
Page 133
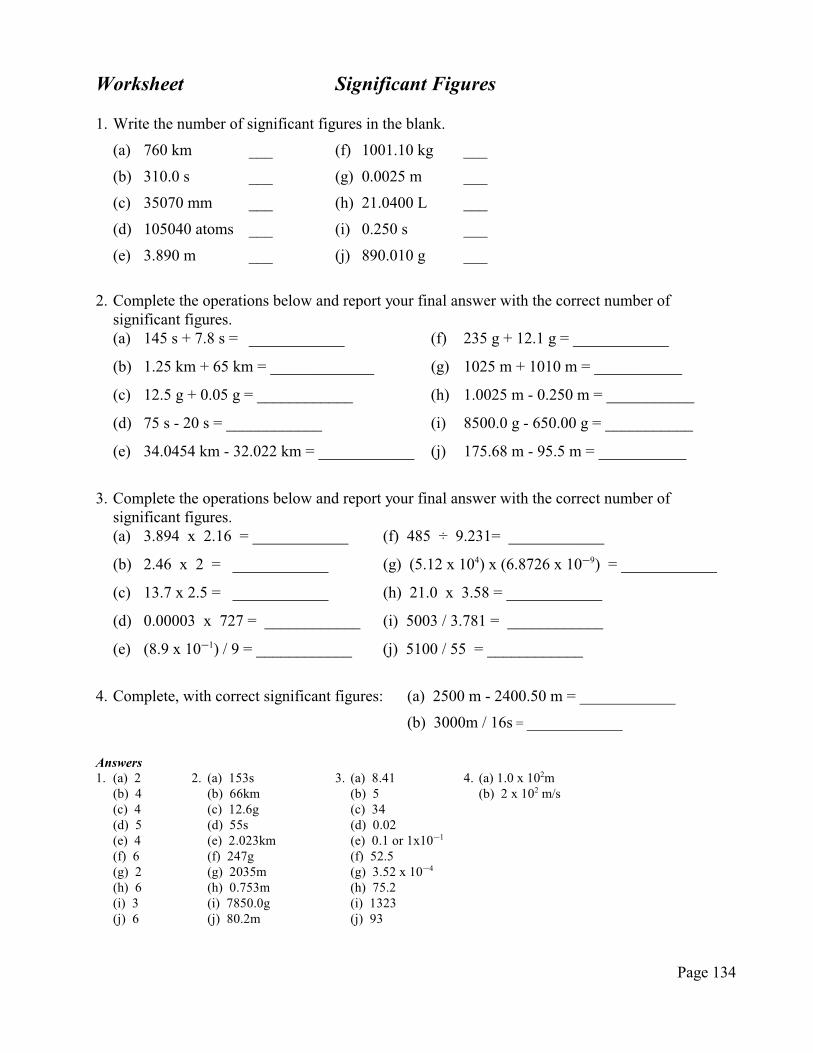
Worksheet Significant Figures 1. Write the number of significant figures in the blank.
(a) 760 km ___ (f) 1001.10 kg ___
(b) 310.0 s ___ (g) 0.0025 m ___
(c) 35070 mm ___ (h) 21.0400 L ___
(d) 105040 atoms ___ (i) 0.250 s ___
(e) 3.890 m ___ (j) 890.010 g ___
2. Complete the operations below and report your final answer with the correct number of
significant figures. (a) 145 s + 7.8 s = ____________ (f) 235 g + 12.1 g = ____________
(b) 1.25 km + 65 km = _____________ (g) 1025 m + 1010 m = ___________
(c) 12.5 g + 0.05 g = ____________ (h) 1.0025 m - 0.250 m = ___________
(d) 75 s - 20 s = ____________ (i) 8500.0 g - 650.00 g = ___________
(e) 34.0454 km - 32.022 km = ____________ (j) 175.68 m - 95.5 m = ___________
3. Complete the operations below and report your final answer with the correct number of
significant figures. (a) 3.894 x 2.16 = ____________ (f) 485 ÷ 9.231= ____________
(b) 2.46 x 2 = ____________ (g) (5.12 x 104) x (6.8726 x 10G9) = ____________
(c) 13.7 x 2.5 = ____________ (h) 21.0 x 3.58 = ____________
(d) 0.00003 x 727 = ____________ (i) 5003 / 3.781 = ____________
(e) (8.9 x 10G1) / 9 = ____________ (j) 5100 / 55 = ____________
4. Complete, with correct significant figures: (a) 2500 m - 2400.50 m = ____________
(b) 3000m / 16s = ____________
Answers1. (a) 2 2. (a) 153s 3. (a) 8.41 4. (a) 1.0 x 10²m
(b) 4 (b) 66km (b) 5 (b) 2 x 10² m/s(c) 4 (c) 12.6g (c) 34(d) 5 (d) 55s (d) 0.02(e) 4 (e) 2.023km (e) 0.1 or 1x10G1
(f) 6 (f) 247g (f) 52.5(g) 2 (g) 2035m (g) 3.52 x 10G4
(h) 6 (h) 0.753m (h) 75.2(i) 3 (i) 7850.0g (i) 1323(j) 6 (j) 80.2m (j) 93
Page 134

Speed, Distance, and Time Textbook page: 209
We have seen: speed = distance time
In symbols: v = d t
Given any two of the three, we will wish to calculate the third quantity. IMPORTANT: Watch the units! Always include units with every value, and cancel units as you goalong. Lastly, always quote the final units with the final answer.
If we choose to rearrange this formula, we get:
for distance, d: d = vt for time, t: t = d v
Sample Problems1. Zeke runs 18m in 3.4 seconds. What's Zeke's average speed?2. Jerry hikes 4.4 hours at a speed of 2.6km/h. What distance does Jerry hike? 3. How long does it take to cycle 21.5km at a speed of 23.5km/h?
Page 135

Worksheet Speed, Distance, and Time (Answers at the end of next page)
1. If David throws a football 49 meters in 2.3 seconds, what is the average speed of the football?
2. When playing soccer, it takes Ashley 2.85 seconds to run from her place on the field at an averagespeed of 6.4m/s to get to the ball. What is the distance does she cover in that time?
3. Darrell ran 5845 meters in a local road race at an average speed of 6.1 m/s. What was his racetime?
4. If Brian races his pickup down Route 10 for 24100 meters in 815 seconds, what is his averagespeed?
5. If Mike rides his motorcycle at an average speed of 21 m/s for 524 seconds, how far did he ride?
6. If Sarah backstrokes at an average speed of 4.3 m/s, how long will it take her to complete a race of200.0 meters length?
Page 136

7. A spider was able to cover 20 centimeters in 5 seconds. What was the average speed of thespider?
8. Zoe kayaks at a speed of 9.7km/h. What time will it take her to cross a 3.4km pond in units of:(a) hours (b) minutes
9. A car travels from Corner Brook to Mount Pearl, a distance of 681km. The average speed of thecar is 102km/h. What time will it take to do the trip, expressed in units of:(a) hours (b) hours and minutes
10. Use your mobile device to look up the distance between where you are now and an ideal getawaydestination. Then, choose a mode of transportation, and look up the average speed for that modeof transportation. Use this data to determine the travel time to your destination, using yourchosen mode of transportation.
ANSWERS1. 21m/s 2. 18m 3. 958s ÿ 9.5x10²s (2 significant figures) 4. 29.6m/s5. 11004m ÿ 1.1x10⁴m or 11km (2 significant figures) 6. 47s 7. 4cm/s8. (a) 0.35h (b) 21 minutes 9. (a) 6.68h (b) 6 hours, 41 minutes
Page 137

Uniform Motion and Graphs
Consider: A sports team gets on a bus, and leaves the school heading across the highway. A table ofdata for the distance the bus has travelled is given below:
time (hours) Distance Travelled (km)
1 91
2 210
3 303
4 387
5 509
1. Estimate the speed of the bus. Briefly explain your reasoning.
2. Graph the data below using a line graph. Use a line of best fit when drawing the line of the graph.Fully label the graph.
3. Use a slope calculation to find the average speed of the bus. Show your workings.
Page 138
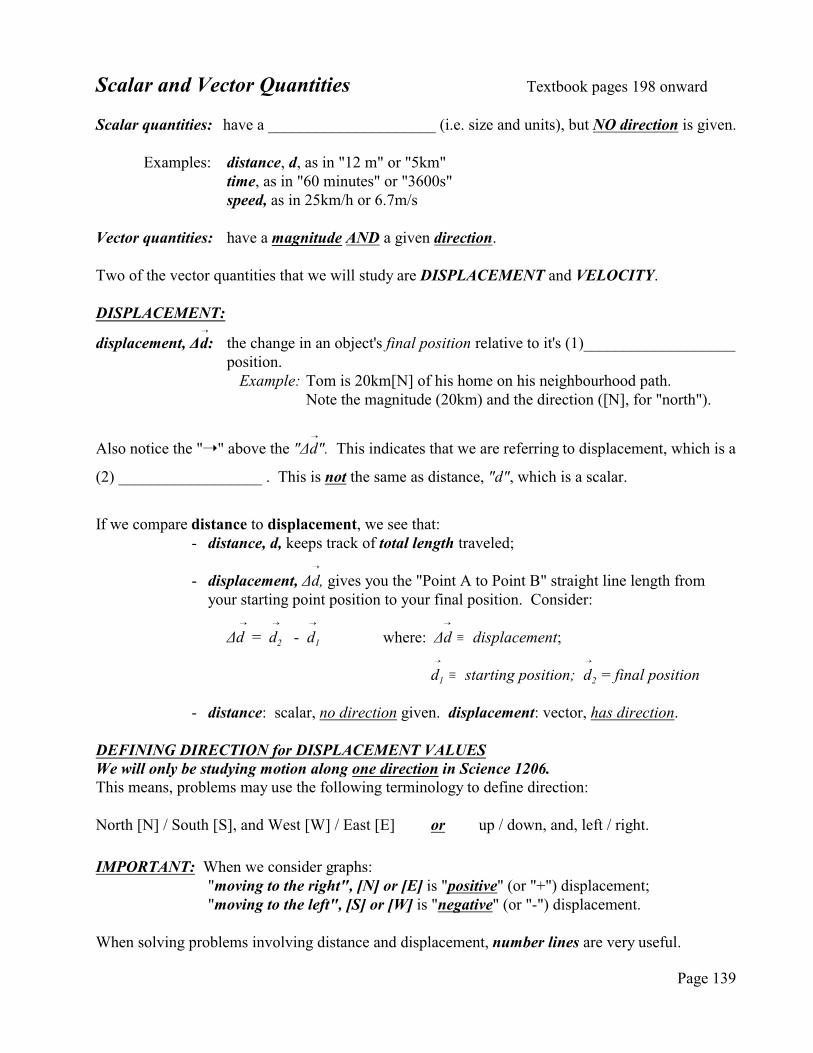
Scalar and Vector Quantities Textbook pages 198 onward
Scalar quantities: have a _____________________ (i.e. size and units), but NO direction is given.
Examples: distance, d, as in "12 m" or "5km" time, as in "60 minutes" or "3600s" speed, as in 25km/h or 6.7m/s
Vector quantities: have a magnitude AND a given direction.
Two of the vector quantities that we will study are DISPLACEMENT and VELOCITY.
DISPLACEMENT: ÷
displacement, Äd: the change in an object's final position relative to it's (1)___________________position.
Example: Tom is 20km[N] of his home on his neighbourhood path.Note the magnitude (20km) and the direction ([N], for "north").
÷
Also notice the "ÿ" above the "Äd". This indicates that we are referring to displacement, which is a
(2) __________________ . This is not the same as distance, "d", which is a scalar.
If we compare distance to displacement, we see that:- distance, d, keeps track of total length traveled;
÷
- displacement, Äd, gives you the "Point A to Point B" straight line length fromyour starting point position to your final position. Consider:
÷ ÷ ÷ ÷
Äd = d2 - d1 where: Äd / displacement;
÷ ÷
d1 / starting position; d2 = final position
- distance: scalar, no direction given. displacement: vector, has direction.
DEFINING DIRECTION for DISPLACEMENT VALUESWe will only be studying motion along one direction in Science 1206.This means, problems may use the following terminology to define direction:
North [N] / South [S], and West [W] / East [E] or up / down, and, left / right.
IMPORTANT: When we consider graphs:"moving to the right", [N] or [E] is "positive" (or "+") displacement;"moving to the left", [S] or [W] is "negative" (or "-") displacement.
When solving problems involving distance and displacement, number lines are very useful.
Page 139

Using Scalar and Vector Quantities to Describe Motion Textbook pages 200 onward
Sample Problem 1Tom rides his bike 5.0 km east to get to school, then back 3.0 km west to hang out at Jerry's afterschool. When Tom is at Jerry's:(a) what is his distance traveled?(b) what is his displacement?
Solution, Sample Problem 1:
Sample Problem 2Tom walks 5.5m to the right, then 3.1m to the left. He then walks 1.1m to the right. Lastly, hemoves 3.5 to the left. What is Jack's: (a) total distance, and (b) displacement?
Solution, Sample Problem 2:
Page 140

Worksheet Scalars, Vectors and Displacement
Scalars and Vectors1. Classify each measurement as being either scalar or vector.
(a) 43.5m[W] (e) 87km/h(b) 43.5m (f) 78km/h[N](c) 12.6s (g) 1.54min(d) 3.4km[right] (h) 2.2x10³km[down]
2. Does a car's speedometer indicate a scalar quantity, a vector quantity, or both? Explain.
3. Can the displacement of an object from its original position ever exceed the total distancemoved? Explain.
4. A jogger runs 725m[N], then encounters a mad dog. He then turns around and runs back812m[S].
(a) What is the distance travelled? (b) What is the runner's displacement?
5. A ball rolls 15m to the right, then hits a wall and rolls 8m to the left. What is the (a) distance travelled by the ball? (b) ball's displacement?
6. A frog hops 12m[W], then 14m[E], then another 6m[E]. What is the:(a) frog's distance travelled? (b) frog's displacement?
7. A ball makes two moves. First, the ball rolls 65m[right]. Its final displacement is 14m[left].(a) What was the ball's second move? (b) What is the ball's total distance travelled?
Answers1. (a) vector (b) scalar (c) scalar (d) vector (e) scalar (f) vector (g) scalar (h) vector2. Scalar. The speed is measured, but no direction.3. No. The displacement is the straight-line (shortest) distance from the starting position to the final
position. That may equal the distance travelled in some instances, but displacement will never be greaterthan the distance travelled.
4. (a) 1537m (b) 87m[S]5. (a) 23m (b) 7m[right] or +7m (with "right" defined as "+")6. (a) 32m (c) 8m[E]7. (a) 79m[left] (b) 144m
Page 141

Speed and Velocity Textbook pages 208 onward; pages 256 to 258.
In terms of scalar measurements, speed is what we get when we look at distance traveled over acertain time period.
speed, v : the total distance traveled over time: v = d t
In terms of vector measurements, we have velocity. ÷ ÷ ÷
velocity, v : the rate at which displacement changes over time: v = Äd Ät
The above formula applies to uniform motion (i.e. no acceleration), and refers to the averagevelocity of the object. Later, when we consider non-uniform motion (i.e. acceleration occurs) wewill look at instantaneous velocity.
Sample Problem 1: A cart is pushed 25.5m west for 7.0seconds. It then turns, and goes 16.5m east in 4.0 seconds.For the cart, what is the:
(a) distance traveled?(b) displacement?(c) average speed?(d) average velocity?
Page 142

Sample Problem 2:A bus drives at 55km/h north for 1.8hours. It then drives at 75km/h south for 1.1hours. Determine the:
(a) distance traveled by the bus(b) displacement of the bus(c) average speed(d) average velocity
Page 143

Worksheet Velocity and Speed Calculations
1. A skateboarder cruises 65m to the left in 22 seconds. She then turns instantly, and moves 34mto the right in 11 seconds.(a) Determine the total distance traveled by the skateboarder and her average speed. (b) Determine the displacement of the skateboarder and her velocity.
2. (a) Determine the final displacement of a spider which moves 15cm north in 5.0s, 12cm southin 2.0s and 21cm north in 4.5s on his web.
(b) State the total distance for the spider's journey.(c) Calculate the spider's average speed.(d) Calculate the time it would take for the spider to travel a total distance of 52cm at this
average speed.(e) Calculate the spider's velocity.
3. A toy rocket at take-off has a velocity of 15m/s [N] for 5.0s. The engine suddenly stops, and therocket starts falling toward the earth at a velocity of 12m/s [S] for 3.0s. Determine the rocket's:(a) total distance(b) displacement(c) average velocity(d) average speed
4. A ball rolls at 44cm/min to the right for 0.50minutes. It then rolls at a velocity of 25cm/min leftfor 0.75minutes. What is the ball's:(a) displacement(b) total distance(c) average velocity(d) average speed
ANSWERS (Detailed answers, with workings, are on the Science 1206 webpage)1. (a) 3.0m/s (b) -31m or 31m[left] for displacement; -0.94m/s or 0.94m/s[left] for velocity.2. (a) +24cm or 24cm[N] (b) 48cm (c) 4.2cm/s (d) 12s (e) +2.1cm/s or 2.1cm/s[N]3. (a) 111m (b) +39m or 39m[up] (c) first, time=8.0s; then +4.9m/s or 4.9m/s[up] for velocity
(d) 14m/s4. (a) +3cm or 3cm[right] (b) 41cm (c) first, time=1.25min; then 2.4cm/min[right] (d) 33cm/min
Page 144

Physics Review 1
Terms:1. SI prefixes (Mega to micro)2. base unit3. derived unit4. scientific notation5. significant figures6. counted value
7. defined value8. speed9. distance10. uniform motion11. distance-time graph 12. slope
13. scalar14. vector15. displacement16. velocity
Matching Terms ReviewMatch the above terms to the statements below. Not all terms will be used. No term is used twice.(a) The distance traveled in a given amount of time.(b) The change in displacement in a given amount of time.(c) A SI unit that is obtained by placing a prefix upon the base unit.(d) Motion which involves constant speed (no acceleration).(e) A means of communicating the accuracy of a measurement based upon the number of digits in a
value.(f) A means of communicating a value; particularly useful when the value is an extremely large or
extremely small value.(g) A plot which shows a straight line for uniform motion.(h) The product of "speed multiplied by time".(i) A quantity which has a magnitude and unit, but no direction.(j) The straight line measurement (including direction) from an object's starting position to its final
position.(k) This is a measurement of an object's speed using a distance-time graph.
Questions to Answer1. Convert each given amount to the amount in the wanted unit.
(a) 8395m to km (f) 234s to min (b) 45.33cm to mm (g) 2.3h to s(c) 2.33km to m (h) 5344s to h
(d) 3.50min to s (i) 55km/h to m/s(e) 3min 50s to seconds only (j) 4.5m/s to km/h
2. State each value as scientific notation.(a) 0.0046 (c) 0.00000056 (e) 0.033(b) 4002 (d) 987654 (f) 33
3. State each value as decimal form.(a) 4.6 x 10G3
(c) 1.66 x 10⁴
(b) 3.3 x 10² (d) 8.4 x 10G2
4. Count the number of significant figures in each value.(a) 0.03020m (c) 5.50 seconds (e) 0.0060km(b) 2.00 x 10⁻⁴m (d) 1.0 x 10⁴m (f) 3400s
Page 145

5. Round each value to the number of significant figures stated.(a) 3.42km to 2 significant figures (d) 4.002cm to 3 significant figures(b) 3.45km to 2 significant figures (e) 586m to 2 significant figures (c) 8.94cm to 1 significant figure
6. Complete each calculation, quoting the final answer with correct units and significant figures.(a) 4.08cm - 2.3cm (c) (24m/s)@(3.30s)(b) 6.73km + 2km (d) 145.1km/1.55h
7. What is the purpose of using significant figures in scientific measurements and calculations?
8. Consider the following information and answer the questions below.(1) The speed of light is 3.00 x 10⁸ m/s.(2) There are 28 students in Homeroom 203.(3) There are 1000m in 1km.(4) The distance from Foxtrap to Portugal Cove is 33km.(5) The length of a certain computer screen is 0.4m
(a) Which is a defined value?(b) Which is a counted value?(c) Which value has two significant digits?(d) Which value has at least one leading zero?(e) Which value has three significant digits?(f) What is the speed of light written in regular notation instead of scientific notation?(g) What is the length of the computer screen written in scientific notation?
9. Rearrange the formula: v = d/t for: (a) d = ? (b) t = ?
10. What is the speed of a motorcycle, in "km/h", which travels 65km in 45min?
11. What is the distance travelled by a bus which has an average speed of 96.0km/h for 1.50h?
12. What time will it take to drive to Clarenville to St.John's (189km) at an average speed of 102km/h?
13. The following data were obtained for Jack and George on their race bikes: Jack travelled 24.5kmin 42 minutes, while George travelled 26.2km in 33 minutes.
(a) Convert the time travelled for each cyclist into hours.(b) Calculate the average speed of each cyclist in km/h.(c) (i) At his speed above, how long would it take Jack to travel 33.4km?
(ii) Convert the above time (in (i)) from a decimal value to "hours and minutes"(d) Calculate the distance George can travel in 1 hour and 30 minutes.(e) How many seconds would it take Jack to travel 50.0km?
Page 146

14. The following data were measured for a rollerblader at Bowring Park
time (s) distance (m)
0 0
2 9.8
4 19.2
6 29.3
8 38.6
10 48.5
(a) Plot a fully labeled distance-time graph for the data, using a line of best fit.(b) Is the rollerblader moving with uniform motion? Briefly explain your choice.(c) Using your graph, what is the distance traveled by the rollerblader in: (i) 5 seconds; (ii) 9
seconds(d) Using your graph, determine the average speed of the rollerblader. Include the units in your
answer.(e) What is the speed of the rollerblader converted to "km/h"?(f) At this average speed, how long would it take the rollerblader to travel the approximate length
of the park, which is 4.8km?
15. A toy train is moving with uniform motion at an average speed of 0.15m/s for 30.0 seconds arounda circular-shaped track which has a total length of 4.5m.
(a) What distance is travelled during this time? (b) How many times around the track has the train gone during this time?(c) What is the displacement of the train when it goes around the whole track once? Briefly
explain your response.(d) Consider your answers to (a) and (c). Should your answers be equal? Briefly explain your
choice.
16. A boy and his toy tiger in a wagon travels 72m[E] in 12s. They stop, turn, and immediately travel125m[W] in 17s. What is the boy's:
(a) total distance travelled?(b) displacement?(c) average speed?(d) average velocity?
17. A ball runs along a track at a track at 105cm/s to the right for 8.20s. It then bounces off a wall andrebounds, moving 103cm/s to the left for 4.80s. What is the ball's:
(a) total distance travelled?(b) displacement?(c) average speed?(d) average velocity?
Page 147

Answers - Physics Review 1
Matching Terms Review(a) 8 (d) 10 (g) 11 (j) 15(b) 16 (e) 5 (h) 9 (k) 12(c) 3 (f) 4 (i) 13
Questions to Answer1. (a) 8.395km (f) 3.9min or 3 min 54 seconds
(b) 453.3mm (g) 8280s(c) 2330m (h) 1.484h(d) 210s (i) 15m/s(e) 230s (j) 16km/h
2. (a) 4.6 x 10G3
(c) 5.6 x 10G7
(e) 3.3 x 10G2
(b) 4.002 x 10³
(d) 9.87654 x 10⁵
(f) 3.3 x 101
3. (a) 0.0046 (b) 330 (c) 16600 (d) 0.084
4. (a) 4 (c) 3 (e) 2(b) 3 (d) 2 (f) 2
5. (a) 3.4km (d) 4.000cm(b) 3.5km (e) We can switch to "km", then round to two significant figures: 0.59km(c) 9cm or we can use scientific notation: 5.9 x 10²m.
It is not recommended to say "590m". This is considered to be ambiguous.
6. (a) 1.8cm (b) 9km (c) 79m (d) 93.6km/h
7. Significant figures indicate the accuracy of a measurement. In general, the more significantfigures reported in a value, the more accurately measured the value. For example, 2.10m hasthree significant figures, and conveys the idea of a more accurately measured value than 2.1m,with two significant figures.
8. (a) 3 (b) 2 (c) 4 (d) 5 (e)1 (f) 300000000m/s (g) 4 x 10G1m
9. (a) d = v.t (b) t = d/v
10. First convert minutes to hours: 45min . (1h/60min) = 0.75h
Then: v = d = 65km = 87km/ht 0.75h
11. d = v.t = (96.0km/h).(1.50h) = 144km12. t = d = 189km = 1.85h v 102km/h
Page 148

13. (a) Jack: 0.70h George: 0.55h(b) Jack: 35km/h George: 48km/h(c) (i) 0.95h (ii) 0 hours, 57minutes(d) First convert time to hours only: 1 hours 30 minutes = 1.5hours. Distance:71km(e) 1.428h = 5142s = 5.1 x 10³s (using two significant digits)
14. (a) See graph.
(b) Yes, the rollerblader is moving with uniform motion (constant speed). Reason: Thedistance-time graph is a straight line.
(c) See graph. (i) At t=5.0s, distance d= 24.0m (ii) At t=9.0s, distance d=43.5m(d) See graph for the slope calculation. Slope=speed. Average speed = 4.9m/s.(e) 18km/h (17.64km/h rounded to two significant figures.)(f) 0.27h or 16 minutes.
15. (a) d = v.t = (0.15m/s).(30.0s) = 4.5m(b) It works out that since the track is 4.5m, the train has gone around the track exactly once.(c) The displacement would be zero, since displacement is the straight-line distance between
the final position and the starting position. So, since the final position is back at the start ofthe circular track, the displacement is zero.
(d) The distance is the total length travelled, 4.5m. The displacement is zero and is not thesame, since displacement is the straight line distance between the final position and thestarting position.
Page 149

16. (a) distance = 72m + 125m = 197m(b) Note the start point indicated below. The bold arrow is the displacement arrow.
Also: [E] is the positive (+) direction; [W] is the negative (-) direction.So: start
72m[E] = +72m125m[W] = -125m
÷ ÷ ÷
displacement: Äd = d1 + d2 = (+72m) + (-125m) = -53m = 53m[W]
(c) First: total time, t = 12s + 17s = 29s
average speed: v = d = 197m = 6.8m/s t 29s
÷ ÷
(d) average velocity: v = Äd = 53m[W] = 1.8m/s [W] Ät 29s
17. (a) First use d=v.t to determine the distance for each of moving to the right, then to the left:To the right: d=v.t = (105cm/s).(8.20s) = 861cm to the rightTo the left: d=v.t = (103cm/s).(4.80s) = 494cm to the leftTotal distance travelled: d = 861cm + 494cm = 1355cm
(b) Note the start point indicated below. The bold arrow is the displacement arrow.Also: "right" is the positive (+) direction; "left" is the negative (-) direction.So: start
861cm to the right = +861cm494cm to the left = -494cm
÷ ÷ ÷
displacement: Äd = d1 + d2 = (+861cm) + (-494cm) = +367cm = 367cm to the right.
(c) First: total time, t = 8.20s + 4.80s = 13.00s (Note the significant figures :)
average speed: v = d = 1355cm = 1.042 x 102 cm/s t 13.00s
÷ ÷
(d) average velocity: Äv = Äd = +367cm = +28.2cm/s or 28.2cm/s to the right Ät 13.00s
Page 150

Intro to Position-Time Graphs Textbook pages 218 onward
Position-Time GraphsThe graphs below give several examples on how to describe an object's position over time.
Sample Graph 1Time = 0 defines the object's ______________________ (1) position. Since Object 1 and Object 2 are starting at the zero mark on the y-axis,the position axis, they are starting at "the origin" or position zero.
Notice the slope of each line. A positive slope means that the object ismoving in the direction of "to the ________________ (2)" from itsstarting point.
Given that we are now referring to position and displacement, the slope
of the position-time graph equals the object's __________________(3).
The faster the object is moving, the steeper the slope. Above, Object 1 is moving _____________(4)
than Object 2.
Sample Graph 2In this graph, look to t=0, the start time.Object 4 is initially positioned at 0m, or "at the _______________ (5)."
Object 3 is initially at a position of _______ (6) to the ___________ (7)
of the origin.
The final position is the same for each object. Each object is found at
the position of ___________(8) to the ____________ (9) of the origin.
Regarding the velocity of each object, note that the slope is the same for
each. This means that the velocity is the _____________ (10) for each.
Sample Graph 3
On this graph, object 4 starts at the _________ (11) position, to the
right of the origin. Note the negative slope: it is moving in the
direction of "to the ___________ (12)." Object 4 finishes at the
position of __________(13).
Object 5 starts at the ____________(14) and moves in the direction of
"to the __________(15)." Object 5 has a final position of ______ (16).
Object 6 has no change in its position over time. In other words, object 6 has ______________ (17).
Note that it has a horizontal (i.e. flat) line, with zero slope for its position-time line.
Page 151

Note: The time axis has units of "s"
Sample Graph 4 (Note: Your teacher may assign some of these graph analyses to be done as exercises.)
Notice the axes on this graph: The origin, 0, has objects starting inmany different places, including to the right side (+) and to left side (-)of the origin.Object 7 starts at the ____________________ (18). It moves to the
_______________ (19), and finishes at the _______________(20)
position.
Object 8 starts at ____________________ (21). It moves to the
_______________ (22), and finishes at the _______________(23)
position.
Object 9 starts at ____________________ (24). It moves to the
_______________ (25), and finishes at the _______________(26)
position.
Object 10 starts at ____________________ (27). It moves to the
_______________ (28), and finishes at the _______________(29)
position.
Sample Graph 5
Note that with this graph, the time scale is shown in detail; we willfocus on both position and time measurements in ths example.
Object 11 starts at ________ (30). It moves to the ___________ (31),until the time of __________ (32). It is located at the position of_________ (33). It is stopped at this position.
Object 12 starts at ________ (34). It moves to the ____________ (35)until the time of __________ (36). Its final position shown is at_____________ (37) at the time of ___________ (38).
Object 13 starts at ________ (39). It is stopped until the time of__________ (40). It then moves to the final position of _______ (41)
at the time of ____________ (42).
For the graph above, we can calculate the slope to determine the velocity of the objects over a giventime frame. Determine the velocity of:Object 11, from t=0 to t=10.0s
Object 12, from t=0 to t=10.0s
Object 13, from t=0 to t=5.0s.
Page 152
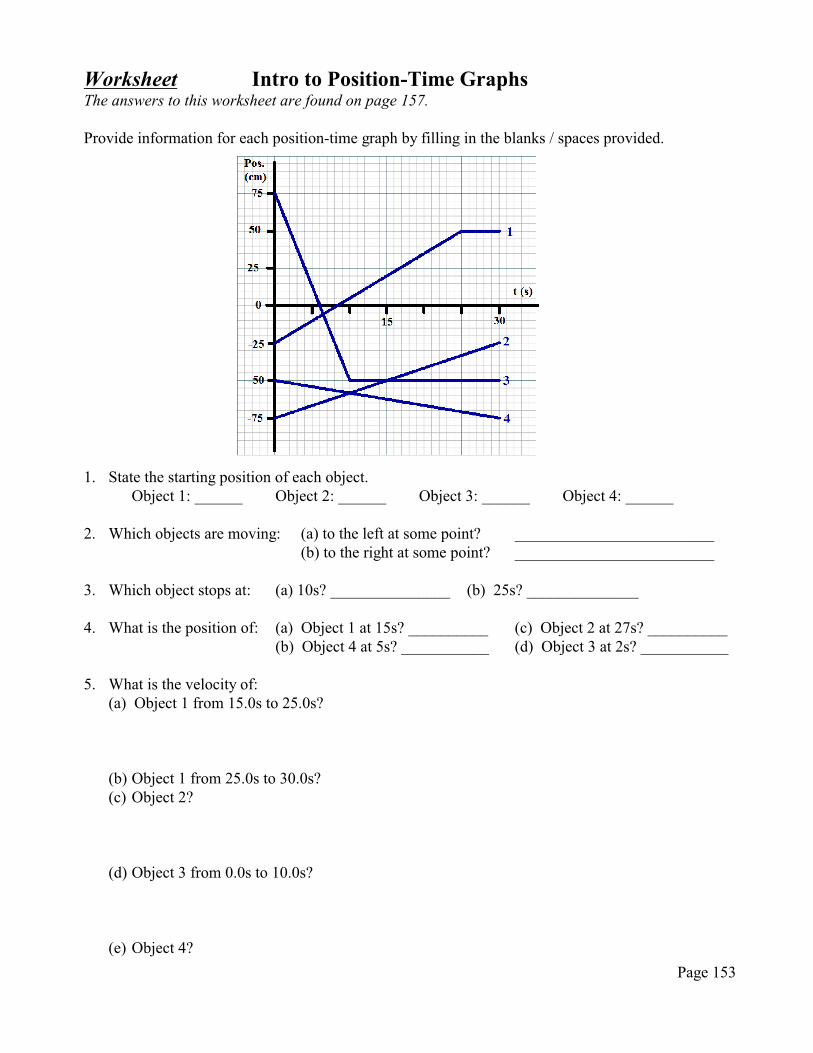
Worksheet Intro to Position-Time GraphsThe answers to this worksheet are found on page 157.
Provide information for each position-time graph by filling in the blanks / spaces provided.
1. State the starting position of each object.Object 1: ______ Object 2: ______ Object 3: ______ Object 4: ______
2. Which objects are moving: (a) to the left at some point? _________________________(b) to the right at some point? _________________________
3. Which object stops at: (a) 10s? _______________ (b) 25s? ______________
4. What is the position of: (a) Object 1 at 15s? __________ (c) Object 2 at 27s? __________(b) Object 4 at 5s? ___________ (d) Object 3 at 2s? ___________
5. What is the velocity of:(a) Object 1 from 15.0s to 25.0s?
(b) Object 1 from 25.0s to 30.0s?(c) Object 2?
(d) Object 3 from 0.0s to 10.0s?
(e) Object 4?
Page 153

Worksheet (continued) The answers to this worksheet are found on page 157.
Provide information for each position-time graph by filling in the blanks / spaces provided.
t(h)
1. State the starting position of each object.Object 1: ______ Object 2: ______ Object 3: ______ Object 4: ______
2. Which objects are moving: (a) to the left at some point? _________________________(b) to the right at some point? _________________________
3. Which object stops at the 1h mark? _________ What is its position at this time? _________
4. What is the position of: (a) Object 1 at 4h? __________ (c) Object 2 at 4h? __________(b) Object 3 at 4h? ___________ (d) Object 4 at 4h? __________
5. What is the velocity of:(a) Object 1?
(b) Object 2?
(c) Object 3 when it is not stopped?
(d) Object 4?
Page 154

Worksheet More Position-Time Graphs for Uniform Motion The answers to this worksheet are found on page 157.
1.
a) What is the position of the object at 10 s?
b) When is the object stopped?
c) Describe the motion of the object.
2. a) What is the starting position of the object?
b) What is the position of the object at 6.0 s?
c) At what time does the object stop moving?
d) What is the velocity of the object at t=2.0s?
e) Describe the motion of the object.
3. a) What is the starting position of the object?
b) What is the position of the object at 3.0 s?
c) What is the velocity of the object at t=1.0s?
d) What is the velocity of the object at t=2.5s?
e) Describe the motion of the object.
Page 155

Worksheet (continued) The answers to this worksheet are found on page 157.
4. a) What is the starting position of the object?
b) For what duration is the object stopped?
c) What is the velocity of the object at t = 8.0 s?
d) Describe the motion of the object.
5. a) What is the velocity of the object at t = 1.0 s?
b) What is the position of the object at 5.0 s?
c) Describe the motion of the object.
6. (a) Draw a position time graph for an object which starts at 4m[left] of the origin. Itmoves to the left until t=5s and reaches 10m[left]. It stops until t=7s. Then itmoves to the right and reaches the position 10m[right] at t=10s.
(b) Calculate the velocity of the object in (a) at:(i) t=3s (ii) t=8s
Page 156
Page 153
Page 156
Page 154
Page 155
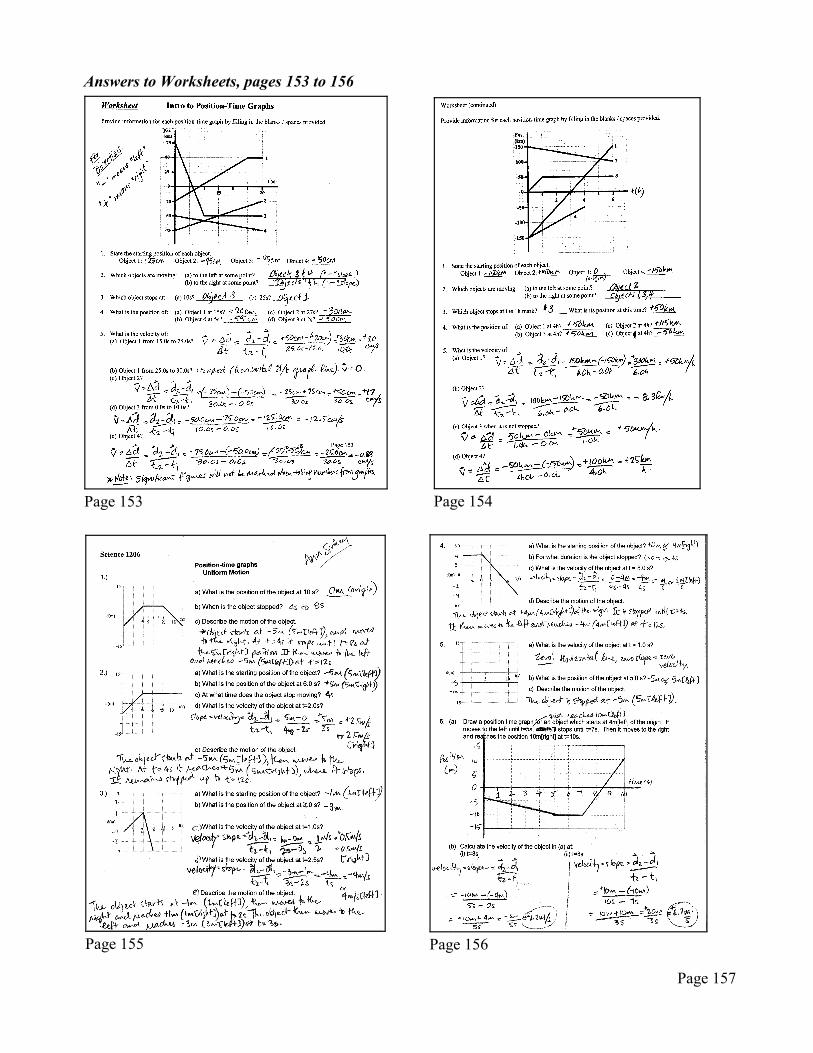
Answers to Worksheets, pages 153 to 156
Page 157

Position-Time Graphs, Continued
For the graph below:
1. What is the position:(a) initially?(b) at t=5.0s?(c) at t=35.0s?
2. What is the velocity at: (a) t=5.0s?(b) t=12.0s?(c) t=30.0s?
Page 158

2. (a) Draw a position time graph for an object which starts at6m[right] of the origin. It moves to the left until t=3s, where ithas reached 1m[right]. The object then stops there until t=6s.Lastly, it moves to the left and reaches the position 8m[left] att=9s.
(b) Calculate the velocity of the object in (a) at:(i) t=2s (ii) t=8s
Looking for more graph problems? Check out:http://tinyurl.com/n2o6lue
Page 159
Velocity-Time Graphs Textbook pages 233 onwards
When given a graph, first read the axes labels. A velocity-time graph is different from a positiontime graph.
Remember: Uniform motion means constant speed or __________________(1). This means that avelocity time graph for an object moving with uniform motion will have ____________________(2)lines, indicating the constant velocity.
Also remember that displacement = velocity@ time. This means that the area between the velocity lineand the time axes gives the ________________________(3) for the object over that time frame.
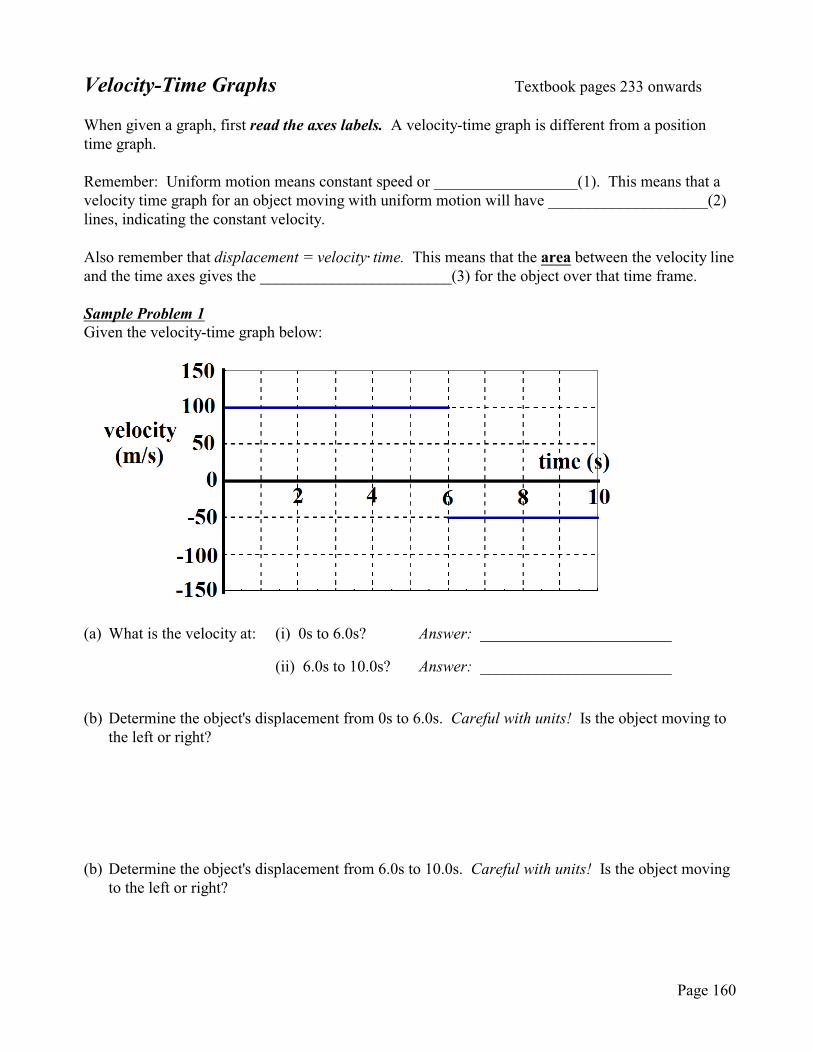
Sample Problem 1Given the velocity-time graph below:
(a) What is the velocity at: (i) 0s to 6.0s? Answer: ________________________
(ii) 6.0s to 10.0s? Answer: ________________________
(b) Determine the object's displacement from 0s to 6.0s. Careful with units! Is the object moving tothe left or right?
(b) Determine the object's displacement from 6.0s to 10.0s. Careful with units! Is the object movingto the left or right?
Page 160
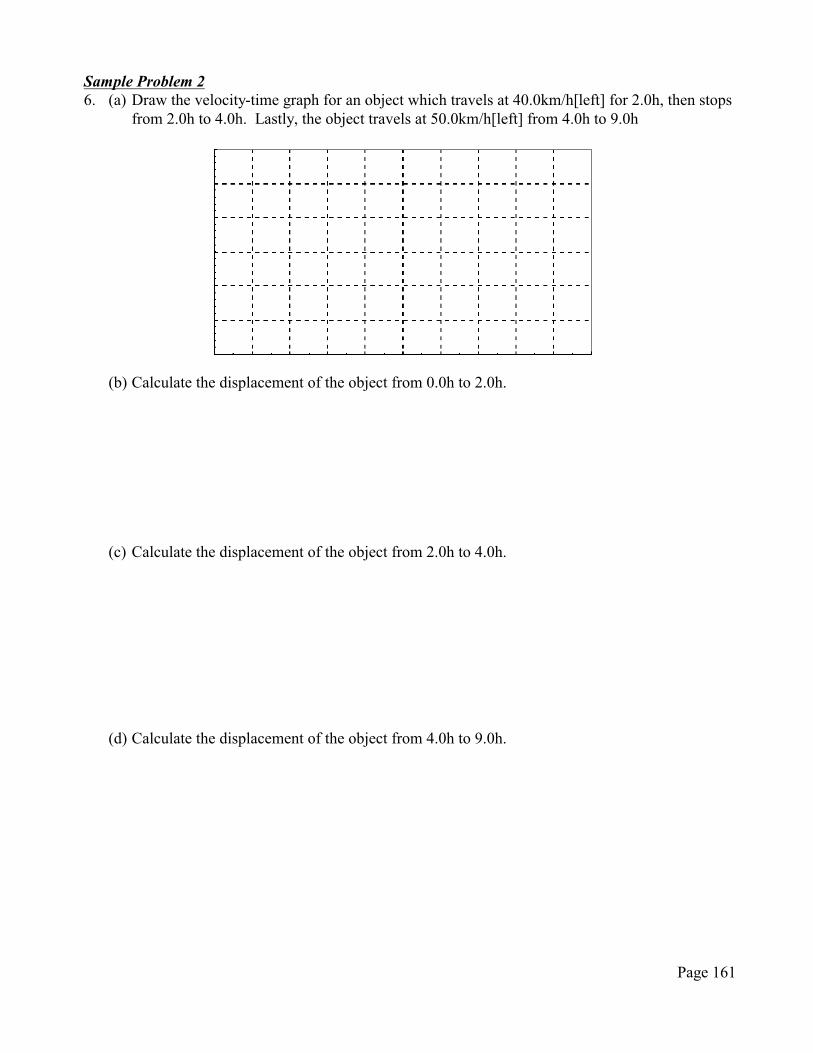
Sample Problem 26. (a) Draw the velocity-time graph for an object which travels at 40.0km/h[left] for 2.0h, then stops
from 2.0h to 4.0h. Lastly, the object travels at 50.0km/h[left] from 4.0h to 9.0h
(b) Calculate the displacement of the object from 0.0h to 2.0h.
(c) Calculate the displacement of the object from 2.0h to 4.0h.
(d) Calculate the displacement of the object from 4.0h to 9.0h.
Page 161

Worksheet Velocity-Time Graphs for Uniform Motion
1.a) What is the velocity of the object at 10 s?
b) Which way is the object going?
2. a) Describe the motion of the object.
b) What is the displacement of the object from 0 to 6.0s?
(Calculate the area of the shaded rectangle...is it moving left or right?)
c) What is the displacement of the object from 6.0s to 12.0s?
3. a) What is the velocity of the object at:
(i) t = 2.0s (ii) t=5.0s
b) Shade the rectangle that represents the displacement
of the object from 0 to 3 s, and from 3 to 6 seconds.
c) Calculate the displacement using each rectangle.
(Careful, what will the unit of measurement be? m? cm? km?)
Page 162

Worksheet, continued
4. a) What is the velocity of the object at t = 2.0 hr?
b) Describe the motion of the object.
c) How far has the object traveled in 6.0 hr?
5. (a) Draw the velocity-time graph for an object which travels at 4.0m/s[N] for 6.0s, then
5.0m/s[S] from 6.0s to 10.0s.
(b) Calculate the displacement of the object from 0.0s to 6.0s.
(c) Calculate the displacement of the object from 6.0s to 10.0s.
6. (a) Draw the velocity-time graph for an object which travels at 110km/h[right] for 1.5h,
then stops from 1.5h to 3h. Lastly, the object travels at 75km/h[left] from 3h to 4h.
(b) Calculate the displacement of the object from 0.0h to 1.5h.
Page 163

page 162 page 163
Answers to Worksheet, page 162 - 163
Page 164
ACCELERATION Textbook pages 232 onward
Acceleration is defined as the change in velocity divided by the change in time. It is a vector.
When an object accelerates, it does not keep a constant velocity. This means that we will not refer to
accelerating objects under the heading of "uniform motion". Accelerating objects have "non-uniform
motion".
Units and Acceleration
Consider: An object accelerates at +2.0 m/s/s. (We read "2.0 metres per second, per second".) This
means that the velocity changes by +2.0 m/s, as each second goes by. Note that the unit "m/s/s" is
awkward. Instead, we write the unit as "m/s2".
Sample Problem
If you start from rest, = 0 m/s, with acceleration of +2.0 m/s2 then my velocity:
after 1.0 second is _________ ... after 2.0 seconds is _________ ... after 3.0 seconds is _________
after 4.0 seconds is ________ ... after 5.0 seconds is _________ ... after 6.0 seconds is _________ .
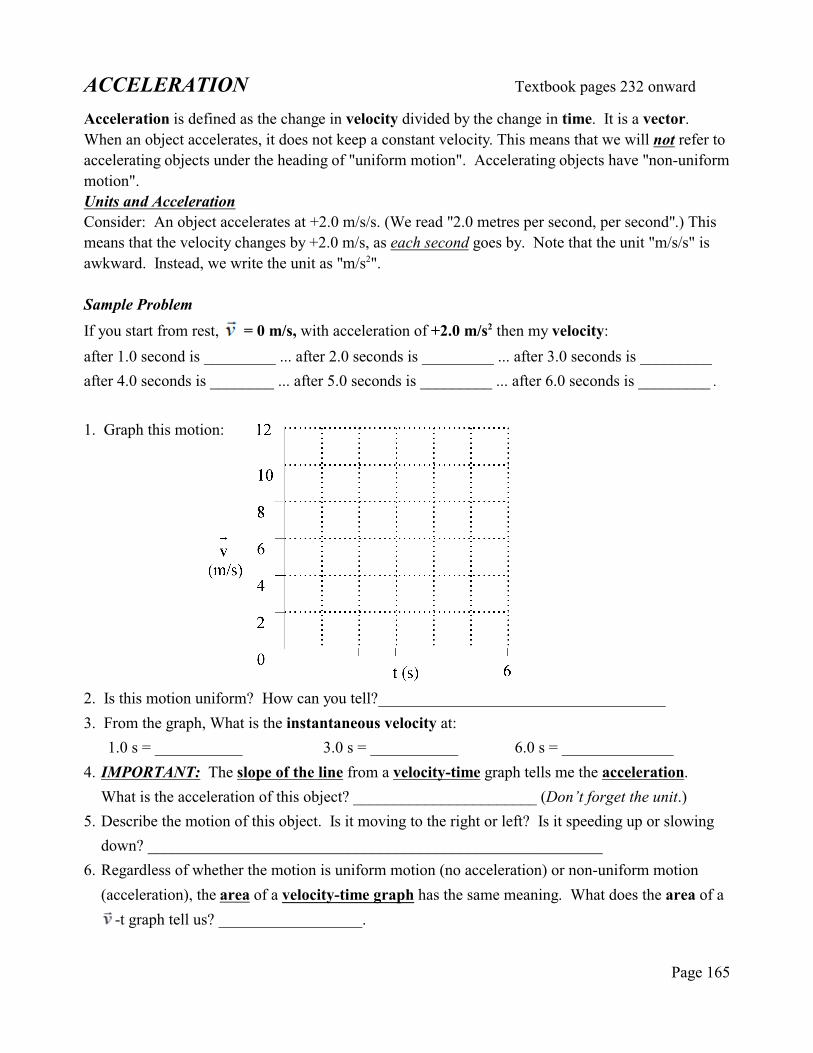
1. Graph this motion:
2. Is this motion uniform? How can you tell?____________________________________
3. From the graph, What is the instantaneous velocity at:
1.0 s = ___________ 3.0 s = ___________ 6.0 s = ______________
4. IMPORTANT: The slope of the line from a velocity-time graph tells me the acceleration.
What is the acceleration of this object? _______________________ (Don’t forget the unit.)
5. Describe the motion of this object. Is it moving to the right or left? Is it speeding up or slowing
down? _________________________________________________________
6. Regardless of whether the motion is uniform motion (no acceleration) or non-uniform motion
(acceleration), the area of a velocity-time graph has the same meaning. What does the area of a
-t graph tell us? __________________.
Page 165

7. Remember, the area under a velocity-time graph tells us the displacement. Calculate thedisplacement under each -t graph. Don’t forget your unit in each case. Remember that the areaof a triangle is determined from the equation ½ x base x height, and in some cases, you may needto break the area under the graph into both a rectangle and a triangle.
Graph A Graph B Graph C
*hint: triangle + rectangle : ____________ : ____________ : ___________
8. The slope of a -t graph means acceleration. What is the acceleration for each of the objects
above? A. = _______ B. = _______ C. = _______
9. The initial velocity is the velocity at time zero (t = 0.0 seconds). You get this from the y-intercept of the -t graph. What is the initial velocity for each of the objects above?
A. = _______ B. = _______ C. = _______
10. Question: How do you know if the object is speeding up or slowing down? Answer: Check to see if the velocity becomes bigger or smaller over time. For each of the graphs above describe its motion. (State "Speeding up" or "slowing down")
A. __________________ B._____________________ C._____________________
11. Question: How do you tell if the object is moving right or left? Answer: The velocity will tell you. Remember:
Positive velocities are positive displacements, to the right, negative velocities are negative displacements, to the left.
Which way is each object moving above? (State: "Moving left" or "Moving right")
A. __________________ B._____________________ C._____________________
Page 166

12. Now we can bring all our knowledge together. Graph the -t graph for the motion given below.
t (s) (m/s)
0 12
1 11
2 10
3 9
4 8
5 7
6 6
(a) What is the acceleration of the object? (Slope) _________ (remember the unit and sign)
(b) What is the displacement of the object from 0-6 seconds? (Area) _____________
(c) What is the initial velocity of the object? (y-intercept) __________________
(d) What is the instantaneous velocity at t = 4.0 seconds? ___________________
(e) Is this object speeding up or slowing down? ____________________
(f) Is this object moving to the right or to the left? __________________
Page 167
Acceleration Calculations Textbook pages 259 to 262.
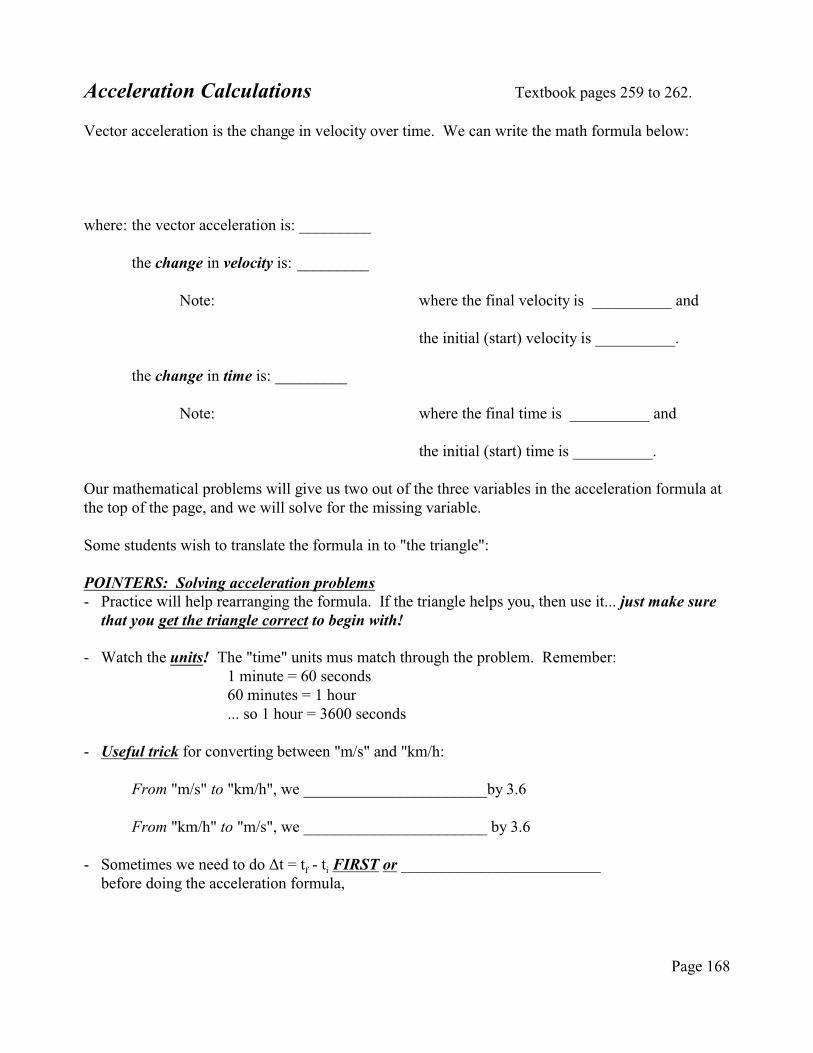
Vector acceleration is the change in velocity over time. We can write the math formula below:
where: the vector acceleration is: _________
the change in velocity is: _________
Note: where the final velocity is __________ and
the initial (start) velocity is __________.
the change in time is: _________
Note: where the final time is __________ and
the initial (start) time is __________.
Our mathematical problems will give us two out of the three variables in the acceleration formula atthe top of the page, and we will solve for the missing variable.
Some students wish to translate the formula in to "the triangle":
POINTERS: Solving acceleration problems- Practice will help rearranging the formula. If the triangle helps you, then use it... just make sure
that you get the triangle correct to begin with!
- Watch the units! The "time" units mus match through the problem. Remember:1 minute = 60 seconds60 minutes = 1 hour... so 1 hour = 3600 seconds
- Useful trick for converting between "m/s" and "km/h:
From "m/s" to "km/h", we _______________________by 3.6
From "km/h" to "m/s", we _______________________ by 3.6
- Sometimes we need to do Ät = tf - ti FIRST or _________________________before doing the acceleration formula,
Page 168
Sample Problem 1A ball is dropped from rest, from a second floor window. If its velocity is 4.9m/s [down] after0.50 seconds, calculate the acceleration due to gravity.
Solved:
Sample Problem 2A cyclist is moving at 6.0m/s and slows to 1.5m/s in a time of 2.0s. What is the cyclist'sacceleration?
Solved:
Page 169

Sample Problem 3A car travelling at 120 km/h comes to a stop in 2.4 seconds. What is the acceleration of the car?
Solved:
Sample Problem 4How long does it take for a car to accelerate from zero to 115km/h at an acceleration of 2.6m/s2?
Solved:
Page 170

Sample Problem 5A rocket has just launched, and has been flying for some time. If it is accelerating at 575m/s2 [up]for a time frame of 1.50s, what is the:
(a) velocity change over this time frame?(b) initial velocity at the start of the time frame, if its velocity at the end of the time frame is
988m/s [up]?
Solved:
Page 171

Additional Acceleration Problems
1. A current Mercedes McLaren Formula 1 race car can accelerate from rest to 300.0km/h in 8.4s. What is the acceleration for the race car?
2. A skydiver is falling at 9.9m/s[down]. He opens his parachute, and in 3.0s, has slowed to1.1m/s[down]. What is the acceleration of the sky diver?
3. A cyclist applies the brakes on her bike, causing her speed to drop from 35.5km/h to 15.5km/h in2.0s. What is the cyclist's acceleration?
Page 172

Worksheet Acceleration(Answers are at the end of the worksheet.)
1. A car has a constant acceleration of 4.0 m/s2[E], starting from rest. How fast is it travelling after3.0 seconds?
2. An object travels with uniform motion at 20.0 m/s for 5.0 s. What is the acceleration? [Think! (]
3. A running football player has a change in velocity of 9.80 m/s [N] in 1.4 s. What is his averageacceleration?
4. An object accelerates at 1.2 m/s2 [N]. How long will it take to reach a velocity of 5.0 m/s [N] ifit is starting from rest?
5. If a car accelerates from 3.0 m/s to 12.0 m/s in 3.0 seconds, what the average acceleration?
Page 173
6. A baseball is travelling 65 km/h [E] and is caught by a player. The ball is brought to rest in0.50 s. What is the acceleration of the ball? (Note the units on this question.)
7. Dexter is travelling on his bike, 4.0 m/s [S]. If he accelerates at a rate of 1.5 m/s2 [S] for2.0 seconds, what is his final velocity?
8. A car increases its speed from 9.6 m/s to 11.2 m/s in 4.0 s. What is the average acceleration ofthe car during this 4.0 s interval?
9. An object accelerates at 2.2 m/s2 for 3.0 s. If the final velocity of the object is 15.0 m/s, what wasthe initial velocity?
Page 174

10. A motorcycle travelling on a straight stretch of highway accelerates at 4.7 m/s2 from a speed of6.0 m/s. How fast would it be travelling after 2.0 s?
11. A car comes up to a construction zone. Calculate the acceleration of the car after the drivergently applies the brakes, changing the speed from 108km/h to 29km/h in 12 seconds.
12. A shark, moving at 7.2km/h accelerates at 4.3 m/s2 to a final speed of 54.0km/h. What is theelapsed time during the acceleration?
Answers:(1.) 12 m/s [E] (2.) 0 m/s2! (3.) 7.0 m/s2 [N] (4.) 4.2 s (5.) 3.0 m/s2 (6.) -36m/s2 [E], or, 36 m/s2 [W] (7.) 7.0m/s [S] (8.) 0.40 m/s2 (9.) 8.4 m/s(10.) 15.4 m/s (11.) -1.8 m/s2 (12.) 3.0 s
Page 175

Position-Time Graphs for Accelerated Motion Textbook pages 247 onward
Determining Instantaneous Velocity using Tangents
When an object undergoes acceleration (non-uniform motion), its position-time graph will be curved.The instantaneous velocity for any "instant" or given time is equal to the slope of the tangent line atthat instant in time.
Sample ProblemFor the graph below, make note of the times t = 0.0, 1.0, 3.0 and 5.0 s:
(a) draw a tangent line for t = 1.0, 3.0 and 5.0 s (Assume that the object is starting from rest.)(b) get the slope of the tangent line (slope of tangent = instantaneous velocity, , at that point in
time)(c) describe the motion of the object.
t(s)
Page 176

Solved(a) Draw tangents.(b) Slopes:
Summary:
t(s) (cm) (cm/s)
0 -50 0
1
3
5
(c) Description of the motion:
Page 177

Practice Problem (Completed detailed answer at the end of the problem.)For the graph below, make note of the times t = 0.0, 1.0, 3.5 and 6.0 s:
- draw a tangent line for t = 1.0, 3.5 and 6.0 s (Assume that the object is starting from rest.)- get the slope of the tangent line (slope of tangent = instantaneous velocity, , at that point in
time)- describe the motion of the object.
t(s)
Page 178

Solved:
Summary:
t(s) (cm) (cm/s)
0 0
1
3.5
6
Page 179

Answer to practice problem, page 178-179:
Page 180

Summary: Graphs for Uniform Motion Compared to Accelerated Motion
For uniform motion:- Objects move at a constant speed or velocity: there is no acceleration.- Position-time graphs are not curved; all segments are straight lines- The slope of the line position-time graph gives the velocity of the object.- Velocity-time graphs have horizontal lines indicating constant velocity and uniform motion.- The area between the velocity-time graph and the time axis indicates the displacement of the
object.
Sample Problem 1Sketch a position-time graph for an object:
(a) starting at the origin and moving with uniform motion to the left(b) starting at the origin and moving with uniform motion to the right(c) stopped to the left of the origin(d) stopped to the right of the origin
Sample Problem 2Sketch a velocity-time graph for an object:
(a) moving with uniform motion to the left (b) moving with uniform motion to the right
(c) stopped to the left of the origin (d) stopped to the right of the origin
Page 181

For accelerated motion- Objects do NOT move at a constant speed or velocity: there is acceleration, as objects are
speeding up or slowing down.- Position-time graphs are curved, and the instantaneous velocity for some point in time can be
found by getting the slope of the tangent line for that point in time.- Velocity-time graphs are sloped for accelerated motion, indicating that objects are speeding up
or slowing down.
Sample Problem 1Sketch a position-time graph and a velocity-time graph for an object:
(a) starting at the origin, moving to the left and moving faster to the left.(b) starting at the origin, moving to the left and moving slower to the left.(c) starting at the origin, moving to the right and speeding up as it moves to the right.(d) starting to the right of the origin, moving to the left and slowing down as it moves to the left.
Strategy for drawing the position-time graph- Put in the start and finish points on your graph first- determine the curve of your graph by "speeding up" (steeper tangents as time goes on) or
"slowing down" (less steep tangents as time goes on).- Draw the line!Strategy for drawing the velocity-time graph- Use the position-time graph as your guide (along with the description in the question)
Page 182
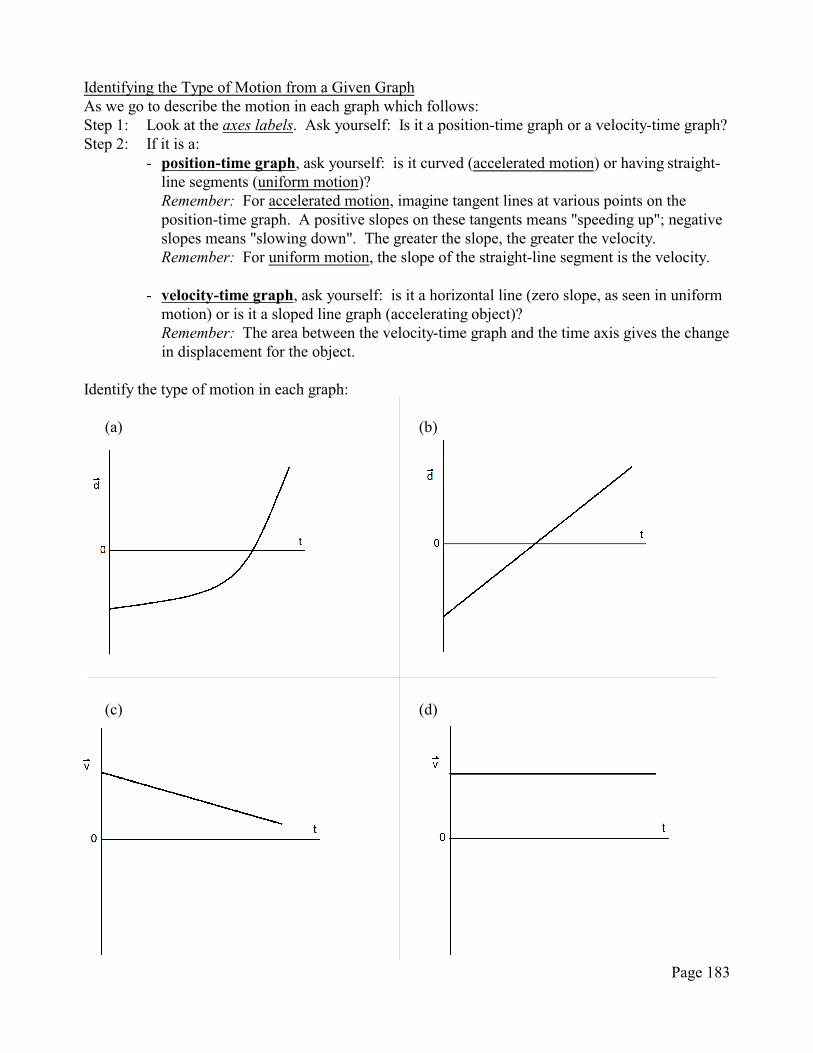
Identifying the Type of Motion from a Given GraphAs we go to describe the motion in each graph which follows:Step 1: Look at the axes labels. Ask yourself: Is it a position-time graph or a velocity-time graph?Step 2: If it is a: - position-time graph, ask yourself: is it curved (accelerated motion) or having straight-
line segments (uniform motion)? Remember: For accelerated motion, imagine tangent lines at various points on the
position-time graph. A positive slopes on these tangents means "speeding up"; negativeslopes means "slowing down". The greater the slope, the greater the velocity.
Remember: For uniform motion, the slope of the straight-line segment is the velocity.
- velocity-time graph, ask yourself: is it a horizontal line (zero slope, as seen in uniformmotion) or is it a sloped line graph (accelerating object)?
Remember: The area between the velocity-time graph and the time axis gives the changein displacement for the object.
Identify the type of motion in each graph:
(a) (b)
(c) (d)
Page 183

For Question 1
For Question 2
Physics Review 2Terms1. position-time graph2. velocity-time graph3. uniform motion
4. acceleration5. tangent
6. instantaneous velocity7. "at rest"
Matching Terms ReviewMatch the above terms to the statements below. Not all terms will be used. No term is used twice.(a) Motion which involves an object is speeding up or slowing down.(b) Motion which involves and object moving at constant velocity.(c) A graph which, for uniform motion, has straight horizontal line segments.(d) A graph which is curved for accelerated motion, such as a cart rolling down a ramp.(e) The velocity of a moving object for a single moment in time; this term is often used when speaking
about the velocity of an accelerating object.(f) Another way of stating that an object is stopped.(g) A line which is drawn at a point in time on a position-time graph for accelerated motion, used to get
the instantaneous velocity for the object at that point in time.
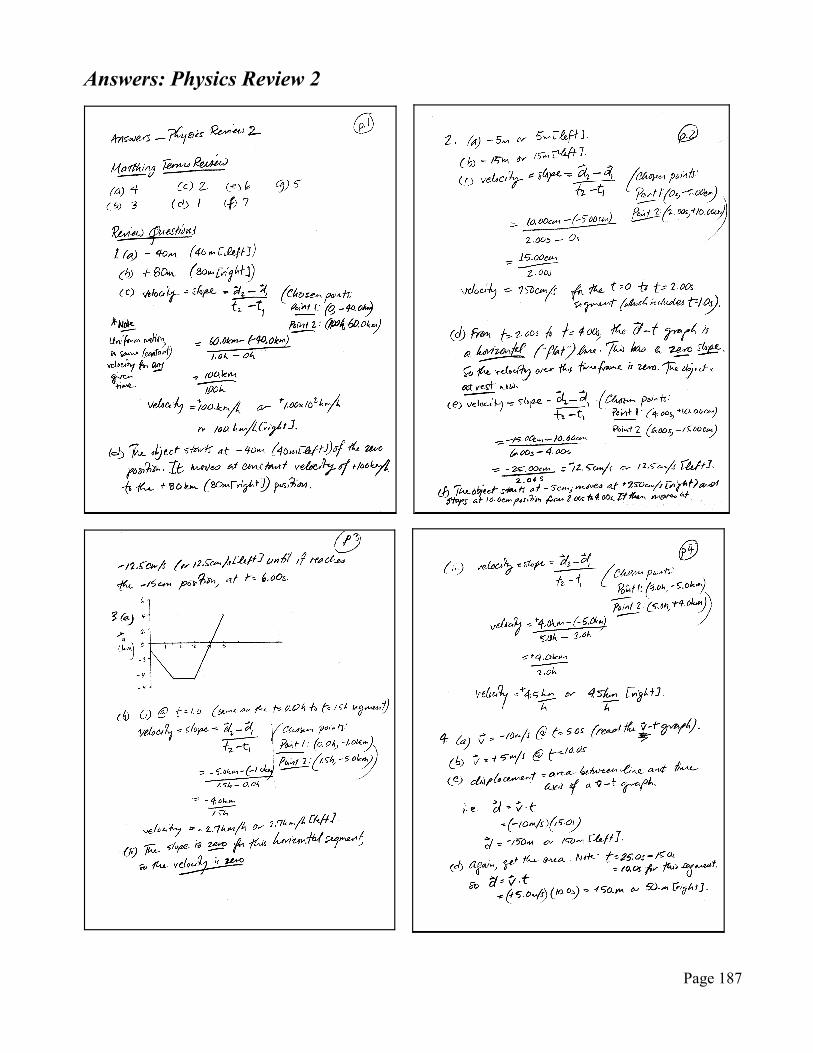
Review Questions1. Use the position-time graph at right for Question 1.
(a) What is the starting position of the object?(b) What is the final position of the object?(c) What is the velocity of the object at t = 0.60 h?(d) Describe the motion of the object.
2. Use the position-time graph at right for Question 2.(a) What is the starting position of the object?(b) What is the final position of the object?(c) What is the velocity of the object at t = 1.0 s?(e) What is the velocity of the object at t = 3.0 s?(f) What is the velocity of the object at t = 5.0 s?(g) Describe the motion of the object.
Page 184
For Question 4
Graph #2 Graph #1
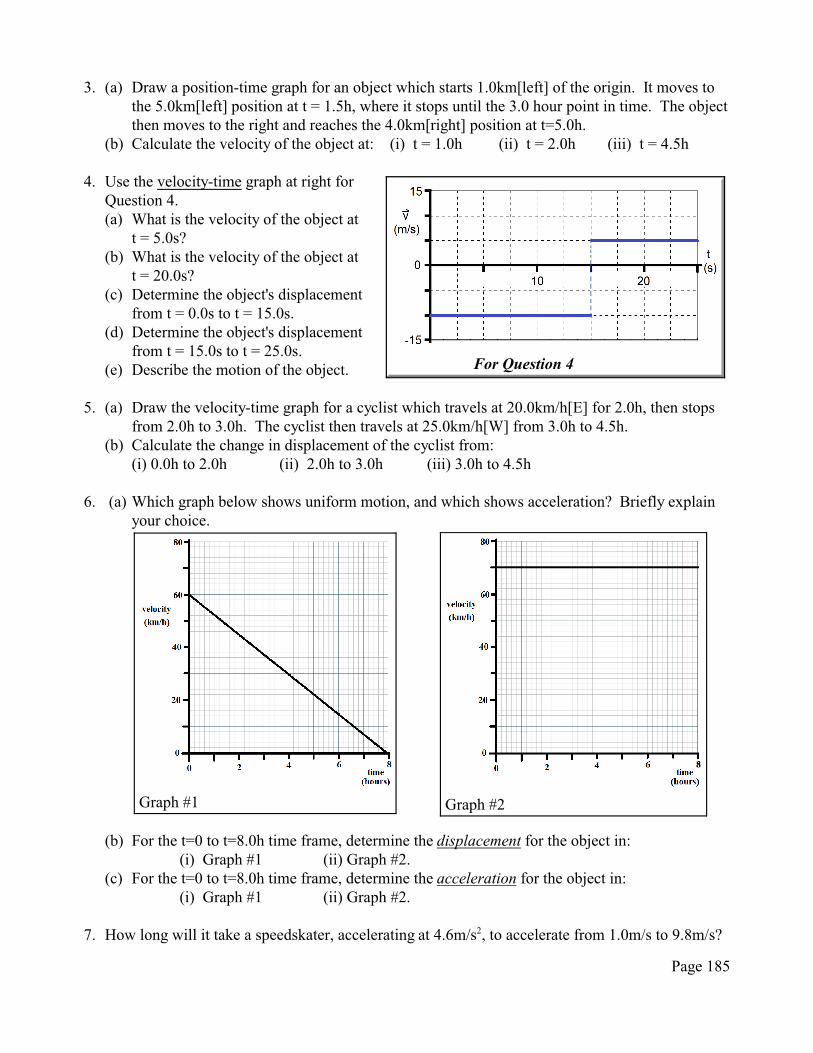
3. (a) Draw a position-time graph for an object which starts 1.0km[left] of the origin. It moves tothe 5.0km[left] position at t = 1.5h, where it stops until the 3.0 hour point in time. The objectthen moves to the right and reaches the 4.0km[right] position at t=5.0h.
(b) Calculate the velocity of the object at: (i) t = 1.0h (ii) t = 2.0h (iii) t = 4.5h
4. Use the velocity-time graph at right forQuestion 4.(a) What is the velocity of the object at
t = 5.0s?(b) What is the velocity of the object at
t = 20.0s?(c) Determine the object's displacement
from t = 0.0s to t = 15.0s.(d) Determine the object's displacement
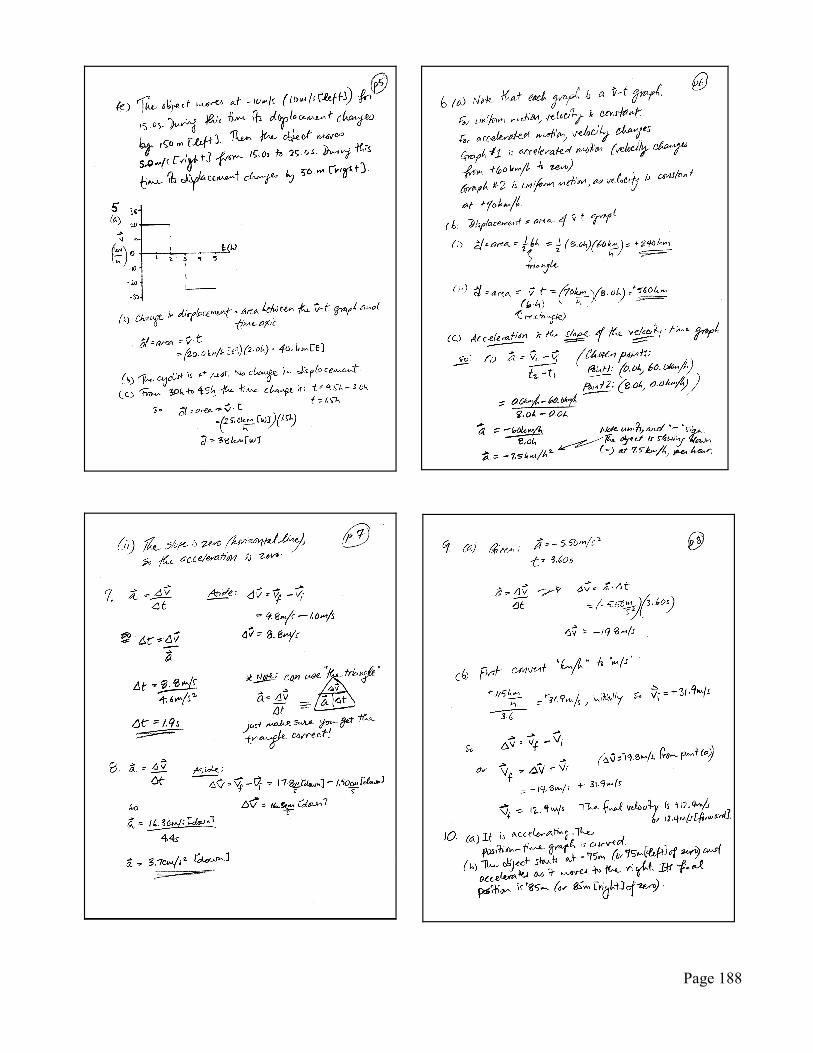
from t = 15.0s to t = 25.0s.(e) Describe the motion of the object.
5. (a) Draw the velocity-time graph for a cyclist which travels at 20.0km/h[E] for 2.0h, then stopsfrom 2.0h to 3.0h. The cyclist then travels at 25.0km/h[W] from 3.0h to 4.5h.
(b) Calculate the change in displacement of the cyclist from:(i) 0.0h to 2.0h (ii) 2.0h to 3.0h (iii) 3.0h to 4.5h
6. (a) Which graph below shows uniform motion, and which shows acceleration? Briefly explainyour choice.
(b) For the t=0 to t=8.0h time frame, determine the displacement for the object in:(i) Graph #1 (ii) Graph #2.
(c) For the t=0 to t=8.0h time frame, determine the acceleration for the object in:(i) Graph #1 (ii) Graph #2.
7. How long will it take a speedskater, accelerating at 4.6m/s2, to accelerate from 1.0m/s to 9.8m/s?
Page 185

For Question 10
8. What is the acceleration of a ball rolling down a long ramp if its velocity changes from1.50cm/s [down] to 17.8cm/s [down] in 4.4 seconds?
9. (a) A car has a constant acceleration of -5.50m/s2 for 3.60s. What is the car's change in velocity?(b) If the car was initially moving at a velocity of 115km/h[forward] (i.e."+115km/h"), what was
the final velocity of the car? (Careful with the units here.)
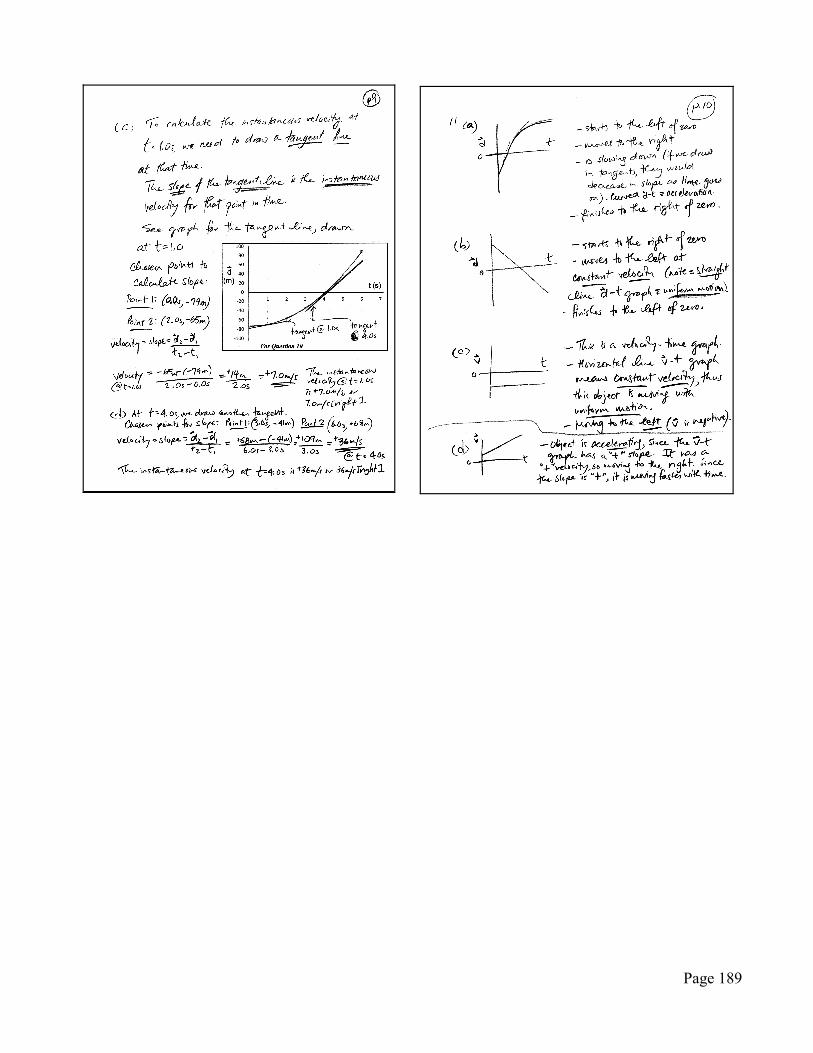
10. Refer to the position-time graph below to answer the questions which follow.(a) Is the object moving with uniform motion or is it accelerating?(b) Describe the motion of the object, referring to its starting and final position, and whether it is
moving to the left or right of the reference point.(c) Calculate the instantaneous velocity of the object at t=1.0s.(d) Calculate the instantaneous velocity of the object at t=4.0s
11. For each graph: - identify the starting position of the object (for a position-time graph only);- state whether the object is moving to the left or right;- state where the object is moving with uniform motion (constant speed) or
speeding up/slowing down.
(a) (b) (c) (d)
(Note: position-time) (Note: position-time) (Note: velocity-time) (Note: velocity-time)
Page 186
Answers: Physics Review 2
Page 187
Page 188
Page 189


