65
Unit 8 Human Population 8A – Trends & Predictions 8B – People Paradox 8C – Land Use & Urbanization 8D – Health & Hazards Chapters 8, 9 and 10

Unit 8Human Population
8A – Trends & Predictions
8B – People Paradox
8C – Land Use & Urbanization
8D – Health & Hazards
Chapters 8, 9 and 10

Unit 8 Vocabulary Terms – 28 terms Affluent society Heat island Risk assessment
Bioaccumulation Industrial revolution Rural area
Biomagnification Infant mortality Sprawl
Carcinogen Infectious disease Technology
Demography Infrastructure Toxicology
Demographic transition model
Land cover Urban area
Dosage response relationship
Land use Urbanization
Emerging disease Life expectancy Wealth gap
Growth rate Pathogen
Hazard Pollution

Unit 8A – Human PopulationTrends & Predictions
Chapter 8.1 & 8.2Central Case – Page 227 China’s One-Child Policy
Read the case and do a Decision-Making Model analysis. First, identify the problem, and then propose a solution. Obviously, the problem is that China is overpopulated. The solution is the One-Child Policy.
Now analyze this solution according to our template (Pros, Cons, Short Term consequences, Long Term consequences) and then come to your decision related to the solution.
Remember to have at least 3 items under each heading…..i.e., 3 Pros, 3 Cons, …..

8A - Trends & Predictions (standards)Trace the path of human population growth from the hunter-gatherer of 10,000 years ago to today
Explain how life changed through the development of agriculture and industrialization
List and explain the factors that demographers use to describe the human population
List examples as to why the world population continues to grow though growth rate has decreased
Compare population growth rates between different regions & explain how social factors affect growth & resource use
Utilize the demographic transition model to explain the drop in birth and death rates
Human Population Growth
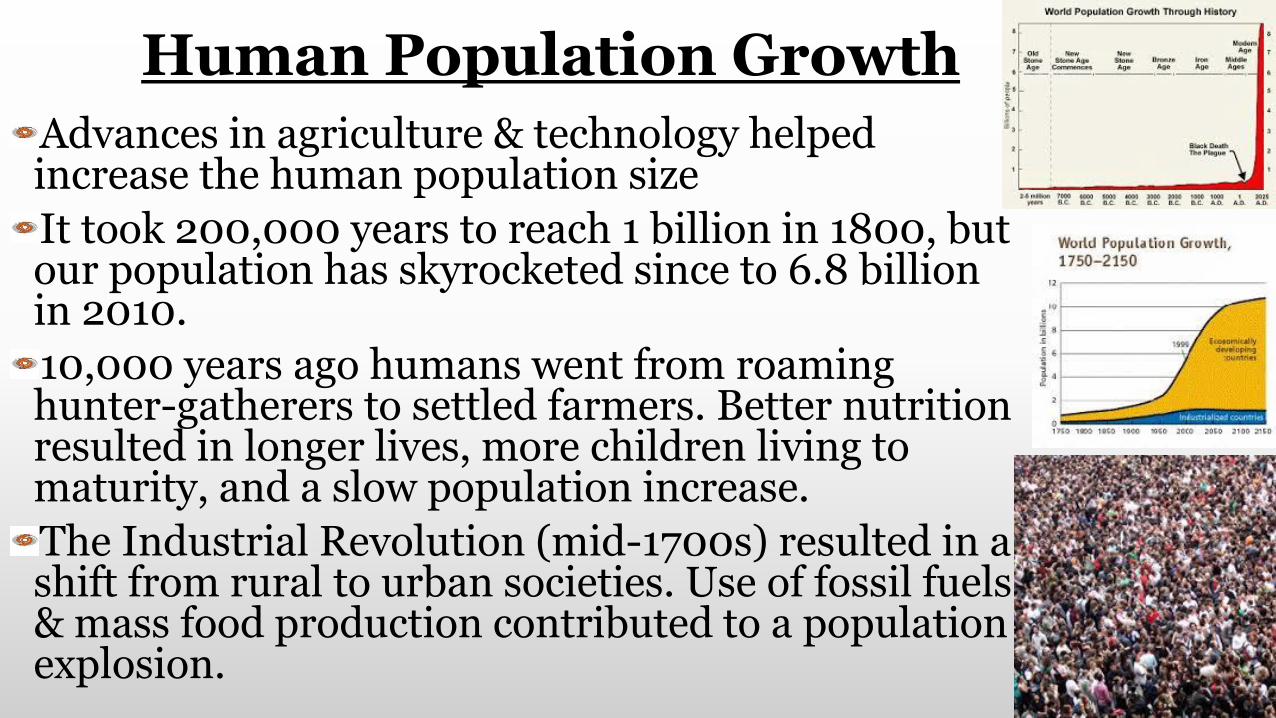
Advances in agriculture & technology helped increase the human population size
It took 200,000 years to reach 1 billion in 1800, but our population has skyrocketed since to 6.8 billion in 2010.
10,000 years ago humans went from roaming hunter-gatherers to settled farmers. Better nutrition resulted in longer lives, more children living to maturity, and a slow population increase.
The Industrial Revolution (mid-1700s) resulted in a shift from rural to urban societies. Use of fossil fuels & mass food production contributed to a population explosion.

Industrial RevolutionSanitation – Louis Pasteur – germ theory of disease; living conditions in the cities improved; better medical practices, soap, cotton clothes all decreased disease
Medical technology – mass production of medical instruments, medicines (antibiotics, vaccines) helped prevent/reduce severity of viral & bacterial infections
Agriculture – invention of large fossil-fueled machines made it possible to plant & harvest food in mass quantities; pesticides reduced competition from weeds and killed insects; grew more food from same soil.
Results: more food, fewer deaths
Recent trends in human population growth
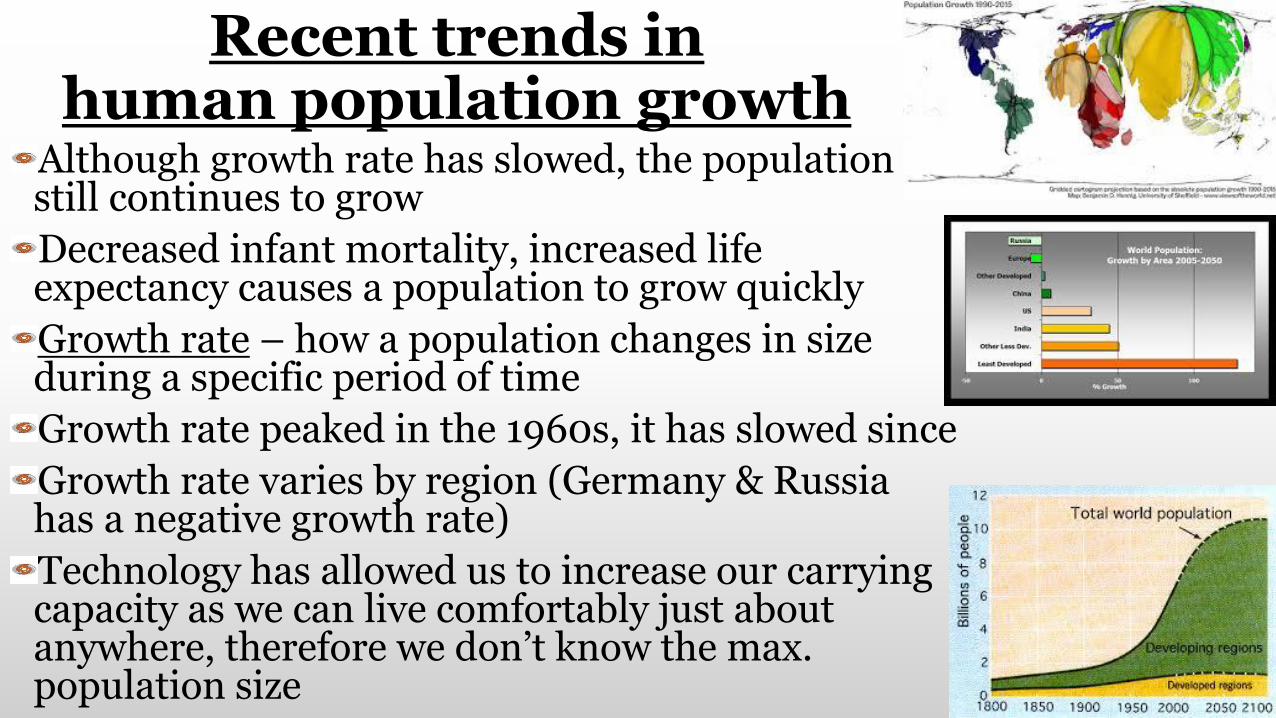
Although growth rate has slowed, the population still continues to grow
Decreased infant mortality, increased life expectancy causes a population to grow quickly
Growth rate – how a population changes in size during a specific period of time
Growth rate peaked in the 1960s, it has slowed since
Growth rate varies by region (Germany & Russia has a negative growth rate)
Technology has allowed us to increase our carrying capacity as we can live comfortably just about anywhere, therefore we don’t know the max. population size

Real Data ChartPopulation Growth Rate of Selected Nations
and World, 2008The table on page 230 and worksheet provided shows 2008 estimates of growth rates and population sizes for several nations and the world.
Answer the following questions on the back of your worksheet:
1. Which nation is growing the fastest? Explain your answer.
2. What is happening to Hungary’s population size?
3. Which nation will likely add the most people to the world over the course of a year?
4. In 1970, China’s population growth rate was 2.8%. Do you think China’s population control policies have been effective? Why or Why not?
Complete the Real Data worksheet given to your group for a grade.

Describing the Human Population
Demography – the study of human population statistics
Demographers apply the principles of population ecology to humans (size, pop. density, distribution) to help predict changes and environmental impact
Population size: roughly 6.8 billion
Population density – how many people live/sq. mile
Population density is highest in temperate & tropical climates (China, Europe, Mexico, India) and lowest in extreme climates (desert/tundra). More people live by seacoasts & rivers; denser in urban v.s. rural
Fertility rates

Population DistributionHuman population is clumped v.s. random or uniform
This uneven distribution means some areas bear more of an environmental impact than others (Yellow River in China, Mississippi River in U.S. are polluted)
Environment is harmed when humans live in areas that cannot support them (deserts by development that takes water supplies, grasslands are overfarmed)
Population size, density and distribution gives demographers a “picture” of what the human population looks like in a particular moment in time
Answer the following questions (8.1) for a grade:1. Describe the main factors that led to a boom in the human
population size in the last 300 years.2. Population A contains 450,000 people and has a 3.3% annual
growth rate. Population B has 900,000 people and a 1.8 % annual growth rate. Which population would increase by more people in one year? Explain.
3. Describe the relationship between population density and population distribution.
4. As people become more concentrated in cities, some pressure on ecosystems in areas that are now less populated eases. Why do you think this is the case?
5. Use the internet to research population growth rates in Florida over the last 30 years. Summarize this data on recent trends in population growth with an illustration or poster.
6. Preview Chp. 8.2 for tomorrow!!!!!

8.2 Predicting Population GrowthScientists predict the world human population, with moderate growth, to be 9 billion by 2050.
Births add, Deaths remove; immigration & emigra-tion affect population size of particular regions
Fertility rate – average # of children a female member of a population has during her lifetime
Factors: childhood survivorship, help with farmwork, parents need children to support them as they age
Recently total fertility rates have started to drop
Replacement fertility – total fertility rate for a nation that would keep its population size stable; in many nations the replacement fertility is about 2.1

Age Structure and Sex RatiosThese define a population’s potential for growth
Age structure – the relative #s of organisms of each age within a population, use age structure diagram
Shows the proportion of individuals currently of reproductive age and those who could reproduce in the future
Helps demographers predict size change over time
Sex ratios - # of males compared to females
At birth, naturally occurring sex ratio of humans has slightly more males (100 females, 106 males born) because males are slightly more likely to die in any given year of life. Human activity can skew this (males emigrating for work, cultural favoritisms)
Quick Lab page 237
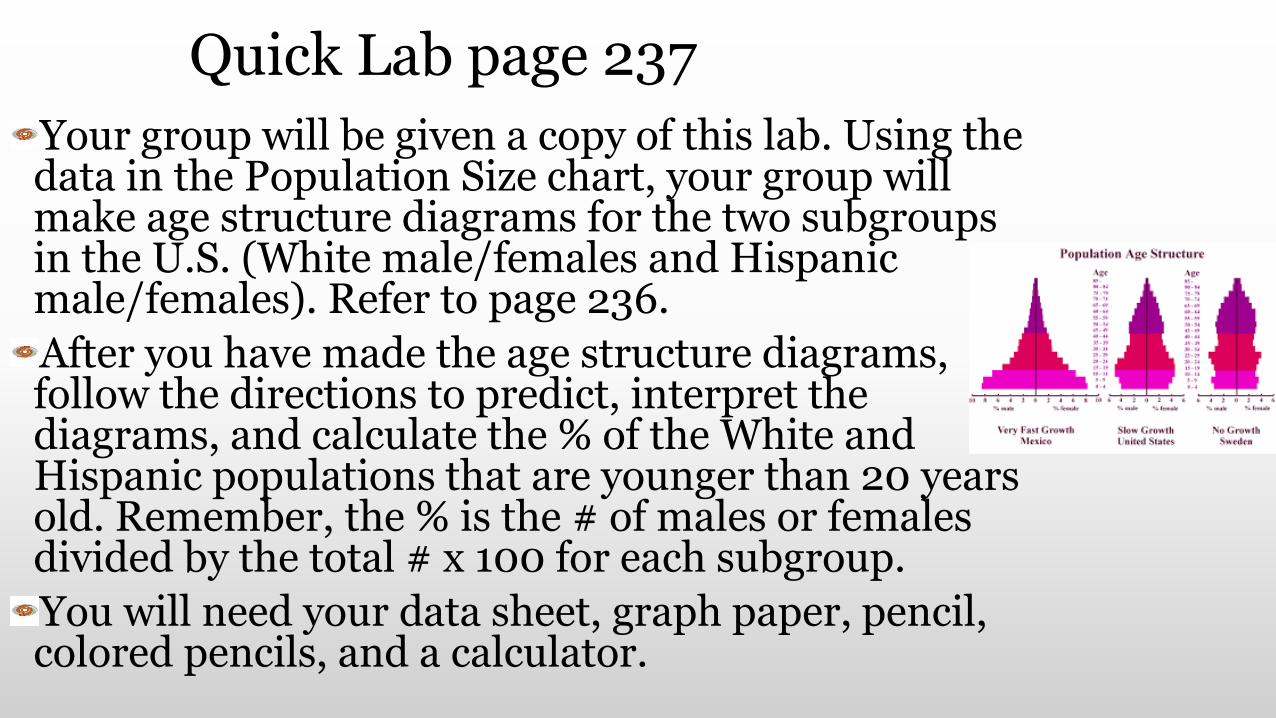
Your group will be given a copy of this lab. Using the data in the Population Size chart, your group will make age structure diagrams for the two subgroups in the U.S. (White male/females and Hispanic male/females). Refer to page 236.
After you have made the age structure diagrams, follow the directions to predict, interpret the diagrams, and calculate the % of the White and Hispanic populations that are younger than 20 years old. Remember, the % is the # of males or females divided by the total # x 100 for each subgroup.
You will need your data sheet, graph paper, pencil, colored pencils, and a calculator.
Demographic Transition
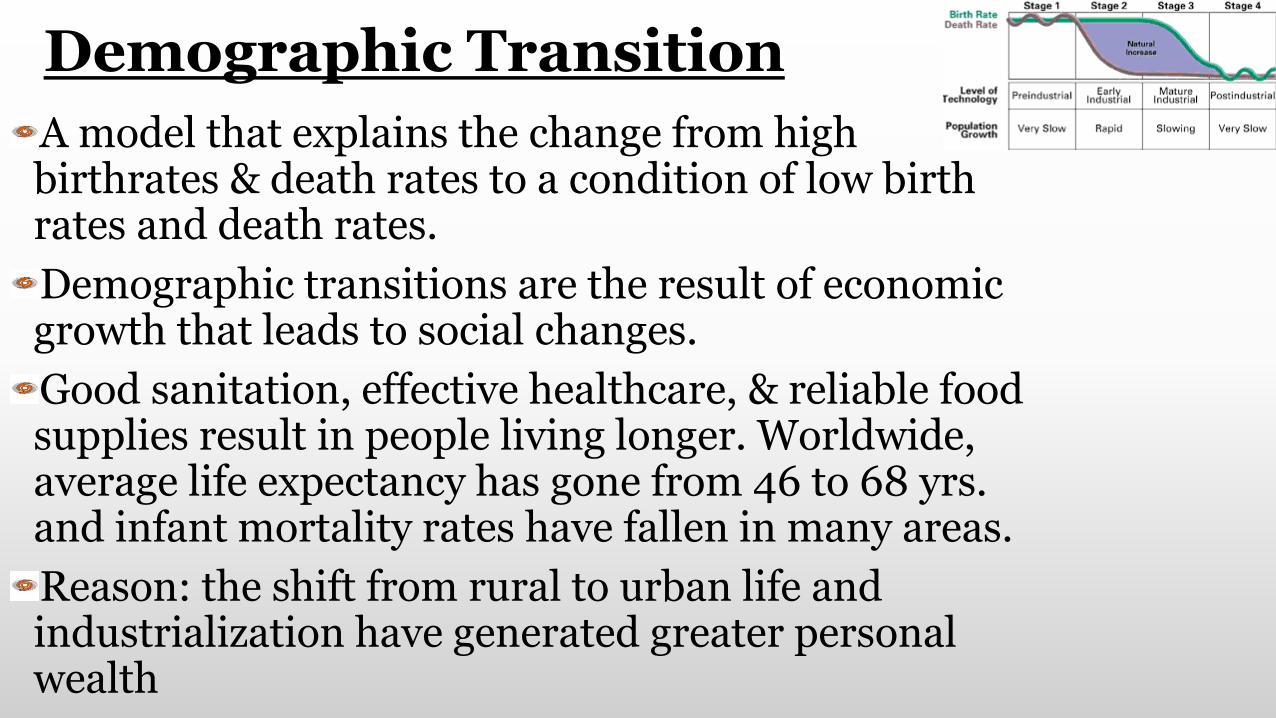
A model that explains the change from high birthrates & death rates to a condition of low birth rates and death rates.
Demographic transitions are the result of economic growth that leads to social changes.
Good sanitation, effective healthcare, & reliable food supplies result in people living longer. Worldwide, average life expectancy has gone from 46 to 68 yrs. and infant mortality rates have fallen in many areas.
Reason: the shift from rural to urban life and industrialization have generated greater personal wealth

4 Stages of Demographic TransitionPre-Industrial Stage – death & birth rates are high. Widespread disease, poor medical care, unreliable food & water sources, larger families wanted.
Transitional Stage – death rates decline as food & medical care improves. Birthrates remain high. Population increases because birth rates exceed death.
Industrial Stage – job opportunities increase, esp. for women. Birth rates decline, closing gap with death rates. Rate of population growth falls.
Post-Industrial Stage – birthrates & death rates fall to low & stable levels. Society enjoys the benefits of industrialization without runaway population growth.

Social Factors that Affect Pop. GrowthWealth & education affect growth and resource use
Developing nations tend to have higher fertility rates, infant mortality rates & death rates. Crowded conditions, poor sanitation, poor nutrition, & increased disease. High population growth presents challenges. Many have developed national policies to slow the growth rate. Better educational opportunities for women is tied to declining fertility rates. Over 2/3rds of the world’s people cannot read and 60% of those living in poverty are women.
Developed nations are high-income nations. Wealth & rate of resource consumption is unevenly distributed around the globe. Ex. 1 American has as much environmental impact as 5 Chinese or 13 Pakistanis.

8.2 packet
Individually complete this packet.
The due date is __Wed. Jan. 28___

8B – People Paradox (Chp. 8.3) standardsDescribe why affluent societies tend to have the most impact on the environment
Discuss how governments can be overwhelmed by population growth in poor societies
List examples of how land overuse and excessive land clearing are spin-offs of meeting a poor society’s survival needs
Explain how the gap in the wealth gap both in the world and within societies causes an unequal distribution of the world’s resources
Describe how the development of nations affects ecosystems and the human quality of life
Describe the pros & cons of technology as related to both our environmental impact and its reduction.
List examples of technologies & their specific impacts in Florida

Impacts of PopulationThe industrial revolution changed how people live, but it also caused increasing resource consumption & pollution
Ecological footprint – amount of land needed to provide a person with the resources they consume and to handle their waste
Affluent societies – with more $, humans consume more food & produce more waste and use more energy; lower pop. growth rate but larger ecological footprint
Poor societies – higher pop. growth rate but smaller ecological footprint; overwhelmed governments, land overuse, deforestation, flooding, emerging diseases

The Wealth GapThe stark contrast between affluent & poor societies is the cause of social and environmental stress
Wealth gap – difference in assets and income between individuals in a society, or between nations
About 1.4 billion people in developing nations live below the international defined poverty line
The richest 1/5th of the world’s people use 86% of the world’s resources, many imported from developing nations, leaving only 14% of the global resources (energy, food, water) for 4/5th of the world’s people
China’s economic growth resulted in poorer farmland eroding, rivers drying up, air pollution, congestion

Impacts of TechnologyTechnology can have both positive & negative impacts
Technology allowed exponential growth of human population, helped to fight diseases, increased life expectancy, provided more comfortable lives, ….
Negative impacts: exploitation of resources (soil, minerals, fossil fuels, forests, oceans), pollution, loss of biodiversity, mining, climate change.
Positive impacts: development of less harmful technologies (recycle, repurpose), cheaper & cleaner renewable energy
More recent technologies focus on lessening our impact on the environment
8.3 review
1. Explain the relationship between wealth and poverty, and its impact on the environment.
2. How has technology had both a negative and positive impact on the environment?
3. As developed nations implement ways that reduce their effect on the environment, do you think this will affect quality of life throughout the world? Explain.

8C – Land Use & Urbanization Chp. 10 (standards)
Describe the different types of land cover and explain how it can affect how the land is used.
Compare & contrast rural & urban living. Why did people move to the cities?
Explain why transportation is essential to the development & growth of the urban environment.
Identify patterns of sprawl & describe how they impact metropolitan areas and the environment around them.
Describe the environmental impacts of urbanization, both positive and negative.
Explain how sprawl affects transportation, pollution, public health & the economics of an area. Use examples from Florida.

Central Case – Growing Pains in Portland, Oregon
Chp. 10, page 291, plus worksheet
Read the case and complete a Decision-Making Model on this case
What is the problem? What is your proposed solution?
At least 3 Pros, 3 Cons, 3 Short-term Consequences, 3 Long-term Consequences
Then, what is your conclusion regarding your proposed solution after analyzing it?
Land Cover & Land Use –10.1
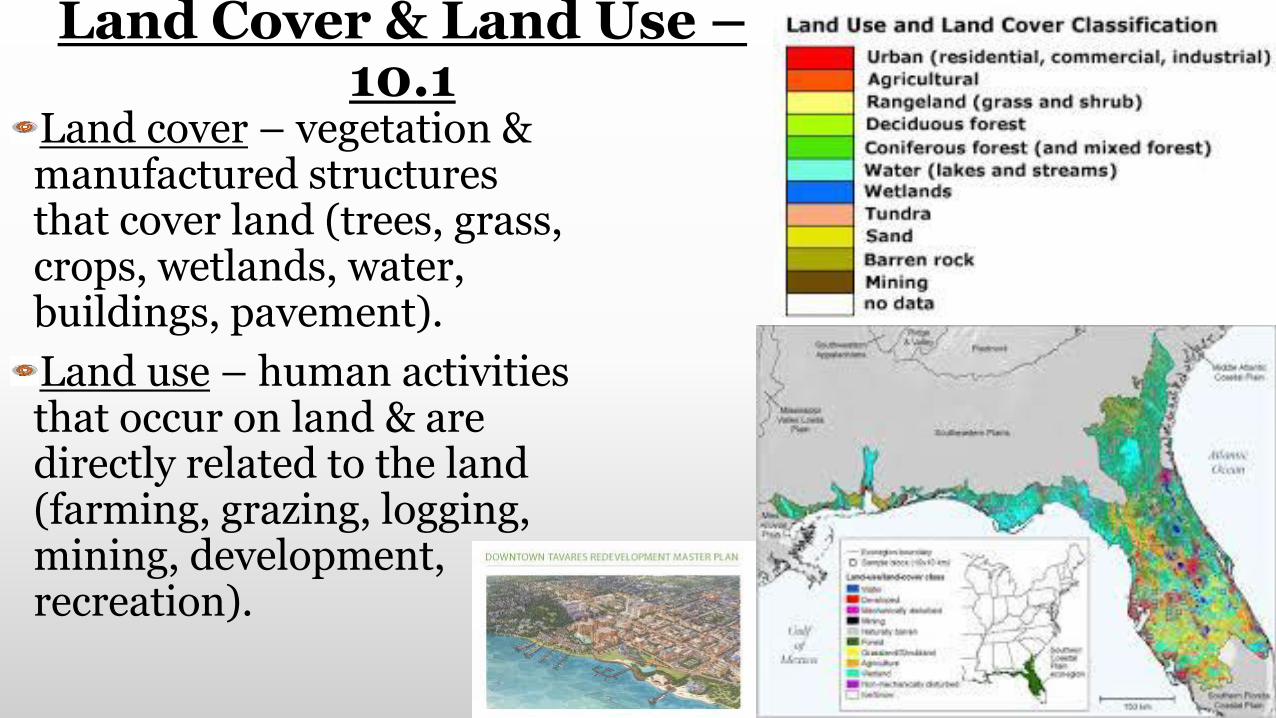
Land cover – vegetation & manufactured structures that cover land (trees, grass, crops, wetlands, water, buildings, pavement).
Land use – human activities that occur on land & are directly related to the land (farming, grazing, logging, mining, development, recreation).

Land Cover
• Land cover of an area changes as people settle there and begin to use the land
• Vast grassland of N. America have been replaced by rangeland and cropland
• Deciduous forests of the NE are mostly replaced by cities and industrial areas
• Scientists cover the economic impact of land cover change & its effects on water
• Urban area – mostly developed land covered mainly with buildings & roads that has a human population of 2500 or more.

UrbanizationUrbanization occurs when people move out of rural areas toward areas with more/better jobs.
Tokyo, Japan’s urban area is over 36 million
Most people live in smaller urban areas/cities
Since 1950, the world’s urban population has more than quadrupled, and the United Nations predicts it will double again by 2050.
Urbanization – the shift of people from rural to urban areas
The industrial revolution resulted in farms producing surplus food, allowing many to stop farming as well as creating jobs in cities
U.S. urban population is about 80%, with 50% of the population living in suburbs.

Transportation & UrbanizationLocation is essential to the growth of an urban area
Moderate climate, central geography, and ease of transportation all help a city grow
Most major cities grew near a large body of water, railroad or highway on which goods & people could travel to and from it.
Chicago’s location on waterways & transport routes and its location between the West’s natural resources and the East’s industrial centers were all factors in it becoming a large, prosperous city.
Florida’s first major cities were all on the coast, and Orlando grew by I4 and Fl. Turnpike.

Urban Environmental ImpactsCities have both negative & positive impacts
The type of impact depends on how we use resources, produce goods, transport materials, and deal with wastes.
Urban areas export wastes passively through pollution, or actively through trade (pay another to take their garbage).
Not all waste and pollution leave the citySmog & acid precipitationNoise pollutionLight pollution
Pollution & its health threats are not shared equally among urban residents, with the poor typically living in more polluted areas as they cannot afford to live in a cleaner area
1. Heat Islands
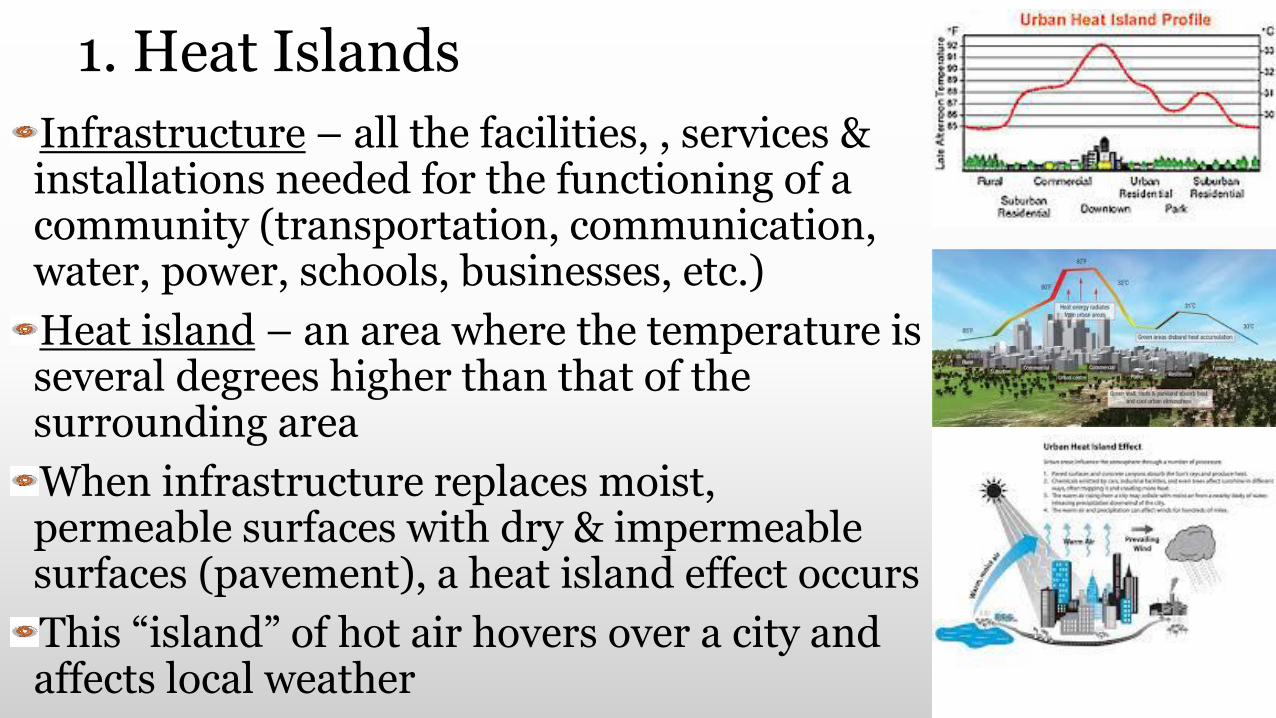
Infrastructure – all the facilities, , services & installations needed for the functioning of a community (transportation, communication, water, power, schools, businesses, etc.)
Heat island – an area where the temperature is several degrees higher than that of the surrounding area
When infrastructure replaces moist, permeable surfaces with dry & impermeable surfaces (pavement), a heat island effect occurs
This “island” of hot air hovers over a city and affects local weather

2. Imported Resources
Cities have to import nearly all resources from areas outside the city
Urban areas rely on rural areas to supply resources such as food, water, building materials, fuels, etc. as well as land to provide ecosystem resources such as purification of water & air, matter cycling and waste treatment
Long-distance transport of resources to and from urban areas requires lots of fossil fuel.
A world without cities would probably require more fossil fuels to allow people the same access to resources over scattered locations.
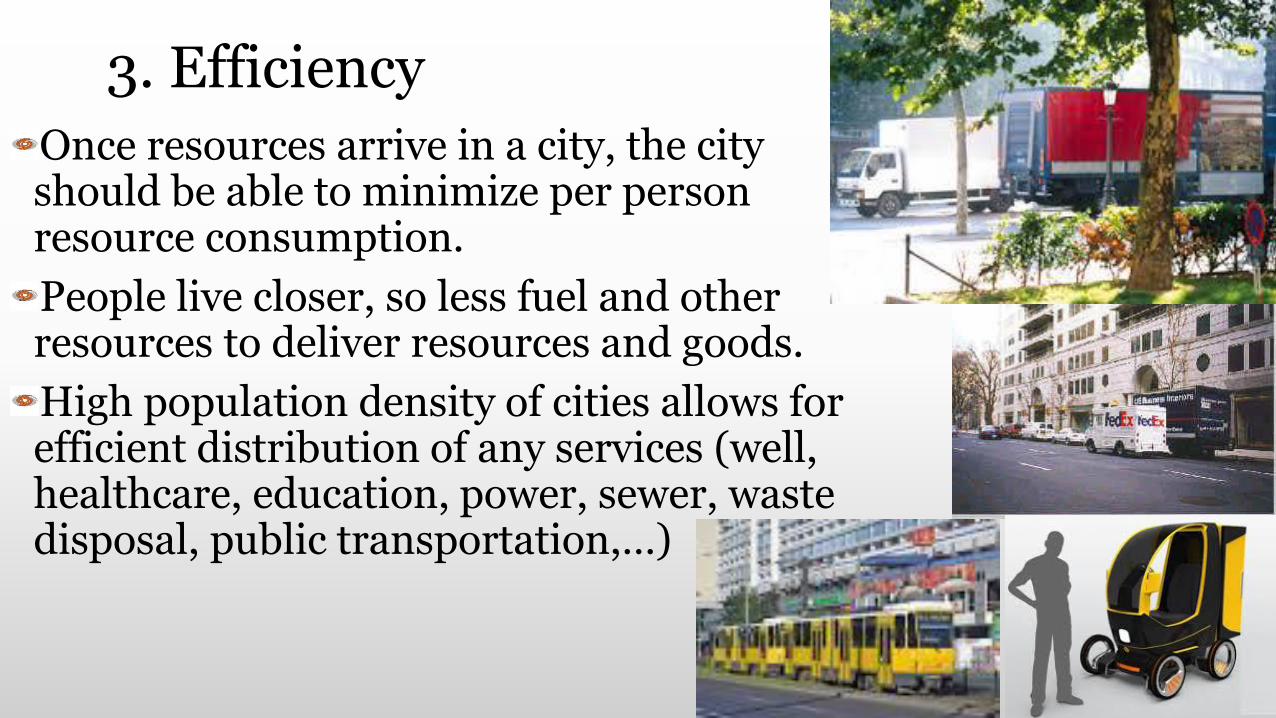
3. Efficiency
Once resources arrive in a city, the city should be able to minimize per person resource consumption.
People live closer, so less fuel and other resources to deliver resources and goods.
High population density of cities allows for efficient distribution of any services (well, healthcare, education, power, sewer, waste disposal, public transportation,…)

4. Ecological FootprintsBecause cities get most of their resources from far away, their ecological footprints are greater than their actual land areas/size.
Wealth & resource consumption are related, so urban & suburban residents tend to be wealthier resulting in a larger ecological footprint for them
Positive: usually have universities & research centers, diverse residents (urban culture) is stimulating & innovative & possibly lead to ideas of how to reduce the negative impacts, and wealthy & educated urban residents buy more organic foods & goods which result in less negative impacts
Densely populated cities leave more land outside cities left undeveloped (natural ecosystems)

Chp. 10.1 Review
Real Data activity, page 302. Answer the 4 questions based on the Population Density v.s. Carbon Emissions Real Data chart
Chp. 10 Urbanization packet

Sprawl – 10.2
Sprawl – the spread of low-density urban or suburban development outward from an urban area
As people move from cities to suburbs, population growth & increased land consumption per capita contribute to sprawl
Natural areas and farms have disappeared as they have been cleared for housing developments & roads
In some cases, expanding rings of suburbs surrounding cities have grown larger than the cities
Megalopolis – several large cities that sprawl together (Tampa/St. Petersburg, Boston/New York City

Contributions to SprawlTwo primary factors contribute to sprawl:
1. Population growth
2. Increased per capita land consumption
The degree of sprawl is a function of the increase in population of an area multiplied by the amount of land the average person lives on
Los Angeles is the nation’s most densely populated urban area v.s. Detroit where sprawl was caused solely by land consumption
Most people prefer more space and privacy and dislike congestion, plus highways & technology have freed businesses from centralized infrastructure a city provides.

Patterns of SprawlUncentered Commercial strip Development –businesses are arranged in a long strip along a roadway with no central community
Low-density single-use residential development –homes are located on large lots in residential areas far from businesses
Scattered Development – residential developments are built far from a city center and are not integrated with one another
Sparse Street Network – roads are far enough apart that areas remain undeveloped but not far enough apart for these areas to function as natural areas

Impacts of SprawlPoliticians assume all growth is good as it attracts business, industry & residents leading to economic well-being, political power & cultural influence.
1. Transportation – limited options, lack of mass transit on outskirts leads to driving cars, traffic accidents and greater use of fossil fuels
2. Pollution – CO2 emissions from vehicles contribute to air pollution & global climate change, motor oil & salts pollute waterways
3. Public health – air pollution, physical inactivity, obesity, high BP, increased suicides
4. Land Use – more buildings & roads, less forests, fields, farmlands, wildlife habitats, recreation. Sprawl degrades/destroys these areas resulting in increased taxes to build facilities to replace these lost services

Impacts of Sprawl, continued5. Zoning – the practice of classifying areas for different types of development and land use; gives control to planners for what can be built where, can restrict to single-use only or mixed use, can vitalize urban neighborhoods; involves gov’t restriction on use of private land, limits personal property rights
6. Urban Growth Boundaries – line that planners draw on a map to separate urban areas from areas the city would prefer to remain rural; goal is to concentrate development, prevent sprawl, and preserve orchards, ranches, forest & working farms; require less investment in infrastructure than sprawl, increases density of new housing, building “up not out” encourages development of urban centers v.s. sprawl
7. Smart Growth – philosophy of urban growth that focuses on economic & environmental approaches that lead to sustainable growth & avoidance of sprawl, focuses on revitalizing existing urban areas, waterfronts, and former industrial sites. “New urbanism” is happening at Celebration, FL and Seaside, FL (right)

Transportation OptionsPublic transportation is a key factor in the quality of urban lifeMass transit use encouraged by: raising fuel taxes, tax fuel-inefficient modes of transportation, reward carpoolers, and encourage bicycle use & bus ridingSuccessful mass transit systems: Washington D.C., NY City, Boston, and San FranciscoParks and Open Space are key elements of livable cities; aesthetic as well as ecological functions (regulate climate, produce O2, filter air & water), community gardensEcological restoration – practice of restoring native communities, helps parks become sustainableGreenways – strips of vegetated open space that connect parks or neighborhoods, provide buffers

Unit 8C Chp. 10.2 ReviewAnswer the following:
1. Define sprawl. What 2 factors contribute to it?
2. Briefly describe the effect of sprawl on each of the following aspects of a region: transportation, pollution, public health, land use, and economics.
3. Suppose you were offered a well-paying, interesting job with 3 choices of where to live. One choice is a densely populated city where you could walk to your office. The second is in a suburb where you would have more space, but you would spend an hour each day driving back and forth to work. The third is a quiet, rural area with plenty of space, but you would have to spend 3 hours each day driving back and forth to work. Where would you choose to live? Why?
Also, do packet 10.2 Sprawl. You may answer the above questions on the back on one of the packet sheets.

8D – Health & Hazards Chp. 9 (standards)Compare & contrast epidemiology & toxicology. Explain how they help us understand about how environmental hazards might affect our health.
Know that individuals respond differently to all types of exposure due to their unique differences in age, sex, weight, health issues and genetic makeup.
List 4 ways that infectious diseases are spread, methods used to reduce risk of exposure and monitor the outbreak.
Describe some of the chemical hazards that are in our outside air, water & land. Explain their sources, how might be exposed, and the effects on our health.
Describe the threat of bioaccumulation in organisms & give examples.
Describe how natural disasters can affect our environment & our health.

Central Case: The Rise and Fall and Rise of DDT
Page 255 and handout
As a small group, do the Decision Making Model analysis of this case study.
Define the problem, propose a solution, list 3 Pros, 3 Cons, 3 Short term consequences, 3 long term consequences, and then analyze your proposed solution. Then draw a Conclusion to your proposed solution…..was it good or will it not be a good solution and why.

Types of Environmental HazardsBiological – viruses, bacteria and other organisms that harm human health; pathogens (disease-causing agents) infect humans and make us sick (flu, strep throat, pet dander).
Social – hazards that result from where we live, our jobs, or lifestyle choices; examples: smoking cigarettes, living next to a polluting factory
Chemical – chemicals in the environment that harm human health; examples: synthetic chemicals, hazardous chemicals produced by organisms
Physical – natural disasters (tornados, droughts, earthquakes), natural phenomena (UV radiation)

Epidemiology and ToxicologyEpidemiology - the study of disease in human populations
Epidemiologists – scientists who study how & where diseases occur and how to control them; look at large #s of cancer cases in a town, how a disease spread
Toxicology - the study of how poisonous substances affect organisms’ health
Toxicity looks at what the substance is and how much of it is needed to cause harm
Dose-response relationship – different doses and the responses they generate
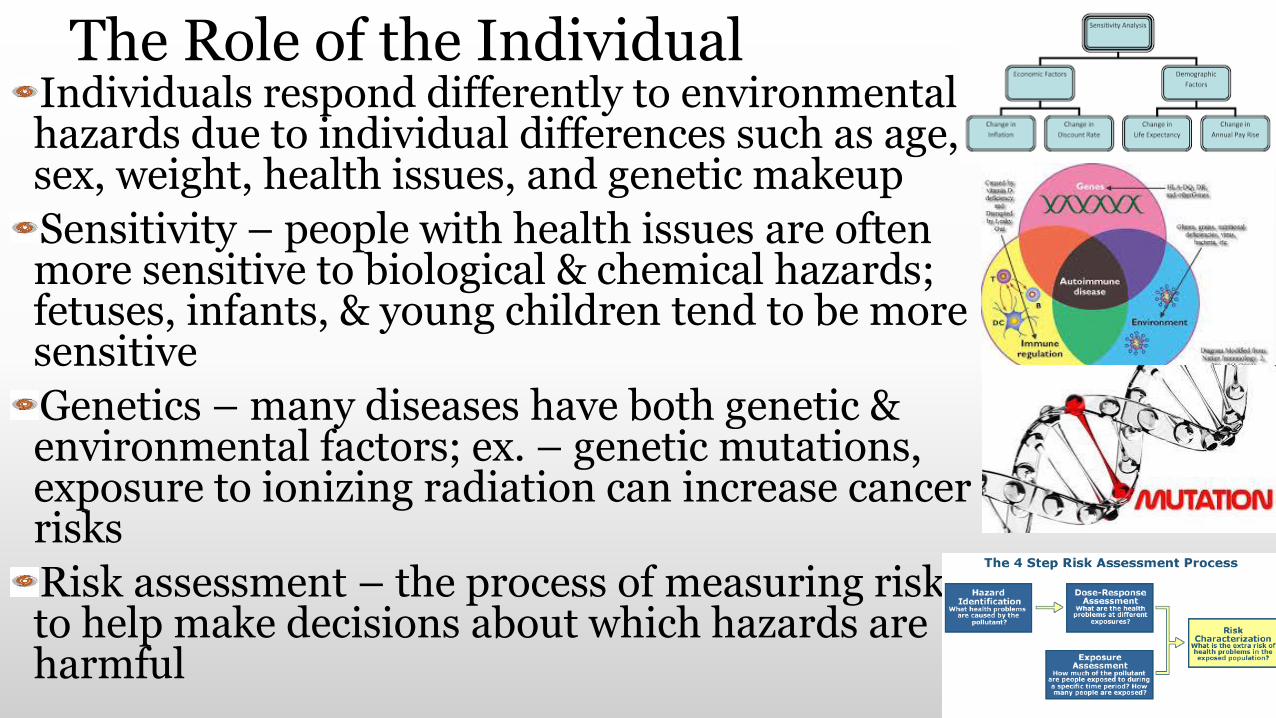
The Role of the IndividualIndividuals respond differently to environmental hazards due to individual differences such as age, sex, weight, health issues, and genetic makeup
Sensitivity – people with health issues are often more sensitive to biological & chemical hazards; fetuses, infants, & young children tend to be more sensitive
Genetics – many diseases have both genetic & environmental factors; ex. – genetic mutations, exposure to ionizing radiation can increase cancer risks
Risk assessment – the process of measuring risk to help make decisions about which hazards are harmful

Chp. 9.1 Review
1. List the 4 types of environmental health hazards.
2. How are epidemiology and toxicology similar? How are they different?
3. Suppose two people smoke 5 cigarettes a day for 20 years. One develops lung cancer. Will the other person definitely develop lung cancer as well? Explain.
4. What is risk management?
5. Both a father and his child drink water that has flowed through lead pipes. There is also lead-based paint on the walls of their home. Over time, the child shows the effects of lead poisoning. The father does not. Explain how this could be possible.

Infectious DiseaseDiseases caused by a pathogen and spread three ways: by direct human contact, through contaminated food and water, and by animals.
Humans – by touching, biting, sexual intercourse (STDs), contact with bodily fluids (HIV), inhaling expelled droplets (TB)
Water or Food – cholera in water, salmonella
Other Organisms – passed on via vectors (disease-carrying organisms) such as ticks, mosquitoes when they bite humans

Emerging DiseasesDiseases that have appeared in the human population for the first time, or is increasing rapidly or spreading around the world
Pandemic – outbreak that becomes widespread and affects a whole region, continent, or world
Ex’s: west nile virus, MRSA, swine flu, Ebola
Emerging diseases spread because of: increasing mobility, antibiotic resistance, changing environments
World Health Organization helps respond to emerging diseases internationally; US Centers for Disease Control responds nationally
9.2 Review 1. Describe one way pathogens can spread through the
environment.
2. Why is it important to have an international organization such as WHO coordinating responses to emerging diseases?
3. Describe 3 social hazards that are a result of choices you make every day.
4. Do you think that modern medicine will ever eliminate biological hazards from Earth? Why or why not?
• Answer the above 4 questions plus do the 9.2 review packet.
Toxic Substances in the Environment
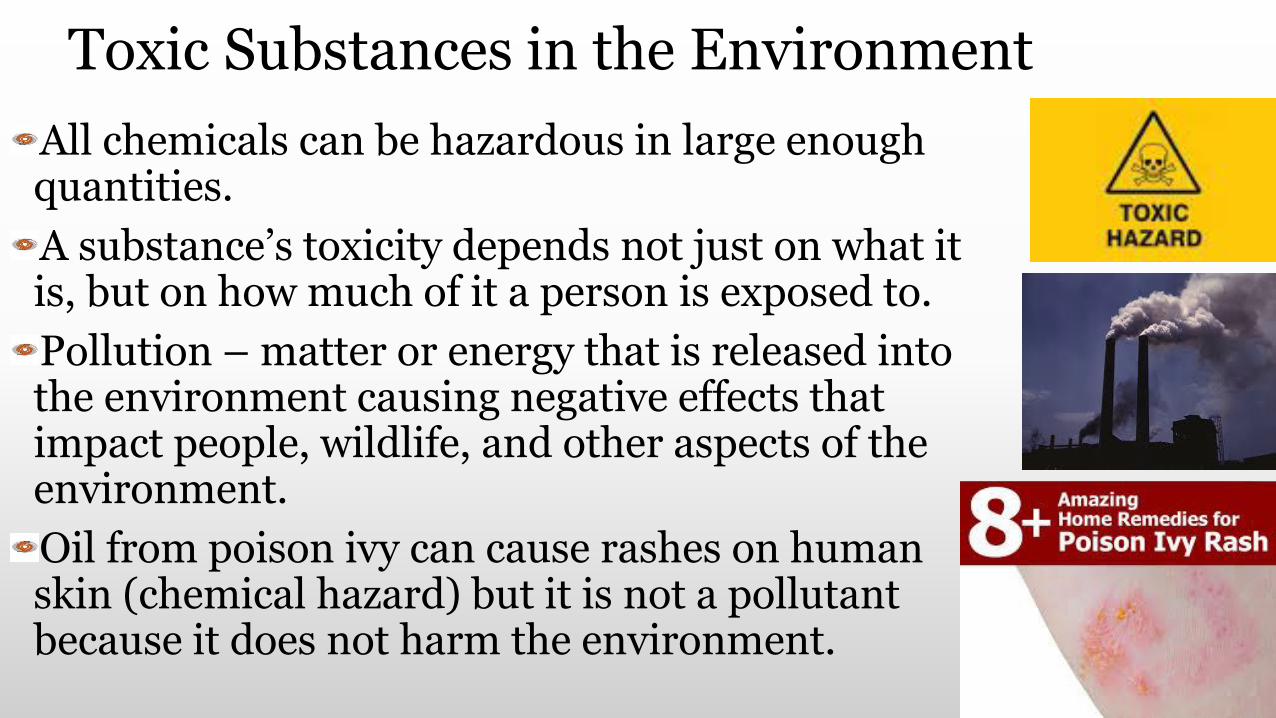
All chemicals can be hazardous in large enough quantities.
A substance’s toxicity depends not just on what it is, but on how much of it a person is exposed to.
Pollution – matter or energy that is released into the environment causing negative effects that impact people, wildlife, and other aspects of the environment.
Oil from poison ivy can cause rashes on human skin (chemical hazard) but it is not a pollutant because it does not harm the environment.
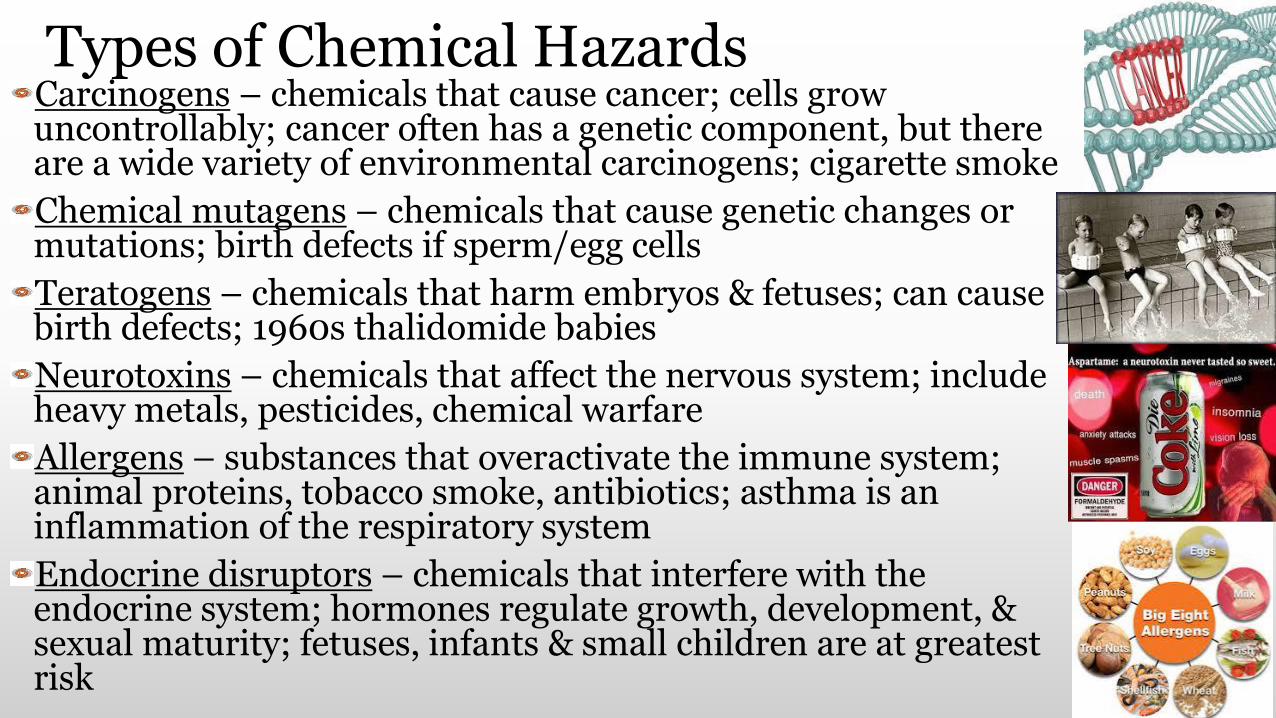
Types of Chemical HazardsCarcinogens – chemicals that cause cancer; cells grow uncontrollably; cancer often has a genetic component, but there are a wide variety of environmental carcinogens; cigarette smoke
Chemical mutagens – chemicals that cause genetic changes or mutations; birth defects if sperm/egg cells
Teratogens – chemicals that harm embryos & fetuses; can cause birth defects; 1960s thalidomide babies
Neurotoxins – chemicals that affect the nervous system; include heavy metals, pesticides, chemical warfare
Allergens – substances that overactivate the immune system; animal proteins, tobacco smoke, antibiotics; asthma is an inflammation of the respiratory system
Endocrine disruptors – chemicals that interfere with the endocrine system; hormones regulate growth, development, & sexual maturity; fetuses, infants & small children are at greatest risk
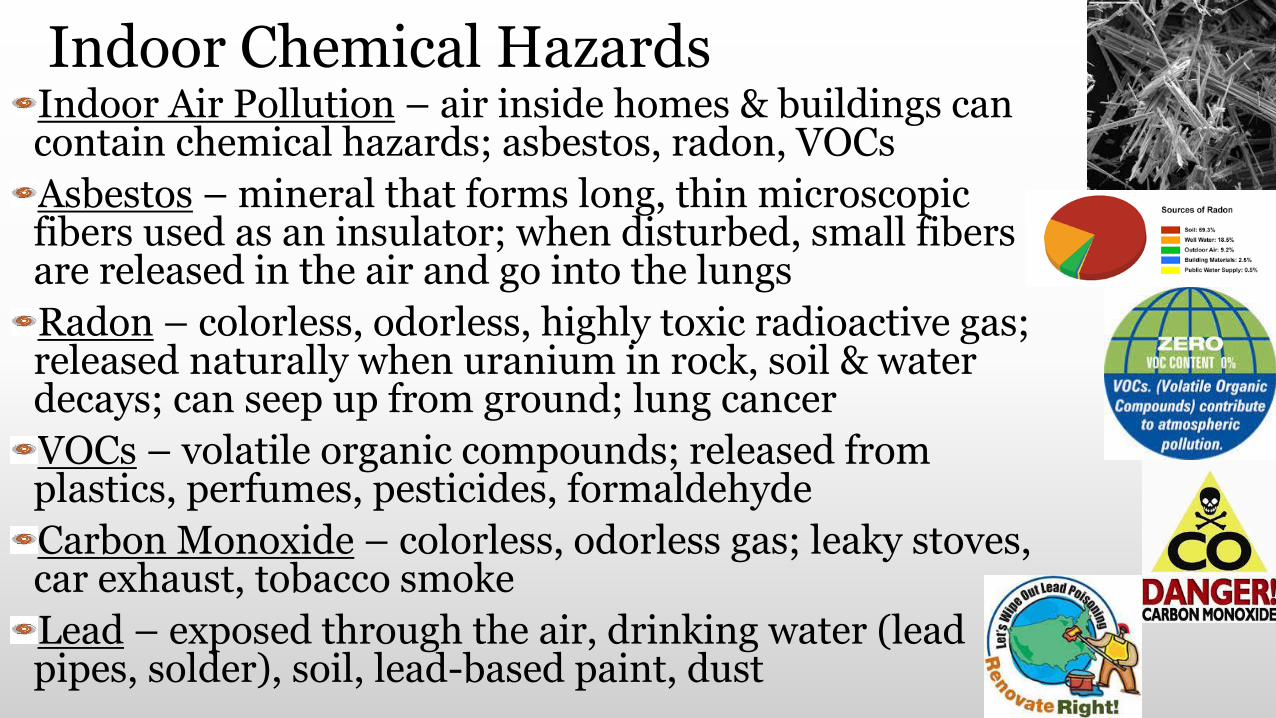
Indoor Chemical HazardsIndoor Air Pollution – air inside homes & buildings can contain chemical hazards; asbestos, radon, VOCs
Asbestos – mineral that forms long, thin microscopic fibers used as an insulator; when disturbed, small fibers are released in the air and go into the lungs
Radon – colorless, odorless, highly toxic radioactive gas; released naturally when uranium in rock, soil & water decays; can seep up from ground; lung cancer
VOCs – volatile organic compounds; released from plastics, perfumes, pesticides, formaldehyde
Carbon Monoxide – colorless, odorless gas; leaky stoves, car exhaust, tobacco smoke
Lead – exposed through the air, drinking water (lead pipes, solder), soil, lead-based paint, dust


Outdoor Chemical HazardsChemical Hazards in Air – come from both natural & human activity; winds carry chemicals far away from their original source (“pesticide drift”); contribute to millions of premature deaths each year; tough laws
Chemical Hazards on Land – chemicals get into the soil in many ways: pesticides, improper disposals; soil toxicants can be absorbed, inhaled, ingested or picked up by water that runs off the land
Chemical Hazards in Water – many chemicals are soluble in water & enter tissues through drinking or absorption; aquatic animals are effective indicators of pollution; water can pick up toxic chemicals when it runs off land - oil leaks, storm drains


BiomagnificationToxic chemicals accumulate in organisms as they feed on one another, moving up the food chain concentrated
How long a chemical lasts or persists in the environment can be a major concern
Organisms absorb, breathe & ingest toxic substances from their environment, some end up stored internally
DDT accumulates in fatty tissues, methylmercury can be stored in muscle tissue
Predators consume prey, including all of their stored toxic chemicals, and store the chemicals themselves in a concentrated form; ex – DDT in 1940s-60s moved up the food chain, eventually affecting eagles & ospreys

9.3 Review1. Explain the phrase “The dose makes the poison.”2. List 2 types of chemical hazards that affect human health.3. Name one indoor chemical hazard and describe how it can affect
human health.4. A pollutant released on one continent is found concentrated in the
tissues of organisms on another continent. Is this likely an air, land, or water pollutant? Explain.
5. Describe the process of biomagnification.6. A farmer decides to use a new pesticide on her fields to combat
some new pests. She continues to apply it for several years. Over time, a neighbor notices that there are fewer & fewer big fish in a nearby pond. She can’t think of any explanation, so she notifies scientists at a local university. The scientists look into the issue and find that high levels of the pesticide have accumulated in the fishes’ tissues. Describe how this might have occurred.
Do above questions individually, plus 9.3 review packet as homework.

Natural DisastersForces of Earth, wind, and water can quickly and completely disrupt our lives
Natural disasters are physical hazards that occur naturally in the environment and pose health hazards
Earthquakes, volcanic eruptions, violent storms
Some common practices by man increase our vulnerability to certain physical hazards, such as deforesting slopes makes landslides more likely and damming rivers makes flooding more likely in some areas. We can reduce risk from such hazards by improving our forestry and flood control practices, and choosing not to build in areas prone to hazards.
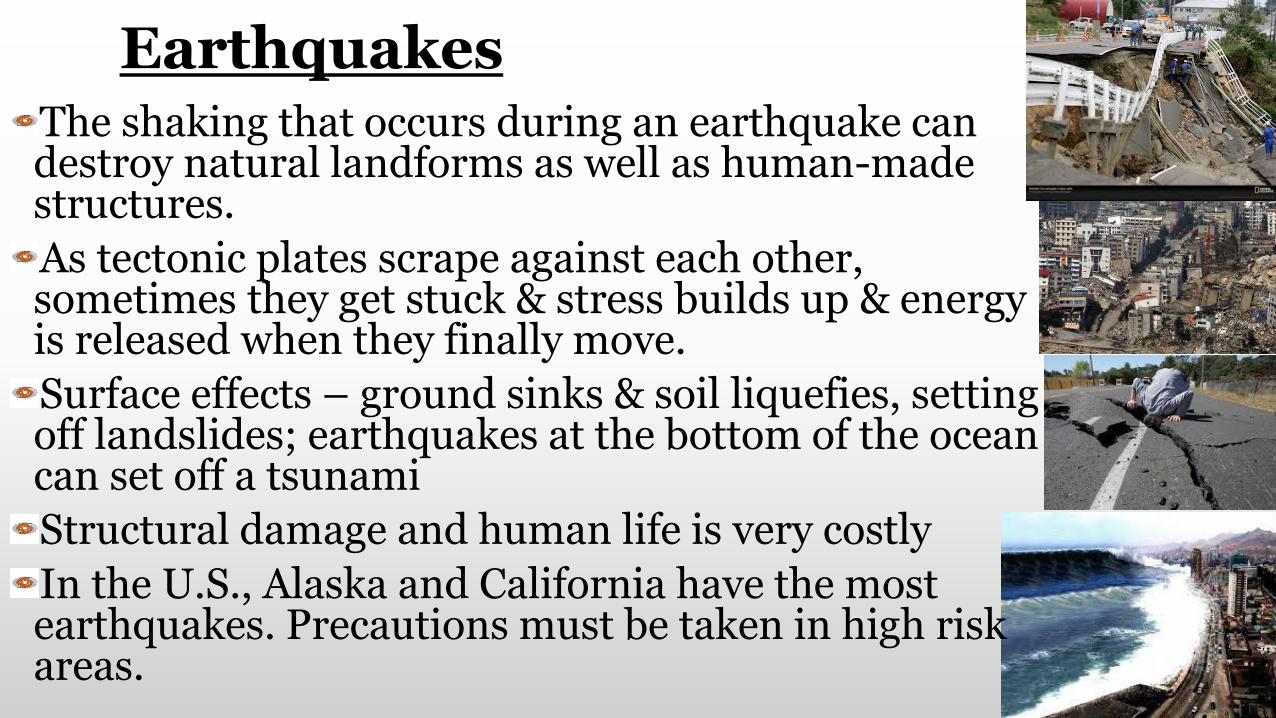
EarthquakesThe shaking that occurs during an earthquake can destroy natural landforms as well as human-made structures.
As tectonic plates scrape against each other, sometimes they get stuck & stress builds up & energy is released when they finally move.
Surface effects – ground sinks & soil liquefies, setting off landslides; earthquakes at the bottom of the ocean can set off a tsunami
Structural damage and human life is very costly
In the U.S., Alaska and California have the most earthquakes. Precautions must be taken in high risk areas.

VolcanoesThe molten rock, gas, ash & cinders released during a volcanic eruption can cause significant damage & loss of life in nearby cities & towns.
Molten rock/lava that surfaces can cover large areas of land, destroying what was once there.
Clouds from extreme volcanic eruptions can block the sun’s rays & cause global temperatures to drop.
Eruptions can also trigger landslides & mudflows.
Scientists monitoring tectonic activity can try to predict when a volcano will erupt, giving advance warning that saved 70,000 people in the Philippines in 1991 when Mount Pinatubo erupted.

StormsTornadoes, hurricanes, and thunderstorms are powerful weather events that can damage property & threaten human lives.
Tornadoes – a type of windstorm in which a funnel of rotating air drops down from a storm cloud & touches Earth’s surface; funnel wind speeds can reach over 250 mph; deadly; take shelter
Hurricanes – powerful storms that form over the ocean in the tropics; produce winds of at least 74 mph; high winds, heavy rain, and a storm surge (dome of water that crashes along the coast where the hurricane hits); destroy buildings, wash away beaches, blow away trees, and cause severe flooding.
Thunderstorms – storms that produce both lightning & thunder, heavy rain, & sometimes hail; cause flooding, take down power lines & trees, and hail damage to crops; lightning can start fires and kill people & animals

Avalanches An avalanche is a mass of sliding snow down a slope that can bury people and places in its path
Certain conditions create the potential for avalanches: slopes greater than 30º, unstable snowpacks (a layer of hard, strong snow sits on top of soft, weak snow), weather (heavy snows and warm temperatures and periods of melting and refreezing).
Damage includes burying both people and places, block roads and railroad tracks, and damage lines & bridges
If you do get caught, try to stay near the surface or swim up through the sliding snow as best you can, stay calm and try to conserve any air you have.

9.4 Review1. What is a landslide?
2. Name some ways a volcanic eruption can damage property.
3. How are hurricanes and tornadoes similar? How are they different?
4. Why do you think it is important to stay calm if you are caught in an avalanche?
5. Suppose you are in a car driving through a new town. The national weather service issues a tornado warning for this area. At the same time, you notice the weather looks threatening. What might you do?
Also, complete 9.4 review packet.


