44
United Asian Growth Opportunities Fund Annual Report for the financial year ended 30 th June 2017
| Date post: | 22-Mar-2018 |
| Category: |
Documents |
| Upload: | truongngoc |
| View: | 217 times |
| Download: | 3 times |

UnitedAsian GrowthOpportunitiesFundAnnual Report
for the financial year ended 30th June 2017


MANAGERUOB Asset Management LtdRegistered Address:80 Raffles PlaceUOB PlazaSingapore 048624Company Registration No. : 198600120Z
OPERATIONS ADDRESS80 Raffles Place#06-00, UOB Plaza 2Singapore 048624Tel: 1800 22 22 228
DIRECTORS OF UOB ASSET MANAGEMENTLee Wai FaiEric Tham Kah JinGoh Yu MinThio Boon Kiat
TRUSTEEState Street Trust (SG) Limited168 Robinson Road#33-01, Capital TowerSingapore 068912
CUSTODIAN / ADMINISTRATOR / REGISTRARState Street Bank and Trust Company, acting through its Singapore Branch168 Robinson Road#33-01, Capital TowerSingapore 068912
AUDITORPricewaterhouseCoopers LLP8 Cross Street#17-00, PWC BuildingSingapore 048424
SOLICITOR TO THE MANAGERTan Peng Chin LLC30 Raffles Place#11-00, Chevron HouseSingapore 048622
SOLICITOR TO THE TRUSTEEShook Lin & Bok LLP1 Robinson Road#18-00, AIA TowerSingapore 048542
United Asian Growth Opportunities Fund(Constituted under a Trust Deed in the Republic of Singapore)
-1-

A) Fund Performance
Fund Performance/Benchmark Returns
3 mth%
Growth
6 mth%
Growth
1 yr%
Growth
3 yrAnn
CompRet
5 yrAnn
CompRet
10 yrAnn
CompRet
SinceInception02 August
2004Ann
CompRet
United AsianGrowthOpportunitiesFund 3.28 9.36 17.46 2.58 7.44 -3.25 6.59
Benchmark 3.86 14.43 22.89 7.65 9.42 2.61 8.51
Source: Lipper, a Thomson Reuters Company.
Note: The performance returns of the Fund are in Singapore dollars based on a NAV-to-NAV basis with dividends and distributionsreinvested, if any.The benchmark of the Fund: Since Inception – Nov 07: FTSEGlobal Small Cap Series Asia Pacific Ex Japan; Dec 07 – Jan 11: MSCIAC Asia Pacific ex Japan Small Cap Index; Feb 11 - Present: MSCI AC Asia Pacific ex Japan Mid Cap Index.
For the year ended 30 June 2017, the net asset value of the Fund rose 17.46% compared with a gain of 22.89% in thebenchmark MSCI AC Asia ex-Japan Mid Cap index in Singapore dollar terms.
The Fund’s underperformance was largely due to its underweight position in China which was among the best performingmarkets. Both overweight positions in Korea and Taiwan have not worked as these markets underperformed the Index. Stockselection in Thailand, Taiwan, Singapore, Philippines and Australia also detracted from performance. Stock selectionprimarily from South Korea, China, Indonesia, India, Malaysia, Hong Kong and New Zealand contributed positively to theFund.
In terms of sector performance, there was positive stock selection in Information Technology, Financials andEnergy sector.This was offset by negative stock selection largely in Health Care, Industrials, Consumer Staples, ConsumerDiscretionary, Materials, Telecommunication, Utilities and Real Estate.
Key contributors to performance were largely in technology, for example Sunny Optical (China Technology), SK Hynix(Korea Technology), Largan (Taiwan Technology), Tongda (HK Technology) and Brilliance China (China ConsumerDiscretionary).
Key detractors included Tung Thih (Taiwan Consumer), Caregen (Australia Health Care), Bellamy’s Australia (AustraliaConsumer), Estia Healthcare (Australia Health Care) and Nutribiotech (Korea Health Care).
During the period under review, the Fund reduced exposure in Australia, China and Taiwan while increasing exposure toKorea,Malaysia, Singapore, Philippines and India. In terms of sector exposure, the Fund raised exposure in Financials asthere are signs of interest rate bottoming. The Fund reduced exposure to Information Technology to lock in gains, with theview of adding back later as the earnings momentum remains solid.
As at end June 2017, the Fund had the following sector allocation: Financials (28.52%), Information Technology (20.10%),Consumer Discretionary (12.52%),Real Estate (9.35%), Industrials (8.57%),Materials (7.72%),Health Care (3.96%) andothers (6.21%), with the remainder in cash (3.05%).
The Fund had the following country exposures: South Korea (14.36%), Taiwan (12.98%), India (11.07%),Australia (9.18%),China (8.69%), Hong Kong (8.66%), Singapore (8.31%),Malaysia (7.62%) and others (16.08%) and the remainder (3.05%)in cash.
United Asian Growth Opportunities Fund(Constituted under a Trust Deed in the Republic of Singapore)
-2-

A) Fund Performance (continued)
Economic and Market Review
The second half of 2016 was a volatile period for equities, as new flow and events on the political as well as monetary frontweighed on sentiment. Britain’s decision to leave the European Union, Donald Trump’s US election victory and the highlyanticipated US Federal Reserve (Fed) Rate hike in December weighed on market sentiment. The Fed went on to hike rates byquarter of a percentage point (25 basis points) in March and June 2017, as it took a gradual and predictable path to normalisinginterest rates. Since peaking in December 2016, the US dollar weakened against other major currencies including the Euro andJapanese yen. On the geopolitical front, markets brushed off concerns on North Korea’s missile launches, US PresidentTrump’s legal woes and welcomed the election of Pro-EU French President Macron.
There are signs that the global economies were improving for the first half of 2017. In India, manufacturing activity strengthenedas growth concerns from a demonetisation policy receded. North Asian exports picked up strongly. Korea and Taiwankick-started a new production cycle ahead of mobile handsets launches. China’s exports also accelerated more than expectedon strong demand globally. China’s purchasing managers’ index (PMI) accelerated in the first quarter to reach a multi-year of51.8 in March and then moderated in April and May as the authorities tightened monetary conditions before picking up againin June.
Asia mid-cap stocks did well for the year, as appetite for higher yielding assets increased with improved global economicmomentum and a weaker US dollar. The performance in the second half of the year (1H17) was strong, driven primarily bystrong earnings particularly in the technology sector. The softening of President Trump’s trade protectionism provided a boostto Asian exporters. Concerns of Sino-US tensions faded after a successful meeting between President Trump and PresidentXi.
The Hong Kong, China, India and Australia markets did well in the Asian markets. TheChinamarket outperformed amid betterthan expected economic activity, producer price index (PPI) reflation, strong earnings and renminbi (RMB) stability. Informationtechnology, consumer discretionary and real estate sectors drove the bulk of the gains.
The Hong Kongmarket was amongst the best performers driven by financial stocks and recovery in Macau gaming and retail.The property sector remained resilient despite additional government curbs due to slowing demand. The abrupt plummet ofsmall-cap shares in June failed to dent the rally.
The India market recovered from the demonetisation shock to become the best performing market in Asia. Meanwhile,Australia/New Zealand (NZ) performed better in the 2H16 buoyed by reflation hopes and rising commodity and energy prices.However, reflation hopes suffered in 1H17 as oil prices plummeted and yield of 10-year US treasuries fell.
Taiwan’s gains were driven by optimism on the Apple supply chain ahead of Apple’s iPhone8 launch. The Koreamarket wasdragged down by former President Park’s impeachment. However, it rebounded strongly to become one of the best performingmarkets. The market supported by strong earnings in the technology and the financial sectors. Meanwhile the election ofPresident Moon pledging a tougher stance on family own conglomerates, raised expectations of corporate restructuring andimproved governance.
South East Asia chalked up decent returns although the region lagged North Asian markets. Within ASEAN, Thailandreversed its position as the region’s star performer for 2H16 after posting disappointing first quarter 2017 corporate earnings.Despite the setback, it was the best performing markets for the year under review. Singapore was the top performer in SouthEast Asia, lifted by better-than-expected economic growth over the period. Indonesia struggled despite stronger resourceprices boosted economic growth and improved the trade balance and foreign reserves. Standard and Poor’s upgrade of theircredit rating to investment grade status also led to more fund inflows. After putting the corruption saga of its state investmentarm (that dragged 2H16 performances) behind them, Malaysia did well after posting strong first quarter GDP growth andforeign direct investments poured in especially from China as the country expands its “One Belt One Road” initiative. ThePhilippines market also lagged after posting mixed first quarter GDP growth numbers and weaker corporate earnings. Thecurrent account slipped to a deficit and overseas remittances contracted, putting pressure on the peso.
Across sectors, defensive sectors including telecommunication services, material and consumer staples underperformed.Other underperformers included energy as oil prices retreated on inventory concerns. Information technology, utilities,healthcare and consumer discretionary drove the lion’s share of Asia’s gains.
United Asian Growth Opportunities Fund(Constituted under a Trust Deed in the Republic of Singapore)
-3-

A) Fund Performance (continued)
Outlook and Fund Strategy
Asia is seeing improving returns on equity (ROEs) and upward revisions in corporate earnings, led by cyclicals as global growthrecovers. China’s economic recovery looks to have stabilised with the Purchasing Managers Index (PMI) above 50 and therebound in the Producer Price Index (PPI) after many years in negative territory. Despite the US Federal Reserve (Fed) raisingrates, the US dollar has weakened slightly as questions arise over the execution of Trump’s fiscal stimulus policies andeconomic indicators point to a mild recovery. This has helped Asian currencies and markets.
Despite the strong run this year, Asian market valuations are still reasonable, trading at the mean level on a price-to-book basis,though slightly above mean on price to earnings. The strong performance in the first half of the year has largely been drivenby earnings revisions rather than valuation expansion.
The US market has remained resilient in spite of relatively soft US economic data, elevated valuations and President Trump’slegal troubles. China economic growth activity moderated after accelerating late last year till the first quarter 2017 as theauthorities tightened monetary conditions to control financial leverage. However, recent data points to continued economicstabilisation rather than growth. We are still in the first year of earnings recovery after many years of suppressed profit growth.Hence, we remain constructive on Asian markets.
The Fund is overweight on North Asia over South East Asia and Australia/NZ as the region is seeing stronger earningsmomentum and cheaper valuations. We like Korea. The market is seeing strong positive earnings revisions led by technologyand cyclicals. A new change in Korean leadership that seeks to restructure the Korean chaebols and more shareholder friendlypolicies by corporates also bodes well for a market rerating. We are also constructive on China, particularly in the new economysectors like technology which are seeing strong positive earnings momentum and positive structural tailwinds as Chinarebalances from an investment driven to a more services driven economy. The Fund is neutral on Hong Kong. Property priceslook to be peaking as affordability becomes stretched. Nonetheless, primary property sales continue to remain robust despitegovernment policy measures to cool demand due to tight supply. Retail sales and Macau gross gaming revenues have beenrecovering after 2 to 3 years of decline. We are also positive on Taiwan. Technology continues to enjoy tailwinds ahead ofApple’s new iPhone8 launch and rising applications in cloud computing and artificial intelligence. Taiwan corporates have strongfree cash flow, balance sheets and high dividend yields. We are slightly positive on India due to valuation concerns. India’seconomy rebounded post de-monetisation and there is positive progress on the goods and services tax rollout. India has greatpotential as there are many interesting mid/small cap stocks that have the potential to grow as its economy progresses.
The Fund is underweight on ASEAN. The region’s valuation is relatively expensive and has weaker earnings momentumcompared to North Asia. Within ASEAN, we are overweight on Malaysia. We see upside to earnings growth expectations fromstrong construction orders, growth in palm oil volumes and drop in bank provisions as non-performing loans (NPLs) peak.Investment from China has risen significantly as Malaysia is a key destination for China’s “One Belt One Road” initiative. Theupcoming elections early next year should also be another positive catalyst. We are neutral in Singapore. Valuations arerelatively expensive and we believe the Singapore banks’ re-rating from reflation optimism has already played out. Singapore’seconomic growth could also likely moderate in the later part of the year after a strong first half. We are neutral in Indonesia. Thecountry’s economic growth, trade balance and foreign reserves have improved on stronger resource prices. We areunderweighton Thailand and Philippines due to valuation concerns, mixed corporate earnings outlook and policy risk. We are underweighton Australia. Although economic growth is improving, it still lags behind India and China, with expensive valuations.
United Asian Growth Opportunities Fund(Constituted under a Trust Deed in the Republic of Singapore)
-4-

B) Investments at fair value and as a percentage of net asset value (“NAV”) as at 30 June 2017under review classified by
i) Country
Fair Value(S$)
% of NAV
Australia 1,282,424 9.18
China 1,214,651 8.69
Hong Kong 1,210,122 8.66
India 1,547,254 11.07
Indonesia 597,861 4.28
Macau 155,542 1.11
Malaysia 1,065,281 7.62
New Zealand 232,674 1.66
Papua New Guinea 136,649 0.98
Philippines 579,360 4.15
Singapore 1,161,810 8.31
South Korea 2,007,101 14.36
Taiwan 1,813,681 12.98
Thailand 544,369 3.90
Portfolio of investments 13,548,779 96.95
Other net assets/(liabilities) 425,653 3.05
Total 13,974,432 100.00
ii) Industry
Fair Value(S$)
% of NAV
Consumer Discretionary 1,750,282 12.52
Consumer Staples 230,021 1.64
Energy 434,185 3.11
Financials 3,986,105 28.52
Health Care 553,299 3.96
Industrials 1,197,336 8.57
Information Technology 2,808,339 20.10
Materials 1,078,810 7.72
Real Estate 1,306,746 9.35
Utilities 203,656 1.46
Portfolio of investments 13,548,779 96.95
Other net assets/(liabilities) 425,653 3.05
Total 13,974,432 100.00
United Asian Growth Opportunities Fund(Constituted under a Trust Deed in the Republic of Singapore)
-5-

B) Investments at fair value and as a percentage of net asset value (“NAV”) as at 30 June 2017under review classified by (continued)
iii) Asset Class
Fair Value(S$) % of NAV
Quoted equities 13,548,779 96.95
Other net assets/(liabilities) 425,653 3.05
Total 13,974,432 100.00
iv) Credit rating of quoted bonds
N/A
C) Top Ten Holdings
10 largest holdings as at 30 June 2017
Fair Value(S$)
Percentage oftotal net assetsattributable tounitholders
%
CHINA TAIPING INSURANCE HOLDINGS CO LTD 558,186 3.99
HANA FINANCIAL GROUP INC 550,139 3.94
LAND MARK OPTOELECTRONICS CORP 535,532 3.83
HOTA INDUSTRIAL MANUFACTURING CO LTD 507,601 3.63
INARI AMERTRON BHD 449,378 3.21
METROPOLITAN BANK & TRUST CO 432,977 3.10
YUANTA FINANCIAL HOLDING CO LTD 382,096 2.74
FRASERS LOGISTICS & INDUSTRIAL TRUST 371,412 2.66
MAGELLAN FINANCIAL GROUP LTD 369,124 2.64
BEIJING CAPITAL INTERNATIONAL AIRPORT HOLDINGS LTD 368,620 2.64
United Asian Growth Opportunities Fund(Constituted under a Trust Deed in the Republic of Singapore)
-6-

C) Top Ten Holdings (continued)
10 largest holdings as at 30 June 2016
Fair Value
Percentage oftotal net assetsattributable to
unitholders
(S$) %
TUNG THIH ELECTRONIC CO LTD 1,200,917 4.90
SUNNY OPTICAL TECHNOLOGY GROUP CO LTD 1,125,728 4.59
DOMINO’S PIZZA ENTERPRISES LTD 1,117,899 4.56
HERMES MICROVISION INC 877,824 3.58
NUTRIBIOTECH CO LTD 719,212 2.94
SK INNOVATION CO LTD 672,111 2.74
MOTHERSON SUMI SYSTEMS LIMITED 671,038 2.74
PT INDO TAMBANGRAYA MEGAH 642,613 2.62
SK HYNIX INC 624,663 2.55
GREAT WALL MOTOR COMPANY LTD 623,719 2.55
D) Exposure to derivatives
i) fair value of derivative contracts and as a percentage of NAV as at 30 June 2017
Contract orunderlyingprincipalamount
Positivefair value % of NAV
Negativefair value % of NAV
$ $ $
Foreign currency contracts 137,316 55 -* - -
* denotes amount less than 0.01%
ii) There was a net realised loss of SGD 8,099 on derivative contracts during the financial year ended 30 June 2017.
iii) There was a net unrealised gain of SGD 55 on outstanding derivative contracts marked to market as at 30 June 2017.
E) Amount and percentage of NAV invested in other schemes as at 30 June 2017
Please refer to the Statement of Portfolio.
F) Amount and percentage of borrowings to NAV as at 30 June 2017
N/A
G) Amount of redemptions and subscriptions for the financial year ended 30 June 2017
Total amount of redemptions SGD 16,005,384
Total amount of subscriptions SGD 1,929,883
United Asian Growth Opportunities Fund(Constituted under a Trust Deed in the Republic of Singapore)
-7-

H) The amount and terms of related-party transactions for the financial year ended 30 June 2017
Please refer to Note 9 of the Notes to the Financial Statements.
I) Expense ratios
Please refer to Note 10 of the Notes to the Financial Statements.
J) Turnover ratios
Please refer to Note 10 of the Notes to the Financial Statements.
K) Any material information that will adversely impact the valuation of the scheme such ascontingent liabilities of open contracts
N/A
L) For schemes which invest more than 30% of their deposited property in another scheme, thefollowing key information on the second-mentioned scheme (“the underlying scheme”)1
should be disclosed as well
i) top 10 holdings at fair value and as percentage of NAV as at 30 June 2017 and 30 June 2016
N/A
ii) expense ratios for the financial year ended 30 June 2017 and 30 June 2016
N/A
iii) turnover ratios for the financial year ended 30 June 2017 and 30 June 2016
N/A
1 Where the underlying scheme is managed by a foreign manager which belongs to the same group of companies as, or has aformal arrangement or investment agreement with, the Singapore manager, the above information should be disclosed on theunderlying scheme. In other cases, such information on the underlying scheme should be disclosed only if it is readily availableto the Singapore manager.
M) Soft dollar commissions/arrangements
UOB Asset Management has entered into soft dollars arrangements with selected brokers from whom products andservices are received from third parties. The products and services relate essentially to computer hardware and softwareto the extent that they are used to support the investment decision making process, research and advisory services,economic and political analyses, portfolio analyses including performance measurements, market analyses, data andquotation services, all of which are believed to be helpful in the overall discharge of UOB Asset Management’s duties toclients. As such services generally benefit all of UOB Asset Management’s clients in terms of input into the investmentdecision making process, the soft credits utilised are not allocated on a specific client basis. The Manager confirms thattrades were executed on a best execution basis and there was no churning of trades.
N) Where the scheme offers pre-determined payouts, an explanation on the calculation of theactual payouts received by participants and any significant deviation from thepre-determined payouts
N/A
United Asian Growth Opportunities Fund(Constituted under a Trust Deed in the Republic of Singapore)
-8-

REPORT OF THE TRUSTEE
The Trustee is under a duty to take into custody and hold the assets of United Asian Growth Opportunities Fund (the “Fund”)in trust for the unitholders. In accordance with the Securities and Futures Act (Cap. 289), its subsidiary legislation and the Codeon Collective Investment Schemes, the Trustee shall monitor the activities of the Manager for compliance with the limitationsimposed on the investment and borrowing powers as set out in the Trust Deed in each annual accounting year and reportthereon to unitholders in an annual report.
To the best knowledge of the Trustee, the Manager has, in all material respects, managed the Fund during the year covered bythese financial statements, setoutonpages13 to36, inaccordancewith the limitations imposedon the investmentandborrowingpowers set out in the Trust Deed.
For and on behalf of the TrusteeSTATE STREET TRUST (SG) LIMITED
Authorised signatory27 September 2017
United Asian Growth Opportunities Fund(Constituted under a Trust Deed in the Republic of Singapore)
-9-

STATEMENT BY THE MANAGER
In the opinion of UOB Asset Management Ltd, the accompanying financial statements set out on pages 13 to 36, comprising theStatement of Total Return, Statement of Financial Position, Statement of Movements of Unitholders’ Funds, Statement ofPortfolio and Notes to the Financial Statements are drawn up so as to present fairly, in all material respects, the financial positionand portfolio holdings of United Asian Growth Opportunities Fund (the “Fund”) as at 30 June 2017, and the financialperformance and movements of unitholders’ funds for the year then ended in accordance with the recommendations ofStatement of Recommended Accounting Practice 7 “Reporting Framework for Unit Trusts” issued by the Institute of SingaporeChartered Accountants. At the date of this statement, there are reasonable grounds to believe that the Fund will be able to meetits financial obligations as and when they materialise.
For and on behalf of the ManagerUOB ASSET MANAGEMENT LTD
THIO BOON KIATAuthorised signatory27 September 2017
United Asian Growth Opportunities Fund(Constituted under a Trust Deed in the Republic of Singapore)
-10-

INDEPENDENT AUDITOR’S REPORT TO THE UNITHOLDERS OF UNITED ASIAN GROWTHOPPORTUNITIES FUND
Our Opinion
In our opinion, the accompanying financial statements of the United Asian Growth Opportunities Fund (the “Fund”), are properlydrawn up in accordance with the recommendations of Statement of Recommended Accounting Practice 7 “ReportingFramework for Unit Trusts” issued by the Institute of Singapore Chartered Accountants, so as to present fairly, in all materialrespects, the financial position and portfolio holdings of the Fund as at 30 June 2017, and of the financial performance andmovements of unitholders’ funds for the financial year ended on that date.
What we have audited
The financial statements of the Fund comprise:
• the Statement of Total Return for the financial year ended 30 June 2017;
• the Statement of Financial Position as at 30 June 2017;
• the Statement of Movements of Unitholders’ Funds for the financial year ended 30 June 2017;
• the Statement of Portfolio as at 30 June 2017; and
• the notes to the financial statements, including a summary of significant accounting policies.
Basis for Opinion
We conducted our audit in accordance with Singapore Standards on Auditing (“SSAs”). Our responsibilities under thosestandards are further described in the Auditor’s Responsibilities for the Audit of the Financial Statements section of our report.
We believe that the audit evidence we have obtained is sufficient and appropriate to provide a basis for our audit opinion.
Independence
We are independent of the Fund in accordance with the Accounting and Corporate Regulatory Authority Code of ProfessionalConduct and Ethics for Public Accountants and Accounting Entities (“ACRA Code”) together with the ethical requirements thatare relevant to our audit of the financial statements in Singapore, and we have fulfilled our other ethical responsibilities inaccordance with these requirements and the ACRA Code.
Other Information
The Fund’s Manager (the “Manager”) is responsible for the other information. The other information comprises all sections ofthe annual report but does not include the financial statements and our auditor’s report thereon.
Our opinion on the financial statements does not cover the other information and we do not and will not express any form ofassurance conclusion thereon.
In connection with our audit of the financial statements, our responsibility is to read the other information and, in doing so,consider whether the other information is materially inconsistent with the financial statements or our knowledge obtained in theaudit, or otherwise appears to be materially misstated. If, based on the work we have performed on the other information, weconclude that there is a material misstatement of this other information, we are required to report that fact. We have nothingto report in this regard.
Responsibilities of the Manager for the Financial Statements
The Manager is responsible for the preparation and fair presentation of these financial statements in accordance with therecommendations of Statement of Recommended Accounting Practice 7 “Reporting Framework for Unit Trusts” issued by theInstitute of Singapore Chartered Accountants and for such internal control as the Manager determines is necessary to enablethe preparation of financial statements that are free from material misstatement, whether due to fraud or error.
-11-
United Asian Growth Opportunities Fund(Constituted under a Trust Deed in the Republic of Singapore)

INDEPENDENT AUDITOR’S REPORT TO THE UNITHOLDERS OF UNITED ASIAN GROWTHOPPORTUNITIES FUND
In preparing the financial statements, the Manager is responsible for assessing the Fund’s ability to continue as a goingconcern, disclosing, as applicable, matters related to going concern and using the going concern basis of accounting unlessthe Manager either intends to terminate the Fund or to cease the Fund’s operations, or has no realistic alternative but to do so.
The Manager’s responsibilities include overseeing the Fund’s financial reporting process.
Auditor’s Responsibilities for the Audit of the Financial Statements
Our objectives are to obtain reasonable assurance about whether the financial statements as a whole are free from materialmisstatement, whether due to fraud or error, and to issue an auditor’s report that includes our opinion. Reasonable assuranceis a high level of assurance, but is not a guarantee that an audit conducted in accordance with SSAs will always detect a materialmisstatement when it exists. Misstatements can arise from fraud or error and are considered material if, individually or in theaggregate, they could reasonably be expected to influence the economic decisions of users taken on the basis of these financialstatements.
As part of an audit in accordance with SSAs, we exercise professional judgement and maintain professional scepticismthroughout the audit. We also:
• Identify and assess the risks of material misstatement of the financial statements, whether due to fraud or error, designand perform audit procedures responsive to those risks, and obtain audit evidence that is sufficient and appropriate toprovide a basis for our opinion. The risk of not detecting a material misstatement resulting from fraud is higher than forone resulting from error, as fraud may involve collusion, forgery, intentional omissions, misrepresentations, or the overrideof internal control.
• Obtain an understanding of internal control relevant to the audit in order to design audit procedures that are appropriatein the circumstances, but not for the purpose of expressing an opinion on the effectiveness of the Fund’s internal control.
• Evaluate the appropriateness of accounting policies used and the reasonableness of accounting estimates and relateddisclosures made by the Manager.
• Conclude on the appropriateness of the Manager’s use of the going concern basis of accounting and, based on the auditevidence obtained, whether a material uncertainty exists related to events or conditions that may cast significant doubton the Fund’s ability to continue as a going concern. If we conclude that a material uncertainty exists, we are required todraw attention in our auditor’s report to the related disclosures in the financial statements or, if such disclosures areinadequate, to modify our opinion. Our conclusions are based on the audit evidence obtained up to the date of ourauditor’s report. However, future events or conditions may cause the Fund to cease to continue as a going concern.
• Evaluate the overall presentation, structure and content of the financial statements, including the disclosures, andwhether the financial statements represent the underlying transactions and events in a manner that achieves fairpresentation.
We communicate with the Manager regarding, among other matters, the planned scope and timing of the audit and significantaudit findings, including any significant deficiencies in internal control that we identify during our audit.
PricewaterhouseCoopers LLPPublic Accountants and Chartered Accountants
Singapore, 2 September 2017
-12-
United Asian Growth Opportunities Fund(Constituted under a Trust Deed in the Republic of Singapore)
7

STATEMENT OF TOTAL RETURNFor the financial year ended 30 June 2017
2017 2016
Note $ $
Income
Dividends 311,618 562,947
Interest 714 29
Total 312,332 562,976
Less: Expenses
Management fee 9 221,468 325,809
Trustee fee 9 6,910 10,426
Audit fee 16,680 16,700
Custody fee 9 13,690 21,271
Transaction costs 248,138 445,716
Other expenses 68,589 70,679
Total 575,475 890,601
Net income/(losses) (263,143) (327,625)
Net gains/(losses) on value of investments
Net gains/(losses) on investments 3,604,531 (2,826,734)
Net gains/(losses) on financial derivatives (8,044) -
Net foreign exchange gains/(losses) 205,937 (154,863)
3,802,424 (2,981,597)
Total return/(deficit) for the year before income tax 3,539,281 (3,309,222)
Less: Income tax 3 (35,807) (46,146)
Less: Capital gains tax refund 3 42,272 -
Total return/(deficit) for the year 3,545,746 (3,355,368)
United Asian Growth Opportunities Fund(Constituted under a Trust Deed in the Republic of Singapore)
The accompanying notes form an integral part of these financial statements.-13-

STATEMENT OF FINANCIAL POSITIONAs at 30 June 2017
2017 2016
Note $ $
Assets
Portfolio of investments 13,548,779 22,500,187
Sales awaiting settlement 114,883 128,418
Receivables 4 32,993 42,726
Cash and bank balances 885,063 2,925,614
Financial derivatives at fair value 6 55 1,684
Total assets 14,581,773 25,598,629
Liabilities
Purchases awaiting settlement 498,202 906,348
Payables 5 109,139 188,094
Total liabilities 607,341 1,094,442
Equity
Net assets attributable to unitholders 7 13,974,432 24,504,187
United Asian Growth Opportunities Fund(Constituted under a Trust Deed in the Republic of Singapore)
The accompanying notes form an integral part of these financial statements.-14-

STATEMENT OF MOVEMENTS OF UNITHOLDERS’ FUNDSFor the financial year ended 30 June 2017
2017 2016
Note $ $Net assets attributable to unitholders at the beginning of the financialyear 24,504,187 30,456,608
Operations
Change in net assets attributable to unitholders resulting from operations 3,545,746 (3,355,368)
Unitholders’ contribution/(withdrawal)
Creation of units 1,929,883 905,155
Cancellation of units (16,005,384) (3,502,208)
Change in net assets attributable to unitholders resulting from net creationand cancellation of units (14,075,501) (2,597,053)
Total increase/(decrease) in net assets attributable to unitholders (10,529,755) (5,952,421)
Net assets attributable to unitholders at the end of the financial year 7 13,974,432 24,504,187
United Asian Growth Opportunities Fund(Constituted under a Trust Deed in the Republic of Singapore)
The accompanying notes form an integral part of these financial statements.-15-

STATEMENT OF PORTFOLIOAs at 30 June 2017
Holdings at Fair value at
Percentage oftotal net assetsattributable tounitholders at
30 June2017
30 June2017$
30 June2017%
By Geography - Primary
Quoted Equities
AUSTRALIA
AMCOR LTD/AUSTRALIA 12,492 213,858 1.53
APA GROUP 21,029 203,656 1.46
CHALLENGER LTD/AUSTRALIA 15,442 217,555 1.56
GOODMAN GROUP 16,152 134,249 0.96
MAGELLAN FINANCIAL GROUP LTD 12,119 369,124 2.64
SANTOS LTD 44,994 143,982 1.03
TOTAL AUSTRALIA 1,282,424 9.18
CHINABEIJING CAPITAL INTERNATIONAL AIRPORT HOLDINGSLTD 190,000 368,620 2.64
BRILLIANCE CHINA AUTOMOTIVE HOLDINGS LTD 88,000 220,707 1.58
MOMO INC 2,691 136,941 0.98
SINOPEC KANTONS HOLDINGS LTD 202,000 153,554 1.10
YANGTZE OPTICAL FIBRE AND CABLE JOINT STOCK LTD 114,500 334,829 2.39
TOTAL CHINA 1,214,651 8.69
HONG KONG
CHINA TAIPING INSURANCE HOLDINGS CO LTD 160,000 558,186 3.99
GUOTAI JUNAN INTERNATIONAL HOLDINGS LTD 488,000 208,290 1.49
SHANGRI-LA ASIA LTD 76,000 177,474 1.27
VTECH HOLDINGS LTD 12,200 266,172 1.91
TOTAL HONG KONG 1,210,122 8.66
INDIA
COLGATE-PALMOLIVE INDIA LTD 9,721 230,021 1.65
INDUSIND BANK LTD 10,850 341,810 2.45
KANSAI NEROLAC PAINTS LTD 34,291 321,611 2.30
LIC HOUSING FINANCE LTD 9,733 153,876 1.10
MOTHERSON SUMI SYSTEMS LTD 37,127 365,371 2.61
United Asian Growth Opportunities Fund(Constituted under a Trust Deed in the Republic of Singapore)
The accompanying notes form an integral part of these financial statements.-16-

STATEMENT OF PORTFOLIOAs at 30 June 2017
Holdings at Fair value at
Percentage oftotal net assetsattributable tounitholders at
30 June2017
30 June2017$
30 June2017%
By Geography - Primary (continued)
Quoted Equities
INDIA (continued)
UPL LTD 7,517 134,565 0.96
TOTAL INDIA 1,547,254 11.07
INDONESIA
CIPUTRA DEVELOPMENT TBK PT 2,600,000 314,266 2.25
SUMMARECON AGUNG TBK PT 2,128,000 283,595 2.03
TOTAL INDONESIA 597,861 4.28
MACAU
MGM CHINA HOLDINGS LTD 50,800 155,542 1.11
MALAYSIA
CAHYA MATA SARAWAK BHD 203,500 262,393 1.88
CIMB GROUP HOLDINGS BHD 167,500 353,510 2.53
INARI AMERTRON BHD 664,000 449,378 3.21
TOTAL MALAYSIA 1,065,281 7.62
NEW ZEALAND
FISHER & PAYKEL HEALTHCARE CO 20,157 232,674 1.66
PAPUA NEW GUINEA
OIL SEARCH LTD 18,972 136,649 0.98
PHILIPPINES
CEMEX HOLDINGS PHILIPPINES INC 755,600 146,383 1.05
METROPOLITAN BANK & TRUST CO 181,350 432,977 3.10
TOTAL PHILIPPINES 579,360 4.15
SINGAPORE
FRASERS LOGISTICS & INDUSTRIAL TRUST 343,900 371,412 2.66
United Asian Growth Opportunities Fund(Constituted under a Trust Deed in the Republic of Singapore)
The accompanying notes form an integral part of these financial statements.-17-

STATEMENT OF PORTFOLIOAs at 30 June 2017
Holdings at Fair value at
Percentage oftotal net assetsattributable tounitholders at
30 June2017
30 June2017$
30 June2017%
By Geography - Primary (continued)
Quoted Equities
SINGAPORE (continued)
HEALTH MANAGEMENT INTERNATIONAL LTD 475,000 320,625 2.29
HRNETGROUP LTD 141,600 126,024 0.90
SATS LTD 27,500 140,525 1.01
UOL GROUP LTD 26,600 203,224 1.45
TOTAL SINGAPORE 1,161,810 8.31
SOUTH KOREA
ADVANCED PROCESS SYSTEMS CORP 6,200 367,826 2.63
DAELIM INDUSTRIAL CO LTD 1,907 204,242 1.46
HANA FINANCIAL GROUP INC 10,103 550,139 3.94
HWASEUNG ENTERPRISE CO LTD 15,235 323,587 2.31
HYUNDAI ROBOTICS CO LTD 450 209,298 1.50
SK HYNIX INC 4,340 352,009 2.52
TOTAL SOUTH KOREA 2,007,101 14.36
TAIWAN
CTBC FINANCIAL HOLDING CO LTD 257,040 232,098 1.66
ENNOCONN CORP 8,961 156,354 1.12
HOTA INDUSTRIAL MANUFACTURING CO LTD 74,766 507,601 3.63
LAND MARK OPTOELECTRONICS CORP 34,000 535,532 3.83
YUANTA FINANCIAL HOLDING CO LTD 630,000 382,096 2.74
TOTAL TAIWAN 1,813,681 12.98
THAILAND
CH KARNCHANG PCL 122,700 144,223 1.03
SINO-THAI ENGINEERING & CONSTRUCTION PCL 190,000 213,702 1.53
United Asian Growth Opportunities Fund(Constituted under a Trust Deed in the Republic of Singapore)
The accompanying notes form an integral part of these financial statements.-18-

STATEMENT OF PORTFOLIOAs at 30 June 2017
Holdings at Fair value at
Percentage oftotal net assetsattributable tounitholders at
30 June2017
30 June2017$
30 June2017%
By Geography - Primary (continued)
Quoted Equities
THAILAND (continued)
TMB BANK PCL 2,000,000 186,444 1.34
TOTAL THAILAND 544,369 3.90
Total Equities 13,548,779 96.95
Portfolio of investments 13,548,779 96.95
Other net assets/(liabilities) 425,653 3.05
Net assets attributable to unitholders 13,974,432 100.00
United Asian Growth Opportunities Fund(Constituted under a Trust Deed in the Republic of Singapore)
The accompanying notes form an integral part of these financial statements.-19-

STATEMENT OF PORTFOLIOAs at 30 June 2017
Percentage oftotal net assetsattributable tounitholders at30 June2017%
Percentage oftotal net assetsattributable tounitholders at
30 June2016
%
By Geography - Primary (Summary)
Quoted Equities
Australia 9.18 24.18
China 8.69 11.14
Hong Kong 8.66 3.03
India 11.07 7.25
Indonesia 4.28 4.90
Macau 1.11 -
Malaysia 7.62 2.19
New Zealand 1.66 -
Papua New Guinea 0.98 -
Philippines 4.15 1.17
Singapore 8.31 1.46
South Korea 14.36 13.53
Taiwan 12.98 19.72
Thailand 3.90 3.26
Portfolio of investments 96.95 91.83
Other net assets/(liabilities) 3.05 8.17
Net assets attributable to unitholders 100.00 100.00
United Asian Growth Opportunities Fund(Constituted under a Trust Deed in the Republic of Singapore)
The accompanying notes form an integral part of these financial statements.-20-

STATEMENT OF PORTFOLIOAs at 30 June 2017
Fair value at30 June2017$
Percentage oftotal net assetsattributable tounitholders at30 June2017%
Percentage oftotal net assetsattributable tounitholders at
30 June2016
%
By Industry - Secondary
Quoted Equities
Consumer Discretionary 1,750,282 12.52 18.93
Consumer Staples 230,021 1.64 5.13
Energy 434,185 3.11 8.98
Financials 3,986,105 28.52 12.98
Health Care 553,299 3.96 6.20
Industrials 1,197,336 8.57 6.27
Information Technology 2,808,339 20.10 23.38
Materials 1,078,810 7.72 7.30
Real Estate 1,306,746 9.35 -
Telecommunication Services - - 0.97
Utilities 203,656 1.46 1.69
Portfolio of investments 13,548,779 96.95 91.83
Other net assets/(liabilities) 425,653 3.05 8.17
Net assets attributable to unitholders 13,974,432 100.00 100.00
United Asian Growth Opportunities Fund(Constituted under a Trust Deed in the Republic of Singapore)
The accompanying notes form an integral part of these financial statements.-21-

These notes form an integral part of and should be read in conjunction with the accompanying financial statements.
1 General
United Asian Growth Opportunities Fund (the “Fund”) is a Singapore-registered trust fund constituted under a Trust Deed dated3 February 2004 between UOB Asset Management Ltd (the “Manager”) and HSBC Institutional Trust Services (Singapore)Limited (the “Retired Trustee”). The Deed is governed by the laws of the Republic of Singapore.
With effect from 1 April 2017, the Trustee of the Fund has changed from HSBC Institutional Trust Services (Singapore) Limited(the “Retired Trustee”) to State Street Trust (SG) Limited (the “Trustee”).
The primary activity of the Fund is that of investment trading. The Fund’s investment objective is to achieve long-term capitalgrowth by investing primarily in small capitalisation stocks and stock-related securities issued by corporations in the Asia Pacificregion (excluding Japan).
Subscriptions and redemptions of the units are denominated in the Singapore Dollar and the United States Dollar. Investors maysubscribe in the United States Dollar at the applicable rate of exchange from the Singapore Dollar.
2 Significant accounting policies
(a) Basis of preparation
The financial statements have been prepared under the historical cost convention, modified by the revaluation of financialassets held at fair value through profit or loss, and in accordance with the recommendations of Statement of RecommendedAccounting Practice 7 “Reporting Framework for Unit Trusts” issued by the Institute of Singapore Chartered Accountants inJune 2016 (“RAP 7”) for the financial year beginning on or after 1 July 2016.
The Fund has adopted the following Singapore Financial Reporting Standards (“FRS”) and related amendments in accordancewith the recommendations of the RAP 7:
(i) Consolidation and disclosure of interests in other entities
FRS 110 “Consolidated financial statements”FRS 112 “Disclosure of interests in other entities”Amendments to FRS 110, FRS 112 and FRS 27 “Investment entities”
FRS 110 and the amendments define an investment entity and introduce an exception from the consolidation requirements forinvestments entities.
FRS 112 and the amendments require entities to disclose significant judgements and assumptions made in determiningwhether the entity controls, jointly controls, significantly influences or has some interests in other entities. Entities are alsorequired to provide disclosure around certain “structured entities”. The amendments to FRS 112 introduce new disclosurerequirements related to investment entities.
(ii) Offsetting financial assets and liabilities disclosures
Amendments to FRS 32 “Financial instruments: Presentation - Offsetting financial assets and financial liabilities”Amendments to FRS 107 “Disclosures - Offsetting financial assets and financial liabilities”
The amendments to FRS 32 provide clarification on the offsetting criteria in FRS 32 and address inconsistencies in theirapplication.
The amendments to FRS 107 require additional disclosures to enable users of the financial statements to evaluate the effector the potential effects of netting arrangements, including rights of set-off associated with an entity’s recognised financialassets and recognised financial liabilities, on the entity’s financial position.
United Asian Growth Opportunities Fund(Constituted under a Trust Deed in the Republic of Singapore)
NOTES TO THE FINANCIAL STATEMENTS
For the financial year ended 30 June 2017
-22-

2 Significant accounting policies (continued)
(a) Basis of preparation (continued)
(ii) Offsetting financial assets and liabilities disclosures (continued)
The adoption of these new or amended FRS impacted the Fund’s level of disclosures in certain of the above noted areas, butdid not result in substantial changes to the accounting policies of the Fund and had no material effect on the amounts reportedfor the current or prior years.
(b) Recognition of income
Dividend income is recognised when the right to receive payment is established. Interest income is recognised on a timeproportion basis using the effective interest method.
(c) Investments
Investments are classified as financial assets at fair value through profit or loss.
(i) Initial recognition
Purchases of investments are recognised on the trade date. Investments are recorded at fair value on initial recognition.
(ii) Subsequent measurement
Investments are subsequently carried at fair value. Net changes in fair value on investments are included in the Statement ofTotal Return in the year in which they arise.
(iii) Derecognition
Investments are derecognised on the trade date of disposal. The resultant realised gains and losses on the sale of investmentsare computed on the basis of the difference between the weighted average cost and selling price gross of transaction costs,and are taken up in the Statement of Total Return.
(d) Basis of valuation of investments
The fair value of financial assets and liabilities traded in active markets is based on quoted market prices at the close of tradingon the financial year end date. The quoted market price used for investments held by the Fund is the last traded market pricefor both financial assets and financial liabilities where the last traded price falls within the bid-ask spread. In circumstanceswhere the last traded price is not within the bid-ask spread, the Manager will determine the point within the bid-ask spread thatis most representative of fair value.
(e) Foreign currency translation
(i) Functional and presentation currency
The Fund’s investors are mainly from Singapore with the subscriptions and redemptions of the units denominated in theSingapore Dollar and the United States Dollar.
The performance of the Fund is measured and reported to the investors in the Singapore Dollar. The Manager considers theSingapore Dollar as the currency of the primary economic environment in which the Fund operate. The financial statements arepresented in the Singapore Dollar, which is the Fund’s functional and presentation currency.
United Asian Growth Opportunities Fund(Constituted under a Trust Deed in the Republic of Singapore)
NOTES TO THE FINANCIAL STATEMENTS
For the financial year ended 30 June 2017
-23-

2 Significant accounting policies (continued)
(e) Foreign currency translation (continued)
(ii) Transactions and balances
Foreign currency transactions are translated into the functional currency using the exchange rates prevailing at the dates of thetransactions. Foreign exchange gains and losses resulting from the settlement of such transactions and from the translation atyear-end exchange rates of monetary assets and liabilities denominated in foreign currencies are recognised in the Statementof Total Return. Translation differences on non-monetary financial assets and liabilities are also recognised in the Statementof Total Return within “Net gains/losses on investments”.
(f) Expenses charged to the Fund
All direct expenses relating to the Fund are charged directly to the Statement of Total Return. In addition, certain expensesshared by all unit trusts managed by the Manager are allocated to each fund based on the respective fund’s net asset value.
(g) Financial derivatives
Financial derivatives including forwards and swaps may be entered into for the purposes efficient portfolio management, tacticalasset allocation or specific hedging of financial assets held as determined by the Manager and in accordance with the provisionof the Trust Deed and the Code on Collective Investment Schemes.
Financial derivatives outstanding on the financial year end date are valued at the forward rate or at the current market pricesusing the �mark-to-market� method, as applicable, and the resultant gains and losses are taken up in the Statement of TotalReturn.
(h) Distributions
The Manager has the absolute discretion to determine whether a distribution is to be made. In such an event, an appropriateamount will be transferred to a distribution account, to be paid out on the distribution date. The amount shall not be treated aspart of the property of the Fund. Distributions are accrued for at the financial year end date if the necessary approvals havebeen obtained and a legal or constructive obligation has been created.
(i) Offsetting financial instruments
Financial assets and liabilities are offset and the net amount reported in the Statement of Financial Position when there is alegally enforceable right to offset the recognised amounts and there is an intention to settle on a net basis, or realise the assetand settle the liability simultaneously. The legally enforceable right must not be contingent on future events and must beenforceable in the normal course of business and in the event of default, insolvency or bankruptcy of the Fund or thecounterparty.
3 Income tax
2017 2016
$ $
Overseas income tax 35,807 46,146
Capital gains tax refund (42,272) -
United Asian Growth Opportunities Fund(Constituted under a Trust Deed in the Republic of Singapore)
NOTES TO THE FINANCIAL STATEMENTS
For the financial year ended 30 June 2017
-24-

3 Income tax (continued)
The Fund was granted the status of Designated Unit Trust (“DUT”) in Singapore. The Trustee of the Fund ensures that the Fundfulfill their reporting obligations under the DUT Scheme.
Under the DUT Scheme, subject to certain conditions and reporting obligations being met, certain income of the DUT Fund isnot taxable in accordance with Sections 35(12) and 35(12A) of the Income Tax Act. Such income includes:
(i) gains or profits derived from Singapore or elsewhere from the disposal of securities;
(ii) interest (other than interest for which tax has been deducted under Section 45 of the Income Tax Act);
(iii) dividends derived from outside Singapore and received in Singapore;
(iv) gains or profits derived from foreign exchange transactions, transactions in futures contracts, transactions in interest rateor currency forwards, swaps or option contracts and transactions in forwards, swaps or option contracts relating to anysecurities or financial index;
(v) discount, prepayment fee, redemption premium and break cost from qualifying debt securities issued during theprescribed period; and
(vi) distributions from foreign unit trusts derived from outside Singapore and received in Singapore.
The overseas income tax represents tax withheld on foreign sourced income.
The capital gains tax refund represents refund by the tax authority on excess capital gains tax paid by the Fund in previous yearsof assessment.
4 Receivables
2017 2016
$ $
Amounts receivable for creation of units 502 6,602
Dividends receivable 32,256 35,890
Other receivables 235 234
32,993 42,726
United Asian Growth Opportunities Fund(Constituted under a Trust Deed in the Republic of Singapore)
NOTES TO THE FINANCIAL STATEMENTS
For the financial year ended 30 June 2017
-25-

5 Payables
2017 2016
$ $
Amount payable for cancellation of units 54,461 89,306
Amount due to the Manager 45,783 77,666
Amount due to Trustee 1,288 2,477
Tax payables 5,742 -
Other creditors and accrued expenses 1,865 18,645
109,139 188,094
6 Fair value of financial derivatives
Financial derivatives contracts comprise foreign currency contracts for the sale and purchase of foreign currencies. Thecontract or underlying principal amounts of these financial derivatives and their corresponding gross positive or negative fairvalues at the financial year end date are analysed below.
2017 2016Contract orunderlyingprincipalamount
Positivefair value
Negativefair value
Contract orunderlyingprincipalamount
Positivefair value
Negativefair value
$ $ $ $ $ $
Warrant - - - - 1,684 -
Foreign currency contracts 137,316 55 - - - -
55 - 1,684 -
United Asian Growth Opportunities Fund(Constituted under a Trust Deed in the Republic of Singapore)
NOTES TO THE FINANCIAL STATEMENTS
For the financial year ended 30 June 2017
-26-

7 Units in issue
During the financial year ended 30 June 2017 and 2016, the numbers of units issued, redeemed and outstanding were asfollows:
2017 2016
Units at the beginning of the financial year 13,242,204 14,629,582
Units created 943,350 482,248
Units cancelled (7,756,157) (1,869,626)
Units at the end of the financial year* 6,429,397 13,242,204
*Included above are units denominated in USD 748,545 5,131,948
$ $
Net assets attributable to unitholders 13,974,432 24,504,187
Net assets value per unit 2.173 1.850
There is no difference between the net assets attributable to unitholders per unit per financial statements and the net assetsattributable to unitholders per unit for issuing/redeeming of units.
8 Financial risk management
The Fund’s activities expose it to a variety of market risks (including currency risk, interest rate risk and price risk), credit riskand liquidity risk. The Fund’s overall risk management programme seeks to minimise potential adverse effects on the Fund’sfinancial performance. The Fund may use futures contracts, financial options contracts and/or foreign currency contractssubject to the terms of the Trust Deed to moderate certain risk exposures. Specific guidelines on exposures to individualsecurities and certain industries are in place for the Fund at any time as part of the overall financial risk management to reducethe Fund’s risk exposures.
The Fund’s assets principally consist of financial instruments such as equity investments and cash. They are held in accordancewith the published investment policies of the Fund. The allocation of assets between the various types of investments isdetermined by the Manager to achieve its investment objectives.
(a) Market risk
Market risk is the risk of loss arising from uncertainty concerning movements in market prices and rates, including observablevariables such as interest rates, credit spreads, exchange rates, and others that may be only indirectly observable such asvolatilities and correlations. Market risk includes such factors as changes in economic environment, consumption pattern andinvestor’s expectation etc. which may have significant impact on the value of the investments. The Fund’s investments aresubstantially dependent on changes in market prices and are monitored by the Manager on a regular basis so as to assesschanges in fundamentals and valuation. Although the Manager makes reasonable efforts in the choice of investments, eventsbeyond reasonable control of the Manager could affect the prices of the underlying investments and hence the asset value ofthe Fund. Guidelines are set to reduce the Fund’s risk exposures to market volatility such as diversifying the portfolio by investingacross various geographies, alternatively, the Fund may be hedged using derivative strategies.
United Asian Growth Opportunities Fund(Constituted under a Trust Deed in the Republic of Singapore)
NOTES TO THE FINANCIAL STATEMENTS
For the financial year ended 30 June 2017
-27-

8 Financial risk management (continued)
(a) Market risk (continued)
(i) Foreign exchange risk
The Fund has monetary financial assets and liabilities denominated in currencies other than the Singapore Dollar and it maybe affected favourably or unfavourably by exchange rate regulations or changes in the exchange rates between the SingaporeDollar and such other currencies. The Manager may at his discretion, implement a currency management strategy either toreduce currency volatility or to hedge the currency exposures of the Fund.
The table below summarises the Fund’s exposure to foreign currencies at the end of the financial year.
As at 30 June 2017AUD TWD HKD KRW INR SGD Others Total$ $ $ $ $ $ $ $
AssetsPortfolio ofinvestments 1,419,074 1,813,681 2,443,374 2,007,100 1,547,255 1,161,810 3,156,485 13,548,779Sales awaitingsettlement - - - - - 114,883 - 114,883Receivables 7,364 6,406 4,069 - 1,121 738 13,295 32,993Cash and bankbalances - 85,163 - 9 176,232 563,044 60,615 885,063Total Assets 1,426,438 1,905,250 2,447,443 2,007,109 1,724,608 1,840,475 3,230,395 14,581,718
LiabilitiesPurchases awaitingsettlement - - - - - 360,831 137,371 498,202Payables 3,463 1,290 - - - 103,364 1,022 109,139Total Liabilities 3,463 1,290 - - - 464,195 138,393 607,341
Net Assets 1,422,975 1,903,960 2,447,443 2,007,109 1,724,608 1,376,280 3,092,002Foreigncurrencycontracts(notional value) - - - - - (137,316) 137,316Net currencyexposure 1,422,975 1,903,960 2,447,443 2,007,109 1,724,608 1,238,964 3,229,318
United Asian Growth Opportunities Fund(Constituted under a Trust Deed in the Republic of Singapore)
NOTES TO THE FINANCIAL STATEMENTS
For the financial year ended 30 June 2017
-28-

8 Financial risk management (continued)
(a) Market risk (continued)
(i) Foreign exchange risk (continued)
As at 30 June 2016AUD TWD HKD KRW Others Total
$ $ $ $ $ $
Assets
Portfolio of investments 5,926,040 4,831,281 3,473,001 3,314,443 4,957,106 22,501,871
Sales awaiting settlement - - - - 128,418 128,418
Receivables 18,322 14,141 - - 10,263 42,726
Cash and bank balances - 1,014,429 - - 1,911,185 2,925,614
Total Assets 5,944,362 5,859,851 3,473,001 3,314,443 7,006,972 25,598,629
Liabilities
Purchases awaiting settlement - - - 617,176 289,172 906,348
Payables - - - - 188,094 188,094
Total Liabilities - - - 617,176 477,266 1,094,442
Net currency exposure 5,944,362 5,859,851 3,473,001 2,697,267 6,529,706
Investments, which is the significant item in the Statement of Financial Position is exposed to currency risk and other price risk.The other price risk sensitivity analysis includes the impact of currency risk on non-monetary investments. The Fund’s netfinancial assets comprise significantly non-monetary investments, hence currency risk sensitivity analysis has not beenperformed on the remaining financial assets.
(ii) Price risk
Price risk is the risk of potential adverse changes to the value of financial investments because of changes in market conditionsand volatility in security prices.
The table below summarises the impact of increases/decreases from the Fund’s investments in equities on the Fund’s netassets attributable to unitholders at 30 June 2017 and 2016. The analysis is based on the assumption that the indexcomponents within the benchmark increased/decreased by a reasonable possible shift, with all other variables held constantand that the fair value of the Fund’s investments moved according to the historical correlation with the index.
Benchmark component
2017Net impact tonet assets
attributable tounitholders
2016Net impact to
net assetsattributable to
unitholders$ % $ %
MSCI AC Asia Pacific ex Japan Mid Cap Index 2,574,268 20 4,365,363 20
(iii) Interest rate risk
Interest rate risk is the risk that the value of a financial instrument will fluctuate due to changes in market interest rates.
United Asian Growth Opportunities Fund(Constituted under a Trust Deed in the Republic of Singapore)
NOTES TO THE FINANCIAL STATEMENTS
For the financial year ended 30 June 2017
-29-

8 Financial risk management (continued)
(a) Market risk (continued)
(iii) Interest rate risk (continued)
Investment funds that invest in equity securities may be subject to interest rate risk as any interest rate change may affect theequity risk premium though at varying degrees. To manage this risk, the Manager analyses how interest rate changes may affectdifferent industries and securities and then seeks to adjust the Fund’s portfolio investments accordingly. However, the effectsof changes in interest rates on the Fund’s portfolio may not be quantified as the relationship between the interest rates and thevalue of equity securities is indirect.
Other than the cash and bank balances which are at short term market interest rates, and therefore subject to insignificantinterest rate risk, the Fund’s financial assets and liabilities are largely non-interest bearing.
Hence, no sensitivity analysis has been presented separately.
(b) Liquidity risk
The Fund is exposed to daily cash redemptions and disbursements for the settlements of purchases. The Manager thereforeensures that the Fund maintains sufficient cash and cash equivalents and that it is able to obtain cash from the sale ofinvestments held to meet its liquidity requirements. Reasonable efforts will be taken to invest in securities which are traded ina relatively active market and which can be readily disposed of.
The Fund’s investments in listed securities are considered to be readily realisable as they are listed on established regionalstock exchanges.
The table below analyses the Fund’s financial liabilities into relevant maturity groupings based on the remaining period at thefinancial year end date to the contractual maturity date. The amounts in the table are the contractual undiscounted cash flows.Balances due within 12 months equal their carrying balances, as the impact of discounting is not significant.
2017 2016Less than 3months
3 months to1 year
Over1 year
Less than 3months
3 months to1 year
Over1 year
$ $ $ $ $ $
Purchases awaiting settlement 498,202 - - 906,348 - -
Payables 109,139 - - 188,094 - -
(c) Credit risk
The Fund takes on exposure to credit risk, which is the risk that a counterparty will be unable to pay amounts in full when due.The Fund’s credit risk is concentrated on cash and bank balances, and amounts or securities receivable on the sale andpurchase of investments respectively. In order to mitigate exposure to credit risk, all transactions in listed securities aresettled/paid for upon delivery and transacted with approved counterparties using an approved list of brokers that are regularlyassessed and updated by the Manager.
United Asian Growth Opportunities Fund(Constituted under a Trust Deed in the Republic of Singapore)
NOTES TO THE FINANCIAL STATEMENTS
For the financial year ended 30 June 2017
-30-

8 Financial risk management (continued)
(c) Credit risk (continued)
The table below summarises the credit rating of banks and custodians in which the Fund’s assets are held as at 30 June 2017and 2016.
The credit ratings are based on the Viability ratings published by Fitch.
Credit ratingas at 30 June
2017
Credit ratingas at 30 June
2016
Bank and custodian
State Street Bank and Trust Company aa- aa-
Bank
United Overseas Bank Limited n/a aa-
The maximum exposure to credit risk at the financial year end date is the carrying amount of the portfolio of investments andcash and bank balances as presented in Statement of Financial Position.
(d) Capital management
The Fund’s capital is represented by the net assets attributable to unitholders. The Fund strives to invest the subscriptions ofredeemable participating units in investments that meet the Fund’s investment objectives while maintaining sufficient liquidityto meet unitholder redemptions.
(e) Fair value estimation
The Fund classifies fair value measurements using a fair value hierarchy that reflects the significance of the inputs used inmaking the measurements. The fair value hierarchy has the following levels:
• Quoted prices (unadjusted) in active markets for identical assets or liabilities (Level 1).
• Inputs other than quoted prices included within Level 1 that are observable for the asset or liability, either directly (that is,as prices) or indirectly (that is, derived from prices) (Level 2).
• Inputs for the asset or liability that are not based on observable market data (that is, unobservable inputs) (Level 3).
United Asian Growth Opportunities Fund(Constituted under a Trust Deed in the Republic of Singapore)
NOTES TO THE FINANCIAL STATEMENTS
For the financial year ended 30 June 2017
-31-

8 Financial risk management (continued)
(e) Fair value estimation (continued)
The following table analyses within the fair value hierarchy, the Fund’s financial assets and liabilities (by class) measured at fairvalue at 30 June 2017 and 2016:
2017 2016Level 1 Level 2 Level 3 Total Level 1 Level 2 Level 3 Total$ $ $ $ $ $ $ $
AssetsPortfolio ofinvestments
- Quoted equities 13,548,779 - - 13,548,779 22,213,878 286,309 - 22,500,187Financialderivatives at fairvalue - 55 - 55 - 1,684 - 1,684Total 13,548,779 55 - 13,548,834 22,213,878 287,993 - 22,501,871
Investments whose values are based on quoted market prices in active markets, and therefore classified within Level 1,comprise listed equities. The Fund does not adjust the quoted price for these instruments.
Financial instruments that trade in markets that are not considered to be active but are valued based on quoted market prices,dealer quotations or alternative pricing sources supported by observable inputs are classified within Level 2.
Except for cash and bank balances which are classified as Level 1, the Fund’s assets and liabilities not measured at fair valueat 30 June 2017 and 2016 have been classified as Level 2. The carrying amounts of these assets and liabilities approximatetheir fair values as at the financial year end date.
(f) Transfer between levels
Management’s policy is to recognise transfers into and transfers out of fair value hierarchy levels as at the end of the financialyear.
The following table presents the transfers between levels for the financial year ended 30 June 2017.
2017 2016
Level 1 Level 2 Level 3 Level 1 Level 2 Level 3
$ $ $ $ $ $
Transfers between level 1 andlevel 2
Quoted equities 146,383 (146,383) - - - -
The equity security transferred from level 2 to level 1 was related to such security which trading is active as at 30 June 2017 butwas not traded actively as at 30 June 2016.
United Asian Growth Opportunities Fund(Constituted under a Trust Deed in the Republic of Singapore)
NOTES TO THE FINANCIAL STATEMENTS
For the financial year ended 30 June 2017
-32-
8 Financial risk management (continued)
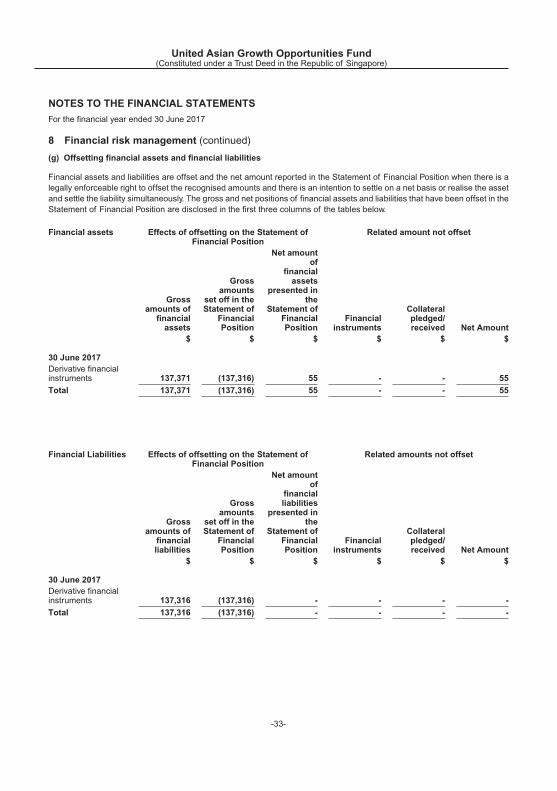
(g) Offsetting financial assets and financial liabilities
Financial assets and liabilities are offset and the net amount reported in the Statement of Financial Position when there is alegally enforceable right to offset the recognised amounts and there is an intention to settle on a net basis or realise the assetand settle the liability simultaneously. The gross and net positions of financial assets and liabilities that have been offset in theStatement of Financial Position are disclosed in the first three columns of the tables below.
Financial assets Effects of offsetting on the Statement ofFinancial Position
Related amount not offset
Grossamounts offinancialassets
Grossamounts
set off in theStatement of
FinancialPosition
Net amountof
financialassets
presented inthe
Statement ofFinancialPosition
Financialinstruments
Collateralpledged/received Net Amount
$ $ $ $ $ $
30 June 2017Derivative financialinstruments 137,371 (137,316) 55 - - 55
Total 137,371 (137,316) 55 - - 55
Financial Liabilities Effects of offsetting on the Statement ofFinancial Position
Related amounts not offset
Grossamounts offinancialliabilities
Grossamounts
set off in theStatement of
FinancialPosition
Net amountof
financialliabilities
presented inthe
Statement ofFinancialPosition
Financialinstruments
Collateralpledged/received Net Amount
$ $ $ $ $ $
30 June 2017Derivative financialinstruments 137,316 (137,316) - - - -
Total 137,316 (137,316) - - - -
United Asian Growth Opportunities Fund(Constituted under a Trust Deed in the Republic of Singapore)
NOTES TO THE FINANCIAL STATEMENTS
For the financial year ended 30 June 2017
-33-
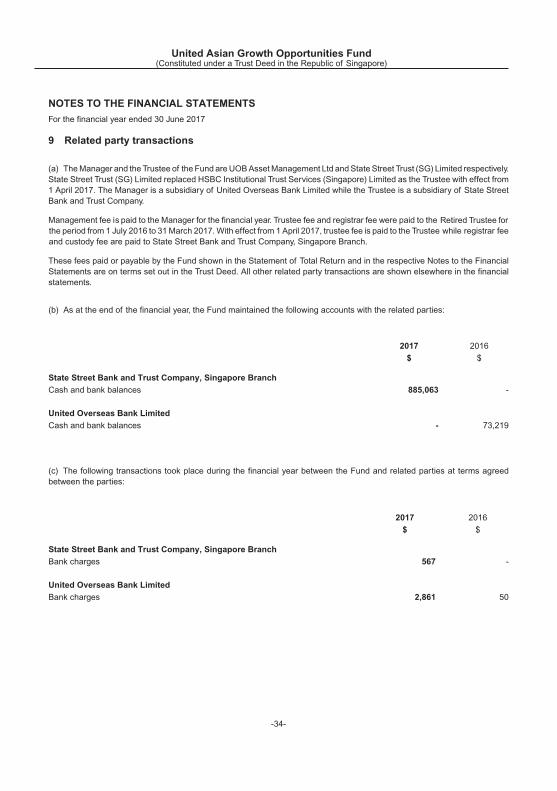
9 Related party transactions
(a) The Manager and the Trustee of the Fund are UOB Asset Management Ltd and State Street Trust (SG) Limited respectively.State Street Trust (SG) Limited replaced HSBC Institutional Trust Services (Singapore) Limited as the Trustee with effect from1 April 2017. The Manager is a subsidiary of United Overseas Bank Limited while the Trustee is a subsidiary of State StreetBank and Trust Company.
Management fee is paid to the Manager for the financial year. Trustee fee and registrar fee were paid to the Retired Trustee forthe period from 1 July 2016 to 31 March 2017. With effect from 1 April 2017, trustee fee is paid to the Trustee while registrar feeand custody fee are paid to State Street Bank and Trust Company, Singapore Branch.
These fees paid or payable by the Fund shown in the Statement of Total Return and in the respective Notes to the FinancialStatements are on terms set out in the Trust Deed. All other related party transactions are shown elsewhere in the financialstatements.
(b) As at the end of the financial year, the Fund maintained the following accounts with the related parties:
2017 2016
$ $
State Street Bank and Trust Company, Singapore Branch
Cash and bank balances 885,063 -
United Overseas Bank Limited
Cash and bank balances - 73,219
(c) The following transactions took place during the financial year between the Fund and related parties at terms agreedbetween the parties:
2017 2016
$ $
State Street Bank and Trust Company, Singapore Branch
Bank charges 567 -
United Overseas Bank Limited
Bank charges 2,861 50
United Asian Growth Opportunities Fund(Constituted under a Trust Deed in the Republic of Singapore)
NOTES TO THE FINANCIAL STATEMENTS
For the financial year ended 30 June 2017
-34-

9 Related party transactions (continued)
(d) UOB Kay Hian Pte Ltd is an affiliated company of United Overseas Bank Limited.
During the financial year, the Fund has brokerage fee paid or payable to UOB Kay Hian Pte Ltd as follows:
2017 2016
$ $
Brokerage charges - 1,660
United Asian Growth Opportunities Fund(Constituted under a Trust Deed in the Republic of Singapore)
NOTES TO THE FINANCIAL STATEMENTS
For the financial year ended 30 June 2017
-35-

10 Financial ratios
2017 2016$ $
Total operating expenses 305,512 424,775Average daily net asset value 17,697,600 25,988,140Expense ratio1 1.73% 1.63%
Lower of total value of purchases or sales 26,499,171 54,268,189Average daily net assets value 17,697,600 25,988,140Turnover ratio2 149.73% 208.82%
1 The expense ratio has been computed based on the guidelines laid down by the Investment Management Association of Singapore
(“IMAS”). The calculation of the Fund’s expense ratio at 30 June 2017 was based on total operating expenses divided by the average
net asset value respectively for the financial year. The total operating expenses do not include (where applicable) brokerage and other
transactions costs, performance fee, interest expense, distribution paid out to unitholders, foreign exchange gains/losses, front or
back end loads arising from the purchase or sale of other funds and tax deducted at source or arising out of income received. The
Fund does not pay any performance fee. The average net asset value is based on the daily balances.2 The portfolio turnover ratio is calculated in accordance with the formula stated in the Code on Collective Investment Schemes. The
calculation of the portfolio turnover ratiowas based on the lower of the total value of purchases or sales of the underlying investments
divided by the average daily net asset value.
United Asian Growth Opportunities Fund(Constituted under a Trust Deed in the Republic of Singapore)
NOTES TO THE FINANCIAL STATEMENTS
For the financial year ended 30 June 2017
-36-

This page has been intentionally left blank
United Asian Growth Opportunities Fund(Constituted under a Trust Deed in the Republic of Singapore)
-37-

This page has been intentionally left blank
United Asian Growth Opportunities Fund(Constituted under a Trust Deed in the Republic of Singapore)
-38-

This page has been intentionally left blank
United Asian Growth Opportunities Fund(Constituted under a Trust Deed in the Republic of Singapore)
-39-

-40-
This page has been intentionally left blank
United Asian Growth Opportunities Fund(Constituted under a Trust Deed in the Republic of Singapore)


