20
United Global Telecoms Fund Semi Annual Report for the half year ended 30 June 2017
United Global Telecoms FundSemi Annual Report
for the half year ended 30 June 2017

MANAGERUOB Asset Management LtdRegistered Address:80 Raffles PlaceUOB PlazaSingapore 048624Company Registration No. : 198600120Z
OPERATIONS ADDRESS80 Raffles Place#06-00, UOB Plaza 2Singapore 048624Tel: 1800 22 22 228
DIRECTORS OF UOB ASSET MANAGEMENTLee Wai FaiCheo Chai HongGoh Yu MinThio Boon Kiat
TRUSTEEState Street Trust (SG) Limited168 Robinson Road#33-01, Capital TowerSingapore 068912
CUSTODIAN / ADMINISTRATOR / REGISTRARState Street Bank and Trust Company, acting through its Singapore Branch168 Robinson Road#33-01, Capital TowerSingapore 068912
AUDITORSPricewaterhouseCoopers LLP8 Cross Street#17-00, PWC BuildingSingapore 048424
SOLICITORS TO THE MANAGERTan Peng Chin LLC30 Raffles Place#11-00, Chevron HouseSingapore 048622
SOLICITORS TO THE TRUSTEEShook Lin & Bok LLP1 Robinson Road#18-00, AIA TowerSingapore 048542
United Global Telecoms Fund(Constituted under a Trust Deed in the Republic of Singapore)
-1-
A) Fund Performance
Fund Performance/Benchmark Returns
3 mth%
Growth
6 mth%
Growth
1 yr%
Growth
3 yrAnn
CompRet
5 yrAnn
CompRet
10 yrAnn
CompRet
SinceInception16 August
1999Ann
CompRet
United GlobalTelecoms Fund -1.08 -2.87 -1.40 2.94 5.42 -0.20 -0.22
Benchmark -1.79 -2.92 0.02 3.64 7.22 1.37 -0.12
Source: Lipper, a Thomson Reuters Company.
Note: The performance returns of the Fund are in Singapore dollars based on a NAV-to-NAV basis with dividends and distributionsreinvested, if any.The benchmark of the Fund: MSCI ACWI Telecoms.
For the half year ended 30 June 2017, the net asset value of the Fund decrease 2.87% and the benchmark MSCI AC WorldTelecom Index declined by 2.92% (in Singapore dollar terms).
The Fund performed in-line with its benchmark, with positive contribution from securities selection in US, partially offset byunfavourable currency effects from holdings in the same region.
The top contributors to the Fund’s performance included Vodafone (UK), Softbank (JP), NTT (JP). Key detractors wereVerizon (US), AT&T (US) and China Mobile (HK).
As at 30 June 2017, the Fund had the following country asset allocation: United States (39.45%), Japan (17.70%),Germany(7.12%), United Kingdom (5.87%), France (4.88%), Hong Kong (4.66%), Others (19.55%) and Cash (0.77%).
In terms of sub-sector allocation, the Fund had 85.34% weight in Telecommunications Services providers, 9.07% in CableOperators, 4.82% in Internet companies and 0.77% in cash.
Economic and Market Review
Total shareholder return of the global telecommunications (telecom) sector dipped (in Singapore dollar terms) in the first halfof fiscal year 2017. While telecom operators in Japan, Europe and Asia Pacific ex-Japan delivered decent performance, theoverall sector performance was dragged down by strikingly poor performance by the US players.
Over the initial six months of 2017, US wireless firms ceded nearly half of the stellar share price gains from 2016. Theunderwhelming performance can be chiefly attributed to the introduction of new plans with unlimited data offerings by anincumbent in February. Moreover, hopes for a recovery were dimmed after the news media suggested that consolidation talksbetween the smaller competitors were stalled. On the other hand, stock performance of cable operators was robust over thesame period, underpinned by buoyant broadband growth momentum.
Conversely, the share prices of European telecom companies recovered modestly in the first half of 2017 after a remarkablydisappointing performance in 2016. We believe the key positive factors were favourable results driven by better-than-expectedmargins, as well as retreating political risks in the region. Notably, operators are increasingly optimistic of the opportunities forfurther operating cost efficiency despite the extended softness of top-line growth.
Telecom operators in Japanwere among the best regional share performers on expanding shareholder return, as well as risingvalue of e-commerce related investment by a player. As for other parts of Asia Pacific, share performance was fairly goodnotwithstanding a lacklustre earnings season.With the exception of Indonesia, Thailand andChina, wireless service revenuegrowth in the first quarter across all major markets were either flat or negative.
United Global Telecoms Fund(Constituted under a Trust Deed in the Republic of Singapore)
-2-

A) Fund Performance (continued)
Outlook and Fund Strategy
In US, we turned underweight on telecom operators, but keep our overweight stance on cable operators. We opine thatcompetition intensify in the telecom industry is unlikely to abate in themedium run, baring successful consolidation and renewedindustry focus on profitability over subscriber share. Cable operators are still our clear favourites in the nation, backed by theirhealthy growth prospect driven by fixed line sales.
We reverse our tactical underweight call onEuropean operators to overweight. Our bullish view stem from lowered political risksin the region, greater visibility on the impact of roaming charges abolishment starting mid-June, as well as attractive yield play.Our core preferences are telecom operators who are well positioned to benefit from wireless pricing recovery, efficiency-drivenmargin expansion, and potential in-market consolidation.
We have trimmed our overweight position in Japanese telecom service providers.We are convinced the providers can continueto drive greater shareholder return on the back of sturdy cash flows, but recognise the mildly deteriorating competitive outlookamplified by brandedwireless resellers.We stay underweight onAsia Pacific ex-Japan players primarily due to elevated threatof mobile competition and new entrants. We remain keen in operators in selected developing countries with longer-term growthpotential, but prefer to wait for firmer evidence that earnings decline has bottomed.
We will maintain a focus on high quality firms with strong franchises. Our investment targets are companies with superiornetworks, economies of scale, or differentiating technologies. The firm has to exhibit the ability to outperform in a highlycompetitive and tough regulatory environment with profitability that is commensurate with capital invested.
The Fund is mainly invested in telecom companies within developed markets which would provide strong stable growingdividends, as well as emerging market telecom operators and cable/satellite operators that provide both growth and defensivecharacteristics at reasonable valuation.
United Global Telecoms Fund(Constituted under a Trust Deed in the Republic of Singapore)
-3-

B) Investments at fair value and as a percentage of net asset value (“NAV”) as at 30 June 2017under review classified by
i) Country
Fair Value(S$)
% of NAV
Australia 195,275 1.19
Finland 372,978 2.26
France 804,775 4.88
Germany 1,172,592 7.12
Hong Kong 767,158 4.66
Indonesia 548,907 3.33
Japan 2,917,420 17.70
Mexico 346,327 2.10
Norway 443,233 2.69
Singapore 616,176 3.74
Spain 698,436 4.24
United Kingdom 967,984 5.87
United States 6,500,926 39.45
Portfolio of investments 16,352,187 99.23
Other net assets/(liabilities) 126,947 0.77
Total 16,479,134 100.00
ii) Industry
Fair Value(S$)
% of NAV
Consumer Discretionary 1,495,003 9.07
Information Technology 793,619 4.82
Telecommunication Services 14,063,565 85.34
Portfolio of investments 16,352,187 99.23
Other net assets/(liabilities) 126,947 0.77
Total 16,479,134 100.00
iii) Asset Class
Fair Value(S$) % of NAV
Quoted equities 16,352,187 99.23
Other net assets/(liabilities) 126,947 0.77
Total 16,479,134 100.00
United Global Telecoms Fund(Constituted under a Trust Deed in the Republic of Singapore)
-4-

B) Investments at fair value and as a percentage of net asset value (“NAV”) as at 30 June 2017under review classified by (continued)
iv) Credit rating of quoted bonds
N/A
C) Top Ten Holdings
10 largest holdings as at 30 June 2017
Fair Value(S$)
Percentage oftotal net assetsattributable tounitholders
%
AT&T INC 2,716,909 16.49
VERIZON COMMUNICATIONS INC 2,111,571 12.81
NIPPON TELEGRAPH & TELEPHONE CORP 1,268,832 7.70
DEUTSCHE TELEKOM AG 1,172,592 7.12
VODAFONE GROUP PLC 967,984 5.87
COMCAST CORP 878,827 5.33
KDDI CORP 834,829 5.06
SOFTBANK GROUP CORP 813,759 4.94
ALPHABET INC 793,619 4.82
CHINA MOBILE LTD 767,158 4.66
10 largest holdings as at 30 June 2016
Fair Value
Percentage oftotal net assetsattributable tounitholders
(S$) %
AT & T INC 3,623,140 18.85
VERIZON COMMUNICATIONS INC 3,051,295 15.88
NIPPON TELEGRAPH & TELEPHONE CORPORATION 1,574,305 8.19
COMCAST CORPORATION - CLASS A 1,474,019 7.67
VODAFONE GROUP PLC 1,242,935 6.47
KDDI CORPORATION 1,123,103 5.84
ORANGE SA 747,459 3.89
DEUTSCHE TELEKOM AG 726,537 3.78
CHINA MOBILE LIMITED 715,151 3.72
SINGAPORE TELECOMMUNICATIONS LTD 654,192 3.40
D) Exposure to derivatives
i) fair value of derivative contracts and as a percentage of NAV as at 30 June 2017
N/A
United Global Telecoms Fund(Constituted under a Trust Deed in the Republic of Singapore)
-5-
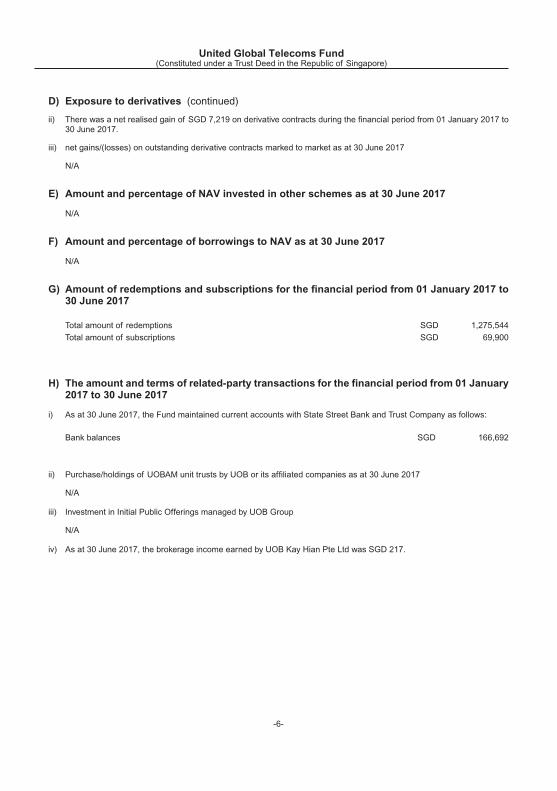
D) Exposure to derivatives (continued)
ii) There was a net realised gain of SGD 7,219 on derivative contracts during the financial period from 01 January 2017 to30 June 2017.
iii) net gains/(losses) on outstanding derivative contracts marked to market as at 30 June 2017
N/A
E) Amount and percentage of NAV invested in other schemes as at 30 June 2017
N/A
F) Amount and percentage of borrowings to NAV as at 30 June 2017
N/A
G) Amount of redemptions and subscriptions for the financial period from 01 January 2017 to30 June 2017
Total amount of redemptions SGD 1,275,544
Total amount of subscriptions SGD 69,900
H) The amount and terms of related-party transactions for the financial period from 01 January2017 to 30 June 2017
i) As at 30 June 2017, the Fund maintained current accounts with State Street Bank and Trust Company as follows:
Bank balances SGD 166,692
ii) Purchase/holdings of UOBAM unit trusts by UOB or its affiliated companies as at 30 June 2017
N/A
iii) Investment in Initial Public Offerings managed by UOB Group
N/A
iv) As at 30 June 2017, the brokerage income earned by UOB Kay Hian Pte Ltd was SGD 217.
United Global Telecoms Fund(Constituted under a Trust Deed in the Republic of Singapore)
-6-

I) Expense ratios
2017 2016
$ $
Total operating expenses 351,070 442,248
Average daily net asset value 17,903,885 19,638,323
Expense ratio 1.96% 2.25%
Note: The expense ratio has been computed based on the guidelines laid down by the Investment Management Association ofSingapore (“IMAS”). The calculation of the Fund’s expense ratio at 30 June 2017was based on total operating expenses dividedby the average net asset value respectively for the year. The total operating expenses do not include (where applicable)brokerage and other transaction costs, performance fee, interest expense, distribution paid out to unitholders, foreign exchangegains/losses, front or back end loads arising from the purchase or sale of other funds and tax deducted at source or arising outof income received. The Fund does not pay any performance fee. The average net asset value is based on the daily balances.
J) Turnover ratios
2017 2016
$ $
Lower of total value of purchases or sales 2,623,771 2,134,705
Average daily net assets value 17,509,498 19,063,226
Turnover ratio 14.98% 11.20%
Note: The portfolio turnover ratio is calculated in accordance with the formula stated in the Code on Collective Investment Schemes.The calculation of the portfolio turnover ratio was based on the lower of the total value of purchases or sales of the underlyinginvestments divided by the average daily net asset value.
K) Any material information that will adversely impact the valuation of the scheme such ascontingent liabilities of open contracts
N/A
L) For schemes which invest more than 30% of their deposited property in another scheme, thefollowing key information on the second-mentioned scheme (“the underlying scheme”)1
should be disclosed as well
i) top 10 holdings at fair value and as percentage of NAV as at 30 June 2017 and 30 June 2016
N/A
ii) expense ratios for the financial period ended 30 June 2017 and 30 June 2016
N/A
iii) turnover ratios for the financial period ended 30 June 2017 and 30 June 2016
N/A
1 where the underlying scheme is managed by a foreign manager which belongs to the same group of companies as, or has aformal arrangement or investment agreement with, the Singapore manager, the above information should be disclosed on theunderlying scheme. In other cases, such information on the underlying scheme should be disclosed only if it is readily availableto the Singapore manager.
United Global Telecoms Fund(Constituted under a Trust Deed in the Republic of Singapore)
-7-
M) Soft dollar commissions/arrangements
UOB Asset Management has entered into soft dollars arrangements with selected brokers from whom products andservices are received from third parties. The products and services relate essentially to computer hardware and softwareto the extent that they are used to support the investment decision making process, research and advisory services,economic and political analyses, portfolio analyses including performance measurements, market analyses, data andquotation services, all of which are believed to be helpful in the overall discharge of UOB Asset Management’s duties toclients. As such services generally benefit all of UOB Asset Management’s clients in terms of input into the investmentdecision making process, the soft credits utilised are not allocated on a specific client basis. The Manager confirms thattrades were executed on a best execution basis and there was no churning of trades.
N) Where the scheme offers pre-determined payouts, an explanation on the calculation of theactual payouts received by participants and any significant deviation from thepre-determined payouts
N/A
United Global Telecoms Fund(Constituted under a Trust Deed in the Republic of Singapore)
-8-
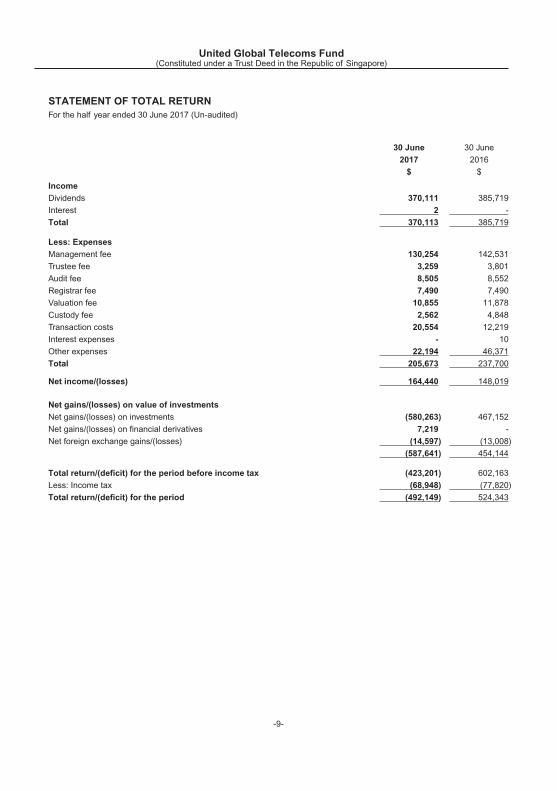
STATEMENT OF TOTAL RETURNFor the half year ended 30 June 2017 (Un-audited)
30 June 30 June
2017 2016
$ $
Income
Dividends 370,111 385,719
Interest 2 -
Total 370,113 385,719
Less: Expenses
Management fee 130,254 142,531
Trustee fee 3,259 3,801
Audit fee 8,505 8,552
Registrar fee 7,490 7,490
Valuation fee 10,855 11,878
Custody fee 2,562 4,848
Transaction costs 20,554 12,219
Interest expenses - 10
Other expenses 22,194 46,371
Total 205,673 237,700
Net income/(losses) 164,440 148,019
Net gains/(losses) on value of investments
Net gains/(losses) on investments (580,263) 467,152
Net gains/(losses) on financial derivatives 7,219 -
Net foreign exchange gains/(losses) (14,597) (13,008)
(587,641) 454,144
Total return/(deficit) for the period before income tax (423,201) 602,163
Less: Income tax (68,948) (77,820)
Total return/(deficit) for the period (492,149) 524,343
United Global Telecoms Fund(Constituted under a Trust Deed in the Republic of Singapore)
-9-

STATEMENT OF FINANCIAL POSITIONAs at 30 June 2017 (Un-audited)
30 June 31 December
2017 2016
$ $
Assets
Portfolio of investments 16,352,187 18,014,181
Receivables 81,989 65,756
Cash and bank balances 166,692 210,644
Total assets 16,600,868 18,290,581
Liabilities
Payables 121,734 113,654
Total liabilities 121,734 113,654
Equity
Net assets attributable to unitholders 16,479,134 18,176,927
United Global Telecoms Fund(Constituted under a Trust Deed in the Republic of Singapore)
-10-

STATEMENT OF MOVEMENTS OF UNITHOLDERS’ FUNDSFor the half year ended 30 June 2017 (Un-audited)
30 June 31 December
2017 2016
$ $Net assets attributable to unitholders at the beginning of the financialperiod/year 18,176,927 19,446,651
Operations
Change in net assets attributable to unitholders resulting from operations (492,149) 774,021
Unitholders’ contribution/(withdrawal)
Creation of units 69,900 208,229
Cancellation of units (1,275,544) (2,251,974)
Change in net assets attributable to unitholders resulting from net creation andcancellation of units (1,205,644) (2,043,745)
Total increase/(decrease) in net assets attributable to unitholders (1,697,793) (1,269,724)
Net assets attributable to unitholders at the end of the financial period/year 16,479,134 18,176,927
United Global Telecoms Fund(Constituted under a Trust Deed in the Republic of Singapore)
-11-
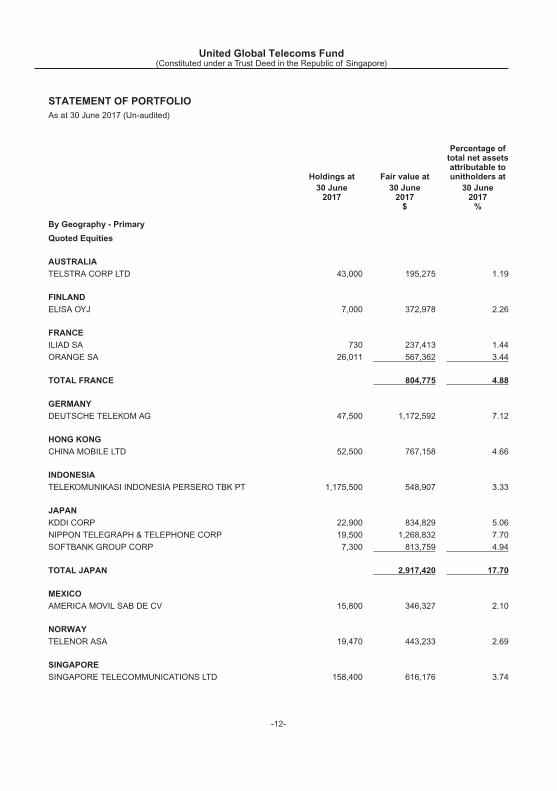
STATEMENT OF PORTFOLIOAs at 30 June 2017 (Un-audited)
Holdings at Fair value at
Percentage oftotal net assetsattributable tounitholders at
30 June2017
30 June2017$
30 June2017%
By Geography - Primary
Quoted Equities
AUSTRALIA
TELSTRA CORP LTD 43,000 195,275 1.19
FINLAND
ELISA OYJ 7,000 372,978 2.26
FRANCE
ILIAD SA 730 237,413 1.44
ORANGE SA 26,011 567,362 3.44
TOTAL FRANCE 804,775 4.88
GERMANY
DEUTSCHE TELEKOM AG 47,500 1,172,592 7.12
HONG KONG
CHINA MOBILE LTD 52,500 767,158 4.66
INDONESIA
TELEKOMUNIKASI INDONESIA PERSERO TBK PT 1,175,500 548,907 3.33
JAPAN
KDDI CORP 22,900 834,829 5.06
NIPPON TELEGRAPH & TELEPHONE CORP 19,500 1,268,832 7.70
SOFTBANK GROUP CORP 7,300 813,759 4.94
TOTAL JAPAN 2,917,420 17.70
MEXICO
AMERICA MOVIL SAB DE CV 15,800 346,327 2.10
NORWAY
TELENOR ASA 19,470 443,233 2.69
SINGAPORE
SINGAPORE TELECOMMUNICATIONS LTD 158,400 616,176 3.74
United Global Telecoms Fund(Constituted under a Trust Deed in the Republic of Singapore)
-12-

STATEMENT OF PORTFOLIOAs at 30 June 2017 (Un-audited)
Holdings at Fair value at
Percentage oftotal net assetsattributable tounitholders at
30 June2017
30 June2017$
30 June2017%
By Geography - Primary (continued)
Quoted Equities
SPAIN
TELEFONICA SA 49,210 698,436 4.24
UNITED KINGDOM
VODAFONE GROUP PLC 248,560 967,984 5.87
UNITED STATES
ALPHABET INC 620 793,619 4.82
AT&T INC 52,300 2,716,909 16.49
COMCAST CORP 16,400 878,827 5.33
VERIZON COMMUNICATIONS INC 34,340 2,111,571 12.81
TOTAL UNITED STATES 6,500,926 39.45
Total Equities 16,352,187 99.23
Portfolio of investments 16,352,187 99.23
Other net assets/(liabilities) 126,947 0.77
Net assets attributable to unitholders 16,479,134 100.00
United Global Telecoms Fund(Constituted under a Trust Deed in the Republic of Singapore)
-13-
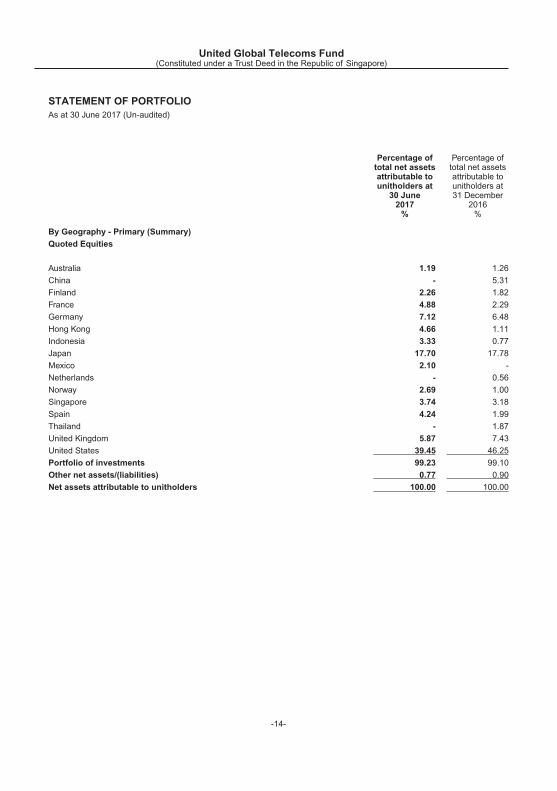
STATEMENT OF PORTFOLIOAs at 30 June 2017 (Un-audited)
Percentage oftotal net assetsattributable tounitholders at30 June2017%
Percentage oftotal net assetsattributable tounitholders at31 December
2016%
By Geography - Primary (Summary)
Quoted Equities
Australia 1.19 1.26
China - 5.31
Finland 2.26 1.82
France 4.88 2.29
Germany 7.12 6.48
Hong Kong 4.66 1.11
Indonesia 3.33 0.77
Japan 17.70 17.78
Mexico 2.10 -
Netherlands - 0.56
Norway 2.69 1.00
Singapore 3.74 3.18
Spain 4.24 1.99
Thailand - 1.87
United Kingdom 5.87 7.43
United States 39.45 46.25
Portfolio of investments 99.23 99.10
Other net assets/(liabilities) 0.77 0.90
Net assets attributable to unitholders 100.00 100.00
United Global Telecoms Fund(Constituted under a Trust Deed in the Republic of Singapore)
-14-

STATEMENT OF PORTFOLIOAs at 30 June 2017 (Un-audited)
Fair value at30 June2017$
Percentage oftotal net assetsattributable tounitholders at30 June2017%
Percentage oftotal net assetsattributable tounitholders at31 December
2016%
By Industry - Secondary
Quoted Equities
Consumer Discretionary 1,495,003 9.07 7.24
Information Technology 793,619 4.82 3.91
Telecommunication Services 14,063,565 85.34 87.95
Portfolio of investments 16,352,187 99.23 99.10
Other net assets/(liabilities) 126,947 0.77 0.90
Net assets attributable to unitholders 16,479,134 100.00 100.00
United Global Telecoms Fund(Constituted under a Trust Deed in the Republic of Singapore)
-15-

United Global Telecoms Fund(Constituted under a Trust Deed in the Republic of Singapore)
This page has been intentionally left blank.


