85
United Kingdom of Great Britain and Northern Ireland GLOBAL FOREST RESOURCES ASSESSMENT 2015 COUNTRY REPORT Rome, 2014
United Kingdom of Great Britain and Northern Ireland
GLOBAL FOREST RESOURCES ASSESSMENT 2015
COUNTRY REPORT
Rome, 2014

FAO, at the request of its member countries, regularly monitors the world´s forests and theirmanagement and uses through the Global Forest Resources Assessment (FRA). This country reportis prepared as a contribution to the FAO publication, the Global Forest Resources Assessment 2015(FRA 2015).The content and the structure are in accordance with the recommendations and guidelines given byFAO in the document Guide for country reporting for FRA 2015 (http://www.fao.org/3/a-au190e.pdf).These reports were submitted to FAO as official government documents.
The content and the views expressed in this report are the responsibility of the entity submitting thereport to FAO. FAO may not be held responsible for the use which may be made of the informationcontained in this report.
FRA 2015 – Country Report, U.K. of Great Britain and Northern Ireland
3
TABLE OF CONTENTSReport preparation and contact persons...............................................................................................................................41. What is the area of forest and other wooded land and how has it changed over time? ................................................. 52. What is the area of natural and planted forest and how has it changed over time? ..................................................... 123. What are the stocks and growth rates of the forests and how have they changed? .....................................................174. What is the status of forest production and how has it changed over time? .................................................................375. How much forest area is managed for protection of soil and water and ecosystem services? ..................................... 436. How much forest area is protected and designated for the conservation of biodiversity and how has it changed overtime? ................................................................................................................................................................................... 487. What is the area of forest affected by woody invasive species? .................................................................................. 518. How much forest area is damaged each year? ............................................................................................................ 549. What is the forest area with reduced canopy cover? ....................................................................................................5810. What forest policy and regulatory framework exists to support implementation of sustainable forest managementSFM? .................................................................................................................................................................................. 5911. Is there a national platform that promotes stakeholder participation in forest policy development? ............................ 6212. What is the forest area intended to be in permanent forest land use and how has it changed over time? .................. 6313. How does your country measure and report progress towards SFM at the national level? ........................................ 6614. What is the area of forest under a forest management plan and how is this monitored? ........................................... 6915. How are stakeholders involved in the management decision making for publicly owned forests? .............................. 7116. What is the area of forest under an independently verified forest certification scheme? .............................................7217. How much money do governments collect from and spend on forests? .....................................................................7418. Who owns and manages the forests and how has this changed? ..............................................................................7619. How many people are directly employed in forestry? ................................................................................................. 8120. What is the contribution of forestry to Gross Domestic Product (GDP)? .................................................................... 8321. What is forest area likely to be in the future ...............................................................................................................84
FRA 2015 – Country Report, U.K. of Great Britain and Northern Ireland
4
Report preparation and contact personsContact personsThe present report was prepared by the following person(s)
Name (FAMILYNAME, first name)
Institution/address Email Tables
WARD, Sheila Forestry Commission 231Corstorphine Road EdinburghEH12 7AT UK
N/A N/A N/A N/A
N/A N/A N/A N/A
N/A N/A N/A N/A
Introductory TextPlace an introductory text on the content of this report
The UK data for this Forest Resources Assessment has, to a great extent, been revised substantially fromprevious FRA submissions by the UK. The main reason for change is the switch to using interim results fromthe current National Forest Inventory for forest areas and growing stock in Great Britain, in place of resultsfrom earlier inventories.
The National Forest Inventory field survey programme started in 2009 and is being conducted on a continuous 5year cycle. Full results from the first full cycle will not be available until 2015. Changes in methodologies andimprovements in technology between this and previous inventories have resulted in inconsistencies betweenthe results derived from the National Forest Inventory and those from previous inventories. As a result, figuresfor earlier years have been revised to produce time series that are consistent with the latest results from theNational Forest Inventory.
As the results that are currently available are based on data for selected variables from partial fieldwork, theestimates used here are expected to be revised once full survey results are produced. Data for a wider range ofvariables will also be available after fieldwork for the first cycle has concluded. In addition, improved estimatesof change will be produced once sufficient results are available from the second cycle, for which the fieldworkis due to be conducted between 2015 and 2020, when direct comparisons between cycles can be made.
Further details on the National Forest Inventory and previous inventories are available at http://www.forestry.gov.uk/inventory
Desk Study?
Check "yes" if this survey is a Desk Study, "no" otherwise
Desk Study? no
FRA 2015 – Country Report, U.K. of Great Britain and Northern Ireland
5
1. What is the area of forest and other wooded land and how has it changed over time?Documents for this question:
• Guide for country reporting FRA 2015• FRA 2015 Terms and Definitions
1.1 Categories and definitions
Category Definition
Forest Land spanning more than 0.5 hectares with trees higher than 5 meters and a canopy cover of more than10 percent or trees able to reach these thresholds in situ. It does not include land that is predominantlyunder agricultural or urban land use.
Other wooded land Land not classified as "Forest" spanning more than 0.5 hectares with trees higher than 5 meters anda canopy cover of 5-10 percent or trees able to reach these thresholds ; or with a combined coverof shrubs bushes and trees above 10 percent. It does not include land that is predominantly underagricultural or urban land use.
Other land All land that is not classified as "Forest" or "Other wooded land".
...of which with tree cover(sub-category)
Land considered as "Other land", that is predominantly agricultural or urban lands use and has patchesof tree cover that span more than 0.5 hectares with a canopy cover of more than 10 percent of trees ableto reach a height of 5 meters at maturity. It includes bothe forest and non-forest tree species.
Inland water bodies Inland water bodies generally include major rivers, lakes and water reservoirs.
Forest expansion Expansion of forest on land that, until then, was not defined as forest.
...of which afforestation(sub-category)
Establishment of forest through planting and/or deliberate seeding on land that, until then, was notdefined as forest.
...of which naturalexpansion of forest (sub-category)
Expansion of forests through natural succession on land that, until then, was under another land use(e.g. forest succession on land previously used for agriculture).
Deforestation The conversion of forest to other land use or the longterm reduction of the tree canopy cover below theminimum 10 percent threshold.
...of which humaninduced (sub-category)
Human induced conversion of forest to other land use or the permanent reduction of the tree canopycover below the minimum 10 percent threshold.
Reforestation Natural regeneration or re-establishment of forest through planting and/or deliberate seeding on landalready in forest land use.
...of which artificialreforestation (sub-category)
Re-establishment of forest through planting and/or deliberate seeding on land already in forest land use.
1.2 National data
1.2.1 Data sources
References to sourcesof information
Variables Years Additional comments

FRA 2015 – Country Report, U.K. of Great Britain and Northern Ireland
6
1 Forestry Commission, 2013.Forestry Statistics 2013 (andsupporting data). UK.
Forest, Forest expansion,Reforestation
2000 - 2013 Woodland area based onNational Forest Inventory(GB) and Forest Serviceestimates (NI). Newplanting and restocking fromsupporting time series data.
2 TBFRA 2000 and FRA 2010 Other wooded land 1990 - 2010 Estimate unchanged fromTBFRA 2000
3 Defra, 2013. Agriculture inthe UK 2012. UK.
Other land with tree cover 1990 - 2010 Area of orchards fromagricultural censuses
4 FRA 2015 Working Paper -Guide for country reporting
Total, Inland water 2009 N/A
5 Forestry Commission, 2011.National Forest InventoryWoodland Area Statistics:Great Britain. GB.
Deforestation 1995/ 1997/ 1998 to 2010 Estimate of permanentobservable woodland losssince previous inventory.Excludes areas notimmediately identifiable aspermanent woodland loss(e.g. restoration of openhabitats).
1.2.2 Classification and definitions
National class Definition
Woodland As "forest" in FRA, but with 20% canopy cover threshold (ratherthan 10%).
Orchard Area of fruit trees (from agricultural censuses).
New planting New woodland creation (including estimates of naturalcolonisation). Data for years ending 31 March.
Restocking Replanting of existing woodland (including estimates of naturalregeneration). Data for years ending 31 March.
Woodland loss Observable permanent woodland loss.
1.2.3 Original data
Estimates of UK woodland area (from supporting data for Forestry Statistics 2013 (ref 1)):
Thousand hectares
Year 2000 2005 2010 2013
UK woodland area 2,954 3,021 3,059 3,127
Areas of orchards from UK agricultural censuses (ref 2) are:

FRA 2015 – Country Report, U.K. of Great Britain and Northern Ireland
7
Thousand hectares
Year 1990 2000 2005 2010 2012
UK area oforchard fruit
34 28 23 24 24
From FRA 2010 (ref 3), the area of other wooded land is assumed to be a constant estimate over all time periods,of 20 thousand hectares.
Official FAOSTAT estimate (ref 4) of total UK area is 24,361 thousand hectares in 2009. The same sourcegives estimate of 168 thousand hectares for inland water.
Annual estimates of new planting and restocking (from Forestry Statistics 2013 & supporting data (ref 1)),combined to produce 5 year averages:
Thousand hectares
1988-89 to1992-93
1998-99 to 2002-03 2003-04 to 2007-08 2008-09 to 2012-13
New planting
Conifer 15 5 2 2
Broadleaf 6 11 8 7
Total 22 16 10 9
Restocking
Conifer 11 12 14 10
Broadleaf 5 3 3 4
Total 16 15 17 14
Changes to grant scheme rules can affect the level of grant aided planting (and therefore the total estimatedplanting levels). This is a particular issue for Sitka spruce restocking in Scotland, where rule changes haveresulted in a reduction to the figures from 2010.
Reliable data on the breakdown of new planting and restocking data into planted and natural colonisation/regeneration are not available.
National Forest Inventory (ref 5) reported a total of 0.5 thousand hectares of permanent observable woodlandloss in Great Britain over a 10 to 15 year period, based on a comparison of differences in woodland mapsproduced from the National Forest Inventory and the previous inventory. No comparable figures are availablefor Northern Ireland.
1.3 Analysis and processing of national data
FRA 2015 – Country Report, U.K. of Great Britain and Northern Ireland
8
1.3.1 Adjustment
No adjustment required.
1.3.2 Estimation and forecasting
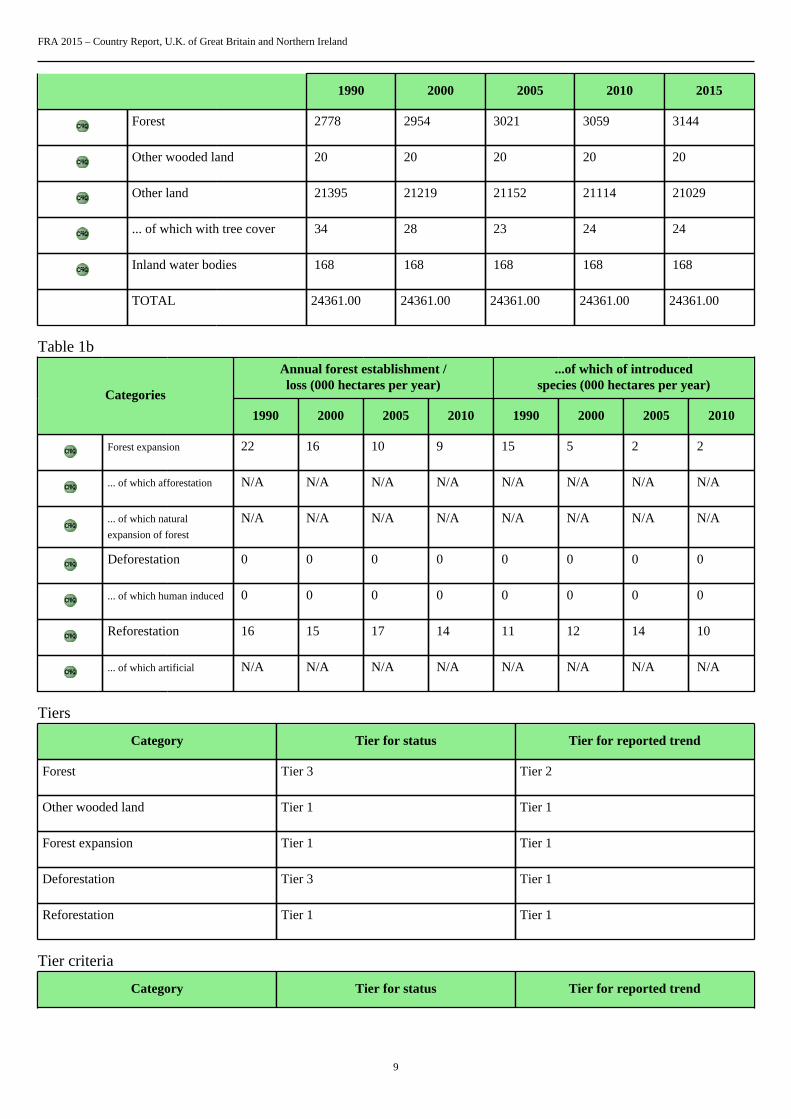
Average annual new planting data for latest period from Table 1b, for 2 years, is added to latest (2013) estimateof UK woodland area to provide an estimate for woodland area in 2015.
2015 forecast = 2013 estimate + 2 * average annual planting in 2008-09 to 2012-13
= 3,144 thousand hectares.
National Forest Inventory-based woodland area estimates were also rolled back, using new planting anddeforestation estimates, to produce a revised estimate for woodland area in 1990 that is consistent with thefigures shown for subsequent years. This gives an estimate of 2,778 thousand hectares for 1990.
Other land with tree cover - 2015 estimate assumes no change from 2012 (latest data available).
Total land area and inland water - 2009 estimates have been used as constant estimates for entire reportingperiod.
Other wooded land - Estimates for 1990 to 2010 (from TBFRA 2000 and FRA 2010 (ref 2)) are constant. Thisvalue is continued for 2015, to give constant estimates over the entire time period.
Other land is calculated as a residual for all years, i.e. total less forest, other wooded land and inland waterbodies.
Annual estimates of woodland loss (deforestation) have been derived by assuming that the level of woodlandloss in Great Britain has been constant over time and that the level of woodland loss in Northern Ireland isnegligible. This has been projected forward to 2015 and projected back beyond previous inventory (to 1990).
Information is not available for new planting and restocking of native v introduced species. As most coniferspecies are introduced and most broadleaf species are native, it is assumed that the areas of native coniferexpansion/ reforestation will be similar to the areas of introduced broadleaf expansion/ reforestation.
1.3.3 Reclassification
No reclassification is required.
1.4 DataTable 1a
Categories Area (000 hectares)
FRA 2015 – Country Report, U.K. of Great Britain and Northern Ireland
9
1990 2000 2005 2010 2015
Forest 2778 2954 3021 3059 3144
Other wooded land 20 20 20 20 20
Other land 21395 21219 21152 21114 21029
... of which with tree cover 34 28 23 24 24
Inland water bodies 168 168 168 168 168
TOTAL 24361.00 24361.00 24361.00 24361.00 24361.00
Table 1bAnnual forest establishment /loss (000 hectares per year)
...of which of introducedspecies (000 hectares per year)
Categories
1990 2000 2005 2010 1990 2000 2005 2010
Forest expansion 22 16 10 9 15 5 2 2
... of which afforestation N/A N/A N/A N/A N/A N/A N/A N/A
... of which natural
expansion of forest
N/A N/A N/A N/A N/A N/A N/A N/A
Deforestation 0 0 0 0 0 0 0 0
... of which human induced 0 0 0 0 0 0 0 0
Reforestation 16 15 17 14 11 12 14 10
... of which artificial N/A N/A N/A N/A N/A N/A N/A N/A
Tiers
Category Tier for status Tier for reported trend
Forest Tier 3 Tier 2
Other wooded land Tier 1 Tier 1
Forest expansion Tier 1 Tier 1
Deforestation Tier 3 Tier 1
Reforestation Tier 1 Tier 1
Tier criteria
Category Tier for status Tier for reported trend
FRA 2015 – Country Report, U.K. of Great Britain and Northern Ireland
10
• Forest• Other wooded land• Afforestation• Reforestation• Natural expansion of forest• Deforestation
Tier 3 : Data sources: Either recent(less than 10 years ago) National ForestInventory or remote sensing, with groundtruthing, or programme for repeatedcompatible NFIs Tier 2 : Data sources:Full cover mapping / remote sensing orold NFI (more than 10 years ago) Tier 1 :Other
Tier 3 : Estimate based on repeatedcompatible tiers 3 (tier for status) Tier 2 :Estimate based on repeated compatible tier2 or combination tier 3 and 2 or 1 (tier forstatus) Tier 1 : Other
1.5 Comments
CategoryComments related todata definitions etc
Comments on the reported trends
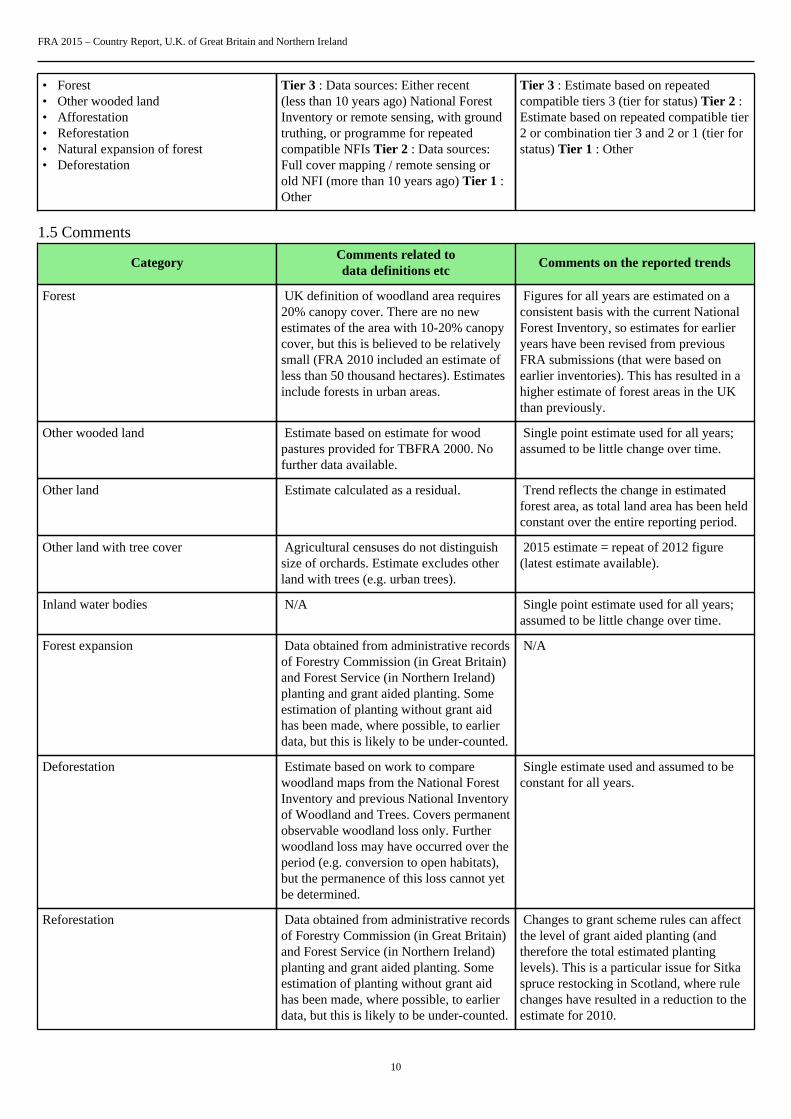
Forest UK definition of woodland area requires20% canopy cover. There are no newestimates of the area with 10-20% canopycover, but this is believed to be relativelysmall (FRA 2010 included an estimate ofless than 50 thousand hectares). Estimatesinclude forests in urban areas.
Figures for all years are estimated on aconsistent basis with the current NationalForest Inventory, so estimates for earlieryears have been revised from previousFRA submissions (that were based onearlier inventories). This has resulted in ahigher estimate of forest areas in the UKthan previously.
Other wooded land Estimate based on estimate for woodpastures provided for TBFRA 2000. Nofurther data available.
Single point estimate used for all years;assumed to be little change over time.
Other land Estimate calculated as a residual. Trend reflects the change in estimatedforest area, as total land area has been heldconstant over the entire reporting period.
Other land with tree cover Agricultural censuses do not distinguishsize of orchards. Estimate excludes otherland with trees (e.g. urban trees).
2015 estimate = repeat of 2012 figure(latest estimate available).
Inland water bodies N/A Single point estimate used for all years;assumed to be little change over time.
Forest expansion Data obtained from administrative recordsof Forestry Commission (in Great Britain)and Forest Service (in Northern Ireland)planting and grant aided planting. Someestimation of planting without grant aidhas been made, where possible, to earlierdata, but this is likely to be under-counted.
N/A
Deforestation Estimate based on work to comparewoodland maps from the National ForestInventory and previous National Inventoryof Woodland and Trees. Covers permanentobservable woodland loss only. Furtherwoodland loss may have occurred over theperiod (e.g. conversion to open habitats),but the permanence of this loss cannot yetbe determined.
Single estimate used and assumed to beconstant for all years.
Reforestation Data obtained from administrative recordsof Forestry Commission (in Great Britain)and Forest Service (in Northern Ireland)planting and grant aided planting. Someestimation of planting without grant aidhas been made, where possible, to earlierdata, but this is likely to be under-counted.
Changes to grant scheme rules can affectthe level of grant aided planting (andtherefore the total estimated plantinglevels). This is a particular issue for Sitkaspruce restocking in Scotland, where rulechanges have resulted in a reduction to theestimate for 2010.

FRA 2015 – Country Report, U.K. of Great Britain and Northern Ireland
11
Other general comments to the table
N/A

FRA 2015 – Country Report, U.K. of Great Britain and Northern Ireland
12
2. What is the area of natural and planted forest and how has it changed over time?Documents for this question:
• Guide for country reporting FRA 2015• FRA 2015 Terms and Definitions
2.1 Categories and definitions
Term Definition
Naturally regeneratedforest
Forest predominantly composed of trees established through natural regeneration.
Naturalized introducedspecies
Other naturally regenerated forest where the tree species are predominantly non-native and do not needhuman help to reproduce/maintain populations over time.
Introduced species A species, subspecies or lower taxon occurring outside its natural range (past or present) and dispersalpotential (i.e. outside the range it occupies naturally or could occupy without direct or indirectintroduction or care by humans).
Category Definition
Primary forest Naturally regenerated forest of native species where there are no clearly visible indications of humanactivities and the ecological processes are not significantly disturbed.
Other naturallyregenerated forest
Naturally regenerated forest where there are clearly visible indications of human activities.
...of which of introducedspecies (sub-category)
Other naturally regenerated forest where the trees are predominantly of introduced species.
...of which naturalized(sub-sub category)
Other naturally regenerated forest where the trees are predominantly of naturalized introduced species.
Planted forest Forest predominantly composed of trees established through planting and/or deliberate seeding.
...of which of introducedspecies (sub-category)
Planted forest where the planted/seeded trees are predominantly of introduced species.
Mangroves Area of forest and other wooded land with mangrove vegetation.
...of which planted (sub-category)
Mangroves predominantly composed of trees established through planting.
2.2 National data
2.2.1 Data sources
References to sourcesof information
Variables Years Additional comments
1 Natural England, 2013.English Ancient Woodlandmap. UK.
Other naturally regenerated 2013 Excluding Plantations onAncient Woodland Sites(PAWS).
2 Forestry CommissionWales, 2011. Welsh AncientWoodland map. UK.
Other naturally regenerated 2011 N/A
FRA 2015 – Country Report, U.K. of Great Britain and Northern Ireland
13
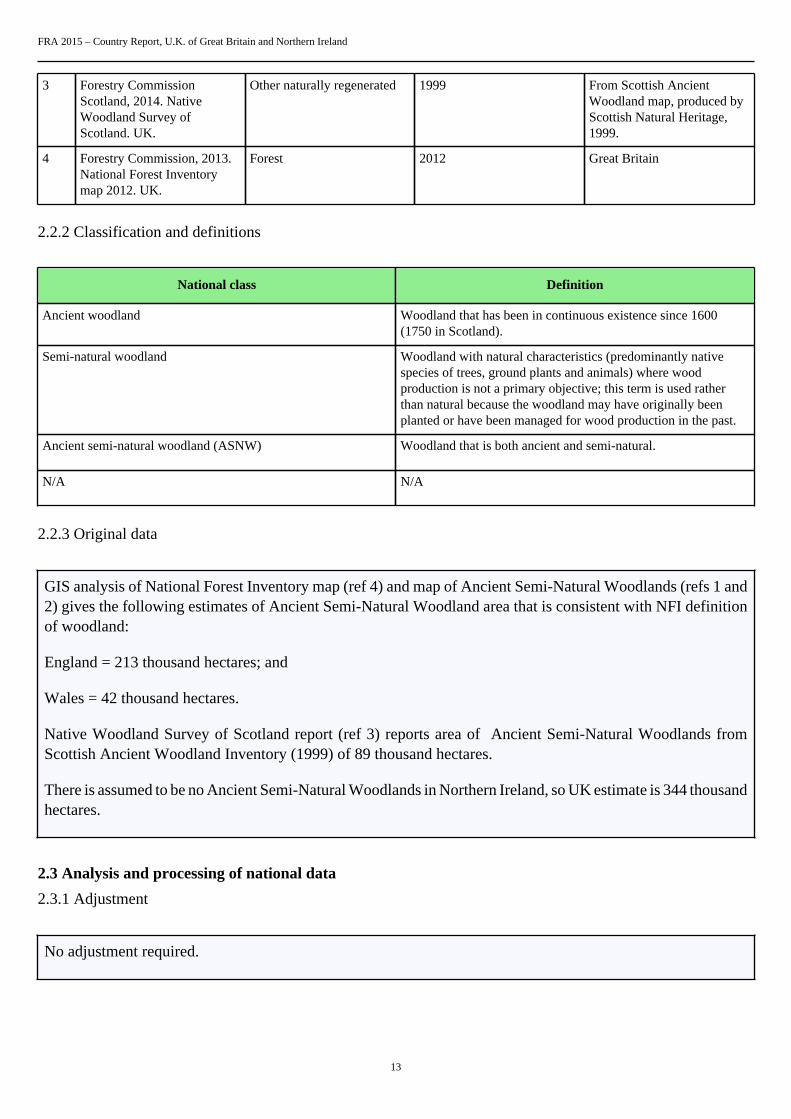
3 Forestry CommissionScotland, 2014. NativeWoodland Survey ofScotland. UK.
Other naturally regenerated 1999 From Scottish AncientWoodland map, produced byScottish Natural Heritage,1999.
4 Forestry Commission, 2013.National Forest Inventorymap 2012. UK.
Forest 2012 Great Britain
2.2.2 Classification and definitions
National class Definition
Ancient woodland Woodland that has been in continuous existence since 1600(1750 in Scotland).
Semi-natural woodland Woodland with natural characteristics (predominantly nativespecies of trees, ground plants and animals) where woodproduction is not a primary objective; this term is used ratherthan natural because the woodland may have originally beenplanted or have been managed for wood production in the past.
Ancient semi-natural woodland (ASNW) Woodland that is both ancient and semi-natural.
N/A N/A
2.2.3 Original data
GIS analysis of National Forest Inventory map (ref 4) and map of Ancient Semi-Natural Woodlands (refs 1 and2) gives the following estimates of Ancient Semi-Natural Woodland area that is consistent with NFI definitionof woodland:
England = 213 thousand hectares; and
Wales = 42 thousand hectares.
Native Woodland Survey of Scotland report (ref 3) reports area of Ancient Semi-Natural Woodlands fromScottish Ancient Woodland Inventory (1999) of 89 thousand hectares.
There is assumed to be no Ancient Semi-Natural Woodlands in Northern Ireland, so UK estimate is 344 thousandhectares.
2.3 Analysis and processing of national data
2.3.1 Adjustment
No adjustment required.

FRA 2015 – Country Report, U.K. of Great Britain and Northern Ireland
14
2.3.2 Estimation and forecasting
There is assumed to be no primary forest in the UK.
The area of Ancient Semi-Natural Woodland has been used as a proxy measure for the area of other naturallyregenerated forest.
The area of planted forest is calculated as a residual (total forest from table 1a less estimated other naturallyregenerated forest).
Data on introduced species with forest types are not currently available.
There are no mangroves in the UK.
2.3.3 Reclassification
No further reclassification required.
2.4 DataTable 2a
Forest area (000 hectares)Categories
1990 2000 2005 2010 2015
Primary forest 0 0 0 0 0
Other naturally regeneratedforest
N/A N/A N/A 344 N/A
... of which of introducedspecies
N/A N/A N/A N/A N/A
... of which naturalized N/A N/A N/A N/A N/A
Planted forest N/A N/A N/A 2716 N/A
... of which of introducedspecies
N/A N/A N/A N/A N/A
TOTAL .00 .00 .00 3060.00 .00
Table 2b
Primary forest converted to (000 ha)
1990-2000 2000-2010 2010-2015
FRA 2015 – Country Report, U.K. of Great Britain and Northern Ireland
15
Othernatural
regenerationPlanted Other land
Othernatural
regenerationPlanted Other land
Othernatural
regenerationPlanted Other land
0 0 0 0 0 0 0 0 0
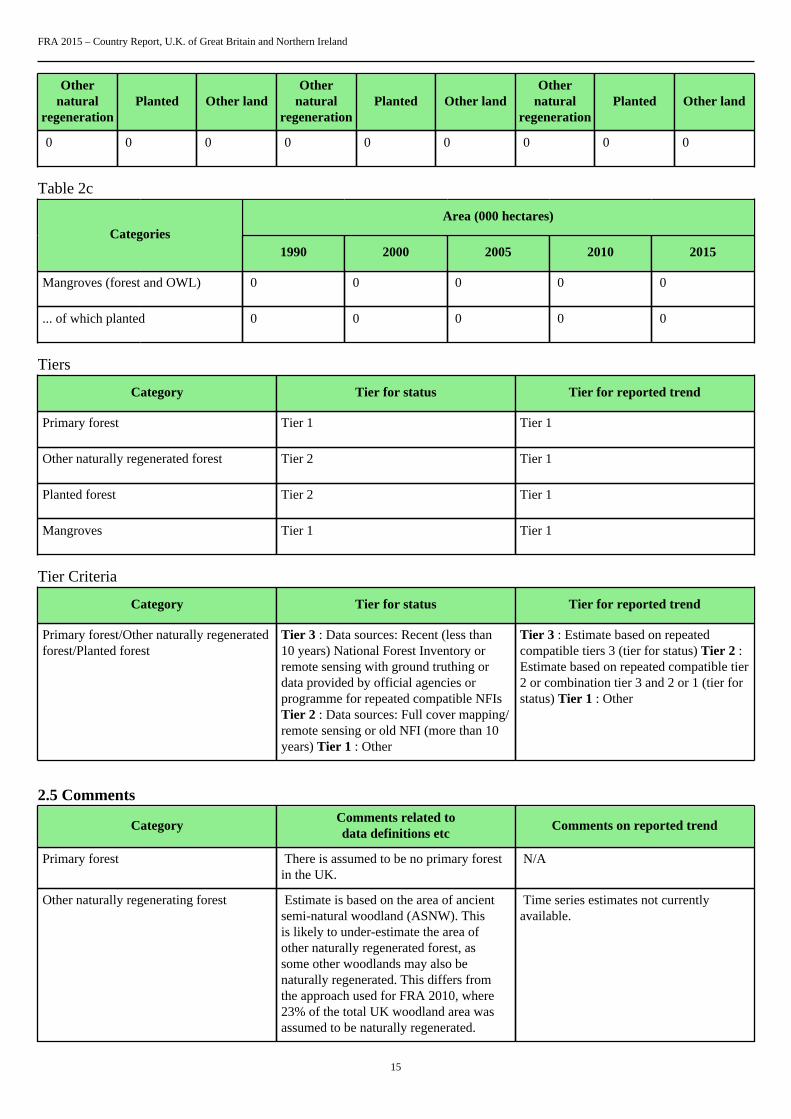
Table 2c
Area (000 hectares)Categories
1990 2000 2005 2010 2015
Mangroves (forest and OWL) 0 0 0 0 0
... of which planted 0 0 0 0 0
Tiers
Category Tier for status Tier for reported trend
Primary forest Tier 1 Tier 1
Other naturally regenerated forest Tier 2 Tier 1
Planted forest Tier 2 Tier 1
Mangroves Tier 1 Tier 1
Tier Criteria
Category Tier for status Tier for reported trend
Primary forest/Other naturally regeneratedforest/Planted forest
Tier 3 : Data sources: Recent (less than10 years) National Forest Inventory orremote sensing with ground truthing ordata provided by official agencies orprogramme for repeated compatible NFIsTier 2 : Data sources: Full cover mapping/remote sensing or old NFI (more than 10years) Tier 1 : Other
Tier 3 : Estimate based on repeatedcompatible tiers 3 (tier for status) Tier 2 :Estimate based on repeated compatible tier2 or combination tier 3 and 2 or 1 (tier forstatus) Tier 1 : Other
2.5 Comments
CategoryComments related todata definitions etc
Comments on reported trend
Primary forest There is assumed to be no primary forestin the UK.
N/A
Other naturally regenerating forest Estimate is based on the area of ancientsemi-natural woodland (ASNW). Thisis likely to under-estimate the area ofother naturally regenerated forest, assome other woodlands may also benaturally regenerated. This differs fromthe approach used for FRA 2010, where23% of the total UK woodland area wasassumed to be naturally regenerated.
Time series estimates not currentlyavailable.

FRA 2015 – Country Report, U.K. of Great Britain and Northern Ireland
16
Planted forest Estimate calculated as a residual. Time series estimates not currentlyavailable.
Mangroves There are no mangroves in the UK. N/A
Other general comments to the table
It is difficult to provide an objective measure of the naturally regenerated v planted areas, particularly given that most UKwoodlands are of plantation origin. An alternative approach might be to use the area of broadleaved woodland as a proxy for thearea of naturally regenerated forest, but this is likely to be an over-estimate.
FRA 2015 – Country Report, U.K. of Great Britain and Northern Ireland
17
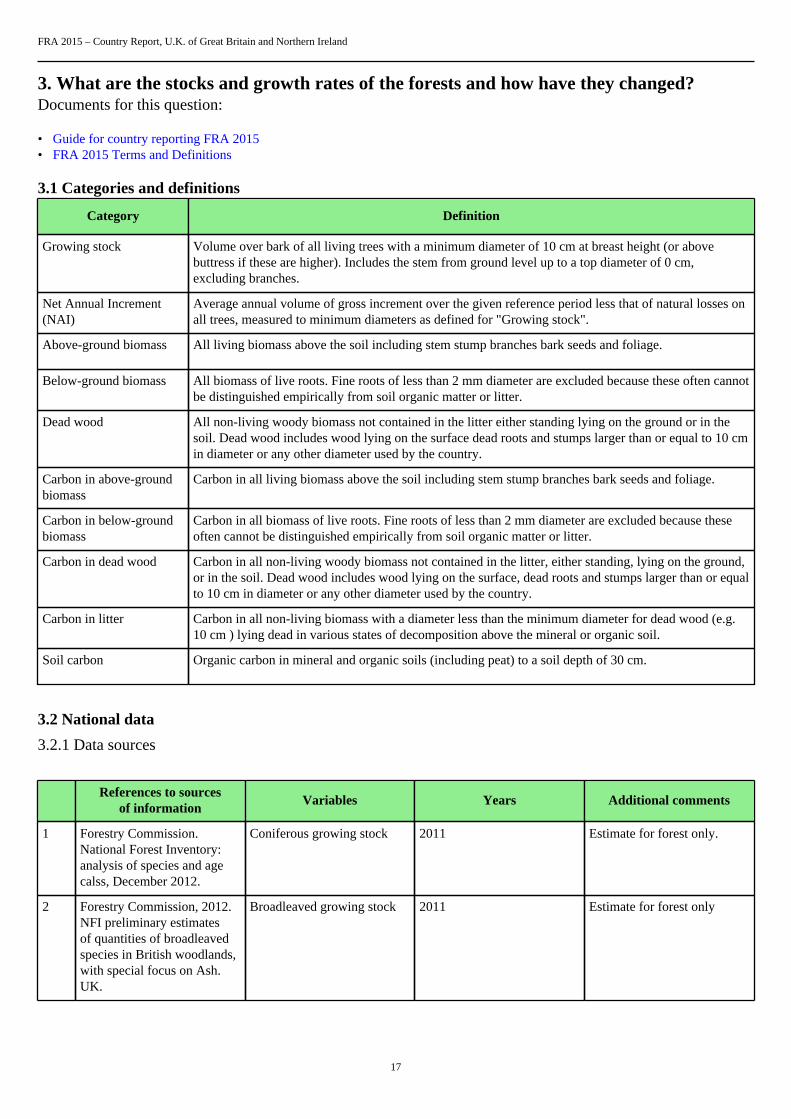
3. What are the stocks and growth rates of the forests and how have they changed?Documents for this question:
• Guide for country reporting FRA 2015• FRA 2015 Terms and Definitions
3.1 Categories and definitions
Category Definition
Growing stock Volume over bark of all living trees with a minimum diameter of 10 cm at breast height (or abovebuttress if these are higher). Includes the stem from ground level up to a top diameter of 0 cm,excluding branches.
Net Annual Increment(NAI)
Average annual volume of gross increment over the given reference period less that of natural losses onall trees, measured to minimum diameters as defined for "Growing stock".
Above-ground biomass All living biomass above the soil including stem stump branches bark seeds and foliage.
Below-ground biomass All biomass of live roots. Fine roots of less than 2 mm diameter are excluded because these often cannotbe distinguished empirically from soil organic matter or litter.
Dead wood All non-living woody biomass not contained in the litter either standing lying on the ground or in thesoil. Dead wood includes wood lying on the surface dead roots and stumps larger than or equal to 10 cmin diameter or any other diameter used by the country.
Carbon in above-groundbiomass
Carbon in all living biomass above the soil including stem stump branches bark seeds and foliage.
Carbon in below-groundbiomass
Carbon in all biomass of live roots. Fine roots of less than 2 mm diameter are excluded because theseoften cannot be distinguished empirically from soil organic matter or litter.
Carbon in dead wood Carbon in all non-living woody biomass not contained in the litter, either standing, lying on the ground,or in the soil. Dead wood includes wood lying on the surface, dead roots and stumps larger than or equalto 10 cm in diameter or any other diameter used by the country.
Carbon in litter Carbon in all non-living biomass with a diameter less than the minimum diameter for dead wood (e.g.10 cm ) lying dead in various states of decomposition above the mineral or organic soil.
Soil carbon Organic carbon in mineral and organic soils (including peat) to a soil depth of 30 cm.
3.2 National data
3.2.1 Data sources
References to sourcesof information
Variables Years Additional comments
1 Forestry Commission.National Forest Inventory:analysis of species and agecalss, December 2012.
Coniferous growing stock 2011 Estimate for forest only.
2 Forestry Commission, 2012.NFI preliminary estimatesof quantities of broadleavedspecies in British woodlands,with special focus on Ash.UK.
Broadleaved growing stock 2011 Estimate for forest only
FRA 2015 – Country Report, U.K. of Great Britain and Northern Ireland
18
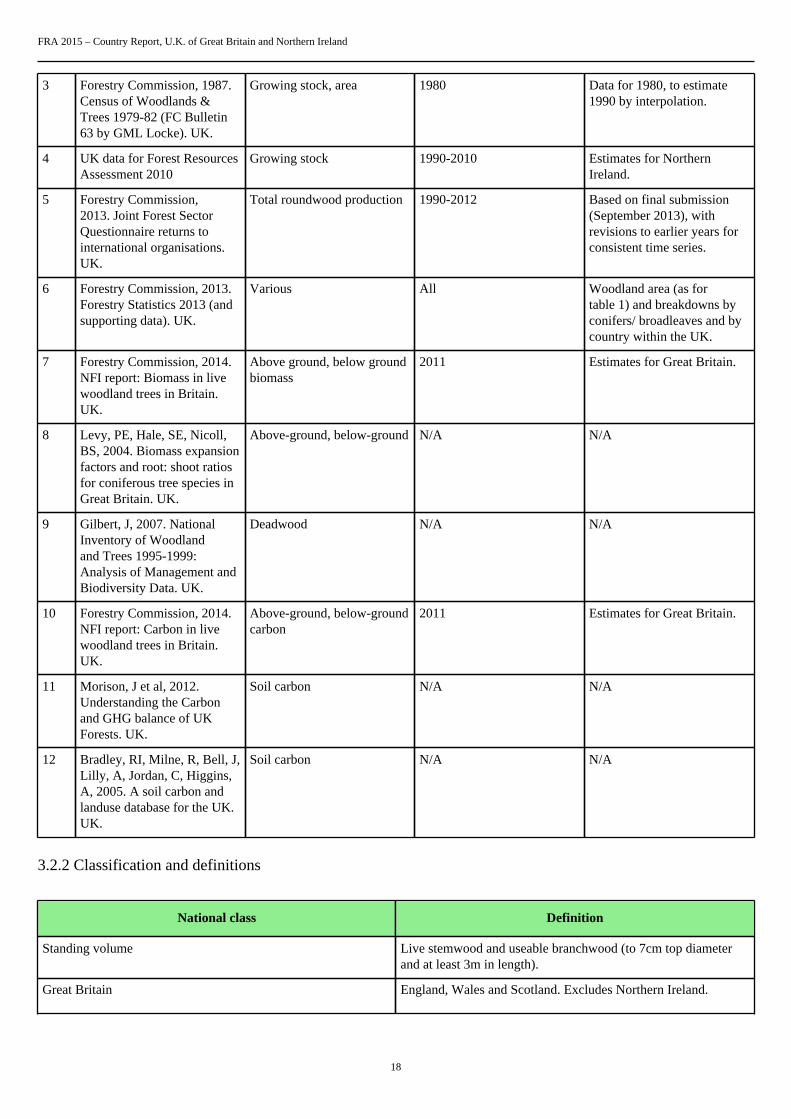
3 Forestry Commission, 1987.Census of Woodlands &Trees 1979-82 (FC Bulletin63 by GML Locke). UK.
Growing stock, area 1980 Data for 1980, to estimate1990 by interpolation.
4 UK data for Forest ResourcesAssessment 2010
Growing stock 1990-2010 Estimates for NorthernIreland.
5 Forestry Commission,2013. Joint Forest SectorQuestionnaire returns tointernational organisations.UK.
Total roundwood production 1990-2012 Based on final submission(September 2013), withrevisions to earlier years forconsistent time series.
6 Forestry Commission, 2013.Forestry Statistics 2013 (andsupporting data). UK.
Various All Woodland area (as fortable 1) and breakdowns byconifers/ broadleaves and bycountry within the UK.
7 Forestry Commission, 2014.NFI report: Biomass in livewoodland trees in Britain.UK.
Above ground, below groundbiomass
2011 Estimates for Great Britain.
8 Levy, PE, Hale, SE, Nicoll,BS, 2004. Biomass expansionfactors and root: shoot ratiosfor coniferous tree species inGreat Britain. UK.
Above-ground, below-ground N/A N/A
9 Gilbert, J, 2007. NationalInventory of Woodlandand Trees 1995-1999:Analysis of Management andBiodiversity Data. UK.
Deadwood N/A N/A
10 Forestry Commission, 2014.NFI report: Carbon in livewoodland trees in Britain.UK.
Above-ground, below-groundcarbon
2011 Estimates for Great Britain.
11 Morison, J et al, 2012.Understanding the Carbonand GHG balance of UKForests. UK.
Soil carbon N/A N/A
12 Bradley, RI, Milne, R, Bell, J,Lilly, A, Jordan, C, Higgins,A, 2005. A soil carbon andlanduse database for the UK.UK.
Soil carbon N/A N/A
3.2.2 Classification and definitions
National class Definition
Standing volume Live stemwood and useable branchwood (to 7cm top diameterand at least 3m in length).
Great Britain England, Wales and Scotland. Excludes Northern Ireland.
FRA 2015 – Country Report, U.K. of Great Britain and Northern Ireland
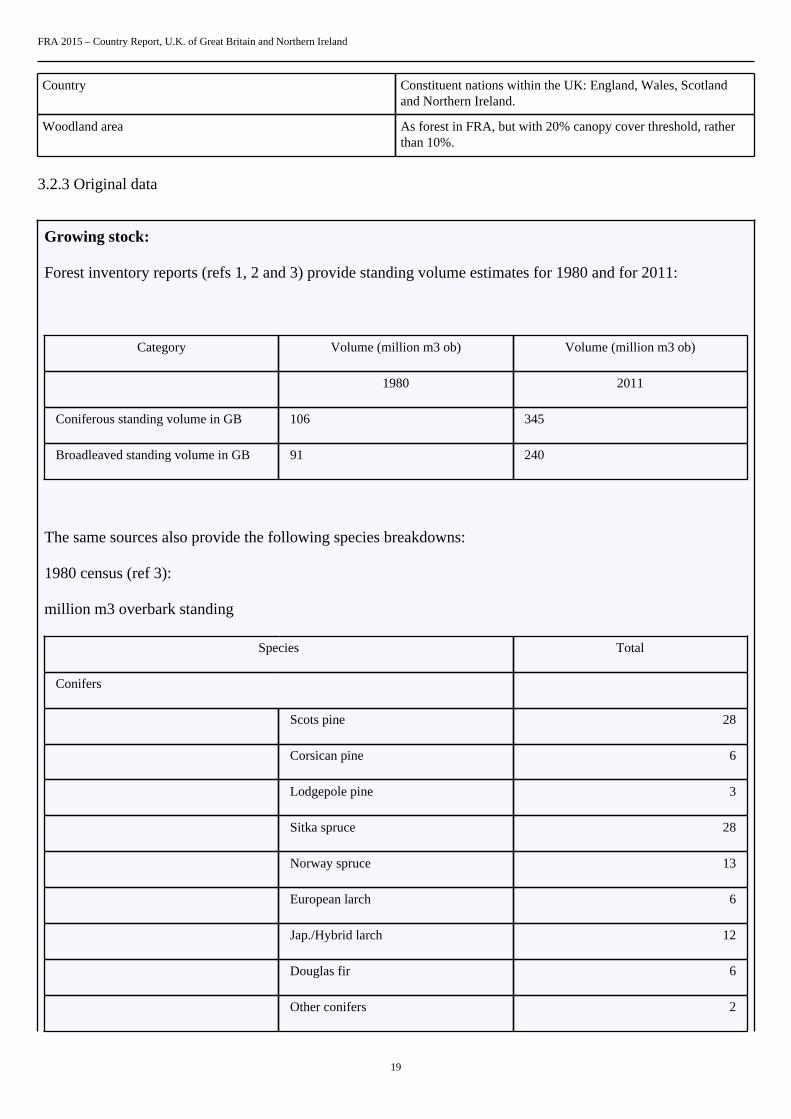
19
Country Constituent nations within the UK: England, Wales, Scotlandand Northern Ireland.
Woodland area As forest in FRA, but with 20% canopy cover threshold, ratherthan 10%.
3.2.3 Original data
Growing stock:
Forest inventory reports (refs 1, 2 and 3) provide standing volume estimates for 1980 and for 2011:
Category Volume (million m3 ob) Volume (million m3 ob)
1980 2011
Coniferous standing volume in GB 106 345
Broadleaved standing volume in GB 91 240
The same sources also provide the following species breakdowns:
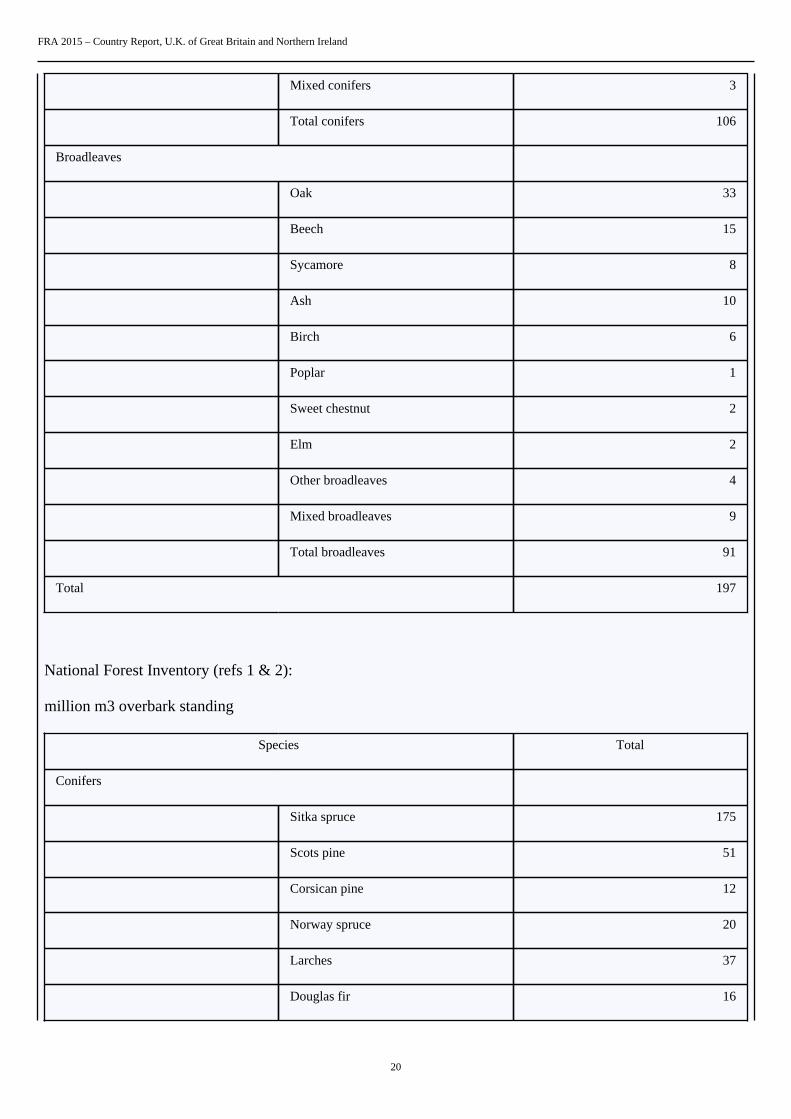
1980 census (ref 3):
million m3 overbark standing
Species Total
Conifers
Scots pine 28
Corsican pine 6
Lodgepole pine 3
Sitka spruce 28
Norway spruce 13
European larch 6
Jap./Hybrid larch 12
Douglas fir 6
Other conifers 2
FRA 2015 – Country Report, U.K. of Great Britain and Northern Ireland
20
Mixed conifers 3
Total conifers 106
Broadleaves
Oak 33
Beech 15
Sycamore 8
Ash 10
Birch 6
Poplar 1
Sweet chestnut 2
Elm 2
Other broadleaves 4
Mixed broadleaves 9
Total broadleaves 91
Total 197
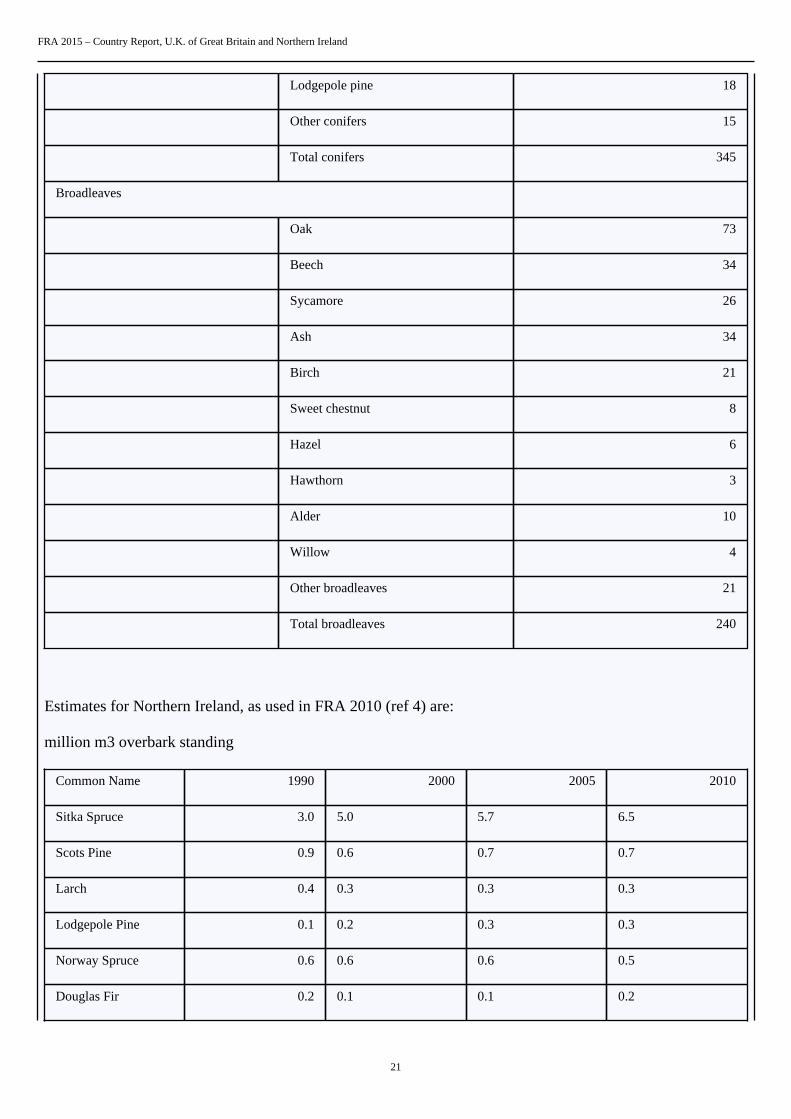
National Forest Inventory (refs 1 & 2):
million m3 overbark standing
Species Total
Conifers
Sitka spruce 175
Scots pine 51
Corsican pine 12
Norway spruce 20
Larches 37
Douglas fir 16
FRA 2015 – Country Report, U.K. of Great Britain and Northern Ireland
21
Lodgepole pine 18
Other conifers 15
Total conifers 345
Broadleaves
Oak 73
Beech 34
Sycamore 26
Ash 34
Birch 21
Sweet chestnut 8
Hazel 6
Hawthorn 3
Alder 10
Willow 4
Other broadleaves 21
Total broadleaves 240
Estimates for Northern Ireland, as used in FRA 2010 (ref 4) are:
million m3 overbark standing
Common Name 1990 2000 2005 2010
Sitka Spruce 3.0 5.0 5.7 6.5
Scots Pine 0.9 0.6 0.7 0.7
Larch 0.4 0.3 0.3 0.3
Lodgepole Pine 0.1 0.2 0.3 0.3
Norway Spruce 0.6 0.6 0.6 0.5
Douglas Fir 0.2 0.1 0.1 0.2

FRA 2015 – Country Report, U.K. of Great Britain and Northern Ireland
22
Corsican Pine 0.0 0.0 0.0 0.0
Other conifers 0.2 0.2 0.2 0.2
Total conifers 5.5 7.2 7.9 8.7
Oak 0.4 0.3 0.3 0.4
Beech 0.1 0.1 0.1 0.1
Birch 0.2 0.1 0.2 0.2
Ash 0.1 0.1 0.1 0.1
Sycamore 0.1 0.1 0.1 0.1
Other broadleaves 0.3 0.2 0.2 0.2
Total broadleaves 1.2 1.0 1.0 1.1
TOTAL by species 6.7 8.1 8.9 9.8
Increment:
5 year averages from Joint Forest Sector Questionnaire (ref 5):
thousand m3 underbark
1988 to 1992 1998 to 2002 2003 to 2007 2008 to 2012
Coniferousroundwood
5296 7189 8025 8929
Non-coniferousroundwood
1023 577 446 451
Total roundwood 6320 7766 8471 9380
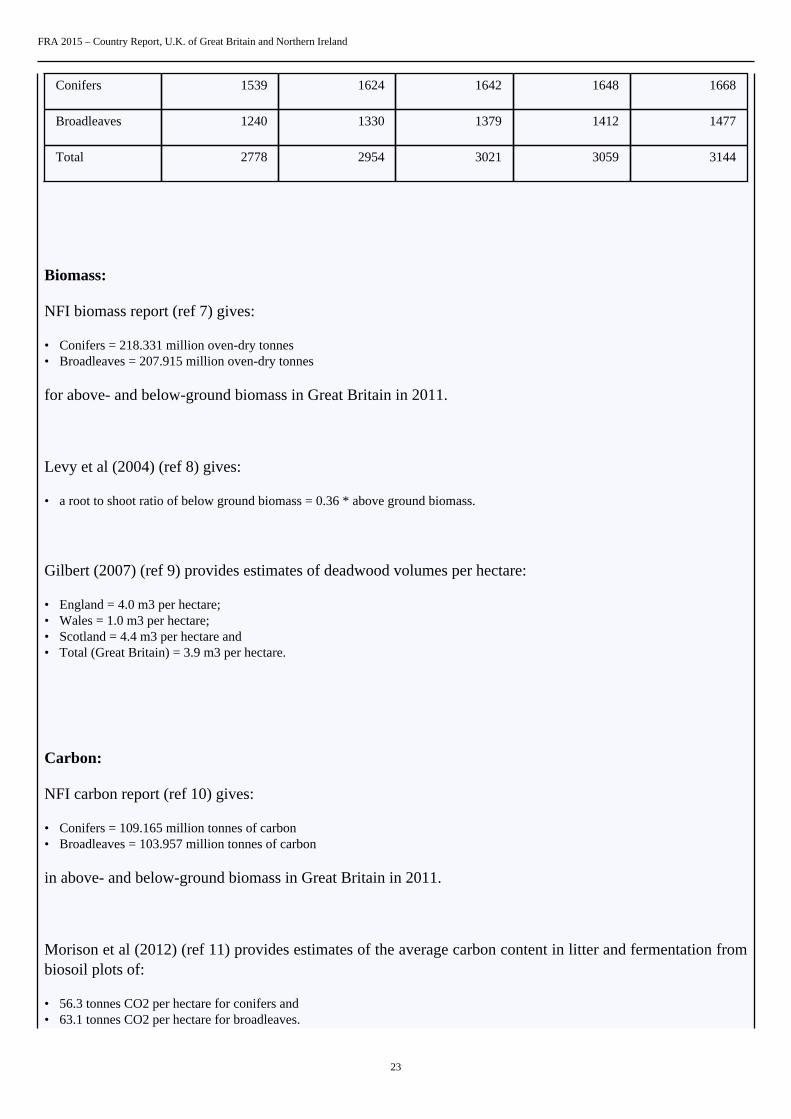
UK woodland areas (from Table 1 and ref 6), with conifer/ broadleaf breakdown:
thousand hectares
1990 2000 2005 2010 2015
FRA 2015 – Country Report, U.K. of Great Britain and Northern Ireland
23
Conifers 1539 1624 1642 1648 1668
Broadleaves 1240 1330 1379 1412 1477
Total 2778 2954 3021 3059 3144
Biomass:
NFI biomass report (ref 7) gives:
• Conifers = 218.331 million oven-dry tonnes• Broadleaves = 207.915 million oven-dry tonnes
for above- and below-ground biomass in Great Britain in 2011.
Levy et al (2004) (ref 8) gives:
• a root to shoot ratio of below ground biomass = 0.36 * above ground biomass.
Gilbert (2007) (ref 9) provides estimates of deadwood volumes per hectare:
• England = 4.0 m3 per hectare;• Wales = 1.0 m3 per hectare;• Scotland = 4.4 m3 per hectare and• Total (Great Britain) = 3.9 m3 per hectare.
Carbon:
NFI carbon report (ref 10) gives:
• Conifers = 109.165 million tonnes of carbon• Broadleaves = 103.957 million tonnes of carbon
in above- and below-ground biomass in Great Britain in 2011.
Morison et al (2012) (ref 11) provides estimates of the average carbon content in litter and fermentation frombiosoil plots of:
• 56.3 tonnes CO2 per hectare for conifers and• 63.1 tonnes CO2 per hectare for broadleaves.
FRA 2015 – Country Report, U.K. of Great Britain and Northern Ireland
24
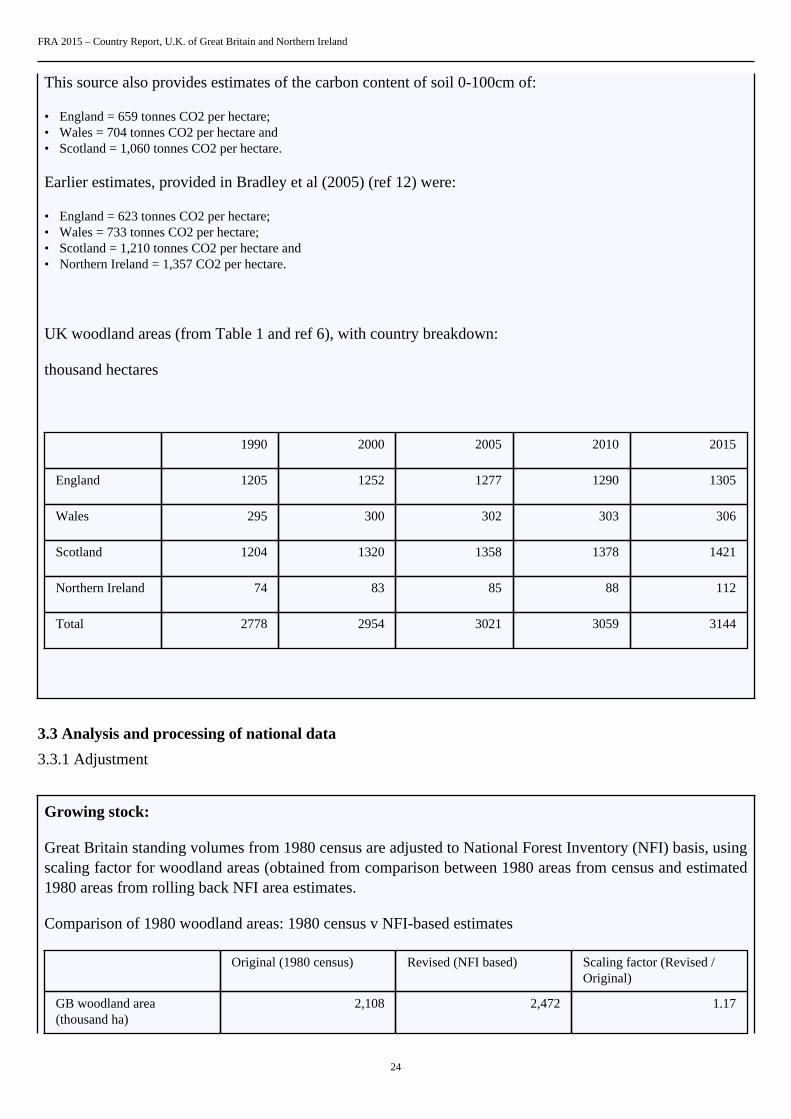
This source also provides estimates of the carbon content of soil 0-100cm of:
• England = 659 tonnes CO2 per hectare;• Wales = 704 tonnes CO2 per hectare and• Scotland = 1,060 tonnes CO2 per hectare.
Earlier estimates, provided in Bradley et al (2005) (ref 12) were:
• England = 623 tonnes CO2 per hectare;• Wales = 733 tonnes CO2 per hectare;• Scotland = 1,210 tonnes CO2 per hectare and• Northern Ireland = 1,357 CO2 per hectare.
UK woodland areas (from Table 1 and ref 6), with country breakdown:
thousand hectares
1990 2000 2005 2010 2015
England 1205 1252 1277 1290 1305
Wales 295 300 302 303 306
Scotland 1204 1320 1358 1378 1421
Northern Ireland 74 83 85 88 112
Total 2778 2954 3021 3059 3144
3.3 Analysis and processing of national data
3.3.1 Adjustment
Growing stock:
Great Britain standing volumes from 1980 census are adjusted to National Forest Inventory (NFI) basis, usingscaling factor for woodland areas (obtained from comparison between 1980 areas from census and estimated1980 areas from rolling back NFI area estimates.
Comparison of 1980 woodland areas: 1980 census v NFI-based estimates
Original (1980 census) Revised (NFI based) Scaling factor (Revised /Original)
GB woodland area(thousand ha)
2,108 2,472 1.17
FRA 2015 – Country Report, U.K. of Great Britain and Northern Ireland
25
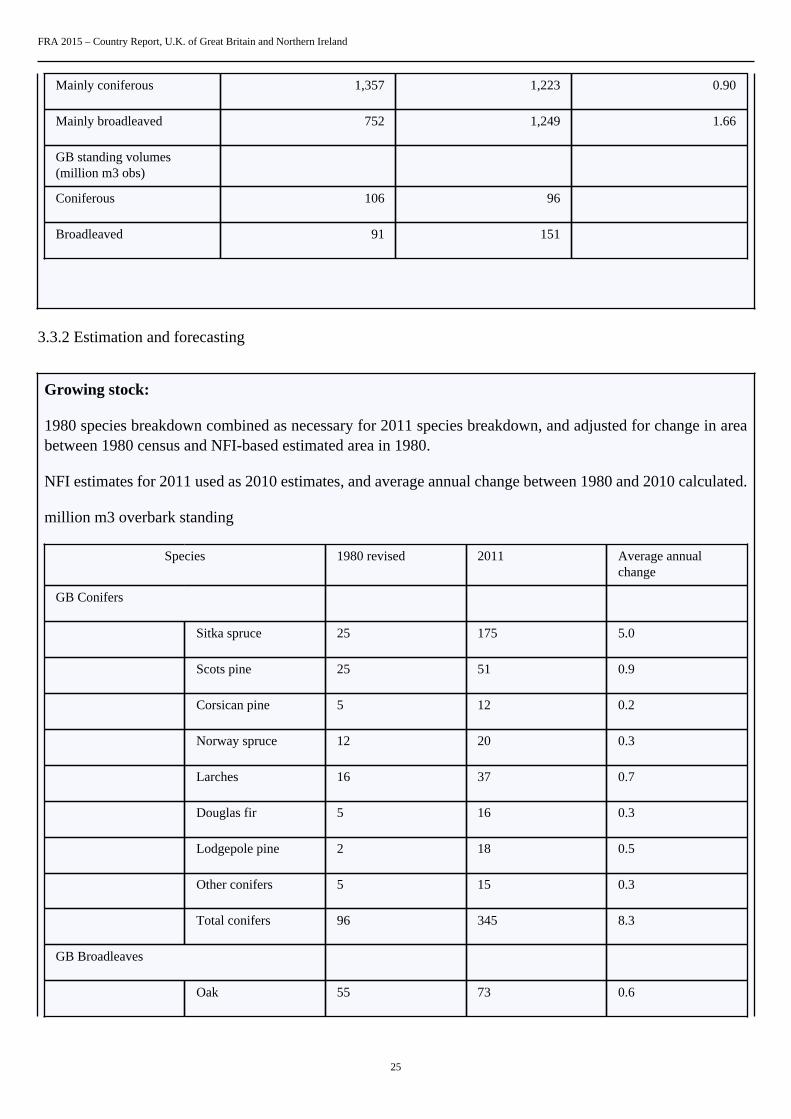
Mainly coniferous 1,357 1,223 0.90
Mainly broadleaved 752 1,249 1.66
GB standing volumes(million m3 obs)
Coniferous 106 96
Broadleaved 91 151
3.3.2 Estimation and forecasting
Growing stock:
1980 species breakdown combined as necessary for 2011 species breakdown, and adjusted for change in areabetween 1980 census and NFI-based estimated area in 1980.
NFI estimates for 2011 used as 2010 estimates, and average annual change between 1980 and 2010 calculated.
million m3 overbark standing
Species 1980 revised 2011 Average annualchange
GB Conifers
Sitka spruce 25 175 5.0
Scots pine 25 51 0.9
Corsican pine 5 12 0.2
Norway spruce 12 20 0.3
Larches 16 37 0.7
Douglas fir 5 16 0.3
Lodgepole pine 2 18 0.5
Other conifers 5 15 0.3
Total conifers 96 345 8.3
GB Broadleaves
Oak 55 73 0.6
FRA 2015 – Country Report, U.K. of Great Britain and Northern Ireland
26
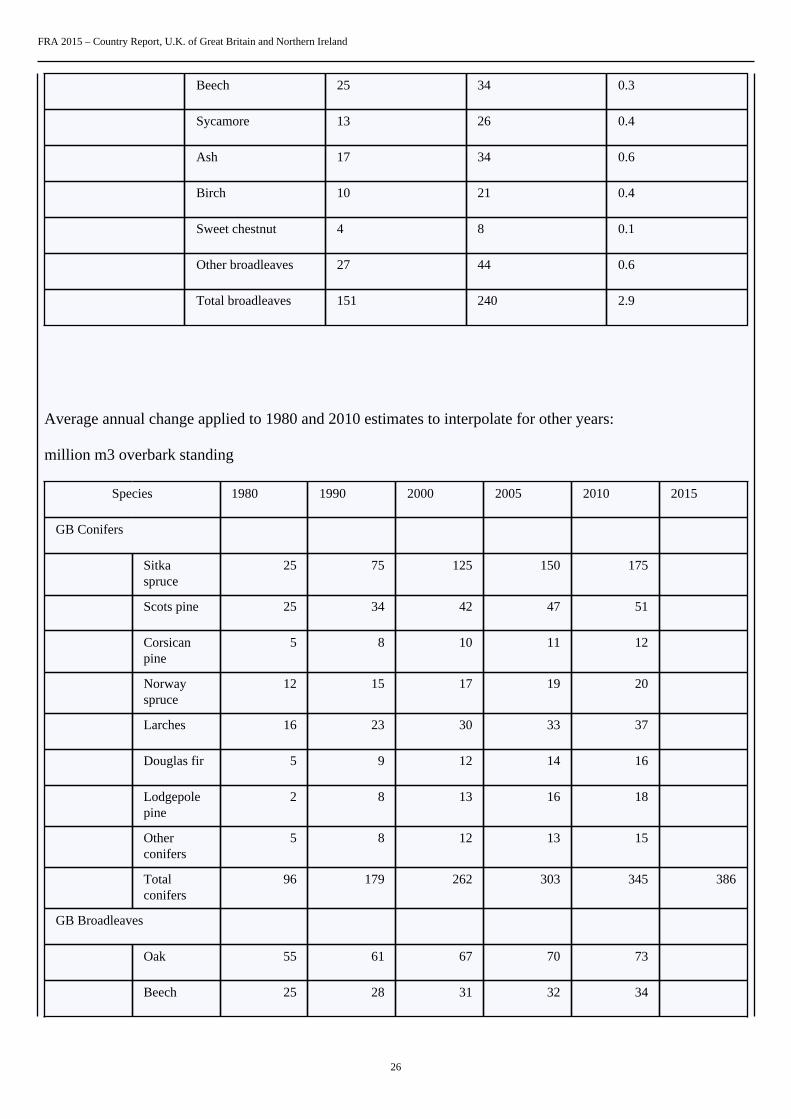
Beech 25 34 0.3
Sycamore 13 26 0.4
Ash 17 34 0.6
Birch 10 21 0.4
Sweet chestnut 4 8 0.1
Other broadleaves 27 44 0.6
Total broadleaves 151 240 2.9
Average annual change applied to 1980 and 2010 estimates to interpolate for other years:
million m3 overbark standing
Species 1980 1990 2000 2005 2010 2015
GB Conifers
Sitkaspruce
25 75 125 150 175
Scots pine 25 34 42 47 51
Corsicanpine
5 8 10 11 12
Norwayspruce
12 15 17 19 20
Larches 16 23 30 33 37
Douglas fir 5 9 12 14 16
Lodgepolepine
2 8 13 16 18
Otherconifers
5 8 12 13 15
Totalconifers
96 179 262 303 345 386
GB Broadleaves
Oak 55 61 67 70 73
Beech 25 28 31 32 34
FRA 2015 – Country Report, U.K. of Great Britain and Northern Ireland
27
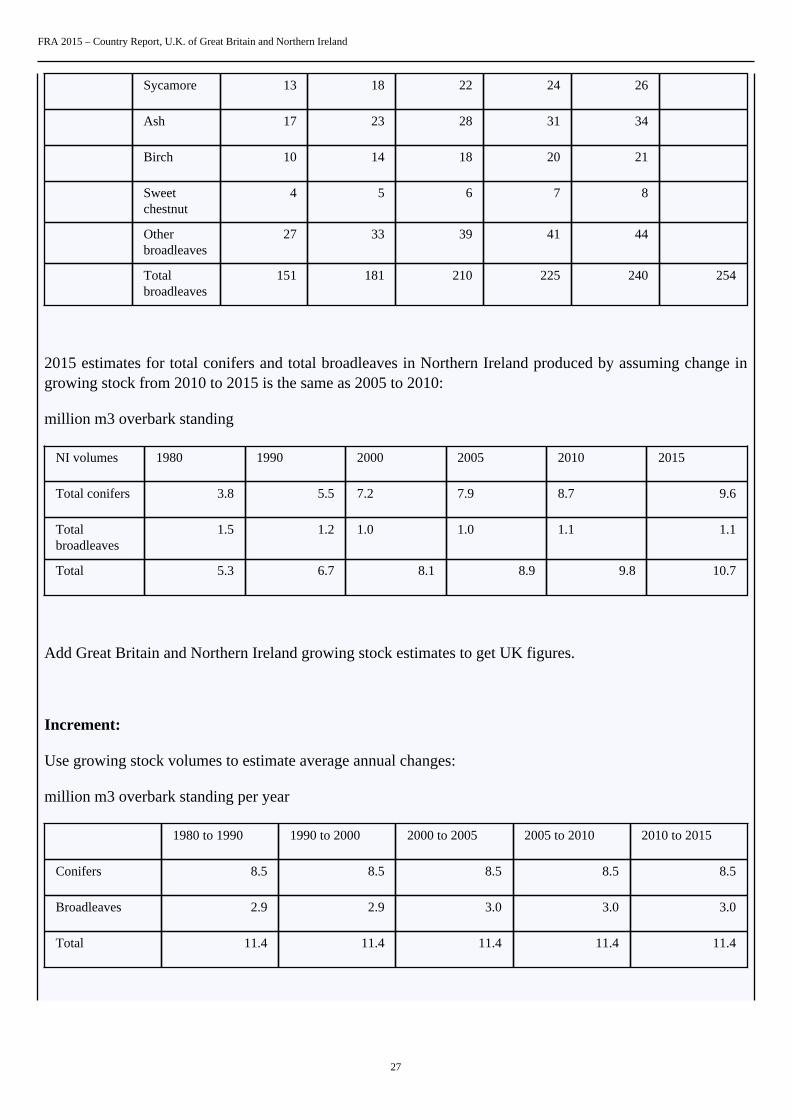
Sycamore 13 18 22 24 26
Ash 17 23 28 31 34
Birch 10 14 18 20 21
Sweetchestnut
4 5 6 7 8
Otherbroadleaves
27 33 39 41 44
Totalbroadleaves
151 181 210 225 240 254
2015 estimates for total conifers and total broadleaves in Northern Ireland produced by assuming change ingrowing stock from 2010 to 2015 is the same as 2005 to 2010:
million m3 overbark standing
NI volumes 1980 1990 2000 2005 2010 2015
Total conifers 3.8 5.5 7.2 7.9 8.7 9.6
Totalbroadleaves
1.5 1.2 1.0 1.0 1.1 1.1
Total 5.3 6.7 8.1 8.9 9.8 10.7
Add Great Britain and Northern Ireland growing stock estimates to get UK figures.
Increment:
Use growing stock volumes to estimate average annual changes:
million m3 overbark standing per year
1980 to 1990 1990 to 2000 2000 to 2005 2005 to 2010 2010 to 2015
Conifers 8.5 8.5 8.5 8.5 8.5
Broadleaves 2.9 2.9 3.0 3.0 3.0
Total 11.4 11.4 11.4 11.4 11.4
FRA 2015 – Country Report, U.K. of Great Britain and Northern Ireland
28
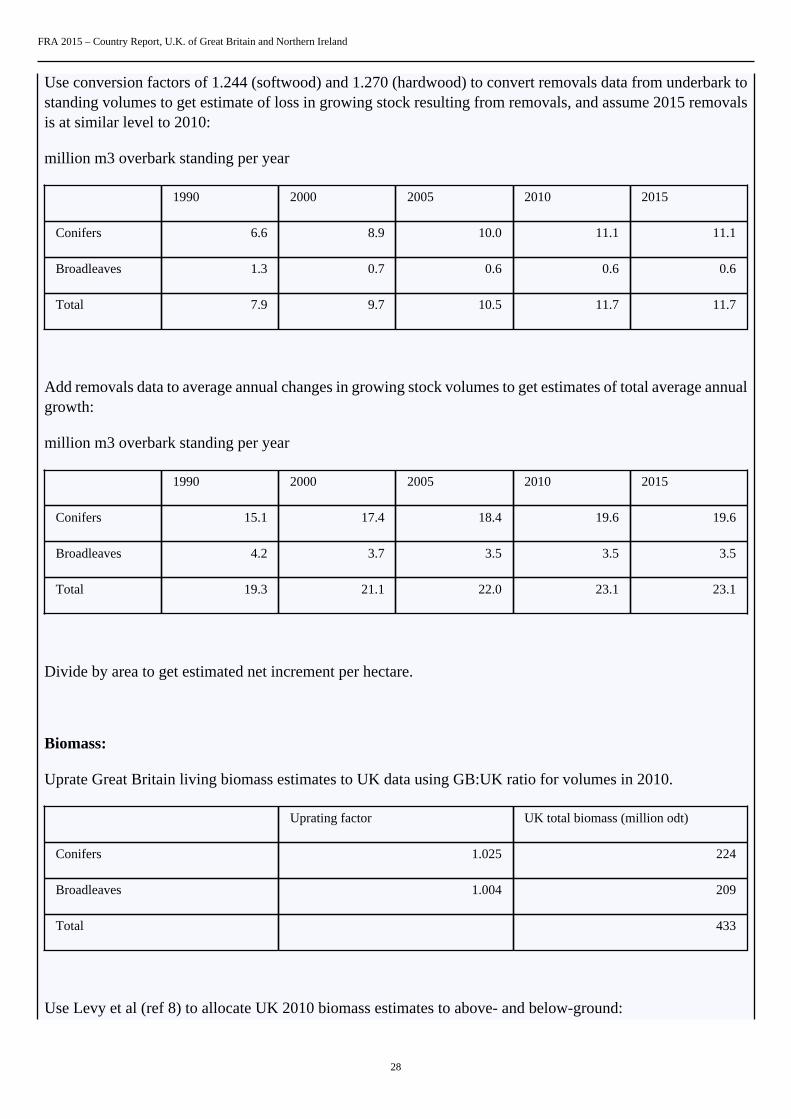
Use conversion factors of 1.244 (softwood) and 1.270 (hardwood) to convert removals data from underbark tostanding volumes to get estimate of loss in growing stock resulting from removals, and assume 2015 removalsis at similar level to 2010:
million m3 overbark standing per year
1990 2000 2005 2010 2015
Conifers 6.6 8.9 10.0 11.1 11.1
Broadleaves 1.3 0.7 0.6 0.6 0.6
Total 7.9 9.7 10.5 11.7 11.7
Add removals data to average annual changes in growing stock volumes to get estimates of total average annualgrowth:
million m3 overbark standing per year
1990 2000 2005 2010 2015
Conifers 15.1 17.4 18.4 19.6 19.6
Broadleaves 4.2 3.7 3.5 3.5 3.5
Total 19.3 21.1 22.0 23.1 23.1
Divide by area to get estimated net increment per hectare.
Biomass:
Uprate Great Britain living biomass estimates to UK data using GB:UK ratio for volumes in 2010.
Uprating factor UK total biomass (million odt)
Conifers 1.025 224
Broadleaves 1.004 209
Total 433
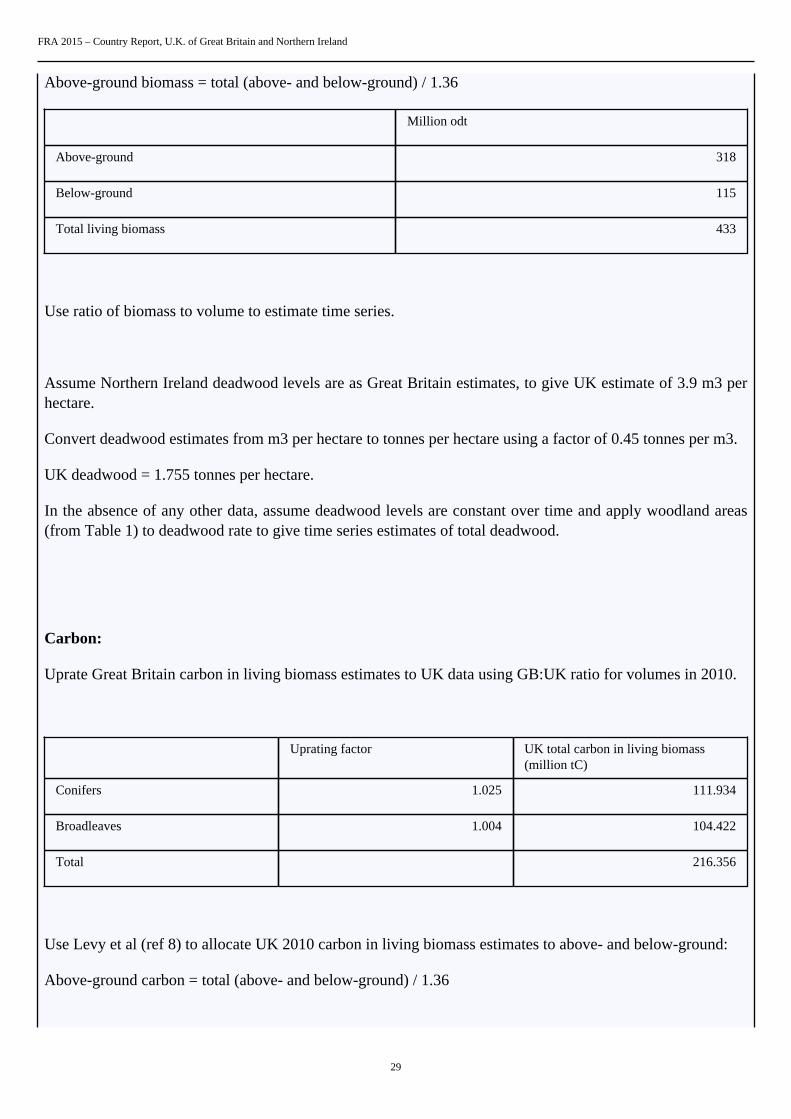
Use Levy et al (ref 8) to allocate UK 2010 biomass estimates to above- and below-ground:
FRA 2015 – Country Report, U.K. of Great Britain and Northern Ireland
29
Above-ground biomass = total (above- and below-ground) / 1.36
Million odt
Above-ground 318
Below-ground 115
Total living biomass 433
Use ratio of biomass to volume to estimate time series.
Assume Northern Ireland deadwood levels are as Great Britain estimates, to give UK estimate of 3.9 m3 perhectare.
Convert deadwood estimates from m3 per hectare to tonnes per hectare using a factor of 0.45 tonnes per m3.
UK deadwood = 1.755 tonnes per hectare.
In the absence of any other data, assume deadwood levels are constant over time and apply woodland areas(from Table 1) to deadwood rate to give time series estimates of total deadwood.
Carbon:
Uprate Great Britain carbon in living biomass estimates to UK data using GB:UK ratio for volumes in 2010.
Uprating factor UK total carbon in living biomass(million tC)
Conifers 1.025 111.934
Broadleaves 1.004 104.422
Total 216.356
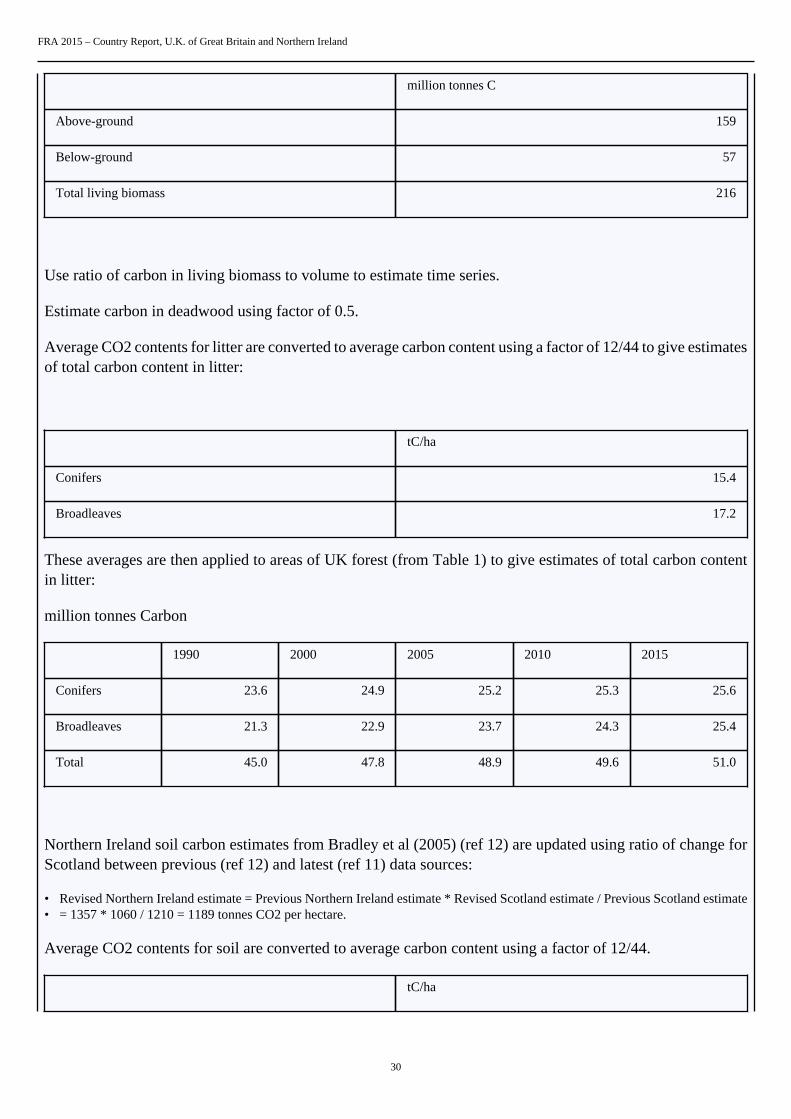
Use Levy et al (ref 8) to allocate UK 2010 carbon in living biomass estimates to above- and below-ground:
Above-ground carbon = total (above- and below-ground) / 1.36
FRA 2015 – Country Report, U.K. of Great Britain and Northern Ireland
30
million tonnes C
Above-ground 159
Below-ground 57
Total living biomass 216
Use ratio of carbon in living biomass to volume to estimate time series.
Estimate carbon in deadwood using factor of 0.5.
Average CO2 contents for litter are converted to average carbon content using a factor of 12/44 to give estimatesof total carbon content in litter:
tC/ha
Conifers 15.4
Broadleaves 17.2
These averages are then applied to areas of UK forest (from Table 1) to give estimates of total carbon contentin litter:
million tonnes Carbon
1990 2000 2005 2010 2015
Conifers 23.6 24.9 25.2 25.3 25.6
Broadleaves 21.3 22.9 23.7 24.3 25.4
Total 45.0 47.8 48.9 49.6 51.0
Northern Ireland soil carbon estimates from Bradley et al (2005) (ref 12) are updated using ratio of change forScotland between previous (ref 12) and latest (ref 11) data sources:
• Revised Northern Ireland estimate = Previous Northern Ireland estimate * Revised Scotland estimate / Previous Scotland estimate• = 1357 * 1060 / 1210 = 1189 tonnes CO2 per hectare.
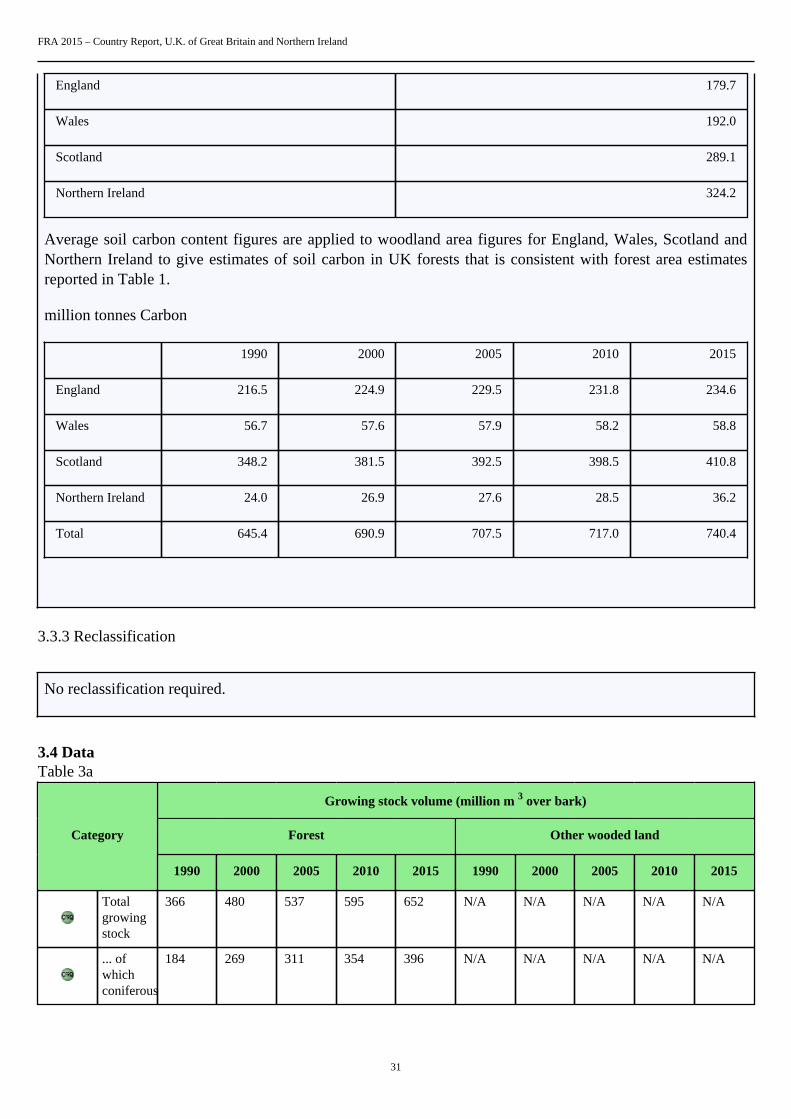
Average CO2 contents for soil are converted to average carbon content using a factor of 12/44.
tC/ha
FRA 2015 – Country Report, U.K. of Great Britain and Northern Ireland
31
England 179.7
Wales 192.0
Scotland 289.1
Northern Ireland 324.2
Average soil carbon content figures are applied to woodland area figures for England, Wales, Scotland andNorthern Ireland to give estimates of soil carbon in UK forests that is consistent with forest area estimatesreported in Table 1.
million tonnes Carbon
1990 2000 2005 2010 2015
England 216.5 224.9 229.5 231.8 234.6
Wales 56.7 57.6 57.9 58.2 58.8
Scotland 348.2 381.5 392.5 398.5 410.8
Northern Ireland 24.0 26.9 27.6 28.5 36.2
Total 645.4 690.9 707.5 717.0 740.4
3.3.3 Reclassification
No reclassification required.
3.4 DataTable 3a
Growing stock volume (million m 3 over bark)
Forest Other wooded landCategory
1990 2000 2005 2010 2015 1990 2000 2005 2010 2015
Totalgrowingstock
366 480 537 595 652 N/A N/A N/A N/A N/A
... ofwhichconiferous
184 269 311 354 396 N/A N/A N/A N/A N/A
FRA 2015 – Country Report, U.K. of Great Britain and Northern Ireland
32
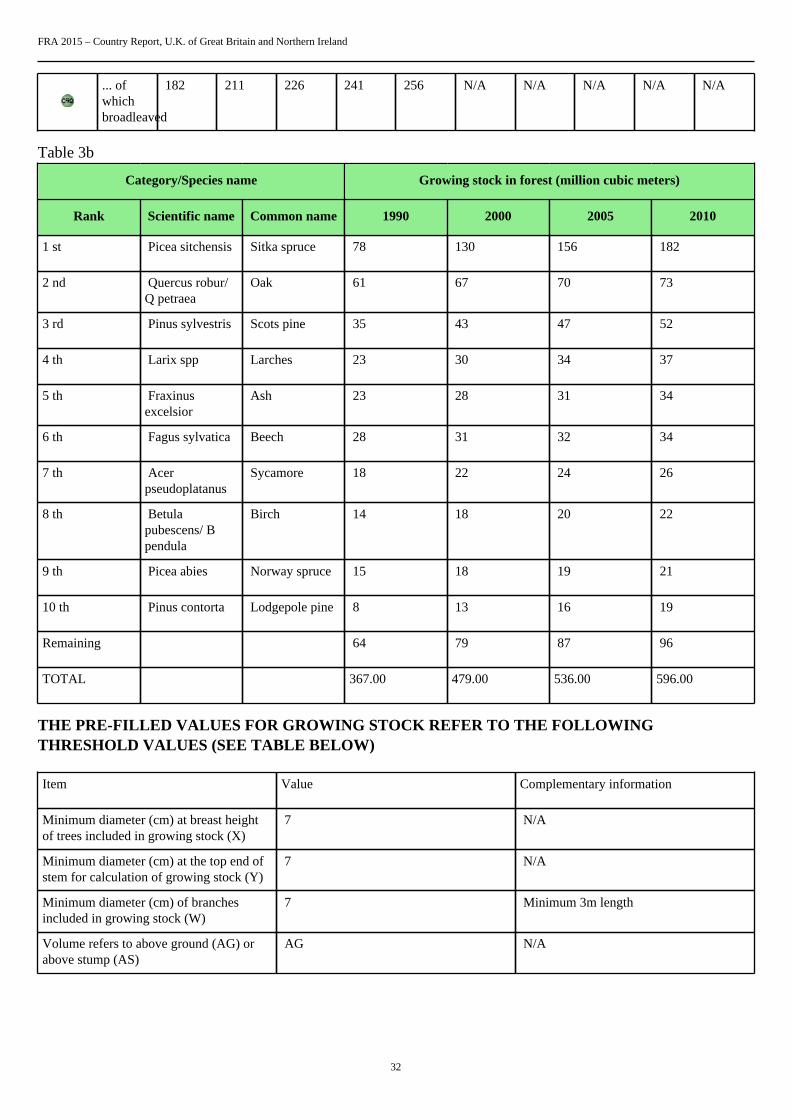
... ofwhichbroadleaved
182 211 226 241 256 N/A N/A N/A N/A N/A
Table 3b
Category/Species name Growing stock in forest (million cubic meters)
Rank Scientific name Common name 1990 2000 2005 2010
1 st Picea sitchensis Sitka spruce 78 130 156 182
2 nd Quercus robur/Q petraea
Oak 61 67 70 73
3 rd Pinus sylvestris Scots pine 35 43 47 52
4 th Larix spp Larches 23 30 34 37
5 th Fraxinusexcelsior
Ash 23 28 31 34
6 th Fagus sylvatica Beech 28 31 32 34
7 th Acerpseudoplatanus
Sycamore 18 22 24 26
8 th Betulapubescens/ Bpendula
Birch 14 18 20 22
9 th Picea abies Norway spruce 15 18 19 21
10 th Pinus contorta Lodgepole pine 8 13 16 19
Remaining 64 79 87 96
TOTAL 367.00 479.00 536.00 596.00
THE PRE-FILLED VALUES FOR GROWING STOCK REFER TO THE FOLLOWINGTHRESHOLD VALUES (SEE TABLE BELOW)
Item Value Complementary information
Minimum diameter (cm) at breast heightof trees included in growing stock (X)
7 N/A
Minimum diameter (cm) at the top end ofstem for calculation of growing stock (Y)
7 N/A
Minimum diameter (cm) of branchesincluded in growing stock (W)
7 Minimum 3m length
Volume refers to above ground (AG) orabove stump (AS)
AG N/A
FRA 2015 – Country Report, U.K. of Great Britain and Northern Ireland
33
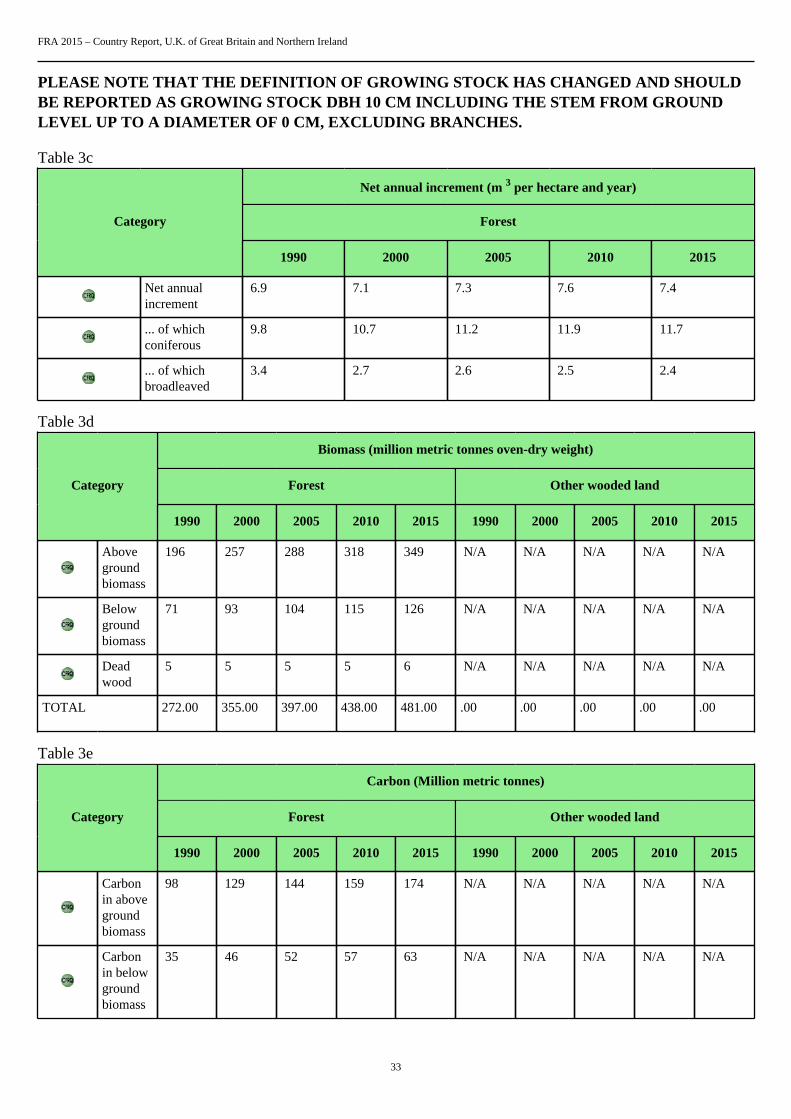
PLEASE NOTE THAT THE DEFINITION OF GROWING STOCK HAS CHANGED AND SHOULDBE REPORTED AS GROWING STOCK DBH 10 CM INCLUDING THE STEM FROM GROUNDLEVEL UP TO A DIAMETER OF 0 CM, EXCLUDING BRANCHES.
Table 3c
Net annual increment (m 3 per hectare and year)
ForestCategory
1990 2000 2005 2010 2015
Net annualincrement
6.9 7.1 7.3 7.6 7.4
... of whichconiferous
9.8 10.7 11.2 11.9 11.7
... of whichbroadleaved
3.4 2.7 2.6 2.5 2.4
Table 3d
Biomass (million metric tonnes oven-dry weight)
Forest Other wooded landCategory
1990 2000 2005 2010 2015 1990 2000 2005 2010 2015
Abovegroundbiomass
196 257 288 318 349 N/A N/A N/A N/A N/A
Belowgroundbiomass
71 93 104 115 126 N/A N/A N/A N/A N/A
Deadwood
5 5 5 5 6 N/A N/A N/A N/A N/A
TOTAL 272.00 355.00 397.00 438.00 481.00 .00 .00 .00 .00 .00
Table 3e
Carbon (Million metric tonnes)
Forest Other wooded landCategory
1990 2000 2005 2010 2015 1990 2000 2005 2010 2015
Carbonin abovegroundbiomass
98 129 144 159 174 N/A N/A N/A N/A N/A
Carbonin belowgroundbiomass
35 46 52 57 63 N/A N/A N/A N/A N/A
FRA 2015 – Country Report, U.K. of Great Britain and Northern Ireland
34
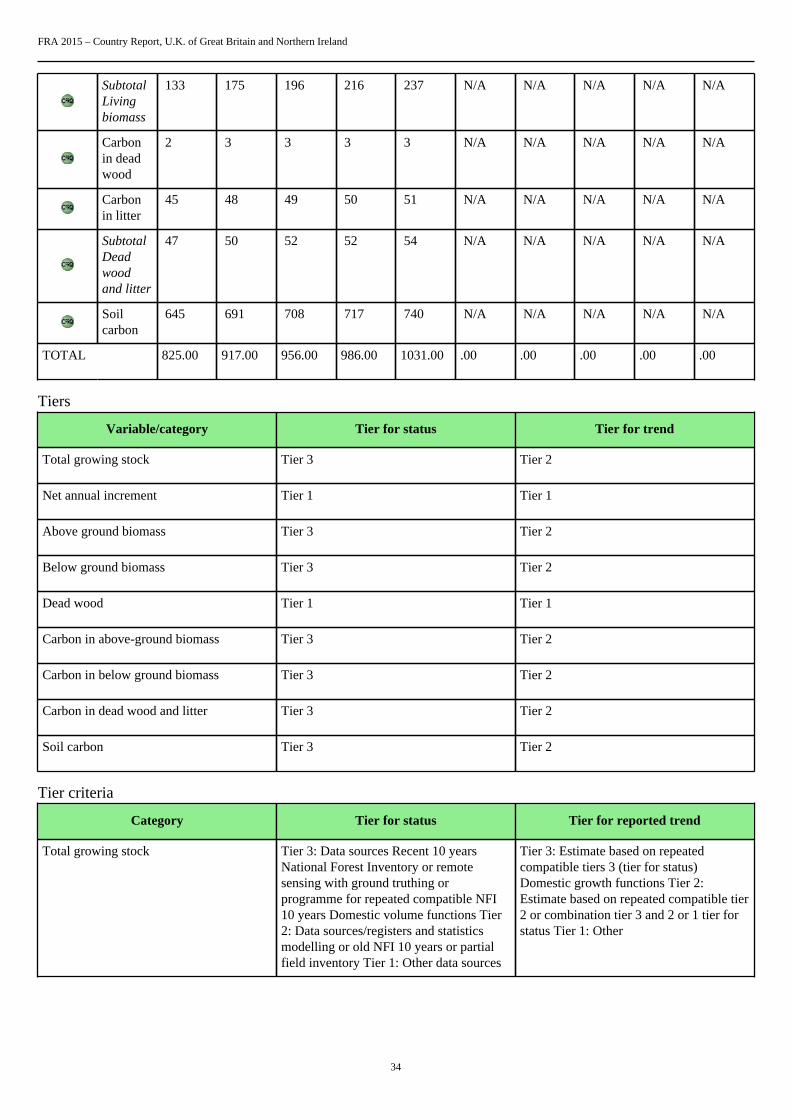
SubtotalLivingbiomass
133 175 196 216 237 N/A N/A N/A N/A N/A
Carbonin deadwood
2 3 3 3 3 N/A N/A N/A N/A N/A
Carbonin litter
45 48 49 50 51 N/A N/A N/A N/A N/A
SubtotalDeadwoodand litter
47 50 52 52 54 N/A N/A N/A N/A N/A
Soilcarbon
645 691 708 717 740 N/A N/A N/A N/A N/A
TOTAL 825.00 917.00 956.00 986.00 1031.00 .00 .00 .00 .00 .00
Tiers
Variable/category Tier for status Tier for trend
Total growing stock Tier 3 Tier 2
Net annual increment Tier 1 Tier 1
Above ground biomass Tier 3 Tier 2
Below ground biomass Tier 3 Tier 2
Dead wood Tier 1 Tier 1
Carbon in above-ground biomass Tier 3 Tier 2
Carbon in below ground biomass Tier 3 Tier 2
Carbon in dead wood and litter Tier 3 Tier 2
Soil carbon Tier 3 Tier 2
Tier criteria
Category Tier for status Tier for reported trend
Total growing stock Tier 3: Data sources Recent 10 yearsNational Forest Inventory or remotesensing with ground truthing orprogramme for repeated compatible NFI10 years Domestic volume functions Tier2: Data sources/registers and statisticsmodelling or old NFI 10 years or partialfield inventory Tier 1: Other data sources
Tier 3: Estimate based on repeatedcompatible tiers 3 (tier for status)Domestic growth functions Tier 2:Estimate based on repeated compatible tier2 or combination tier 3 and 2 or 1 tier forstatus Tier 1: Other
FRA 2015 – Country Report, U.K. of Great Britain and Northern Ireland
35
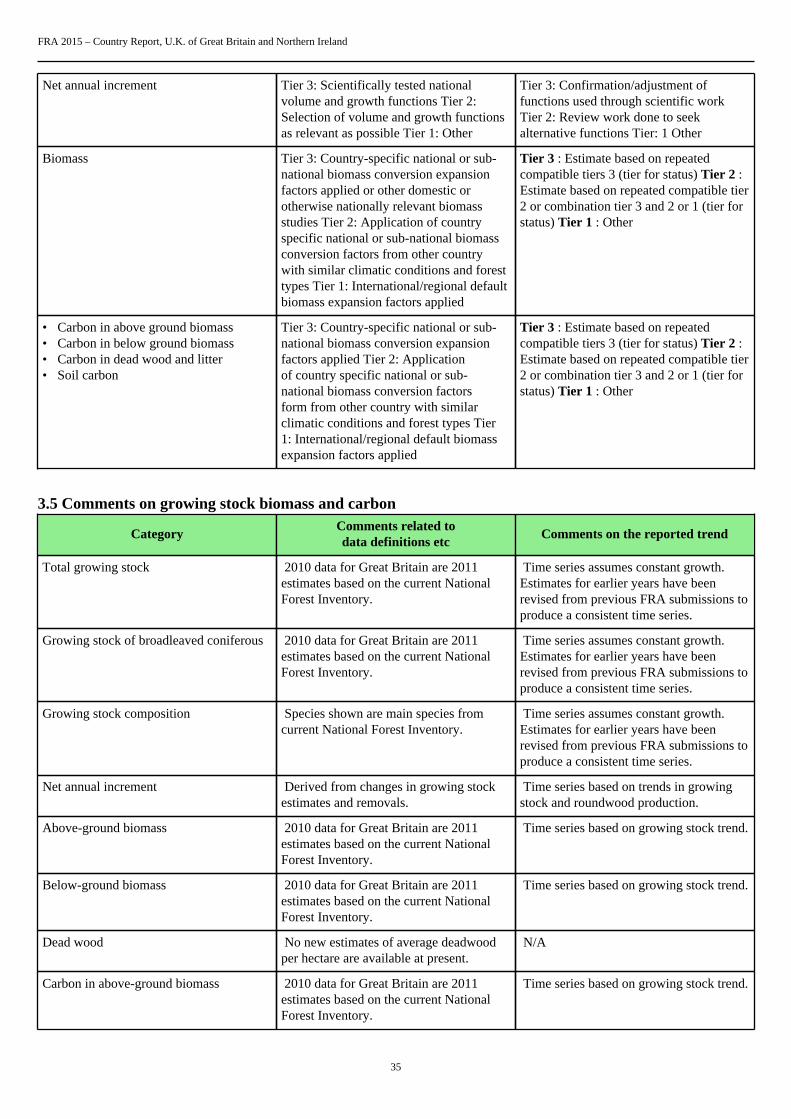
Net annual increment Tier 3: Scientifically tested nationalvolume and growth functions Tier 2:Selection of volume and growth functionsas relevant as possible Tier 1: Other
Tier 3: Confirmation/adjustment offunctions used through scientific workTier 2: Review work done to seekalternative functions Tier: 1 Other
Biomass Tier 3: Country-specific national or sub-national biomass conversion expansionfactors applied or other domestic orotherwise nationally relevant biomassstudies Tier 2: Application of countryspecific national or sub-national biomassconversion factors from other countrywith similar climatic conditions and foresttypes Tier 1: International/regional defaultbiomass expansion factors applied
Tier 3 : Estimate based on repeatedcompatible tiers 3 (tier for status) Tier 2 :Estimate based on repeated compatible tier2 or combination tier 3 and 2 or 1 (tier forstatus) Tier 1 : Other
• Carbon in above ground biomass• Carbon in below ground biomass• Carbon in dead wood and litter• Soil carbon
Tier 3: Country-specific national or sub-national biomass conversion expansionfactors applied Tier 2: Applicationof country specific national or sub-national biomass conversion factorsform from other country with similarclimatic conditions and forest types Tier1: International/regional default biomassexpansion factors applied
Tier 3 : Estimate based on repeatedcompatible tiers 3 (tier for status) Tier 2 :Estimate based on repeated compatible tier2 or combination tier 3 and 2 or 1 (tier forstatus) Tier 1 : Other
3.5 Comments on growing stock biomass and carbon
CategoryComments related todata definitions etc
Comments on the reported trend
Total growing stock 2010 data for Great Britain are 2011estimates based on the current NationalForest Inventory.
Time series assumes constant growth.Estimates for earlier years have beenrevised from previous FRA submissions toproduce a consistent time series.
Growing stock of broadleaved coniferous 2010 data for Great Britain are 2011estimates based on the current NationalForest Inventory.
Time series assumes constant growth.Estimates for earlier years have beenrevised from previous FRA submissions toproduce a consistent time series.
Growing stock composition Species shown are main species fromcurrent National Forest Inventory.
Time series assumes constant growth.Estimates for earlier years have beenrevised from previous FRA submissions toproduce a consistent time series.
Net annual increment Derived from changes in growing stockestimates and removals.
Time series based on trends in growingstock and roundwood production.
Above-ground biomass 2010 data for Great Britain are 2011estimates based on the current NationalForest Inventory.
Time series based on growing stock trend.
Below-ground biomass 2010 data for Great Britain are 2011estimates based on the current NationalForest Inventory.
Time series based on growing stock trend.
Dead wood No new estimates of average deadwoodper hectare are available at present.
N/A
Carbon in above-ground biomass 2010 data for Great Britain are 2011estimates based on the current NationalForest Inventory.
Time series based on growing stock trend.
FRA 2015 – Country Report, U.K. of Great Britain and Northern Ireland
36
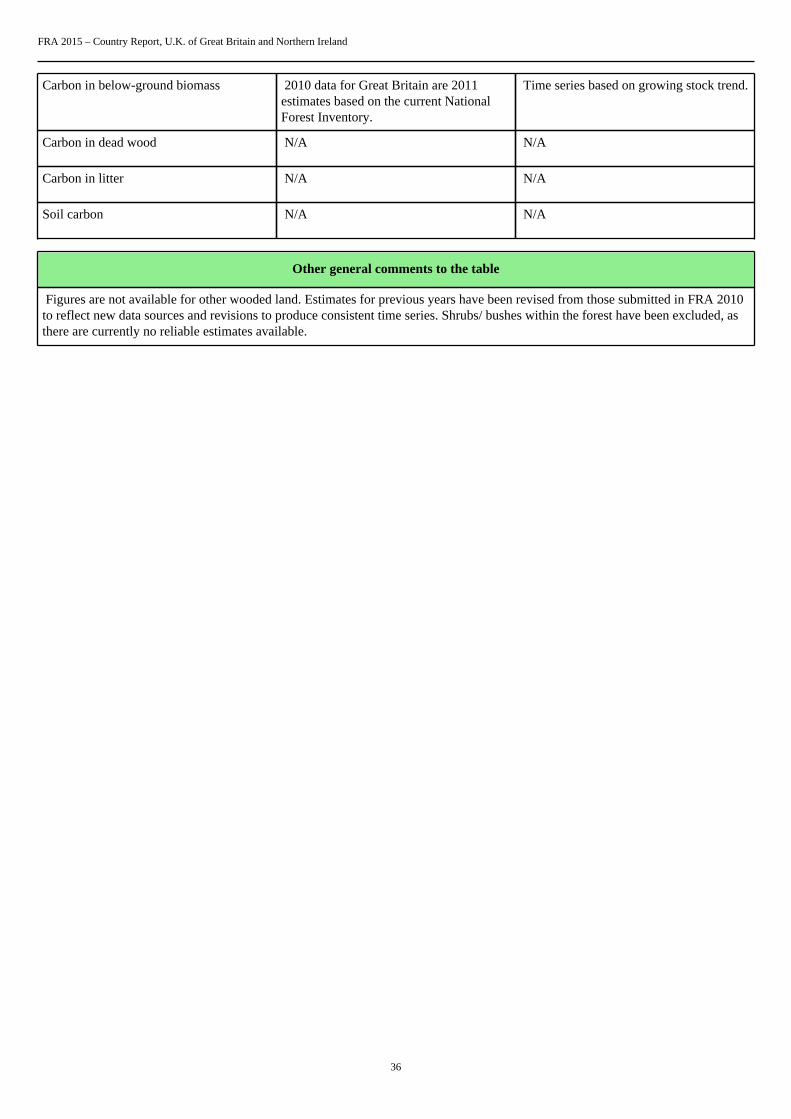
Carbon in below-ground biomass 2010 data for Great Britain are 2011estimates based on the current NationalForest Inventory.
Time series based on growing stock trend.
Carbon in dead wood N/A N/A
Carbon in litter N/A N/A
Soil carbon N/A N/A
Other general comments to the table
Figures are not available for other wooded land. Estimates for previous years have been revised from those submitted in FRA 2010to reflect new data sources and revisions to produce consistent time series. Shrubs/ bushes within the forest have been excluded, asthere are currently no reliable estimates available.
FRA 2015 – Country Report, U.K. of Great Britain and Northern Ireland
37
4. What is the status of forest production and how has it changed over time?Documents for this question:
• Guide for country reporting FRA 2015• FRA 2015 Terms and Definitions
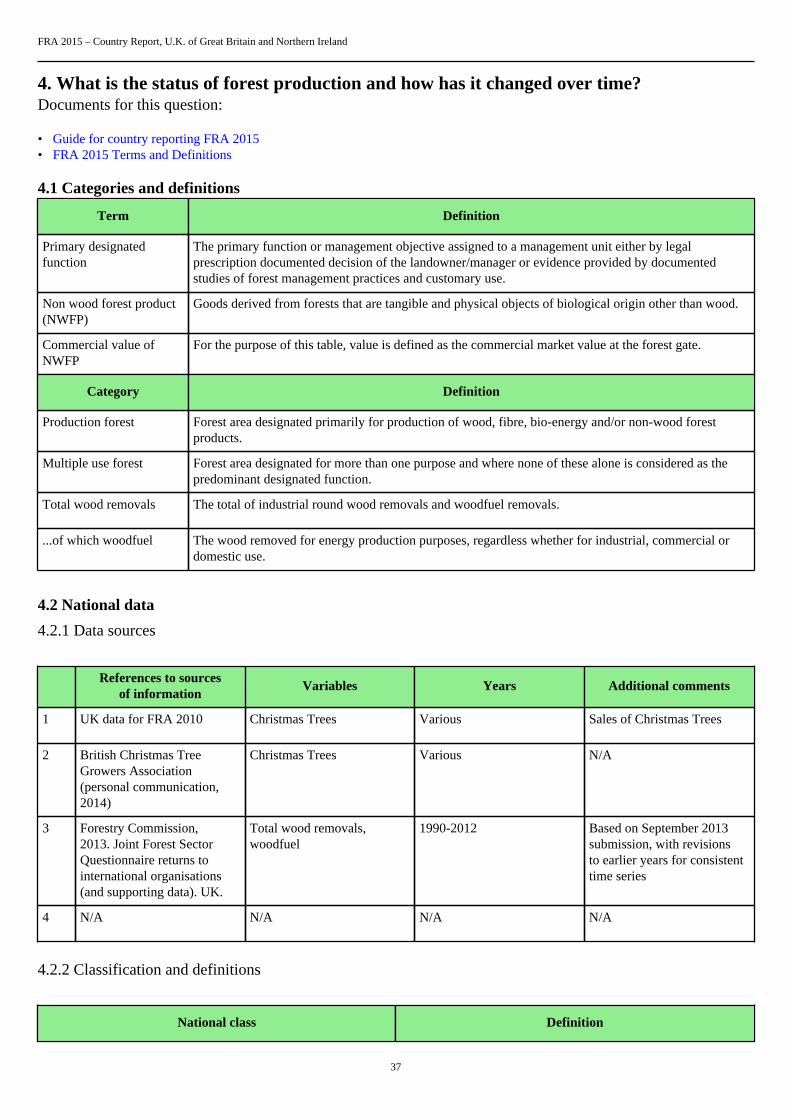
4.1 Categories and definitions
Term Definition
Primary designatedfunction
The primary function or management objective assigned to a management unit either by legalprescription documented decision of the landowner/manager or evidence provided by documentedstudies of forest management practices and customary use.
Non wood forest product(NWFP)
Goods derived from forests that are tangible and physical objects of biological origin other than wood.
Commercial value ofNWFP
For the purpose of this table, value is defined as the commercial market value at the forest gate.
Category Definition
Production forest Forest area designated primarily for production of wood, fibre, bio-energy and/or non-wood forestproducts.
Multiple use forest Forest area designated for more than one purpose and where none of these alone is considered as thepredominant designated function.
Total wood removals The total of industrial round wood removals and woodfuel removals.
...of which woodfuel The wood removed for energy production purposes, regardless whether for industrial, commercial ordomestic use.
4.2 National data
4.2.1 Data sources
References to sourcesof information
Variables Years Additional comments
1 UK data for FRA 2010 Christmas Trees Various Sales of Christmas Trees
2 British Christmas TreeGrowers Association(personal communication,2014)
Christmas Trees Various N/A
3 Forestry Commission,2013. Joint Forest SectorQuestionnaire returns tointernational organisations(and supporting data). UK.
Total wood removals,woodfuel
1990-2012 Based on September 2013submission, with revisionsto earlier years for consistenttime series
4 N/A N/A N/A N/A
4.2.2 Classification and definitions
National class Definition
FRA 2015 – Country Report, U.K. of Great Britain and Northern Ireland
38
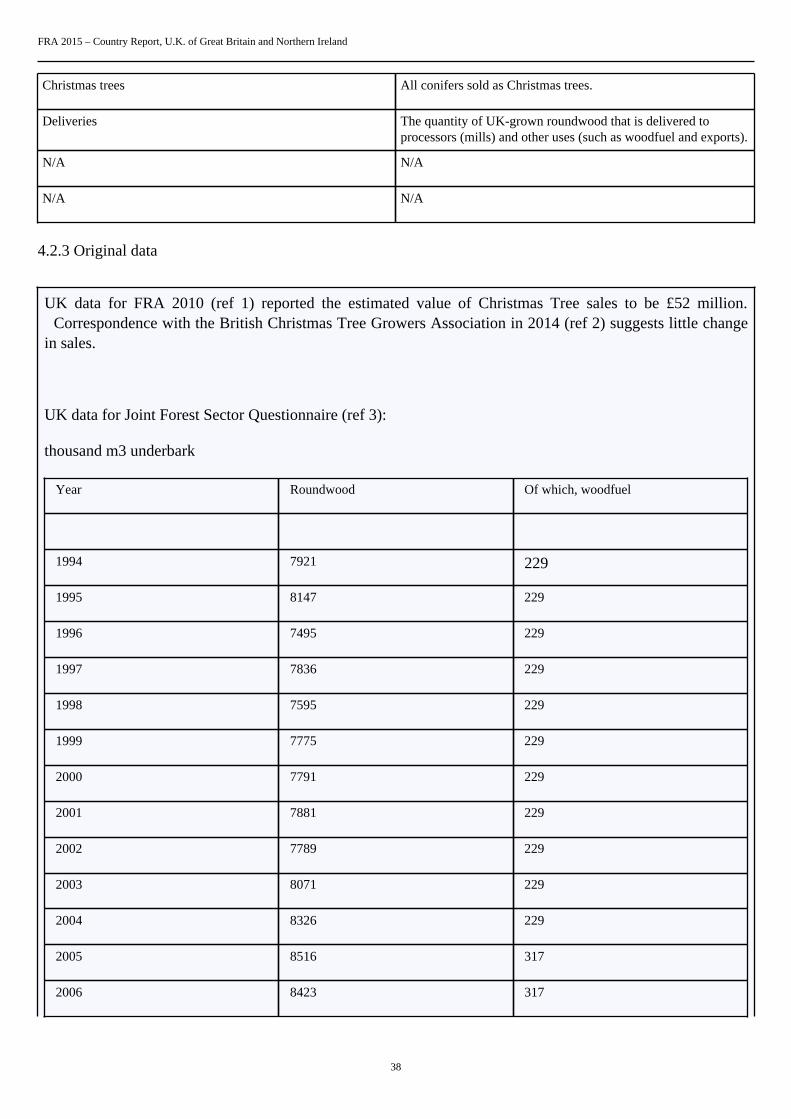
Christmas trees All conifers sold as Christmas trees.
Deliveries The quantity of UK-grown roundwood that is delivered toprocessors (mills) and other uses (such as woodfuel and exports).
N/A N/A
N/A N/A
4.2.3 Original data
UK data for FRA 2010 (ref 1) reported the estimated value of Christmas Tree sales to be £52 million. Correspondence with the British Christmas Tree Growers Association in 2014 (ref 2) suggests little changein sales.
UK data for Joint Forest Sector Questionnaire (ref 3):
thousand m3 underbark
Year Roundwood Of which, woodfuel
1994 7921 229
1995 8147 229
1996 7495 229
1997 7836 229
1998 7595 229
1999 7775 229
2000 7791 229
2001 7881 229
2002 7789 229
2003 8071 229
2004 8326 229
2005 8516 317
2006 8423 317
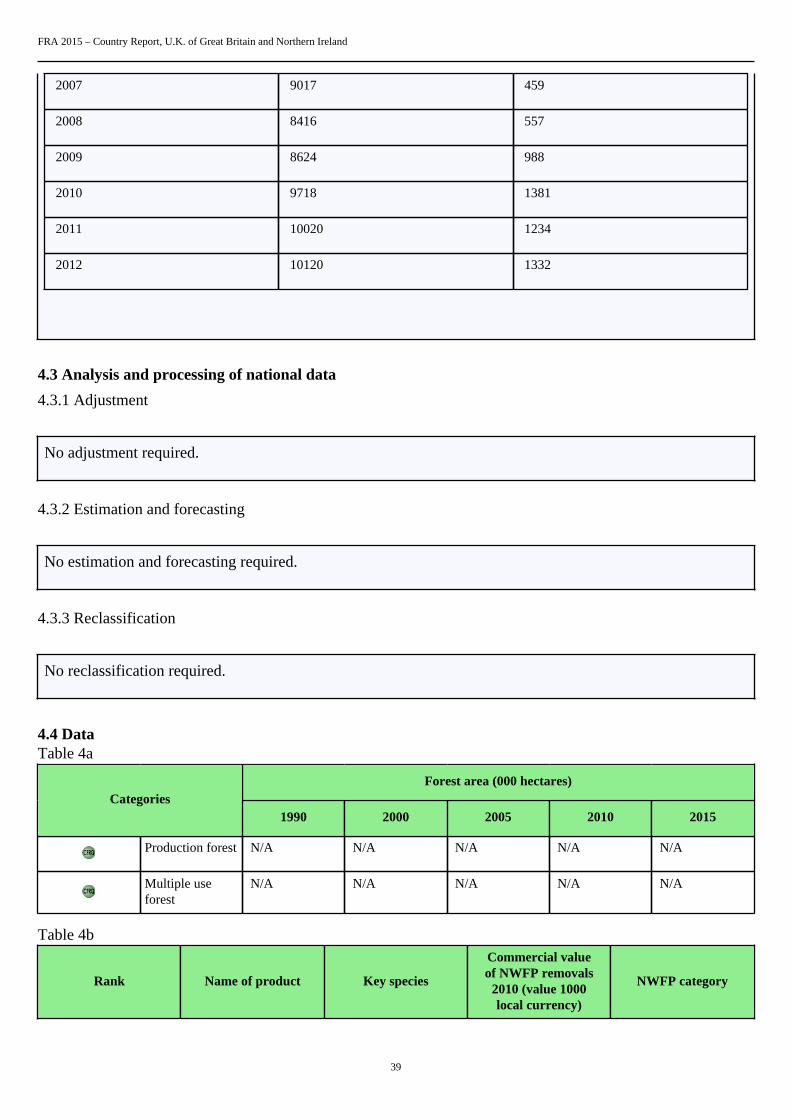
FRA 2015 – Country Report, U.K. of Great Britain and Northern Ireland
39
2007 9017 459
2008 8416 557
2009 8624 988
2010 9718 1381
2011 10020 1234
2012 10120 1332
4.3 Analysis and processing of national data
4.3.1 Adjustment
No adjustment required.
4.3.2 Estimation and forecasting
No estimation and forecasting required.
4.3.3 Reclassification
No reclassification required.
4.4 DataTable 4a
Forest area (000 hectares)Categories
1990 2000 2005 2010 2015
Production forest N/A N/A N/A N/A N/A
Multiple useforest
N/A N/A N/A N/A N/A
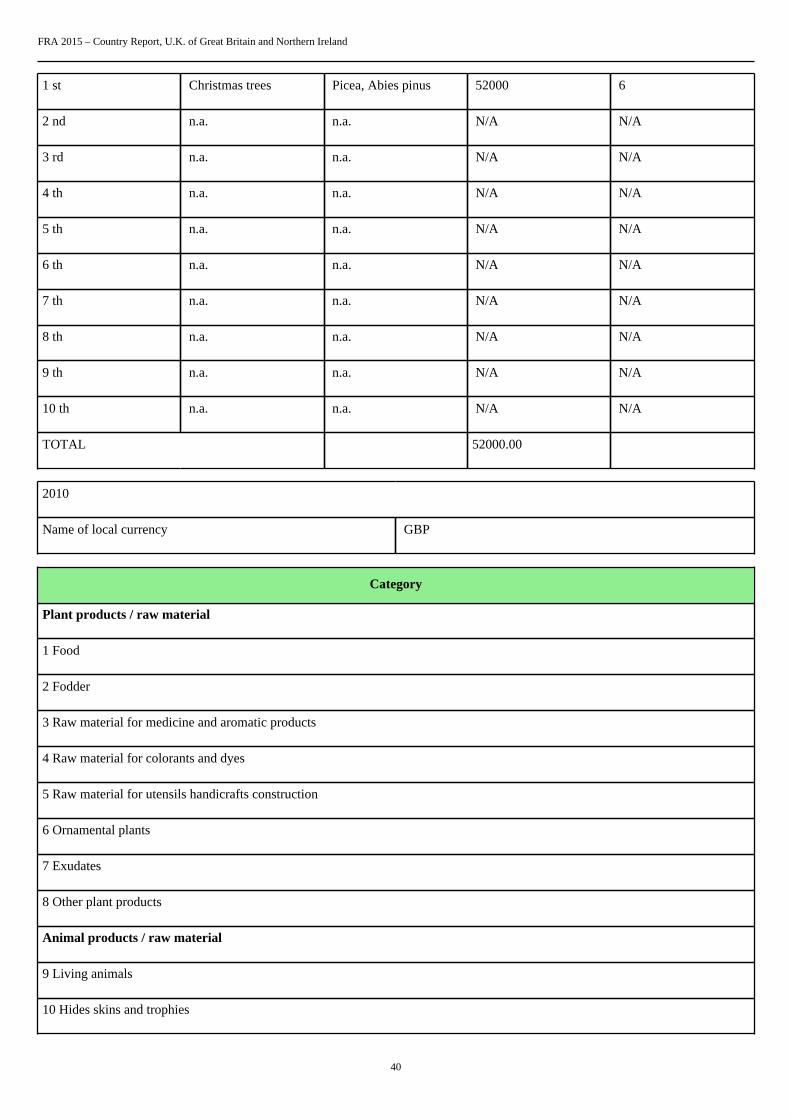
Table 4b
Rank Name of product Key species
Commercial valueof NWFP removals
2010 (value 1000local currency)
NWFP category
FRA 2015 – Country Report, U.K. of Great Britain and Northern Ireland
40
1 st Christmas trees Picea, Abies pinus 52000 6
2 nd n.a. n.a. N/A N/A
3 rd n.a. n.a. N/A N/A
4 th n.a. n.a. N/A N/A
5 th n.a. n.a. N/A N/A
6 th n.a. n.a. N/A N/A
7 th n.a. n.a. N/A N/A
8 th n.a. n.a. N/A N/A
9 th n.a. n.a. N/A N/A
10 th n.a. n.a. N/A N/A
TOTAL 52000.00
2010
Name of local currency GBP
Category
Plant products / raw material
1 Food
2 Fodder
3 Raw material for medicine and aromatic products
4 Raw material for colorants and dyes
5 Raw material for utensils handicrafts construction
6 Ornamental plants
7 Exudates
8 Other plant products
Animal products / raw material
9 Living animals
10 Hides skins and trophies
FRA 2015 – Country Report, U.K. of Great Britain and Northern Ireland
41
11 Wild honey and beewax
12 Wild meat
13 Raw material for medicine
14 Raw material for colorants
15 Other edible animal products
16 Other non-edible animal products
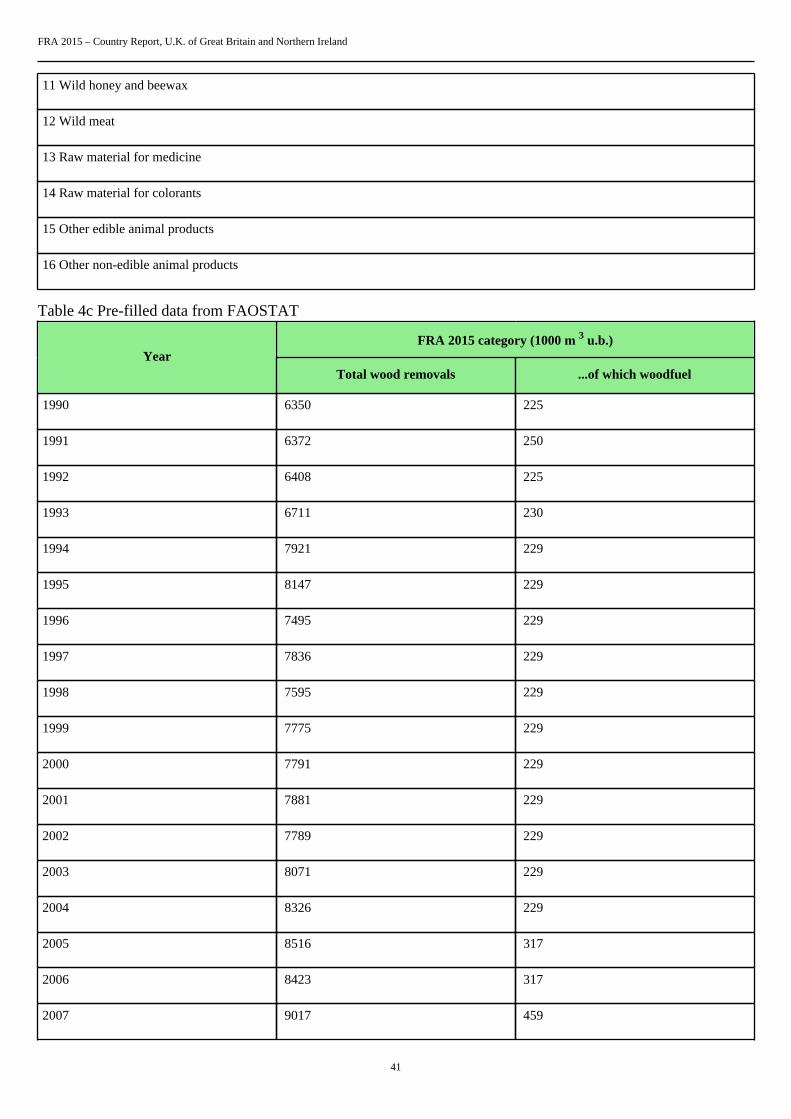
Table 4c Pre-filled data from FAOSTAT
FRA 2015 category (1000 m 3 u.b.)Year
Total wood removals ...of which woodfuel
1990 6350 225
1991 6372 250
1992 6408 225
1993 6711 230
1994 7921 229
1995 8147 229
1996 7495 229
1997 7836 229
1998 7595 229
1999 7775 229
2000 7791 229
2001 7881 229
2002 7789 229
2003 8071 229
2004 8326 229
2005 8516 317
2006 8423 317
2007 9017 459
FRA 2015 – Country Report, U.K. of Great Britain and Northern Ireland
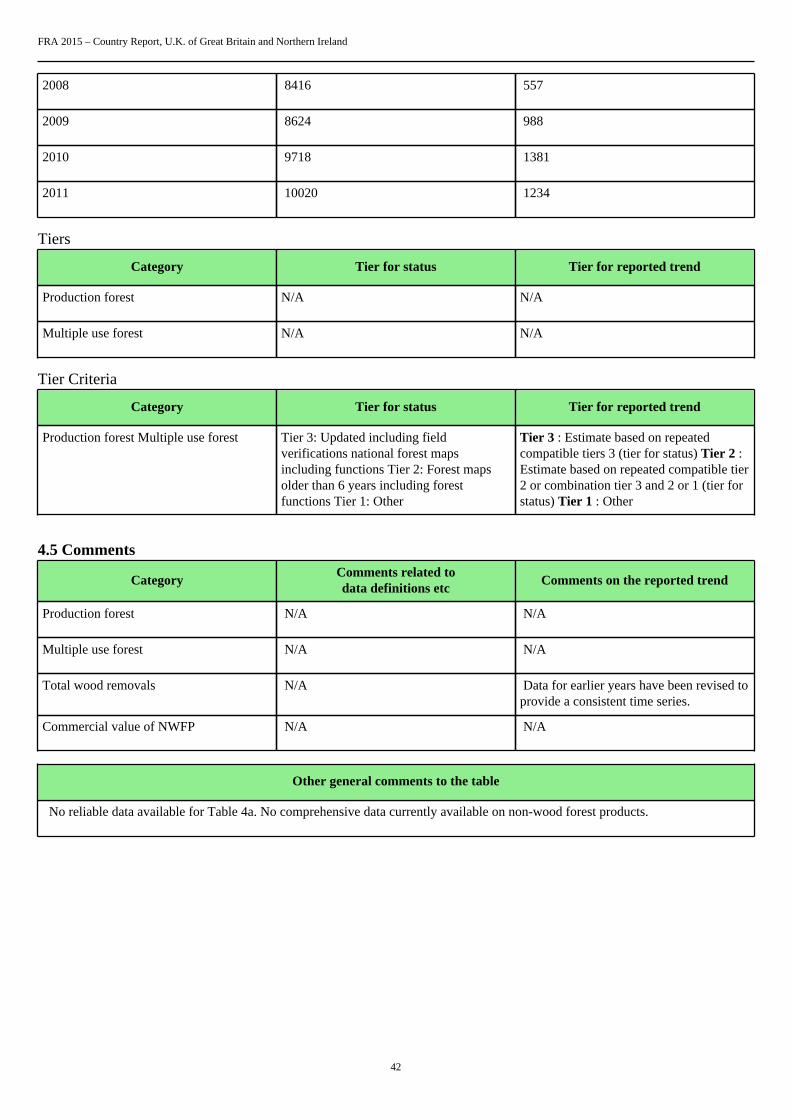
42
2008 8416 557
2009 8624 988
2010 9718 1381
2011 10020 1234
Tiers
Category Tier for status Tier for reported trend
Production forest N/A N/A
Multiple use forest N/A N/A
Tier Criteria
Category Tier for status Tier for reported trend
Production forest Multiple use forest Tier 3: Updated including fieldverifications national forest mapsincluding functions Tier 2: Forest mapsolder than 6 years including forestfunctions Tier 1: Other
Tier 3 : Estimate based on repeatedcompatible tiers 3 (tier for status) Tier 2 :Estimate based on repeated compatible tier2 or combination tier 3 and 2 or 1 (tier forstatus) Tier 1 : Other
4.5 Comments
CategoryComments related todata definitions etc
Comments on the reported trend
Production forest N/A N/A
Multiple use forest N/A N/A
Total wood removals N/A Data for earlier years have been revised toprovide a consistent time series.
Commercial value of NWFP N/A N/A
Other general comments to the table
No reliable data available for Table 4a. No comprehensive data currently available on non-wood forest products.
FRA 2015 – Country Report, U.K. of Great Britain and Northern Ireland
43
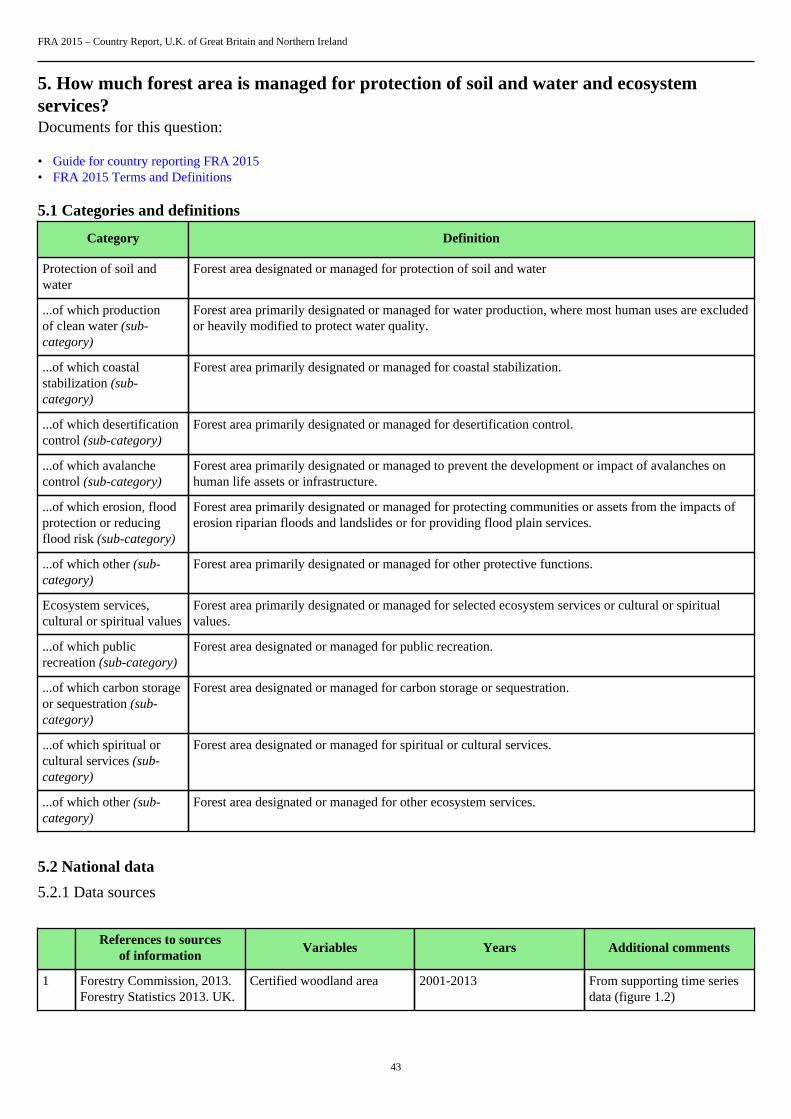
5. How much forest area is managed for protection of soil and water and ecosystemservices?Documents for this question:
• Guide for country reporting FRA 2015• FRA 2015 Terms and Definitions
5.1 Categories and definitions
Category Definition
Protection of soil andwater
Forest area designated or managed for protection of soil and water
...of which productionof clean water (sub-category)
Forest area primarily designated or managed for water production, where most human uses are excludedor heavily modified to protect water quality.
...of which coastalstabilization (sub-category)
Forest area primarily designated or managed for coastal stabilization.
...of which desertificationcontrol (sub-category)
Forest area primarily designated or managed for desertification control.
...of which avalanchecontrol (sub-category)
Forest area primarily designated or managed to prevent the development or impact of avalanches onhuman life assets or infrastructure.
...of which erosion, floodprotection or reducingflood risk (sub-category)
Forest area primarily designated or managed for protecting communities or assets from the impacts oferosion riparian floods and landslides or for providing flood plain services.
...of which other (sub-category)
Forest area primarily designated or managed for other protective functions.
Ecosystem services,cultural or spiritual values
Forest area primarily designated or managed for selected ecosystem services or cultural or spiritualvalues.
...of which publicrecreation (sub-category)
Forest area designated or managed for public recreation.
...of which carbon storageor sequestration (sub-category)
Forest area designated or managed for carbon storage or sequestration.
...of which spiritual orcultural services (sub-category)
Forest area designated or managed for spiritual or cultural services.
...of which other (sub-category)
Forest area designated or managed for other ecosystem services.
5.2 National data
5.2.1 Data sources
References to sourcesof information
Variables Years Additional comments
1 Forestry Commission, 2013.Forestry Statistics 2013. UK.
Certified woodland area 2001-2013 From supporting time seriesdata (figure 1.2)

FRA 2015 – Country Report, U.K. of Great Britain and Northern Ireland
44
2 N/A N/A N/A N/A
3 N/A N/A N/A N/A
4 N/A N/A N/A N/A
5.2.2 Classification and definitions
National class Definition
Certified woodland area Woodland area certified as sustainably managed.
N/A N/A
N/A N/A
N/A N/A
5.2.3 Original data
Estimates of UK certified woodland area (from supporting data to Forestry Statistics 2013 (ref 1)):
thousand hectares
Dec 2001 Mar 2005 Mar 2010 Mar 2013
UK certifiedwoodland area
1061 1257 1347 1362
5.3 Analysis and processing of national data
5.3.1 Adjustment
No adjustment required.
5.3.2 Estimation and forecasting
The area of woodland certified as complying with the UK Forestry Standard is used as a proxy estimate for thearea designated for protection of soil and water.
Certified woodland area data were first collected in December 2001, so this figure is used as an estimate for2000 and the figure for 1990 is marked as not available.
FRA 2015 – Country Report, U.K. of Great Britain and Northern Ireland
45
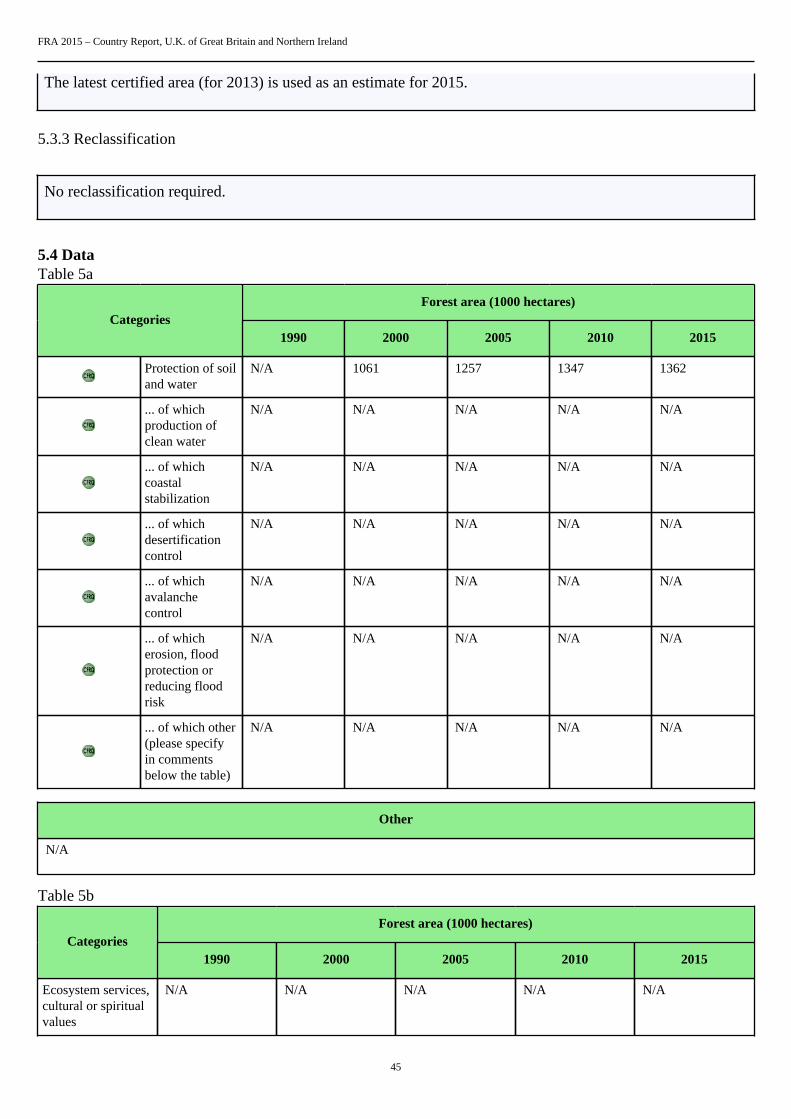
The latest certified area (for 2013) is used as an estimate for 2015.
5.3.3 Reclassification
No reclassification required.
5.4 DataTable 5a
Forest area (1000 hectares)Categories
1990 2000 2005 2010 2015
Protection of soiland water
N/A 1061 1257 1347 1362
... of whichproduction ofclean water
N/A N/A N/A N/A N/A
... of whichcoastalstabilization
N/A N/A N/A N/A N/A
... of whichdesertificationcontrol
N/A N/A N/A N/A N/A
... of whichavalanchecontrol
N/A N/A N/A N/A N/A
... of whicherosion, floodprotection orreducing floodrisk
N/A N/A N/A N/A N/A
... of which other(please specifyin commentsbelow the table)
N/A N/A N/A N/A N/A
Other
N/A
Table 5b
Forest area (1000 hectares)Categories
1990 2000 2005 2010 2015
Ecosystem services,cultural or spiritualvalues
N/A N/A N/A N/A N/A
FRA 2015 – Country Report, U.K. of Great Britain and Northern Ireland
46
...of which publicrecreation
N/A N/A N/A N/A N/A
...of whichcarbon storage orsequestration
N/A N/A N/A N/A N/A
...of which spiritualor cultural services
N/A N/A N/A N/A N/A
...of which other(please specify incomments belowthe table)
N/A N/A N/A N/A N/A
Tiers
Category Tier for reported trend Tier for status
Protection of soil and water Tier 1 Tier 1
Ecosystem services, cultural or spiritualvalues
N/A N/A
Tier criteria
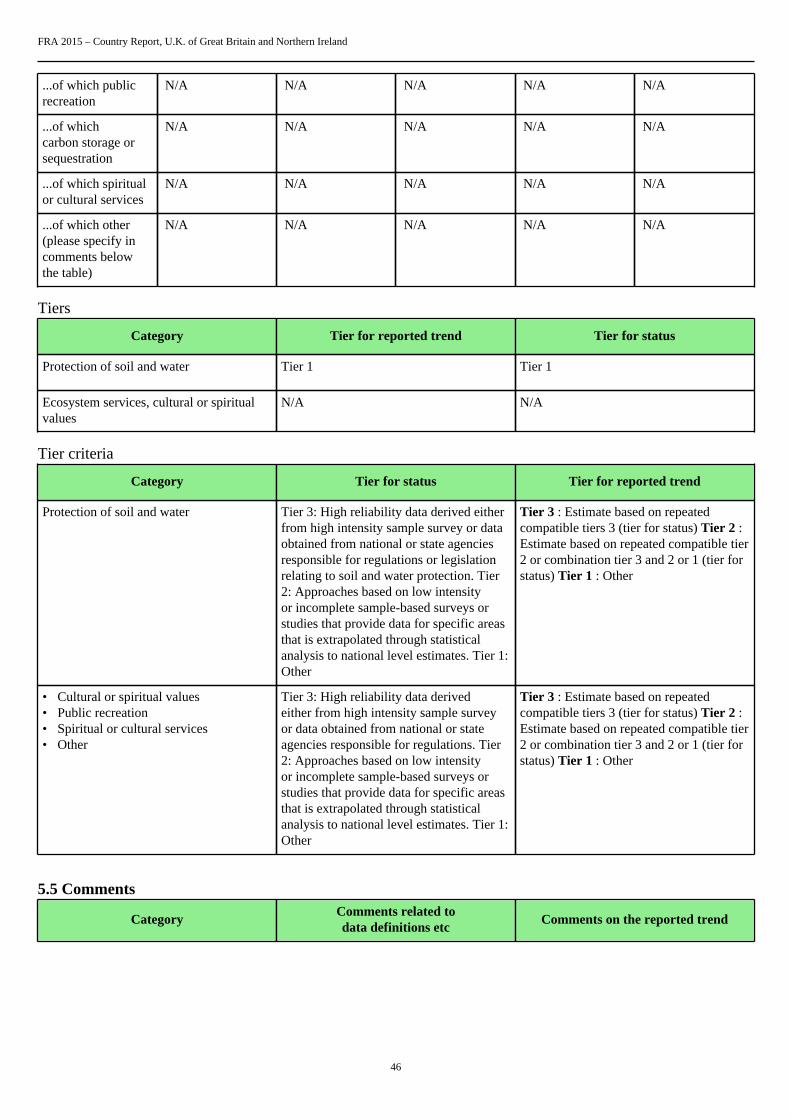
Category Tier for status Tier for reported trend
Protection of soil and water Tier 3: High reliability data derived eitherfrom high intensity sample survey or dataobtained from national or state agenciesresponsible for regulations or legislationrelating to soil and water protection. Tier2: Approaches based on low intensityor incomplete sample-based surveys orstudies that provide data for specific areasthat is extrapolated through statisticalanalysis to national level estimates. Tier 1:Other
Tier 3 : Estimate based on repeatedcompatible tiers 3 (tier for status) Tier 2 :Estimate based on repeated compatible tier2 or combination tier 3 and 2 or 1 (tier forstatus) Tier 1 : Other
• Cultural or spiritual values• Public recreation• Spiritual or cultural services• Other
Tier 3: High reliability data derivedeither from high intensity sample surveyor data obtained from national or stateagencies responsible for regulations. Tier2: Approaches based on low intensityor incomplete sample-based surveys orstudies that provide data for specific areasthat is extrapolated through statisticalanalysis to national level estimates. Tier 1:Other
Tier 3 : Estimate based on repeatedcompatible tiers 3 (tier for status) Tier 2 :Estimate based on repeated compatible tier2 or combination tier 3 and 2 or 1 (tier forstatus) Tier 1 : Other
5.5 Comments
CategoryComments related todata definitions etc
Comments on the reported trend
FRA 2015 – Country Report, U.K. of Great Britain and Northern Ireland
47
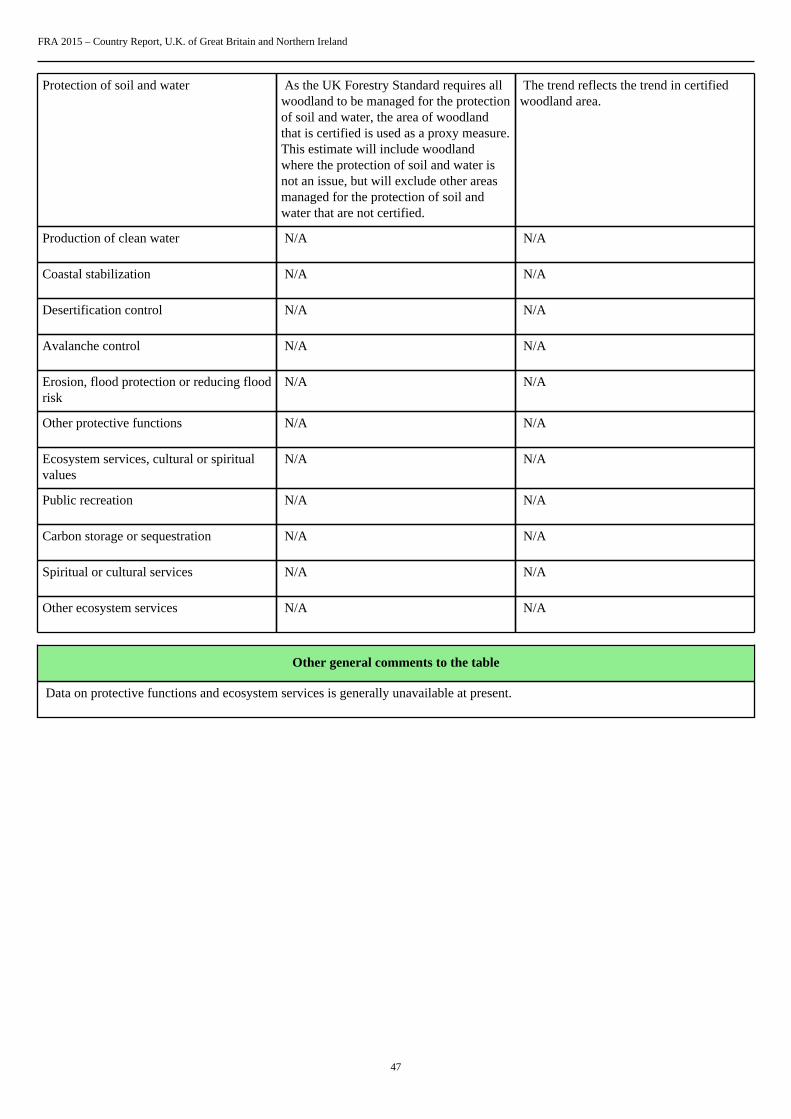
Protection of soil and water As the UK Forestry Standard requires allwoodland to be managed for the protectionof soil and water, the area of woodlandthat is certified is used as a proxy measure.This estimate will include woodlandwhere the protection of soil and water isnot an issue, but will exclude other areasmanaged for the protection of soil andwater that are not certified.
The trend reflects the trend in certifiedwoodland area.
Production of clean water N/A N/A
Coastal stabilization N/A N/A
Desertification control N/A N/A
Avalanche control N/A N/A
Erosion, flood protection or reducing floodrisk
N/A N/A
Other protective functions N/A N/A
Ecosystem services, cultural or spiritualvalues
N/A N/A
Public recreation N/A N/A
Carbon storage or sequestration N/A N/A
Spiritual or cultural services N/A N/A
Other ecosystem services N/A N/A
Other general comments to the table
Data on protective functions and ecosystem services is generally unavailable at present.

FRA 2015 – Country Report, U.K. of Great Britain and Northern Ireland
48
6. How much forest area is protected and designated for the conservation of biodiversityand how has it changed over time?Documents for this question:
• Guide for country reporting FRA 2015• FRA 2015 Terms and Definitions
6.1 Categories and definitions
Category Definition
Conservation ofbiodiversity
Forest area designated primarily for conservation of biological diversity. Includes but is not limited toareas designated for biodiversity conservation within the protected areas.
Forest area withinprotected areas
Forest area within formally established protected areas independently of the purpose for which theprotected areas were established.
6.2 National data
6.2.1 Data sources
References to sourcesof information
Variables Years Additional comments
1 Forestry Commission, 2013.National Forest Inventorymap 2012. UK.
Forest 2012 Great Britain
2 Maps of designated areas All various Sites of Special ScientificInterest, National NatureReserves, Local NatureReserves, Special ProtectionAreas and Special Areasof Conservation in GreatBritain, produced by NaturalEngland, Scottish NaturalHeritage and CountrysideCommission for Wales (nowNatural Resources Wales)
3 Forest Service (personalcommunication, 2014)
All 2013 Northern Ireland. Data fromthe NI Woodland Registerand Basemap 2013: http://www.dardni.gov.uk/index/forestry/the-forest-industry/woodland-register.htm
4 N/A N/A N/A N/A
6.2.2 Classification and definitions
National class Definition
Woodland As forest in FRA, but with canopy cover threshold of 20%(rather than 10%).
N/A N/A

FRA 2015 – Country Report, U.K. of Great Britain and Northern Ireland
49
N/A N/A
N/A N/A
6.2.3 Original data
GIS analysis of National Forest Inventory map (ref 1) and maps of protected areas (ref 2) gives the followingestimates of protected areas in Great Britain in areas that are defined as woodland (or forest):
• Sites of Special Scientific Interest (SSSI), excluding geological SSSIs = 245 thousand hectares• Including National Nature Reserves (NNRs) gives an additional 13 thousand hectares• Including Local Nature Reserves (LNRs) gives an additional 14 thousand hectares• Including Special Protection Areas (SPAs) gives an additional 10 thousand hectares• Including Special Areas of Conservation (SACs) gives an additional 4 thousand hectares
This gives a total protected area in Great Britain of 287 thousand hectares.
This estimate excludes SPAs in conifer woodlands in Scotland, where the designation is likely to be unrelatedto the woodland.
A similar GIS analysis by Forest Service gives an estimate of 3.5 thousand hectares of woodland (or forest) inMCPFE Class 1 in Northern Ireland.
6.3 Analysis and processing of national data
6.3.1 Adjustment
No adjustment required.
6.3.2 Estimation and forecasting
Estimates for Great Britain and for Northern Ireland are added to provide UK estimate.
6.3.3 Reclassification
No further reclassification required.
6.4 DataTable 6
Forest area (000 hectares)Categories
1990 2000 2005 2010 2015
FRA 2015 – Country Report, U.K. of Great Britain and Northern Ireland
50
Conservation ofbiodiversity
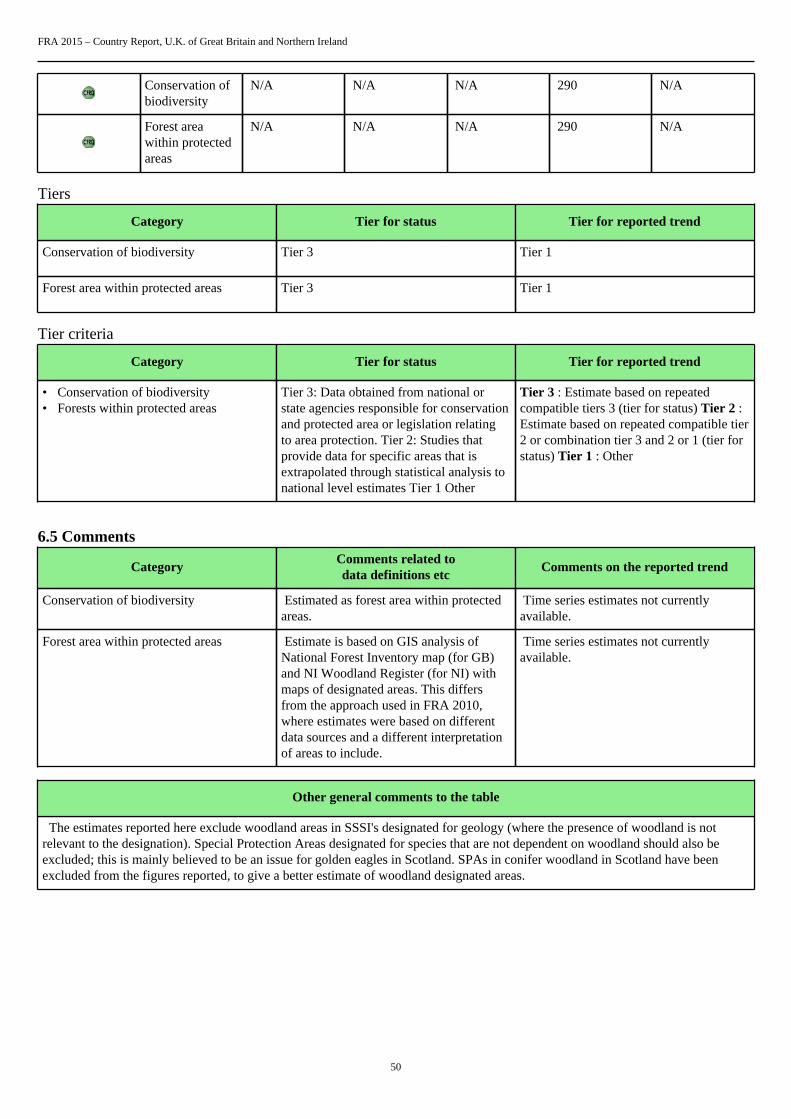
N/A N/A N/A 290 N/A
Forest areawithin protectedareas
N/A N/A N/A 290 N/A
Tiers
Category Tier for status Tier for reported trend
Conservation of biodiversity Tier 3 Tier 1
Forest area within protected areas Tier 3 Tier 1
Tier criteria
Category Tier for status Tier for reported trend
• Conservation of biodiversity• Forests within protected areas
Tier 3: Data obtained from national orstate agencies responsible for conservationand protected area or legislation relatingto area protection. Tier 2: Studies thatprovide data for specific areas that isextrapolated through statistical analysis tonational level estimates Tier 1 Other
Tier 3 : Estimate based on repeatedcompatible tiers 3 (tier for status) Tier 2 :Estimate based on repeated compatible tier2 or combination tier 3 and 2 or 1 (tier forstatus) Tier 1 : Other
6.5 Comments
CategoryComments related todata definitions etc
Comments on the reported trend
Conservation of biodiversity Estimated as forest area within protectedareas.
Time series estimates not currentlyavailable.
Forest area within protected areas Estimate is based on GIS analysis ofNational Forest Inventory map (for GB)and NI Woodland Register (for NI) withmaps of designated areas. This differsfrom the approach used in FRA 2010,where estimates were based on differentdata sources and a different interpretationof areas to include.
Time series estimates not currentlyavailable.
Other general comments to the table
The estimates reported here exclude woodland areas in SSSI's designated for geology (where the presence of woodland is notrelevant to the designation). Special Protection Areas designated for species that are not dependent on woodland should also beexcluded; this is mainly believed to be an issue for golden eagles in Scotland. SPAs in conifer woodland in Scotland have beenexcluded from the figures reported, to give a better estimate of woodland designated areas.
FRA 2015 – Country Report, U.K. of Great Britain and Northern Ireland
51
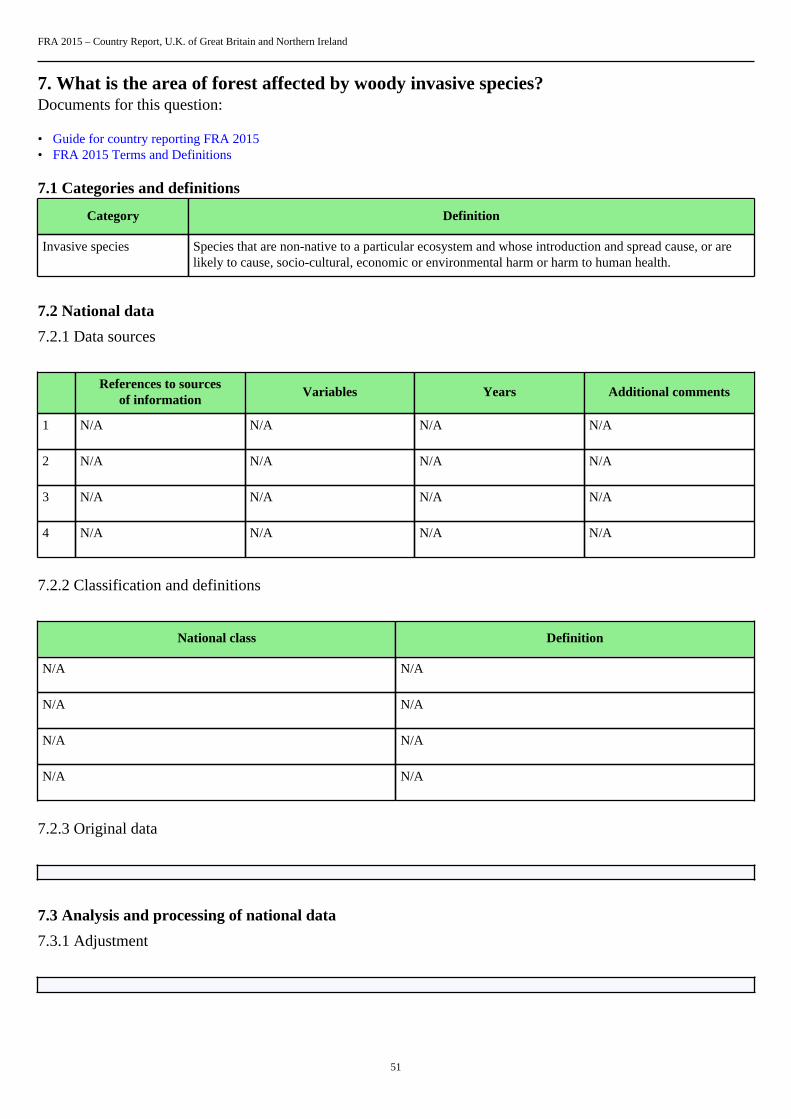
7. What is the area of forest affected by woody invasive species?Documents for this question:
• Guide for country reporting FRA 2015• FRA 2015 Terms and Definitions
7.1 Categories and definitions
Category Definition
Invasive species Species that are non-native to a particular ecosystem and whose introduction and spread cause, or arelikely to cause, socio-cultural, economic or environmental harm or harm to human health.
7.2 National data
7.2.1 Data sources
References to sourcesof information
Variables Years Additional comments
1 N/A N/A N/A N/A
2 N/A N/A N/A N/A
3 N/A N/A N/A N/A
4 N/A N/A N/A N/A
7.2.2 Classification and definitions
National class Definition
N/A N/A
N/A N/A
N/A N/A
N/A N/A
7.2.3 Original data
7.3 Analysis and processing of national data
7.3.1 Adjustment
FRA 2015 – Country Report, U.K. of Great Britain and Northern Ireland
52
7.3.2 Estimation and forecasting
7.3.3 Reclassification
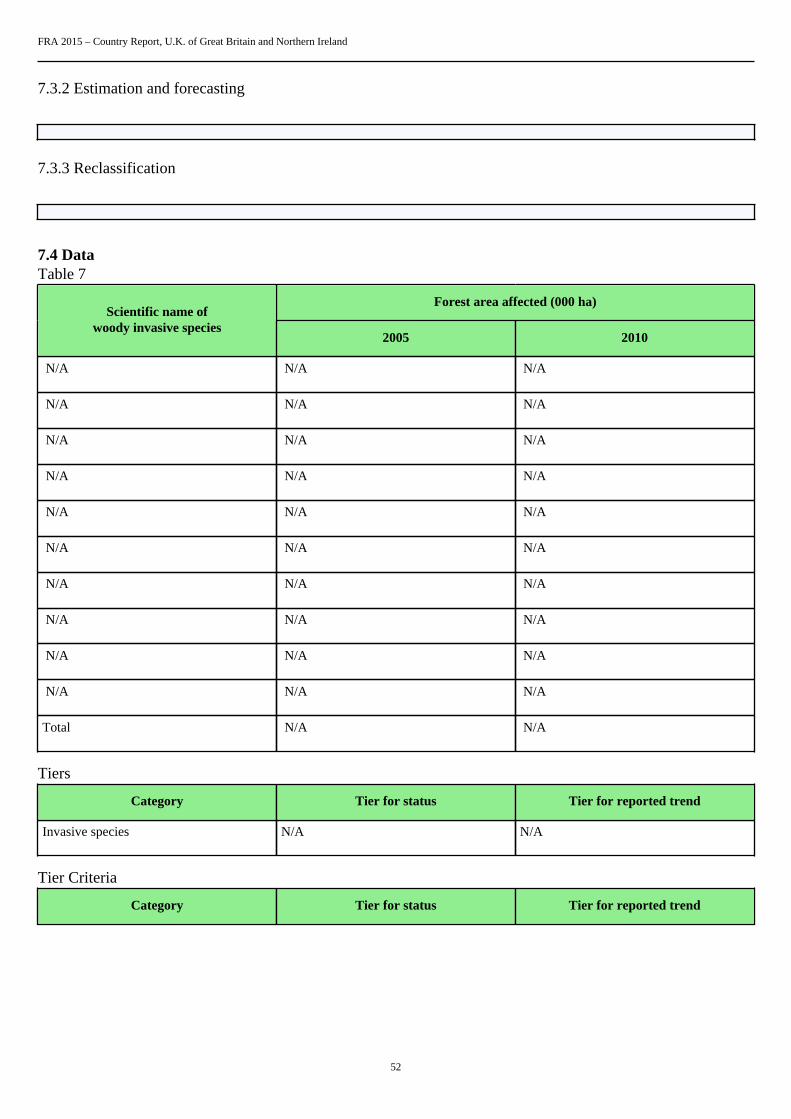
7.4 DataTable 7
Forest area affected (000 ha)Scientific name of
woody invasive species2005 2010
N/A N/A N/A
N/A N/A N/A
N/A N/A N/A
N/A N/A N/A
N/A N/A N/A
N/A N/A N/A
N/A N/A N/A
N/A N/A N/A
N/A N/A N/A
N/A N/A N/A
Total N/A N/A
Tiers
Category Tier for status Tier for reported trend
Invasive species N/A N/A
Tier Criteria
Category Tier for status Tier for reported trend

FRA 2015 – Country Report, U.K. of Great Britain and Northern Ireland
53
Invasive species Tier 3: Systematic assessment in forestinventory or other survey (e.g. byconservation department) within the last5 years) Tier 2: Systematic assessment inforest inventory or other survey (e.g. byconservation department conducted morethan 5 years ago) Tier 1: Other
Tier 3 : Estimate based on repeatedcompatible tiers 3 (tier for status) Tier 2 :Estimate based on repeated compatible tier2 or combination tier 3 and 2 or 1 (tier forstatus) Tier 1 : Other
7.5 Comments
CategoryComments related todata definitions etc
Comments on the reported trend
Invasive species N/A N/A
Other general comments to the table
Data not expected to be available until later in 2014.

FRA 2015 – Country Report, U.K. of Great Britain and Northern Ireland
54
8. How much forest area is damaged each year?Documents for this question:
• Guide for country reporting FRA 2015• FRA 2015 Terms and Definitions
8.1 Categories and definitions
Category Definition
Number of fires Number of fires per year
Burned area Area burned per year
Outbreaks of insects A detectable reduction in forest health caused by a sudden increase in numbers of harmful insects.
Outbreaks of diseases A detectable reduction in forest health caused by a sudden increase in numbers of harmful pathogens,such as bacteria, fungi, phytoplasma or virus.
Severe weather events Damage caused severe weather events, such as snow, storm, drought, etc.
8.2 National data
8.2.1 Data sources
References to sourcesof information
Variables Years Additional comments
1 FAO (MODIS) Total land area burned, forestarea burned
2003 - 2012 N/A
2 Forestry Commission/ ForestResearch research and expertknowledge on pests anddiseases
Outbreaks All Information is available onthe Forestry Commission andForest Research websites invarious Information Notes,etc
3 N/A N/A N/A N/A
4 N/A N/A N/A N/A
8.2.2 Classification and definitions
National class Definition
N/A N/A
N/A N/A
N/A N/A
N/A N/A
FRA 2015 – Country Report, U.K. of Great Britain and Northern Ireland
55
8.2.3 Original data
8.3 Analysis and processing of national data
8.3.1 Adjustment
8.3.2 Estimation and forecasting
8.3.3 Reclassification
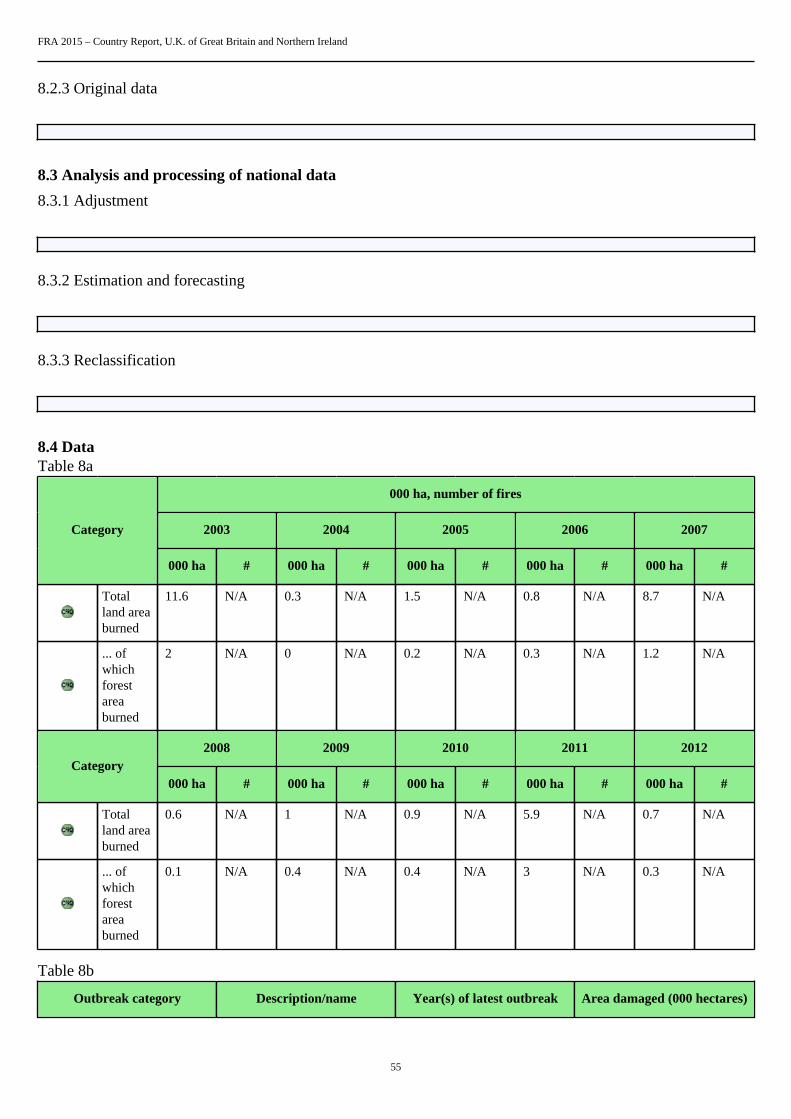
8.4 DataTable 8a
000 ha, number of fires
2003 2004 2005 2006 2007Category
000 ha # 000 ha # 000 ha # 000 ha # 000 ha #
Totalland areaburned
11.6 N/A 0.3 N/A 1.5 N/A 0.8 N/A 8.7 N/A
... ofwhichforestareaburned
2 N/A 0 N/A 0.2 N/A 0.3 N/A 1.2 N/A
2008 2009 2010 2011 2012Category
000 ha # 000 ha # 000 ha # 000 ha # 000 ha #
Totalland areaburned
0.6 N/A 1 N/A 0.9 N/A 5.9 N/A 0.7 N/A
... ofwhichforestareaburned
0.1 N/A 0.4 N/A 0.4 N/A 3 N/A 0.3 N/A
Table 8b
Outbreak category Description/name Year(s) of latest outbreak Area damaged (000 hectares)
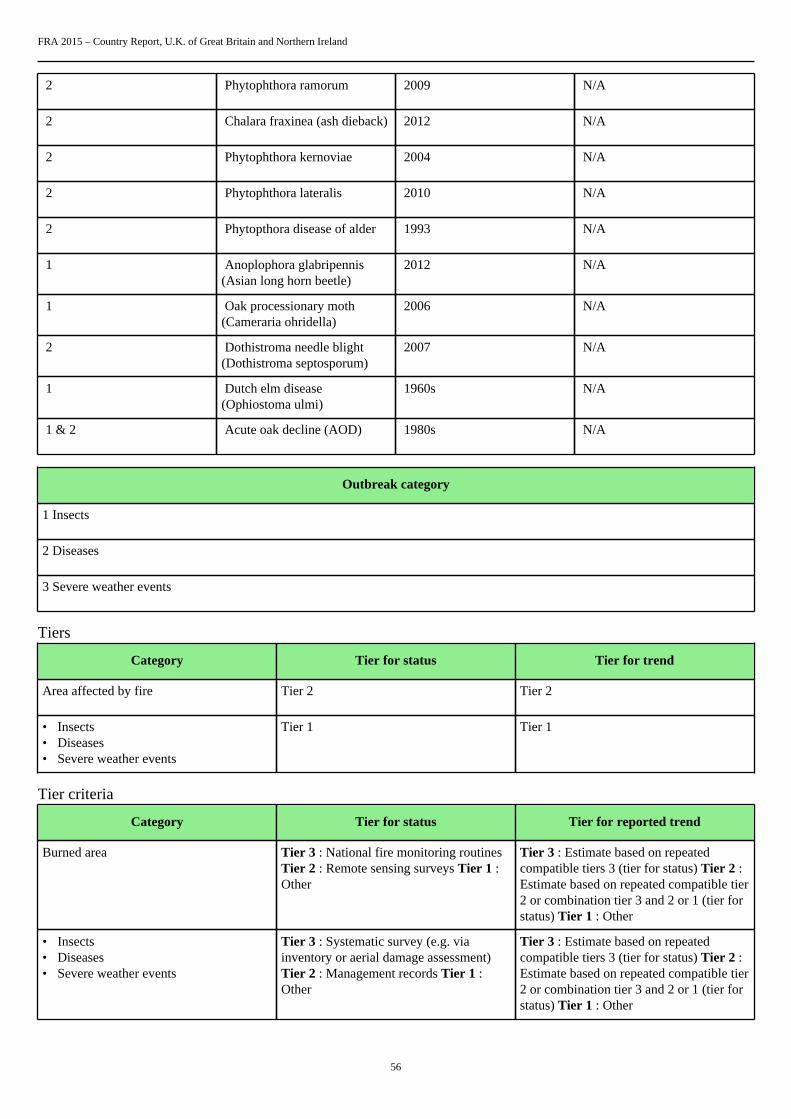
FRA 2015 – Country Report, U.K. of Great Britain and Northern Ireland
56
2 Phytophthora ramorum 2009 N/A
2 Chalara fraxinea (ash dieback) 2012 N/A
2 Phytophthora kernoviae 2004 N/A
2 Phytophthora lateralis 2010 N/A
2 Phytopthora disease of alder 1993 N/A
1 Anoplophora glabripennis(Asian long horn beetle)
2012 N/A
1 Oak processionary moth(Cameraria ohridella)
2006 N/A
2 Dothistroma needle blight(Dothistroma septosporum)
2007 N/A
1 Dutch elm disease(Ophiostoma ulmi)
1960s N/A
1 & 2 Acute oak decline (AOD) 1980s N/A
Outbreak category
1 Insects
2 Diseases
3 Severe weather events
Tiers
Category Tier for status Tier for trend
Area affected by fire Tier 2 Tier 2
• Insects• Diseases• Severe weather events
Tier 1 Tier 1
Tier criteria
Category Tier for status Tier for reported trend
Burned area Tier 3 : National fire monitoring routinesTier 2 : Remote sensing surveys Tier 1 :Other
Tier 3 : Estimate based on repeatedcompatible tiers 3 (tier for status) Tier 2 :Estimate based on repeated compatible tier2 or combination tier 3 and 2 or 1 (tier forstatus) Tier 1 : Other
• Insects• Diseases• Severe weather events
Tier 3 : Systematic survey (e.g. viainventory or aerial damage assessment)Tier 2 : Management records Tier 1 :Other
Tier 3 : Estimate based on repeatedcompatible tiers 3 (tier for status) Tier 2 :Estimate based on repeated compatible tier2 or combination tier 3 and 2 or 1 (tier forstatus) Tier 1 : Other
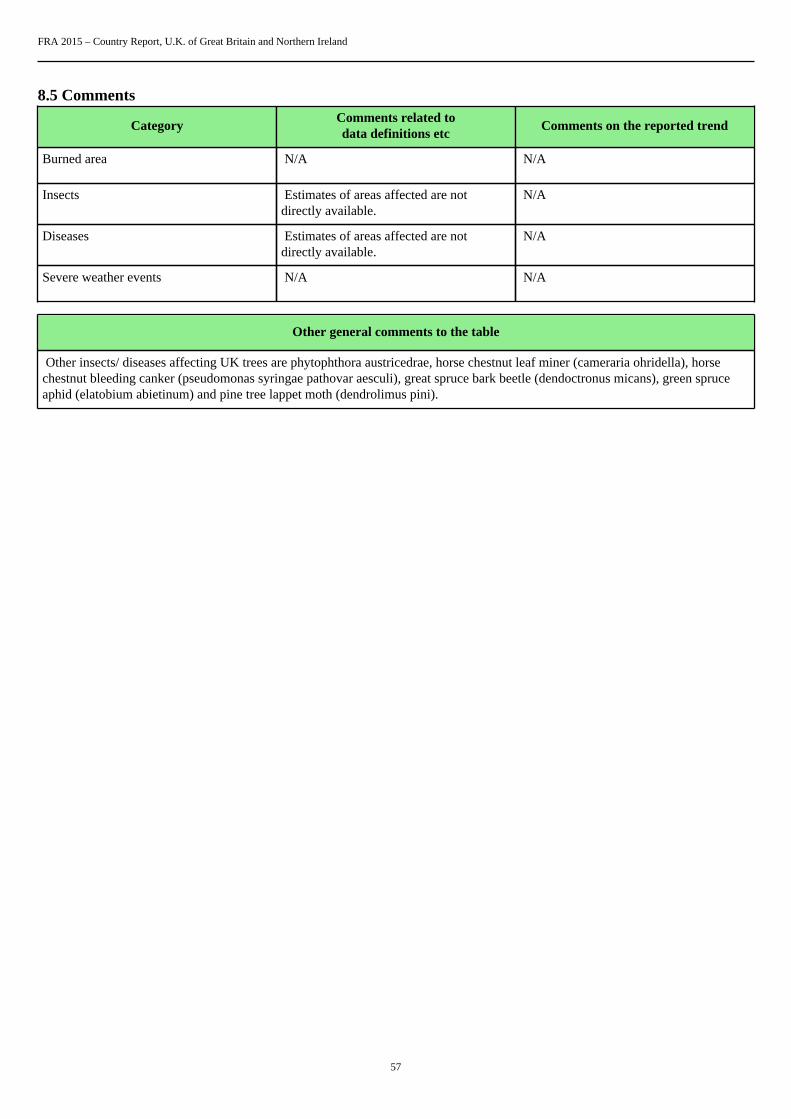
FRA 2015 – Country Report, U.K. of Great Britain and Northern Ireland
57
8.5 Comments
CategoryComments related todata definitions etc
Comments on the reported trend
Burned area N/A N/A
Insects Estimates of areas affected are notdirectly available.
N/A
Diseases Estimates of areas affected are notdirectly available.
N/A
Severe weather events N/A N/A
Other general comments to the table
Other insects/ diseases affecting UK trees are phytophthora austricedrae, horse chestnut leaf miner (cameraria ohridella), horsechestnut bleeding canker (pseudomonas syringae pathovar aesculi), great spruce bark beetle (dendoctronus micans), green spruceaphid (elatobium abietinum) and pine tree lappet moth (dendrolimus pini).
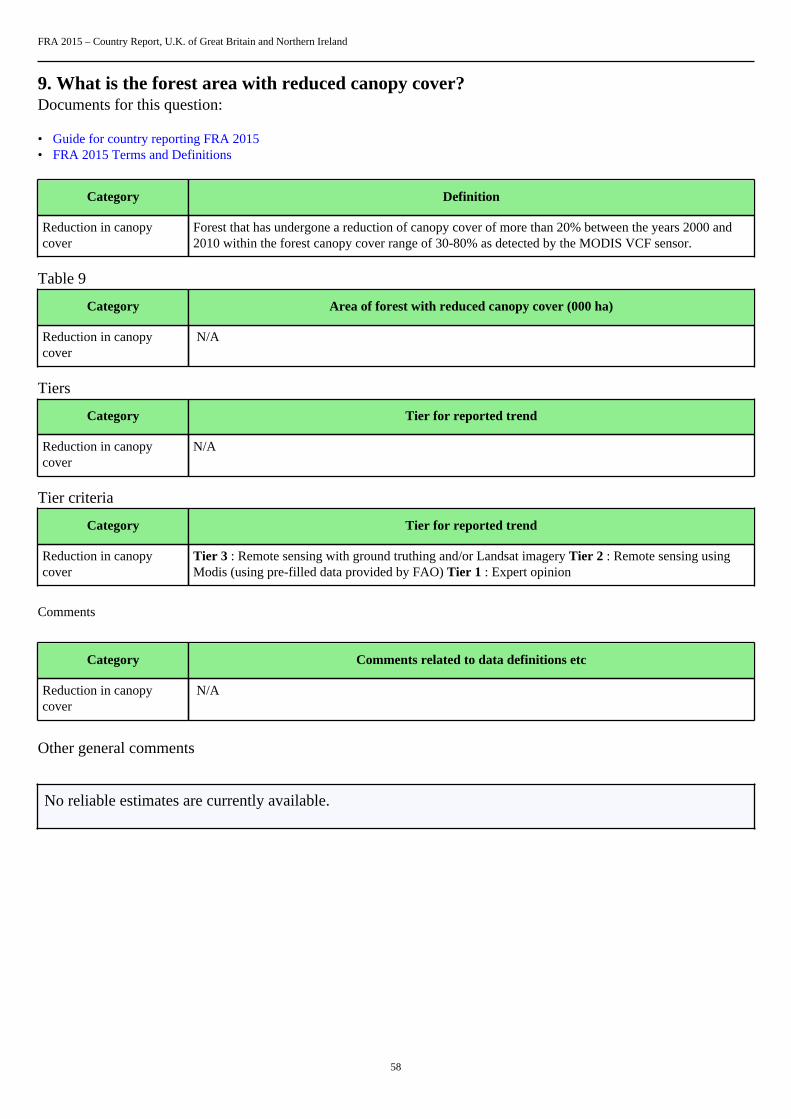
FRA 2015 – Country Report, U.K. of Great Britain and Northern Ireland
58
9. What is the forest area with reduced canopy cover?Documents for this question:
• Guide for country reporting FRA 2015• FRA 2015 Terms and Definitions
Category Definition
Reduction in canopycover
Forest that has undergone a reduction of canopy cover of more than 20% between the years 2000 and2010 within the forest canopy cover range of 30-80% as detected by the MODIS VCF sensor.
Table 9
Category Area of forest with reduced canopy cover (000 ha)
Reduction in canopycover
N/A
Tiers
Category Tier for reported trend
Reduction in canopycover
N/A
Tier criteria
Category Tier for reported trend
Reduction in canopycover
Tier 3 : Remote sensing with ground truthing and/or Landsat imagery Tier 2 : Remote sensing usingModis (using pre-filled data provided by FAO) Tier 1 : Expert opinion
Comments
Category Comments related to data definitions etc
Reduction in canopycover
N/A
Other general comments
No reliable estimates are currently available.
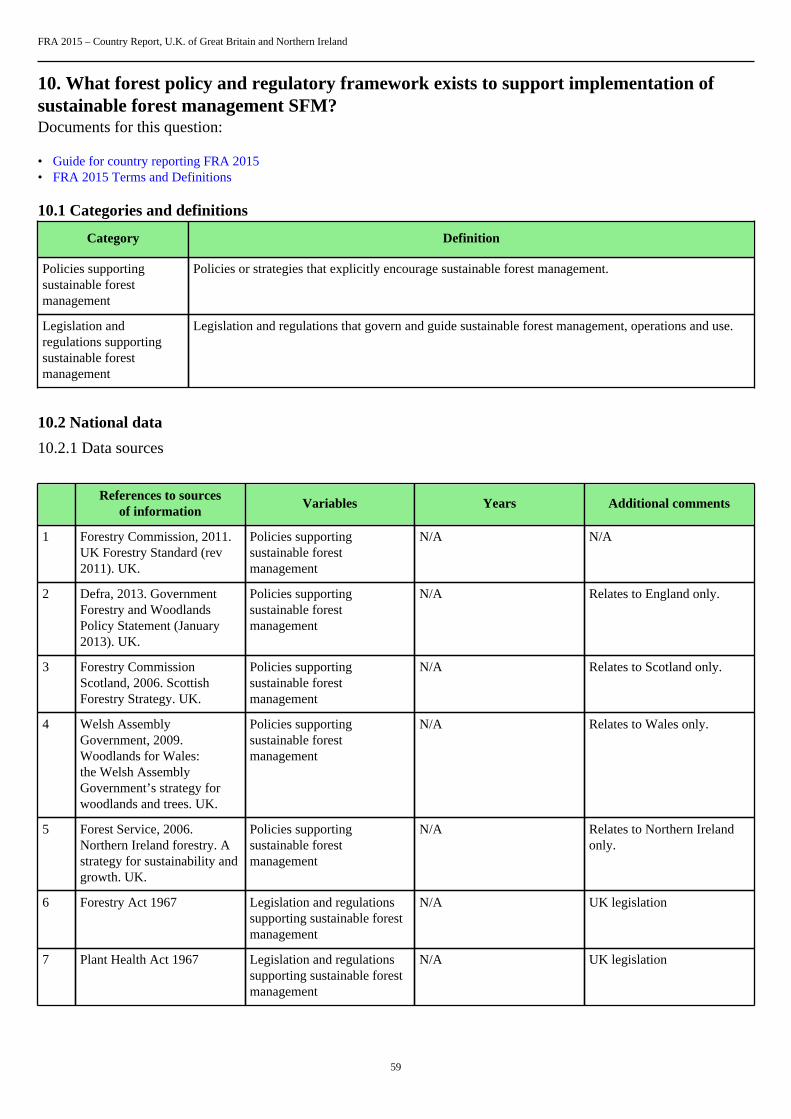
FRA 2015 – Country Report, U.K. of Great Britain and Northern Ireland
59
10. What forest policy and regulatory framework exists to support implementation ofsustainable forest management SFM?Documents for this question:
• Guide for country reporting FRA 2015• FRA 2015 Terms and Definitions
10.1 Categories and definitions
Category Definition
Policies supportingsustainable forestmanagement
Policies or strategies that explicitly encourage sustainable forest management.
Legislation andregulations supportingsustainable forestmanagement
Legislation and regulations that govern and guide sustainable forest management, operations and use.
10.2 National data
10.2.1 Data sources
References to sourcesof information
Variables Years Additional comments
1 Forestry Commission, 2011.UK Forestry Standard (rev2011). UK.
Policies supportingsustainable forestmanagement
N/A N/A
2 Defra, 2013. GovernmentForestry and WoodlandsPolicy Statement (January2013). UK.
Policies supportingsustainable forestmanagement
N/A Relates to England only.
3 Forestry CommissionScotland, 2006. ScottishForestry Strategy. UK.
Policies supportingsustainable forestmanagement
N/A Relates to Scotland only.
4 Welsh AssemblyGovernment, 2009.Woodlands for Wales:the Welsh AssemblyGovernment’s strategy forwoodlands and trees. UK.
Policies supportingsustainable forestmanagement
N/A Relates to Wales only.
5 Forest Service, 2006.Northern Ireland forestry. Astrategy for sustainability andgrowth. UK.
Policies supportingsustainable forestmanagement
N/A Relates to Northern Irelandonly.
6 Forestry Act 1967 Legislation and regulationssupporting sustainable forestmanagement
N/A UK legislation
7 Plant Health Act 1967 Legislation and regulationssupporting sustainable forestmanagement
N/A UK legislation
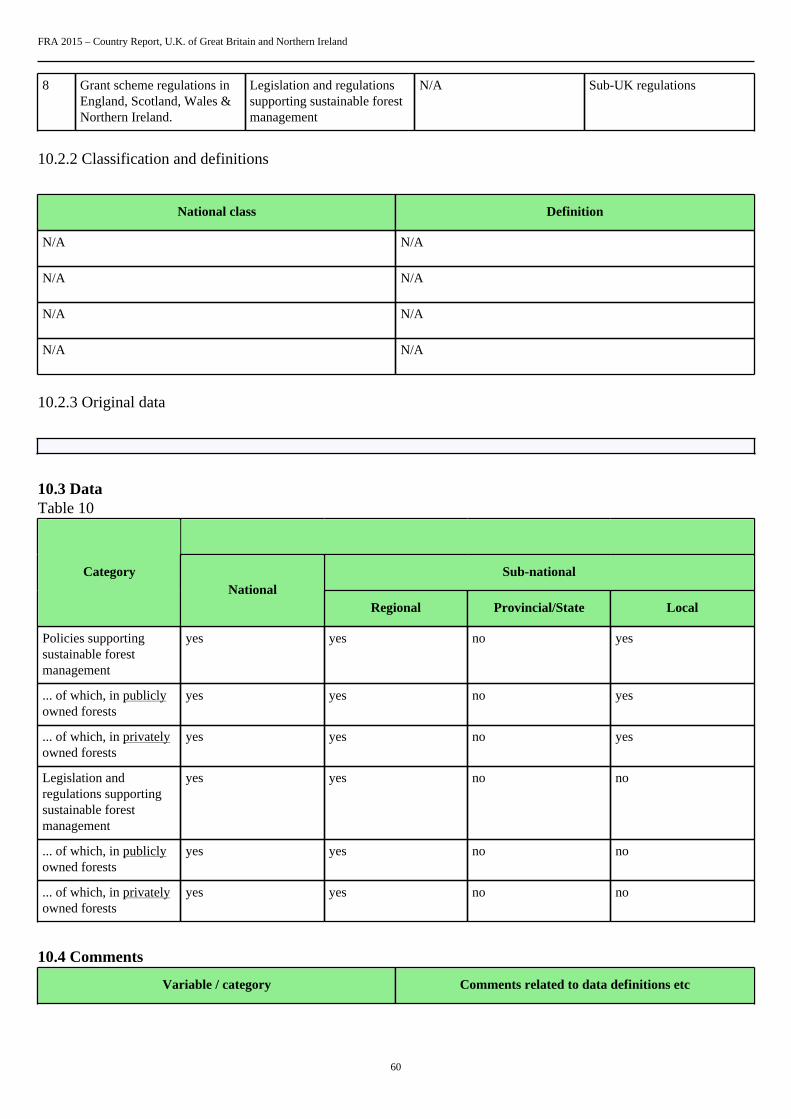
FRA 2015 – Country Report, U.K. of Great Britain and Northern Ireland
60
8 Grant scheme regulations inEngland, Scotland, Wales &Northern Ireland.
Legislation and regulationssupporting sustainable forestmanagement
N/A Sub-UK regulations
10.2.2 Classification and definitions
National class Definition
N/A N/A
N/A N/A
N/A N/A
N/A N/A
10.2.3 Original data
10.3 DataTable 10
Sub-nationalCategoryNational
Regional Provincial/State Local
Policies supportingsustainable forestmanagement
yes yes no yes
... of which, in publiclyowned forests
yes yes no yes
... of which, in privatelyowned forests
yes yes no yes
Legislation andregulations supportingsustainable forestmanagement
yes yes no no
... of which, in publiclyowned forests
yes yes no no
... of which, in privatelyowned forests
yes yes no no
10.4 Comments
Variable / category Comments related to data definitions etc
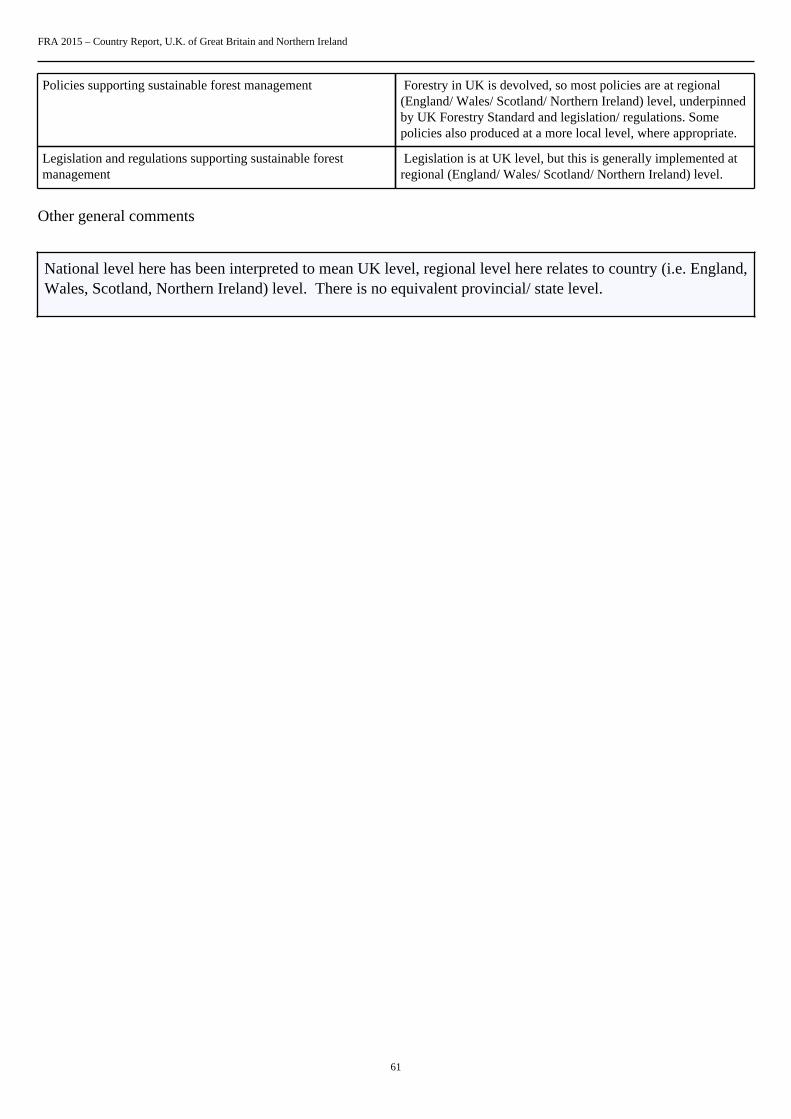
FRA 2015 – Country Report, U.K. of Great Britain and Northern Ireland
61
Policies supporting sustainable forest management Forestry in UK is devolved, so most policies are at regional(England/ Wales/ Scotland/ Northern Ireland) level, underpinnedby UK Forestry Standard and legislation/ regulations. Somepolicies also produced at a more local level, where appropriate.
Legislation and regulations supporting sustainable forestmanagement
Legislation is at UK level, but this is generally implemented atregional (England/ Wales/ Scotland/ Northern Ireland) level.
Other general comments
National level here has been interpreted to mean UK level, regional level here relates to country (i.e. England,Wales, Scotland, Northern Ireland) level. There is no equivalent provincial/ state level.
FRA 2015 – Country Report, U.K. of Great Britain and Northern Ireland
62
11. Is there a national platform that promotes stakeholder participation in forest policydevelopment?Documents for this question:
• Guide for country reporting FRA 2015• FRA 2015 Terms and Definitions
11.1 Categories and definitions
Category Definition
National stakeholderplatform
A recognized procedure that a broad range of stakeholders can use to provide opinions, suggestions,analysis, recommendations and other input into the development of national forest policy.
11.2 National data
11.2.1 Data sources
References to sources of information Years Additional comments
1 N/A N/A N/A
2 N/A N/A N/A
3 N/A N/A N/A
4 N/A N/A N/A
Table 11Is there a national platform that promotes or allows forstakeholder participation in forest policy development?
no
11.3 Comments
Category Comments related to data definitions etc
National stakeholder platform Most stakeholder participation is at regional (England/ Wales/Scotland/ Northern Ireland) or local level. There are someexamples of National Forestry Policy initiatives (e.g. WoodlandCarbon Code, review of plant health, etc), but there is nooverarching standing national platform. Stakeholder participationat UK level for input to UK Forest Standard (UKFS), but policyset by countries. UKFS sets approach of UK Government & setsstandards; it is periodically reviewed.
Other general comments
FRA 2015 – Country Report, U.K. of Great Britain and Northern Ireland
63
12. What is the forest area intended to be in permanent forest land use and how has itchanged over time?Documents for this question:
• Guide for country reporting FRA 2015• FRA 2015 Terms and Definitions
12.1 Categories and definitions
Category Definition
Forest area intended to bein permanent forest landuse
Forest area that is designated or expected to be retained as forest and is highly unlikely to be convertedto other land use.
...of which permanentforest estate (sub-category)
Forest area that is designated by law or regulation to be retained as forest and may not be converted toother land use.
12.2 National data
12.2.1 Data sources
References to sourcesof information
Variables Years Additional comments
1 N/A N/A N/A N/A
2 N/A N/A N/A N/A
3 N/A N/A N/A N/A
4 N/A N/A N/A N/A
12.2.2 Classification and definitions
National class Definition
Woodland As "forest" in FRA but with 20% canopy cover threshold (ratherthan 10%).
N/A N/A
N/A N/A
N/A N/A
12.2.3 Original data
12.3 Analysis and processing of national data
FRA 2015 – Country Report, U.K. of Great Britain and Northern Ireland
64
12.3.1 Adjustment
No adjustment required.
12.3.2 Estimation and forecasting
12.3.3 Reclassification
12.4 DataTable 12
Categories Forest area 2010 (000 ha)
Forest area intended to be in permanentforest land use
3059
... of which permanent forest estate 3059
Tiers
Category Tier for status
Forest area intended to be in permanent forest land use Tier 1
Permanent forest estate Tier 1
Tier Criteria
Category Tier for status
Forest area intended to be in permanent forest land use Tier 3 : National or sub-national land use plans strategydocuments or other reports within the past 10 years Tier 2 :National or sub-national land use plans strategy documents orother reports within the past 20 years Tier 1 : Other
Permanent forest estate Tier 3 : National or sub-national land use plans strategydocuments or other reports within the past 10 years Tier 2 :National or sub-national land use plans strategy documents orother reports within the past 20 years Tier 1 : Other
12.5 Comments
Category Comments related to data definitions etc
FRA 2015 – Country Report, U.K. of Great Britain and Northern Ireland
65
Forest area intended to be in permanent forest land use All woodland areas in the UK have a considerable degree ofprotection under the law, and in general the granting of a fellinglicence is conditional on restocking. Conversion of woodland toanother land use requires approval under appropriate procedures(e.g. planning, restoration of open habitats, etc). It is thereforeassumed that all woodland in the UK is in permanent forest landuse.
Permanent forest estate As above, all woodland in the UK can also be considered to bepermanent forest estate.
Other general comments
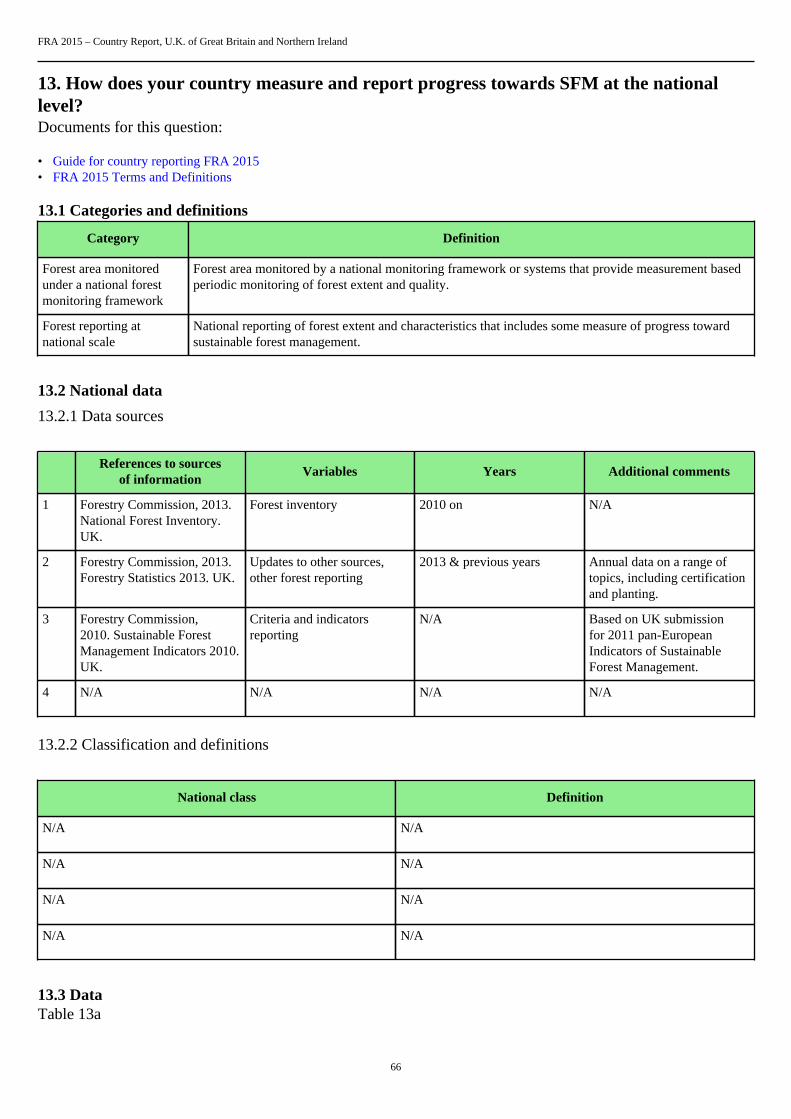
FRA 2015 – Country Report, U.K. of Great Britain and Northern Ireland
66
13. How does your country measure and report progress towards SFM at the nationallevel?Documents for this question:
• Guide for country reporting FRA 2015• FRA 2015 Terms and Definitions
13.1 Categories and definitions
Category Definition
Forest area monitoredunder a national forestmonitoring framework
Forest area monitored by a national monitoring framework or systems that provide measurement basedperiodic monitoring of forest extent and quality.
Forest reporting atnational scale
National reporting of forest extent and characteristics that includes some measure of progress towardsustainable forest management.
13.2 National data
13.2.1 Data sources
References to sourcesof information
Variables Years Additional comments
1 Forestry Commission, 2013.National Forest Inventory.UK.
Forest inventory 2010 on N/A
2 Forestry Commission, 2013.Forestry Statistics 2013. UK.
Updates to other sources,other forest reporting
2013 & previous years Annual data on a range oftopics, including certificationand planting.
3 Forestry Commission,2010. Sustainable ForestManagement Indicators 2010.UK.
Criteria and indicatorsreporting
N/A Based on UK submissionfor 2011 pan-EuropeanIndicators of SustainableForest Management.
4 N/A N/A N/A N/A
13.2.2 Classification and definitions
National class Definition
N/A N/A
N/A N/A
N/A N/A
N/A N/A
13.3 DataTable 13a
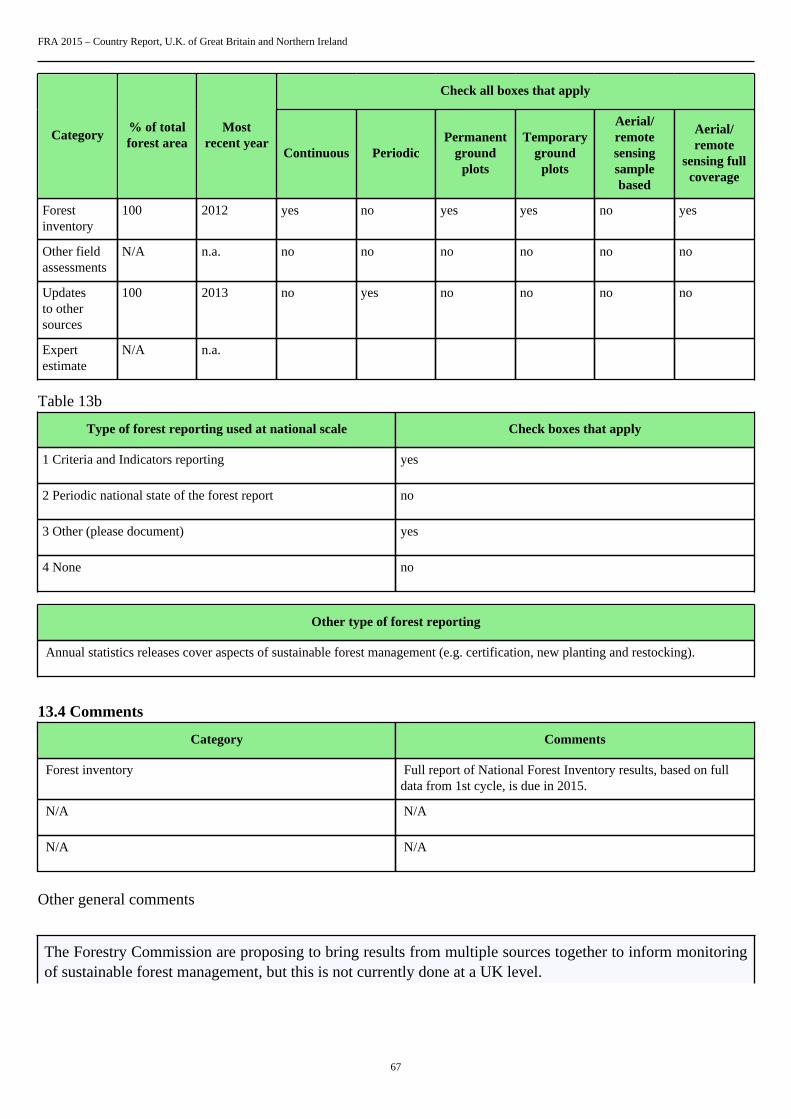
FRA 2015 – Country Report, U.K. of Great Britain and Northern Ireland
67
Check all boxes that apply
Category% of totalforest area
Mostrecent year
Continuous PeriodicPermanent
groundplots
Temporaryground
plots
Aerial/remotesensingsamplebased
Aerial/remote
sensing fullcoverage
Forestinventory
100 2012 yes no yes yes no yes
Other fieldassessments
N/A n.a. no no no no no no
Updatesto othersources
100 2013 no yes no no no no
Expertestimate
N/A n.a.
Table 13b
Type of forest reporting used at national scale Check boxes that apply
1 Criteria and Indicators reporting yes
2 Periodic national state of the forest report no
3 Other (please document) yes
4 None no
Other type of forest reporting
Annual statistics releases cover aspects of sustainable forest management (e.g. certification, new planting and restocking).
13.4 Comments
Category Comments
Forest inventory Full report of National Forest Inventory results, based on fulldata from 1st cycle, is due in 2015.
N/A N/A
N/A N/A
Other general comments
The Forestry Commission are proposing to bring results from multiple sources together to inform monitoringof sustainable forest management, but this is not currently done at a UK level.

FRA 2015 – Country Report, U.K. of Great Britain and Northern Ireland
68
Annual reporting on indicators is produced at a sub-UK level (England/ Scotland/ Wales/ Northern Ireland).
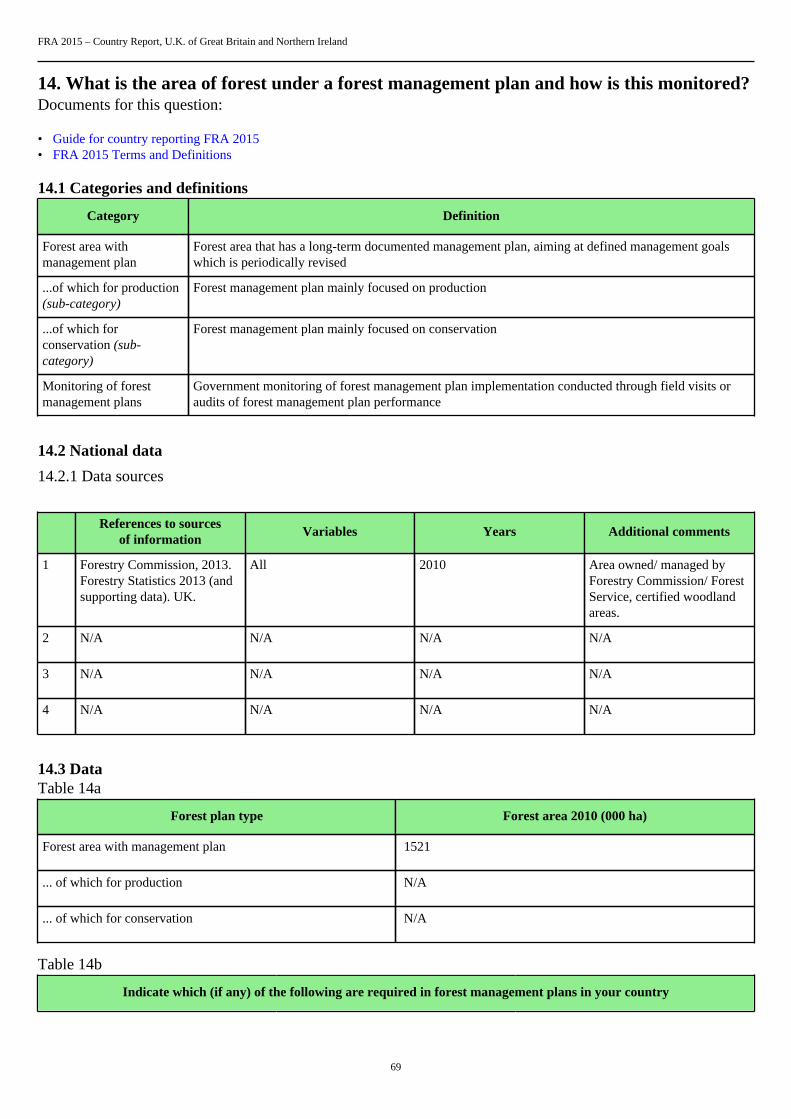
FRA 2015 – Country Report, U.K. of Great Britain and Northern Ireland
69
14. What is the area of forest under a forest management plan and how is this monitored?Documents for this question:
• Guide for country reporting FRA 2015• FRA 2015 Terms and Definitions
14.1 Categories and definitions
Category Definition
Forest area withmanagement plan
Forest area that has a long-term documented management plan, aiming at defined management goalswhich is periodically revised
...of which for production(sub-category)
Forest management plan mainly focused on production
...of which forconservation (sub-category)
Forest management plan mainly focused on conservation
Monitoring of forestmanagement plans
Government monitoring of forest management plan implementation conducted through field visits oraudits of forest management plan performance
14.2 National data
14.2.1 Data sources
References to sourcesof information
Variables Years Additional comments
1 Forestry Commission, 2013.Forestry Statistics 2013 (andsupporting data). UK.
All 2010 Area owned/ managed byForestry Commission/ ForestService, certified woodlandareas.
2 N/A N/A N/A N/A
3 N/A N/A N/A N/A
4 N/A N/A N/A N/A
14.3 DataTable 14a
Forest plan type Forest area 2010 (000 ha)
Forest area with management plan 1521
... of which for production N/A
... of which for conservation N/A
Table 14b
Indicate which (if any) of the following are required in forest management plans in your country
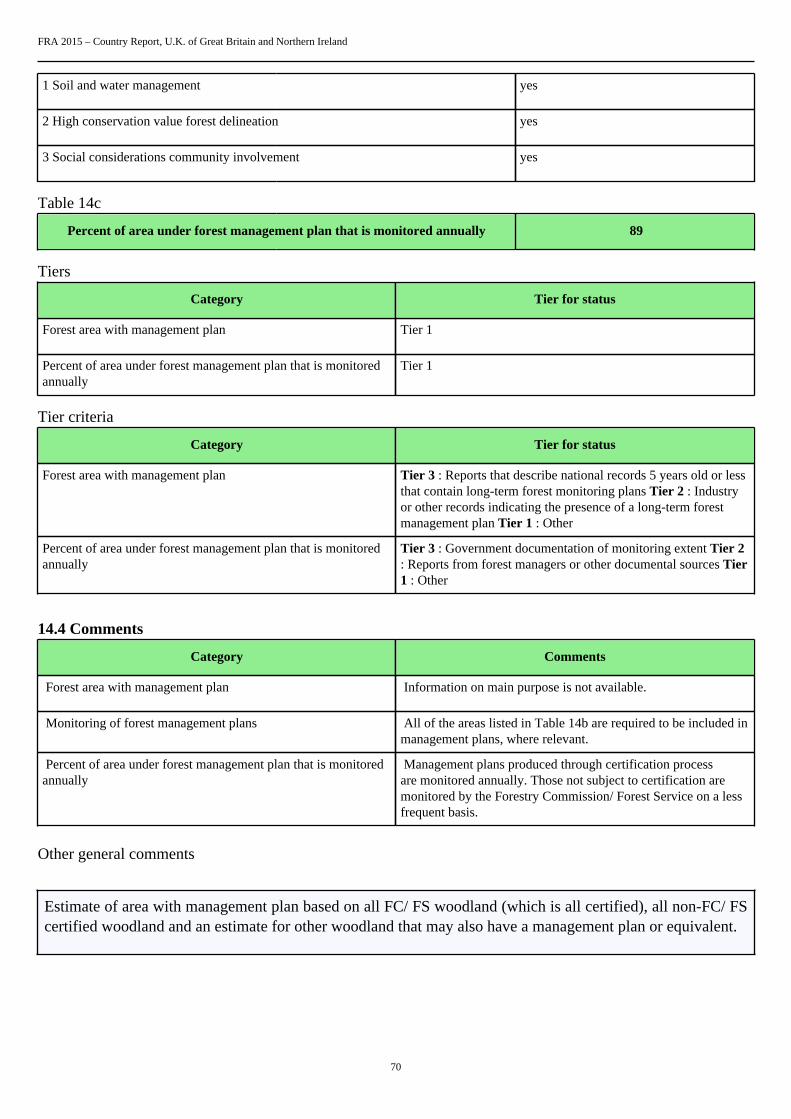
FRA 2015 – Country Report, U.K. of Great Britain and Northern Ireland
70
1 Soil and water management yes
2 High conservation value forest delineation yes
3 Social considerations community involvement yes
Table 14c
Percent of area under forest management plan that is monitored annually 89
Tiers
Category Tier for status
Forest area with management plan Tier 1
Percent of area under forest management plan that is monitoredannually
Tier 1
Tier criteria
Category Tier for status
Forest area with management plan Tier 3 : Reports that describe national records 5 years old or lessthat contain long-term forest monitoring plans Tier 2 : Industryor other records indicating the presence of a long-term forestmanagement plan Tier 1 : Other
Percent of area under forest management plan that is monitoredannually
Tier 3 : Government documentation of monitoring extent Tier 2: Reports from forest managers or other documental sources Tier1 : Other
14.4 Comments
Category Comments
Forest area with management plan Information on main purpose is not available.
Monitoring of forest management plans All of the areas listed in Table 14b are required to be included inmanagement plans, where relevant.
Percent of area under forest management plan that is monitoredannually
Management plans produced through certification processare monitored annually. Those not subject to certification aremonitored by the Forestry Commission/ Forest Service on a lessfrequent basis.
Other general comments
Estimate of area with management plan based on all FC/ FS woodland (which is all certified), all non-FC/ FScertified woodland and an estimate for other woodland that may also have a management plan or equivalent.

FRA 2015 – Country Report, U.K. of Great Britain and Northern Ireland
71
15. How are stakeholders involved in the management decision making for publiclyowned forests?Documents for this question:
• Guide for country reporting FRA 2015• FRA 2015 Terms and Definitions
15.1 Categories and definitions
Category Definition
Stakeholder involvement Stakeholder involvement is defined as significant inputs into at least one aspect of forest management atthe operational scale
Table 15
Please indicate the type of stakeholder involvement in forest management decision making required in your country
1. Planning phase yes
2. Operations phase yes
3. Review of operations yes
Tiers
Category Tier for status
Type of stakeholder inputs Tier 3
Tier criteria
Category Tier for status
Type of stakeholder inputs Tier 3 : Government (national or sub-national) documentation ofstakeholder inputs Tier 2 : Government (national or subnational)requirement but stakeholder inputs not documented Tier 1 :Other
15.2 Comments
Category Comments
Planning phase Includes public meetings and formal consultations.
Operations phase Consultation with key stakeholders.
Review of operations Various mechanisms exist for operational reviews.
Other general comments

FRA 2015 – Country Report, U.K. of Great Britain and Northern Ireland
72
16. What is the area of forest under an independently verified forest certification scheme?Documents for this question:
• Guide for country reporting FRA 2015• FRA 2015 Terms and Definitions
16.1 Categories and definitions
Category Definition
FSC certification Forest area certified under the Forest Stewardship Council certification scheme
PEFC certification Forest area certified under the Programme for the Endorsement of Forest Certification scheme
Other international forestmanagement certification
Forest area certified under an international forest management certification scheme with publishedstandards and is independently verified by a third-party, excluding FSC and PEFC certification.
Certified forest areausing a domestic forestmanagement certificationscheme
Area certified under a forest management certification scheme with published standards that arenationally recognized and independently verified by a thirdparty
16.2 DataTable 16a
Forest area (000 ha)International forest
management certification2000 2001 2002 2003 2004 2005 2006
FSC 0 1061.1 1075.4 0 1159.9 1257.1 1272.5
PEFC 0 0 0 0 0 0 0
Other 0 0 0 0 0 0 0
2007 2008 2009 2010 2011 2012
FSC 1324.9 1309.7 1332 1347.3 1325.1 1365
PEFC 0 0 0 0 0 1092.2
Other 0 0 0 0 0 0
Table 16b
Forest area (000 ha)Domestic forest
management certification2000 2001 2002 2003 2004 2005 2006
N/A 0 0 0 0 0 0 0
N/A 0 0 0 0 0 0 0
N/A 0 0 0 0 0 0 0
FRA 2015 – Country Report, U.K. of Great Britain and Northern Ireland
73
2007 2008 2009 2010 2011 2012
0 0 0 0 0 0
0 0 0 0 0 0
0 0 0 0 0 0
Tier criteria
Category Tier for status
International forest management certification Tier 3: International forest management scheme recordsmaintained by the certifying organization for the reporting yearTier 2: International forest management scheme records reportedby the certifying organization for a period 2 years prior to thereporting year Tier: 1 Other
Domestic forest management certification Tier 3: National registry reports for domestic forest managementcertification maintained by the certifying organization for thereporting year Tier 2: Domestic forest management schemerecords reported by the certifying organization for a period 2years prior to the reporting year Tier: 1 Other
Tiers
Category Tier for status
International forest management certification Tier 3
Domestic forest management certification N/A
16.3 Comments
Category Comments related to data definitions etc
Certified forest area using an international forest managementcertification scheme
Data has been amended, where possible, to revise certifiedwoodland areas in light of National Forest Inventory estimatesfor Forestry Commission woodland area and follow-up enquirieswith certificate holders. All PEFC woodland is also certifiedunder FSC.
Domestic forest management certification There are no domestic forest management certification schemesin the UK.
Other general comments
FRA 2015 – Country Report, U.K. of Great Britain and Northern Ireland
74
17. How much money do governments collect from and spend on forests?Documents for this question:
• Guide for country reporting FRA 2015• FRA 2015 Terms and Definitions
17.1 Categories and definitions
Category Definition
Forest revenue All government revenue collected from the domestic production and trade of forest products andservices. For this purpose revenue include:• Goods : roundwood; sawnwood; biomass; woodbased panels; pulp and paper and non-wood forest
products.• Services : including concession fees and royalties, stumpage payments, public timber sales revenue
taxes and charges based on forest area or yield, taxes on domestic trade and export of forest products,special levies on forestry activities and payments into forest related funds, other miscellaneousinspection, licence and administrative fees levied by forest administrations, permit and licence feesfor recreation and other forest related activities.
Public expenditure onforestry
All government expenditure on forest related activities.
17.2 National data
17.2.1 Data sources
References to sourcesof information
Variables Years Additional comments
1 Forestry Commission AnnualReports & Accounts
All All Great Britain (England,Wales and Scotland) only
2 Forest Service Annual Report& Accounts
All All Northern Ireland
3 N/A N/A N/A N/A
4 N/A N/A N/A N/A
17.3 DataTable 17
Revenues / expenditures (000 local currency)Category
2000 2005 2010
Forest revenue 124 129 170
Public expenditure on forestry 247 273 328
2000 2005 2010
Name of Local Currency GBP GBP GBP
FRA 2015 – Country Report, U.K. of Great Britain and Northern Ireland
75
17.4 Comments
Category Comments related to data definitions etc
Forest revenue Covers income to the Forestry Commission (in Great Britain)and the Forest Service (in Northern Ireland) in financial years2000-01, 2005-06 and 2010-11. The majority of revenue comesfrom public forests (timber sales, recreation, etc).
Public expenditure on forestry Covers expenditure by the Forestry Commission (in GreatBritain) and the Forest Service (in Northern Ireland) in financialyears 2000-01, 2005-06 and 2010-11.
Other general comments Figures are rounded to nearest £10,000. Estimates have beenrevised from figures submitted in previous FRA submissions.The Forestry Commission's responsibilities in Wales transferredto a new organisation, Natural Resources Wales, on 1 April2013.
Other general comments
FRA 2015 – Country Report, U.K. of Great Britain and Northern Ireland
76
18. Who owns and manages the forests and how has this changed?Documents for this question:
• Guide for country reporting FRA 2015• FRA 2015 Terms and Definitions
18.1 Categories and definitions
Category Definition
Public ownership Forest owned by the State or administrative units of the public administration or by institutions orcorporations owned by the public administration.
...of which owned by thestate at national scale(sub-category)
Forest owned by the State at the national scale or administrative units of the public administration or byinstitutions or corporations owned by the public administration.
...of which owned by thestate at the sub-nationalgovernment scale (sub-category)
Forest owned by the State at the sub-national government scale or administrative units of the publicadministration or by institutions or corporations owned by the public administration.
Private ownership Forest owned by individuals, families, communities, private cooperatives corporations and otherbusiness entities, private, religious and educational institutions, pension or investment funds, NGOs,nature conservation associations and other private institutions.
...of which individuals(sub-category)
Forest owned by individuals and families.
...of which privatebusiness entities andinstitutions (sub-category)
Forest owned by private corporations cooperatives companies and other business entities as well asprivate nonprofit organizations such as NGOs nature conservation associations, and private religiousand educational institutions etc.
...of which local tribal andindigenous communities(sub-category)
Forest owned by a group of individuals belonging to the same community residing within or in thevicinity of a forest area or forest owned by communities of indigenous or tribal people The communitymembers are coowners that share exclusive rights and duties and benefits contribute to the communitydevelopment.
Unknown ownership Forest area where ownership is unknown includes areas where ownership is unclear or disputed.
Categories related tomanagement rights
of public forestsDefinition
Public Administration The Public Administration (or institutions or corporations owned by the Public Administration) retainsmanagement rights and responsibilities within the limits specified by the legislation.
Individuals households Forest management rights and responsibilities are transferred from the Public Administration toindividuals or households through long-term leases or management agreements.
Private companies Forest management rights and responsibilities are transferred from the Public Administration tocorporations, other business entities private cooperatives, private nonprofit institutions and associations,etc., through long-term leases or management agreements.
Communities Forest management rights and responsibilities are transferred from the Public Administration to localcommunities (including indigenous and tribal communities) through long-term leases or managementagreements.
Other form ofmanagement rights
Forests for which the transfer of management rights does not belong to any of the categories mentionedabove.
18.2 National data
FRA 2015 – Country Report, U.K. of Great Britain and Northern Ireland
77
18.2.1 Data sources
References to sourcesof information
Variables Years Additional comments
1 Forestry Commission, 2013.Forestry Statistics 2013 (andsupporting data). UK
Ownership type 2000-2010 N/A
2 N/A N/A N/A N/A
3 N/A N/A N/A N/A
4 N/A N/A N/A N/A
18.2.2 Classification and definitions
National class Definition
Forestry Commission / Forest Service Woodland owned/ managed by the Forestry Commission (inGreat Britain) or Forest Service (in Northern Ireland)
Non-FC/ FS Woodland that is not owned/ managed by the ForestryCommission or Forest Service. It includes some woodlandowned by other public bodies (e.g. local authorities, Ministry ofDefence, etc).
N/A N/A
N/A N/A
18.2.3 Original data
Estimates of UK woodland area by ownership, from Forestry Statistics 2013 and supporting data (ref 1):
thousand hectares
2000 2005 2010
UK woodland area 2,954 3,021 3,059
FC/ FS 889 879 868
Non-FC/ FS 2,065 2,143 2,191
18.3 Analysis and processing of national data

FRA 2015 – Country Report, U.K. of Great Britain and Northern Ireland
78
18.3.1 Adjustment
No adjustment required.
18.3.2 Estimation and forecasting
To estimate data for 1990:
Total ownership = forest area from Table 1a.
The methodology used to roll back National Forest Inventory-based estimates of woodland area for Table 1awere also used to roll back the breakdown of this area by ownership, to ensure a consistent approach. Woodlandownership changes over time were taken into account, as well as new planting and deforestation estimates.
18.3.3 Reclassification
"Public ownership" is assumed to cover all woodland owned/ managed by the Forestry Commission or ForestService.
"Private ownership" is assumed to cover all other woodland.
18.4 DataTable 18a
Forest area (1000 hectares)Categories
1990 2000 2005 2010
Public ownership 903 889 879 868
... of which ownedby the state atnational scale
0 0 0 0
... of which ownedby the state atthe sub-nationalgovernment scale
903 889 879 868
Private ownership 1876 2065 2143 2191
... of which ownedby individuals
N/A N/A N/A N/A
... of which ownedby private businessentities andinstitutions
N/A N/A N/A N/A
FRA 2015 – Country Report, U.K. of Great Britain and Northern Ireland
79
... of which ownedby local, tribaland indigenouscommunities
N/A N/A N/A N/A
Unknownownership
0 0 0 0
TOTAL 2779.00 2954.00 3022.00 3059.00
Tiers
Category Tier for status Tier for reported trend
Public ownership Tier 3 Tier 2
Private ownership Tier 1 Tier 1
Unknown ownership Tier 1 Tier 1
Tier criteria
Category Tier for status Tier for reported trend
Ownership Tier 3: National forestry statistics registersof land titles or maps on land ownershipor all forest area under one ownershipcategory that is five years old or less. Tier2:National forestry statistics registers ofland titles or maps on land ownership orquestionnaires that are more than fiveyears old. Tier 1: Other
Tier 3 : Estimate based on repeatedcompatible tiers 3 (tier for status) Tier 2 :Estimate based on repeated compatible tier2 or combination tier 3 and 2 or 1 (tier forstatus) Tier 1 : Other
Table 18b - Holder of management rights of public forests
Forest area (000 hectares)Categories
1990 2000 2005 2010
Public Administration 903 889 879 868
Individuals 0 0 0 0
Private companies 0 0 0 0
Communities 0 0 0 0
Other 0 0 0 0
TOTAL 903.00 889.00 879.00 868.00
Category Tier for reported trend Tier for status
Public Administration Tier 2 Tier 3
FRA 2015 – Country Report, U.K. of Great Britain and Northern Ireland
80
Individuals Tier 1 Tier 1
Private companies Tier 1 Tier 1
Communities Tier 1 Tier 1
Other Tier 1 Tier 1
18.5 Comments
CategoryComments related todata definitions etc
Comments on the reported trend
Public ownership Data shown relates to woodland owned/managed by the Forestry Commission inGreat Britain or Forest Service in NorthernIreland. It excludes other publicly ownedland (e.g. by local authorities, Ministry ofDefence, etc). All Forestry Commission/Forest Service land is managed at sub-UKlevel.
Data have been adjusted to producea consistent time series. As a result,estimates for earlier years differ fromfigures previously reported.
Private ownership All non-FC/ FS woodland is assumed tobe in private ownership.
N/A
Unknown ownership There is assumed to be no woodland inunknown ownership
N/A
Management rights Since 2010 Scottish Ministers havehad the power to lease land managed byForestry Commission Scotland to localcommunities for forestry purposes (e.g.transfer the management and timberrights). These long term leases (minimumof 25 years) are available to eligiblecommunities via the National Forest LandScheme and aim to transfer the majority ofrights associated with forest managementand timber marketing and harvesting.A number of communities are currentlylooking into the option of leasing ForestryCommission Scotland managed land forforestry purposes but none have beenconcluded to date.
N/A
Other general comments to the table
Further information on ownership of woodland will be available from future analysis of National Forest Inventory data (possibly in2015).
FRA 2015 – Country Report, U.K. of Great Britain and Northern Ireland
81
19. How many people are directly employed in forestry?Documents for this question:
• Guide for country reporting FRA 2015• FRA 2015 Terms and Definitions
19.1 Categories and definitions
Category Definition
Full-time equivalents(FTE)
A measurement equal to one person working full-time during a specified reference period.
Employment in forestry Employment in activities related to production of goods derived from forests. This category correspondsto the ISIC/NACE Rev. 4 activity A02 (Forestry and logging).
19.2 National data
19.2.1 Data sources
References to sourcesof information
Variables Years Additional comments
1 Eurostat. Labour ForceSurvey.
All All Extract from data providedby Eurostat for 2015pan-European Indicatorsof Sustainable ForestManagement.
2 N/A N/A N/A N/A
3 N/A N/A N/A N/A
4 N/A N/A N/A N/A
19.2.2 Classification and definitions
National class Definition
N/A N/A
N/A N/A
N/A N/A
N/A N/A
19.2.3 Original data
Pre-filled data provided by Eurostat for 2015 pan-European Indicators of Sustainable Forest Management (ref1):
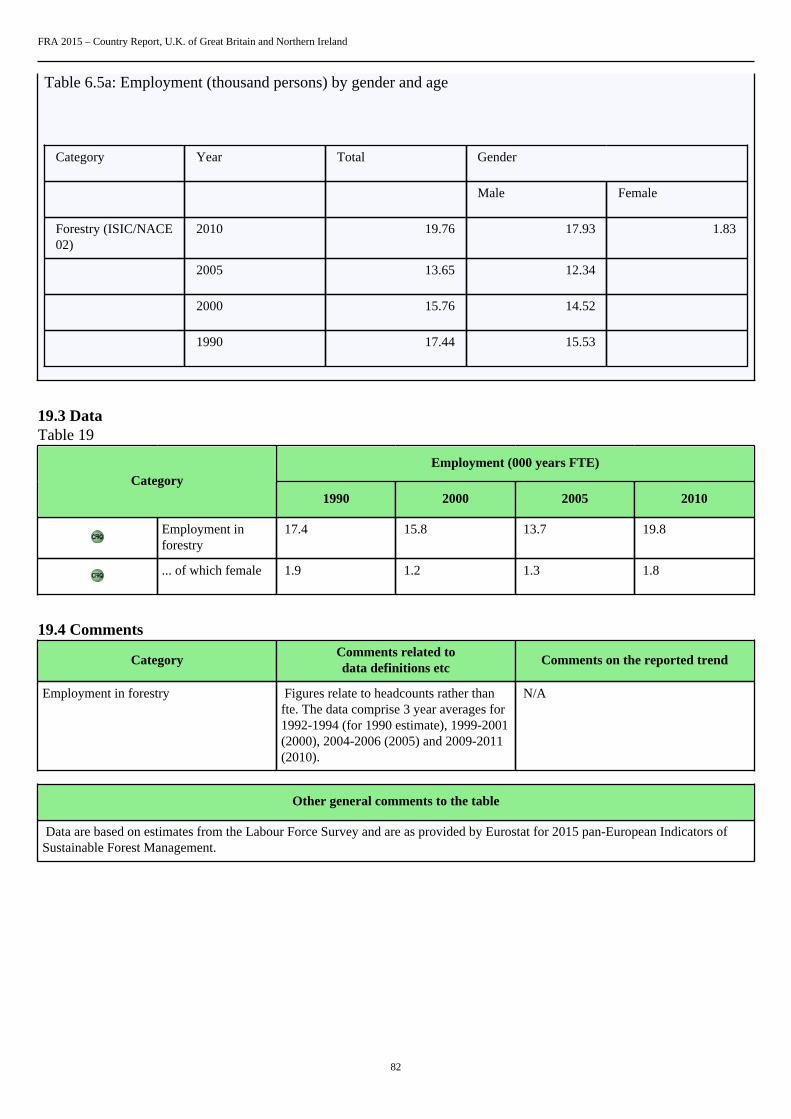
FRA 2015 – Country Report, U.K. of Great Britain and Northern Ireland
82
Table 6.5a: Employment (thousand persons) by gender and age
Category Year Total Gender
Male Female
Forestry (ISIC/NACE02)
2010 19.76 17.93 1.83
2005 13.65 12.34
2000 15.76 14.52
1990 17.44 15.53
19.3 DataTable 19
Employment (000 years FTE)Category
1990 2000 2005 2010
Employment inforestry
17.4 15.8 13.7 19.8
... of which female 1.9 1.2 1.3 1.8
19.4 Comments
CategoryComments related todata definitions etc
Comments on the reported trend
Employment in forestry Figures relate to headcounts rather thanfte. The data comprise 3 year averages for1992-1994 (for 1990 estimate), 1999-2001(2000), 2004-2006 (2005) and 2009-2011(2010).
N/A
Other general comments to the table
Data are based on estimates from the Labour Force Survey and are as provided by Eurostat for 2015 pan-European Indicators ofSustainable Forest Management.
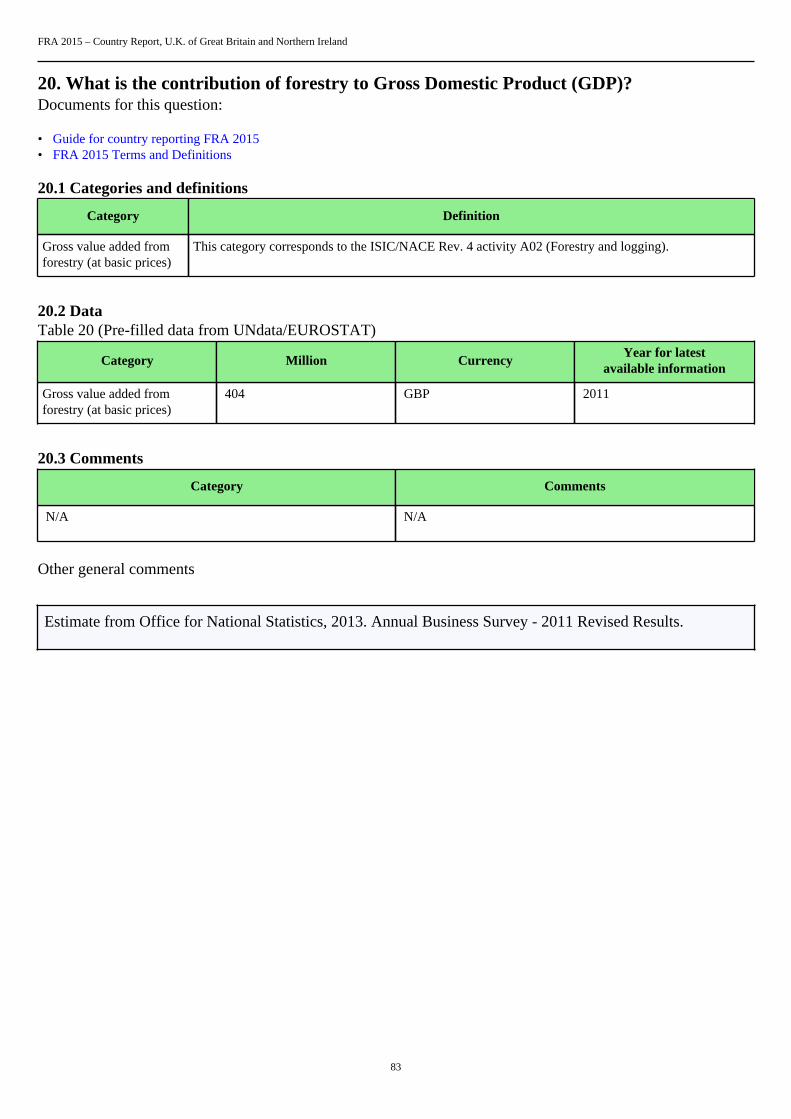
FRA 2015 – Country Report, U.K. of Great Britain and Northern Ireland
83
20. What is the contribution of forestry to Gross Domestic Product (GDP)?Documents for this question:
• Guide for country reporting FRA 2015• FRA 2015 Terms and Definitions
20.1 Categories and definitions
Category Definition
Gross value added fromforestry (at basic prices)
This category corresponds to the ISIC/NACE Rev. 4 activity A02 (Forestry and logging).
20.2 DataTable 20 (Pre-filled data from UNdata/EUROSTAT)
Category Million CurrencyYear for latest
available information
Gross value added fromforestry (at basic prices)
404 GBP 2011
20.3 Comments
Category Comments
N/A N/A
Other general comments
Estimate from Office for National Statistics, 2013. Annual Business Survey - 2011 Revised Results.
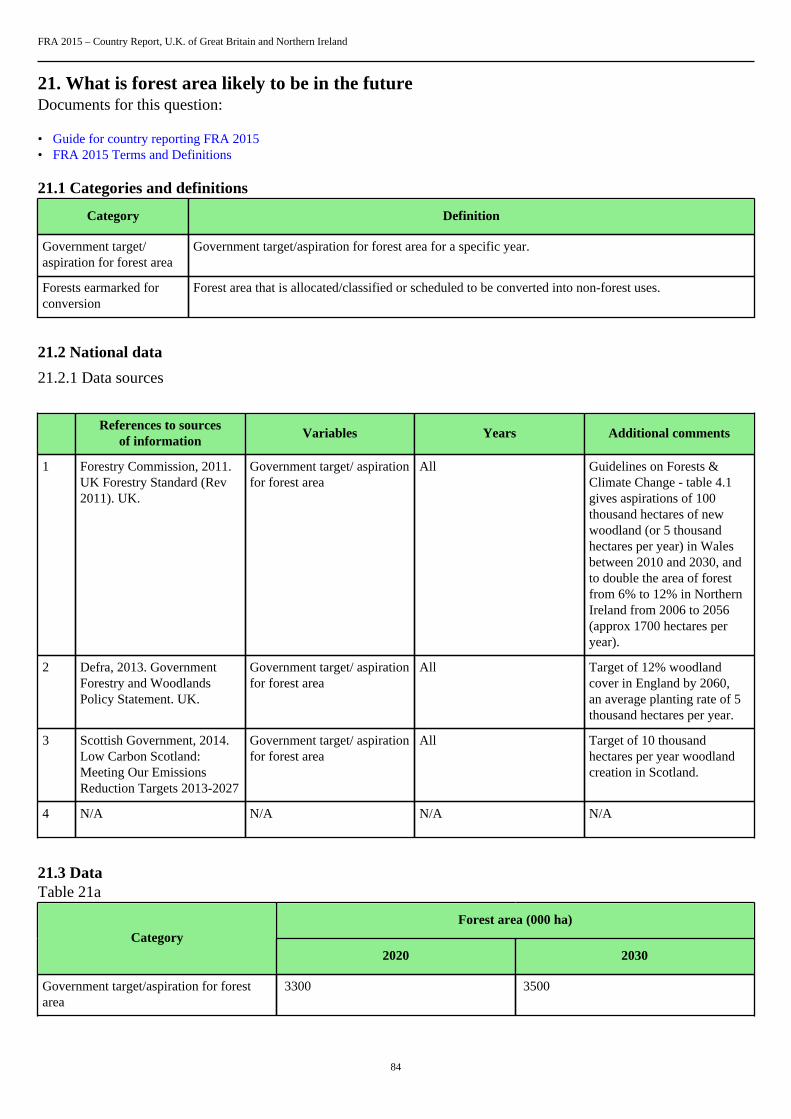
FRA 2015 – Country Report, U.K. of Great Britain and Northern Ireland
84
21. What is forest area likely to be in the futureDocuments for this question:
• Guide for country reporting FRA 2015• FRA 2015 Terms and Definitions
21.1 Categories and definitions
Category Definition
Government target/aspiration for forest area
Government target/aspiration for forest area for a specific year.
Forests earmarked forconversion
Forest area that is allocated/classified or scheduled to be converted into non-forest uses.
21.2 National data
21.2.1 Data sources
References to sourcesof information
Variables Years Additional comments
1 Forestry Commission, 2011.UK Forestry Standard (Rev2011). UK.
Government target/ aspirationfor forest area
All Guidelines on Forests &Climate Change - table 4.1gives aspirations of 100thousand hectares of newwoodland (or 5 thousandhectares per year) in Walesbetween 2010 and 2030, andto double the area of forestfrom 6% to 12% in NorthernIreland from 2006 to 2056(approx 1700 hectares peryear).
2 Defra, 2013. GovernmentForestry and WoodlandsPolicy Statement. UK.
Government target/ aspirationfor forest area
All Target of 12% woodlandcover in England by 2060,an average planting rate of 5thousand hectares per year.
3 Scottish Government, 2014.Low Carbon Scotland:Meeting Our EmissionsReduction Targets 2013-2027
Government target/ aspirationfor forest area
All Target of 10 thousandhectares per year woodlandcreation in Scotland.
4 N/A N/A N/A N/A
21.3 DataTable 21a
Forest area (000 ha)Category
2020 2030
Government target/aspiration for forestarea
3300 3500
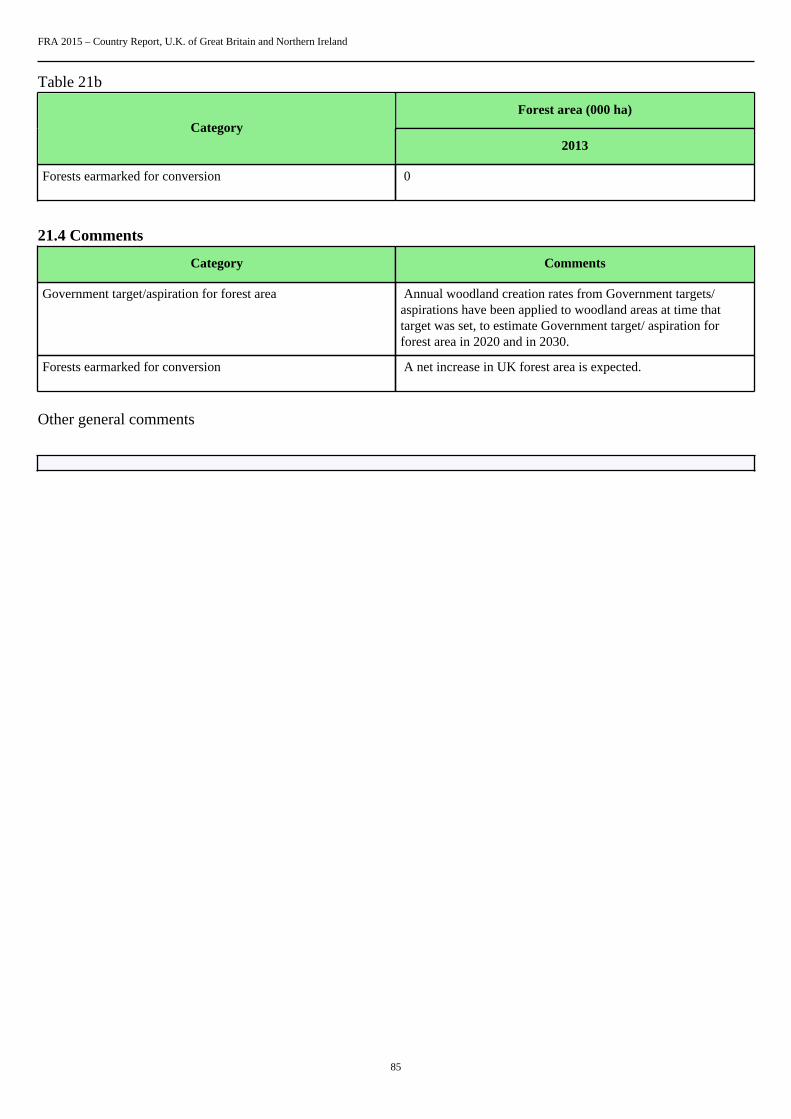
FRA 2015 – Country Report, U.K. of Great Britain and Northern Ireland
85
Table 21b
Forest area (000 ha)Category
2013
Forests earmarked for conversion 0
21.4 Comments
Category Comments
Government target/aspiration for forest area Annual woodland creation rates from Government targets/aspirations have been applied to woodland areas at time thattarget was set, to estimate Government target/ aspiration forforest area in 2020 and in 2030.
Forests earmarked for conversion A net increase in UK forest area is expected.
Other general comments


