Page 1
UNITED STATES BANKRUPTCY COURT EASTERN DISTRICT OF MICHIGAN
SOUTHERN DIVISION
----------------------------------------------------- In re CITY OF DETROIT, MICHIGAN, Debtor. -----------------------------------------------------
x::::::::x
Chapter 9 Case No. 13-53846 Hon. ______________
DECLARATION OF GAURAV MALHOTRA IN SUPPORT OF CITY OF DETROIT, MICHIGAN'S STATEMENT OF QUALIFICATIONS PURSUANT TO SECTION 109(c) OF THE BANKRUPTCY CODE
I, Gaurav Malhotra, hereby declare under penalty of perjury pursuant
to 28 U.S.C. § 1746 as follows:
1. I am a Principal of Ernst & Young LLP ("EY"), which currently
serves as financial restructuring advisor to the City of Detroit ("Detroit" or
the "City"), the debtor in the above-captioned chapter 9 case.
2. Contemporaneously with the filing of its petition and this
Declaration, the City has filed its: (a) Statement of Qualifications Pursuant to
Section 109(c) of the Bankruptcy Code (the "Statement of Qualifications"),
certifying that the City satisfies each of the criteria set forth in section 109(c) of
title 11 of the United States Code (the "Bankruptcy Code") for determining its
eligibility to be a debtor under chapter 9 of the Bankruptcy Code; and
13-53846 Doc 12 Filed 07/18/13 Entered 07/18/13 21:52:16 Page 1 of 52
Page 2
-2-
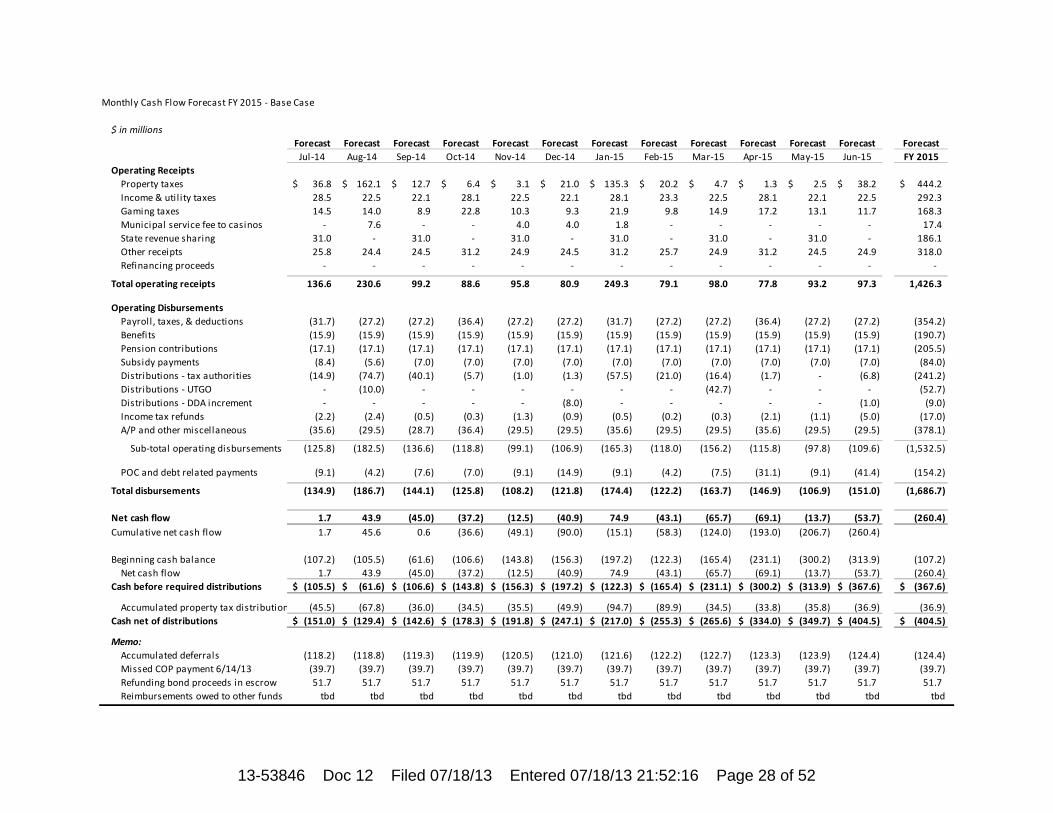
(b) Memorandum of Law in Support of Statement of Qualifications Pursuant to
Section 109(c) of the Bankruptcy Code (the "Memorandum of Law"). This
Declaration is made in support of the Statement of Qualifications and the
Memorandum of Law.
3. Except as otherwise indicated, all statements in this Declaration
are based on my personal knowledge and information derived from my
involvement in EY's services for the City that are described below. If called to
testify, I would be competent to testify to the facts set forth herein.
Education and Experience
4. In 2001, I received a Masters of Business Administration from
Case Western Reserve University with a dual major in Finance and Business
Policy. I have nearly 14 years of financial and operational restructuring
experience. Prior to joining EY in 2009, I was a Director in the restructuring
division of Macquarie Capital (USA) Inc., a leading merchant bank. I am a
Chartered Financial Analyst and a member of both the Turnaround Management
Association and the Association of Insolvency and Restructuring Advisors.
5. I have advised numerous entities, both in the public and private
sectors, and stakeholders in evaluating strategic alternatives and executing
complex restructuring transactions. I have experience with both in-court and
out-of-court restructuring processes, and also have extensive experience in leading
13-53846 Doc 12 Filed 07/18/13 Entered 07/18/13 21:52:16 Page 2 of 52
Page 3
-3-
complex negotiations with secured and unsecured creditors on behalf of distressed
entities. In addition to assisting in evaluating the impact of restructuring
alternatives, I have significant experience in liquidity analyses, cash flow
forecasting and business plan development, among other things.
6. Some of my private sector engagements include Liberty
Medical Supply, Inc., Schutt Sports, Collins & Aikman Corporation, Delta Air
Lines, Inc. and Eagle Picher. In addition, in the public sector, I was involved in the
recent restructuring efforts of Detroit Public Schools. These engagements — and
many others — involved debt and liquidity analysis, cash forecasting and related
projections of revenues and expenses.
Services for the City
7. The City engaged EY in May 2011 to assist the City with
liquidity forecasting and related restructuring initiatives. I have led EY's work for
the City since that time. EY's services have been focused primarily on the
restructuring initiatives impacting the City's general fund.
8. For approximately the first 18 months of EY's engagement by
the City, my work was largely focused on assisting the City in (a) conducting a
detailed analysis of the City's liquidity outlook under various scenarios,
(b) identifying various cost savings measures and (c) developing a short-term
tactical plan to preserve liquidity. These efforts involved, among other things:
13-53846 Doc 12 Filed 07/18/13 Entered 07/18/13 21:52:16 Page 3 of 52
Page 4
-4-
(a) participating in in-depth negotiations with several of the City's bargaining units;
(b) developing and refining a liquidity forecast; and (c) evaluating rolling
short-term financial forecasts. Recognizing that some of the cost savings measures
might not be accomplished in a timely manner or may not be sufficient to solve the
City's problems, my colleagues at EY and I also spent time assisting the City with
its evaluation of alternatives to preserve cash.
9. This work on behalf of the City in 2011 and 2012 enabled me to
understand the City's liquidity position, revenue sources and cost structure, among
other things. EY's scope of services included evaluating the City's funded debt
service and legacy costs, as reported by third parties, as well as its ongoing labor
cost structure. Provision of these services enabled EY to build a solid foundation
from which to begin the process of developing cash flow forecasts and ten-year
projections, as described below.
Cash Flow Forecasts and Ten-Year Projections
10. For approximately the past five months, my work for the City
has focused on assisting the City in the development of (a) monthly and quarterly
cash flow forecasts (collectively, the "Cash Flow Forecasts") and (b) ten-year
financial projections for the City under both "steady state" and "restructuring"
scenarios (collectively, the "Ten-Year Projections") for the City's general fund. I
led the team at EY that assisted in the preparation of the Cash Flow Forecasts and
13-53846 Doc 12 Filed 07/18/13 Entered 07/18/13 21:52:16 Page 4 of 52
Page 5
-5-
the Ten-Year Projections, based on information provided by the City and its
advisors. As such, I am familiar with the Cash Flow Forecasts and the Ten-Year
Projections and the manner in which they were prepared.
11. True and correct copies of current drafts of the Cash Flow
Forecasts and Ten-Year Projections are attached as Exhibit A and Exhibit B,
respectively. The City may ask EY to update the Cash Flow Forecasts and
Ten-Year Projections in the future to address potential developments in the City's
operational restructuring initiatives, such as a possible reduction in property tax
and income tax rates. The Cash Flow Forecasts and the Ten-Year Projections,
therefore, could change materially based on such changes in assumptions.
12. The first step in developing the Cash Flow Forecasts and the
Ten-Year Projections was to develop a baseline model for each. The baseline
models are "steady state" projections that depict the City's likely financial
trajectory in the absence of further restructuring. The baseline models include
certain changes and restructuring activities that: (a) already have been
implemented, such as most provisions of the City Employment Terms
(the "CETs") and the commencement of the outsourcing of payroll processing;
(b) are planned to be implemented in the future, having been approved by the City
before the March 2013 appointment of Kevyn D. Orr as the emergency manager
for the City (the "Emergency Manager"), such as the outsourcing of the operations
13-53846 Doc 12 Filed 07/18/13 Entered 07/18/13 21:52:16 Page 5 of 52
Page 6
-6-
and maintenance of the Public Lighting Department to the newly-created Public
Lighting Authority; and (c) reflect pension and healthcare cost estimates for future
years based on input from advisors to the City other than EY.
13. Not included in the baseline models are the operational
restructuring initiatives proposed by the Emergency Manager at the June 14, 2013
meeting with creditors (collectively, the "Operational Restructuring Initiatives").1
The Operational Restructuring Initiatives include: (a) substantial investment in,
and/or the restructuring of, various City departments (e.g., the Detroit Police
Department, the Detroit Fire Department (including the Emergency Medical
Services Division ("EMS")), the Detroit Department of Transportation, and the
Buildings, Safety, Engineering and Environmental Department); (b) substantial
investment in the City's blight removal efforts; and (c) substantial investments in
upgraded information technology for police, fire, EMS, transportation, grant
management, tax collection, budgeting and accounting and the City's court system.
See June 14 Creditor Proposal at 61-78. 1 At a meeting in the Detroit area on June 14, 2013, the Emergency Manager
presented a proposal that, among things, describes a thorough overhaul and restructuring of the City's operations, finances and capital structure, including the Operational Restructuring Initiatives (the "June 14 Creditor Proposal"). It is my understanding that a copy of the June 14 Creditor Proposal is attached to the Declaration of Kevyn D. Orr in Support of City of Detroit, Michigan's Statement of Qualifications Pursuant to Section 109(c) of the Bankruptcy Code (the "Orr Declaration"), filed contemporaneously herewith, as Exhibit A and is available at www.kccllc.net/Detroit.
13-53846 Doc 12 Filed 07/18/13 Entered 07/18/13 21:52:16 Page 6 of 52
Page 7
-7-
14. As described more fully below, EY conducted approximately
five months of extensive due diligence and analysis in connection with assisting in
the development of the baseline models. As a starting point in the development of
the baseline models, EY used the City's publicly-available historical financial data
— the Comprehensive Annual Financial Report of the City of Detroit, Michigan
for Fiscal Year Ended June 30, 2012, referenced hereafter as the "2012 CAFR" —
and other information provided by the City and its other advisors. EY did not audit
the City's historical financial data. Rather, EY relied upon the raw data provided
by the City, including the underlying data that the City used to prepare the
2012 CAFR and previous financial reports. Relying on the historical data provided
to EY by the City, EY sought to understand that data on a granular level. To do so,
EY analyzed the financial data and conducted extensive discussions with
employees in the City's various departments.
15. To assist in the development of the baseline models, EY
analyzed, among other things, (a) the City's historical financial data going back
to 2008 and (b) recent trends in the City's finances, with a particular focus on fiscal
years 2012 and 2013, as well as recent macroeconomic trends. Based on this
information, EY calculated "steady state" projections based on the City's existing
operating cost structure (identified in the Cash Flow Forecasts as "Base Case" and
in the Ten-Year Projections). As noted above, EY also incorporated into the
13-53846 Doc 12 Filed 07/18/13 Entered 07/18/13 21:52:16 Page 7 of 52
Page 8
-8-
baseline models changes and restructuring activities that were approved by City
before the appointment of the Emergency Manager.
16. To further assist in projecting future economic trends, EY
sought the advice and input of its own internal team members with experience in
economic forecasts impacting likely future property and income tax revenues. EY
also consulted various City and State employees to determine or confirm certain
assumptions. For example, EY consulted with the Director of the Office of
Revenue and Tax Analysis for the State of Michigan regarding the amount of
distributable state aid ("Distributable State Aid") that the City might expect to
receive going forward. EY also consulted with, and relied upon reports by,
Milliman, Inc. ("Milliman"), which provides actuarial services to the City,
regarding the City's legacy pension and retiree healthcare liabilities. EY used this
data gathered from the City and/or its advisors to modify assumptions so that they
reflected the most currently available information and data provided by the City
and its advisors. The baseline models, therefore, reflect the City's projected
financial outlook based on the data provided by the City and its advisors as
described in paragraphs 13 through 16, supra.
17. EY also assisted the City in the development of cash flow
forecasts and projections that include the Operational Restructuring Initiatives
(identified in the Cash Flow Forecasts and Ten-Year Projections as
13-53846 Doc 12 Filed 07/18/13 Entered 07/18/13 21:52:16 Page 8 of 52
Page 9
-9-
the "Restructuring Scenario"). To do so, EY primarily relied on work performed
by Conway MacKenzie, Inc. ("Conway"), the City's operational restructuring
advisor. Conway prepared a detailed department-by-department review of the
City's operations, infrastructure and needed investments. This work, completed in
consultation with the Emergency Manager and the City's other advisors, resulted in
a detailed plan for operational restructuring initiatives and investments (e.g., the
Operational Restructuring Initiatives). As noted above, these Operational
Restructuring Initiatives were adopted by the Emergency Manager as part of his
overall restructuring plan for the City. Conway provided EY with the expenditures
necessary to implement the Operational Restructuring Initiatives (identified in the
Cash Flow Forecasts and Ten-Year Projections as "Reinvestment
expenditures/adjustments").
18. EY layered the Reinvestment expenditures/adjustments into the
baseline models to project the City's financial position assuming the
implementation of the Operational Restructuring Initiatives. EY also incorporated
into the model: (a) certain potential costs estimated by EY as being needed to fund
a new defined contribution pension plan; (b) decommissioning costs related to the
Public Lighting Department; (c) the costs related to satisfy the City's secured debt
and other secured obligations as defined by the City and its advisors; and (d) other
restructuring costs. EY also considered potential increases in tax revenues
13-53846 Doc 12 Filed 07/18/13 Entered 07/18/13 21:52:16 Page 9 of 52
Page 10
-10-
attributable to higher growth. In the Ten-Year Projections, EY calculated the
amount of funds that would be available to unsecured creditors after making the
necessary reinvestment expenditures and making payments to secured creditors.
19. The Ten-Year Projections demonstrate that, absent additional
sources of revenue, the City's expected revenues could fall significantly short of
the levels required to fund the City's operations (including the Operational
Restructuring Initiatives) and fully satisfy its liabilities.
20. The City had negative cash flows of $115.5 million for the
fiscal year ended June 30, 2012, excluding the impact of proceeds from short-term
borrowings. While the City experienced positive cash flow in fiscal year 2013 of
$31.5 million (excluding the impact of borrowings), as of June 30, 2013 the City
had cumulative deferrals of nearly $160 million including a missed debt service
payment of $39.7 million and over $100 million of deferred pension contributions
relating to both fiscal years 2012 and 2013.
21. At the end of June 2013, the City had approximately
$71.3 million in cash on hand before estimated required property tax distributions
and $36.0 million net of such distributions. As a result of the $129.5 million
refunding bond transaction in fiscal year 2013, $71.7 million remains in an escrow
account that can be accessed only with State approval. Absent additional sources
of revenue and/or restructuring, the City is projecting to have cash flows of
13-53846 Doc 12 Filed 07/18/13 Entered 07/18/13 21:52:16 Page 10 of 52
Page 11
-11-
negative $198.5 million for the fiscal year ending June 30, 2014, and negative
$260.4 million for the fiscal year ending June 30, 2015.
22. The Base Case projections reflect that the City could have a
cash shortfall (after required distributions) of $11.6 million as early as
December 2013. That is, the Base Case projections show that the City is expected
to run out of available cash during the current calendar year. The Base Case
projections also reflect that, absent restructuring, the City could face a cash
shortfall (after required distributions) of $143.3 million as of the end of fiscal
year 2014, and $404.5 million as of the end of fiscal year 2015. Including the
City's accumulated payment deferrals in the foregoing totals would result in cash
shortfall of $300.6 million as of the end of fiscal year 2014 and $568.7 million as
of the end of fiscal year 2015.
23. Including the effect of recent debt issuances, the City's
accumulated general fund deficit was approximately $327 million as of the end of
fiscal year 2012. Excluding the effect of the $75 million debt issuance in fiscal
year 2008 and the $250 million debt issuance in fiscal year 2010, the City's
accumulated general fund deficit would have been approximately $650 million as
of the end of the 2012 fiscal year. Based on the City's preliminary estimate of
fiscal year 2013 results, it is estimated that, excluding the effect of the $75 million
debt issuance in fiscal year 2008, the $250 million debt issuance in fiscal year 2010
13-53846 Doc 12 Filed 07/18/13 Entered 07/18/13 21:52:16 Page 11 of 52
Page 12
-12-
and the $129.5 million debt issuance in fiscal year 2013, the City's accumulated
general fund deficit would have been approximately $700 million as of the end of
the 2013 fiscal year. The Ten-Year Projections reflect that, at the City's current
run rate and with no material changes to the estimated revenues or other data used
in the projections, the City's accumulated deficit could grow to approximately
$1.35 billion by fiscal year end 2017.
24. As set forth in the Ten-Year Projections, the City's wagering tax
revenues are projected to remain steady at approximately $170 million to
$180 million annually for the next ten years, which is similar to the City's gaming
tax receipts for the past five years.
25. Debt service for the City's general fund — including payments
related to limited and unlimited tax general obligation debt, obligations related to
the City's pension-related certificates of participation, pension contributions and
retiree benefit obligations — was $461.6 million for fiscal year 2012, and
$477.3 million in fiscal year 2013. During fiscal year 2012, more than 38% of the
City's actual revenue was consumed servicing the City's legacy liabilities. In the
2013 fiscal year, expenditures related to these obligations consumed 42.5% of the
City's revenues and, without adjustment, this number is expected to grow to almost
65% by 2017, as demonstrated by the table attached as Exhibit C.
13-53846 Doc 12 Filed 07/18/13 Entered 07/18/13 21:52:16 Page 12 of 52
Page 13
-13-
26. Based on the City's actual and projected cash flows for fiscal
years 2012, 2013 and 2014 — which take into account concessions already made
by certain creditor constituencies, such as significant reductions in the labor force
and other employment savings imposed by the CETs — additional concessions and
significant restructuring of the City's legacy costs may be required to make the City
cash flow positive without additional deferrals or new revenue sources.
Significant Indebtedness
27. In evaluating the City's financial circumstances and completing
the work described above over the past two years, EY has become familiar with the
City's debt structure, legacy liabilities and other obligations, an overview of which
is provided below as stated in the 2012 CAFR.
28. As of June 30, 2012, per the 2012 CAFR, the City reported
overall primary governmental balance sheet liabilities of approximately
$10.7 billion.2 The City's off-balance sheet liabilities — i.e., liabilities for
unfunded actuarially accrued pension liabilities and other post-employment benefit
("OPEB") liabilities — are nearly equal to the balance sheet liabilities described
above. As of June 30, 2011 (the most recent actuarial valuation date), utilizing the
actuarial data provided by the pension trusts' actuary, the City's reported pension
2 2012 CAFR at p. 41.
13-53846 Doc 12 Filed 07/18/13 Entered 07/18/13 21:52:16 Page 13 of 52
Page 14
-14-
unfunded actuarial accrued liabilities ("UAAL") were $643.8 million3 and its
OPEB UAAL totaled in excess of $5.7 billion.4
29. Because the City does not yet have audited financial results for
the 2013 fiscal year, the following discussion of the City's indebtedness focuses on
fiscal year 2012 and is based largely on information contained in the 2012 CAFR.
Long-Term Debt Obligations
30. Special Revenue Obligations. The City has issued various
series of bonds (collectively, the "Revenue Bonds"), each of which is payable from
the net revenues of the City's (a) sewer system (the "Sewer System"), (b) water
supply system (the "Water System") or (c) system of parking facilities
(the "Parking System").5 In addition, the City has received various loans from the
State of Michigan Revolving Fund Loan Program (collectively, the "State
Revolving Loans"), the proceeds of which were used to pay acquisition costs,
obtain contracting extensions and make certain necessary repairs and
improvements to the Sewer System and the Water System.6
31. As of June 30, 2012, the end of the City's 2012 fiscal year, the
City had approximately $2.86 billion in aggregate principal amount of Revenue 3 2012 CAFR at p. 124. 4 2012 CAFR at p. 127. 5 2012 CAFR at pp. 106-07. 6 2012 CAFR at pp. 106-07.
13-53846 Doc 12 Filed 07/18/13 Entered 07/18/13 21:52:16 Page 14 of 52
Page 15
-15-
Bonds outstanding with respect to the Sewer System, with interest rates of up to
7.50% (in addition to certain variable rate bonds) and maturities through
July 1, 2039.7 In addition, the City had approximately $508.2 million in State
Revolving Loans outstanding as of that date related to the Sewer System.8 A
schedule identifying each issuance of Sewer System's Revenue Bonds and related
State Revolving Loans (and the applicable amount, interest rate, maturity date and
balance for each instrument) is attached as Exhibit D.
32. With respect to the Water System, the City had approximately
$2.56 billion in aggregate principal amount of Revenue Bonds outstanding as of
the end of fiscal year 2012 with interest rates of up to 7.00% (in addition to certain
variable rate bonds) and maturities through July 1, 2041.9 In addition, the City had
approximately $22.95 million in State Revolving Loans outstanding as of that date
related to the Water System.10 A schedule identifying each issuance of Water
System's Revenue Bonds and related State Revolving Loans (and the applicable
amount, interest rate, maturity date and balance for each instrument) is attached as
Exhibit E.
7 2012 CAFR at p. 108. 8 2012 CAFR at p. 109. 9 2012 CAFR at p. 110. 10 2012 CAFR at p. 110.
13-53846 Doc 12 Filed 07/18/13 Entered 07/18/13 21:52:16 Page 15 of 52
Page 16
-16-
33. With respect to the Parking System, the City had approximately
$10.47 million in Revenue Bonds outstanding as of the end of fiscal year 2012
with interest rates of up to 5.125% and maturities through July 1, 2019.11
34. In total, as of June 30, 2012, the City had approximately
$5.96 billion in aggregate principal amount of Revenue Bonds and related State
Revolving Loans outstanding. A schedule describing the annual debt service on
the Revenue Bonds is attached as Exhibit F.
35. Certificate of Participation Obligations and Related Swap
Liabilities. It is my understanding from the City that in 2005 and 2006, the City
entered into a series of financing transactions to fund the UAAL related to each of
its two retirement systems — the General Retirement System (the "GRS") and the
Police and Fire Retirement System (the "PFRS" and, together with the GRS,
the "Systems") — through arranging for the issuance of certificates of participation
supported by services contracts between the City and each of the General
Retirement System Service Corporation and the Police and Fire Retirement System
Service Corporation (the "Service Corporations").12
11 2012 CAFR at p. 111. 12 2012 CAFR at p. 111.
13-53846 Doc 12 Filed 07/18/13 Entered 07/18/13 21:52:16 Page 16 of 52
Page 17
-17-
36. As of the end of fiscal year 2012, the aggregate outstanding
amount of such certificates approximated $1.45 billion and, by series, are as
follows:
Series 2005-A in the aggregate amount of $503,365,000 bearing interest at 4.50-4.95% (the "2005 COPs");
Series 2006-A in the aggregate amount of $148,540,000 bearing interest at 5.989% (the "2006-A COPs"); and
Series 2006-B in the aggregate amount of $800,000,000 bearing interest at a floating rate (the "2006-B COPs" and, together with the 2006-A COPs, the "2006 COPs", and the 2006 COPS together with the 2005 COPs, the "COPs").13
37. It is my understanding that concurrently with the issuance of
the 2006-B COPs, the Service Corporations entered into various pay-fixed,
receive-variable interest rate swap transactions under eight separate 1992 ISDA
Master Agreements (Local Currency Single Jurisdiction) (collectively, the "Swap
Contracts") with either (a) UBS AG or (b) SBS Financial Products Company LLC
("SBS"), with Merrill Lynch Capital Services, Inc. as credit support provider to
SBS, with an aggregate notional amount equal to the outstanding amount of the
2006-B COPS, or $800 million.14 A recent marked-to-market valuation provided
by a third party provider of valuation services for financial products estimated the
13 2012 CAFR at p. 118. 14 2012 CAFR at p. 119.
13-53846 Doc 12 Filed 07/18/13 Entered 07/18/13 21:52:16 Page 17 of 52
Page 18
-18-
negative net value of the Swap Contracts at approximately $296.5 million as of
June 28, 2013.
38. A schedule of the COPs (identifying applicable interest rates,
maturity dates, balances and insurers) and the Swap Contracts (identifying notional
amount, fixed rate paid, rate received, fair value, termination dates and maturity
dates) is attached as Exhibit G. A schedule describing the annual debt service on
the COPs and Swap Contracts is attached as Exhibit H. As set forth in Exhibit H,
approximately $45 million will be owed each year for the next ten years for debt
service on the Swap Contracts based on current interest rates. It is my
understanding that the Orr Declaration contains additional detail regarding the
COPs and Swap Contracts.
39. Unlimited Tax General Obligation Bonds. As of the end of
fiscal year 2012, the City had outstanding unlimited tax general obligation bonds
(collectively, the "UTGO Bonds") in the aggregate principal amount of
approximately $510.83 million.15 Of this amount, $100 million is secured by a
second lien on Distributable State Aid.16 A schedule of the UTGO Bonds
(identifying, for each issuance, the amount issued, applicable interest rate, maturity
date, current balance and insurer, if any) is attached as Exhibit I.
15 2012 CAFR at p. 105. 16 2012 CAFR at p. 105.
13-53846 Doc 12 Filed 07/18/13 Entered 07/18/13 21:52:16 Page 18 of 52
Page 19
-19-
40. Limited Tax General Obligation Bonds. As of the end of fiscal
year 2012, the City had outstanding limited tax general obligation bonds
(collectively, the "LTGO Bonds") in the aggregate principal amount of
approximately $446.3 million.17 Of this amount, approximately $249.8 million is
secured by a first lien, and approximately $129.5 million by a third lien, on
Distributable State Aid.18 A schedule of the LTGO Bonds (identifying, for each
issuance, the amount issued, applicable interest rate, maturity date, current balance
and insurer, if any) is attached as Exhibit J.
41. Long-Term Notes and Loans Payable. The City has issued
installment notes and loans to provide funds for various public improvement
projects.19 As of the end of fiscal year 2012, the City had approximately
(a) $89.4 million in notes payable, which were issued in connection with the
"Section 108" HUD Loan Guarantee Program and are secured by future block
grant revenues, and (b) $34.2 million in loans payable.20 Included in this latter
amount is approximately $33.6 million in proceeds of a loan provided by the
Downtown Development Authority, a discretely presented component unit, which
loan is unsecured, bears no interest and is scheduled to be repaid by the City as and 17 2012 CAFR at p. 106. 18 2012 CAFR at pp. 9, 106. 19 2012 CAFR at p. 112. 20 2012 CAFR at p. 112.
13-53846 Doc 12 Filed 07/18/13 Entered 07/18/13 21:52:16 Page 19 of 52
Page 20
-20-
when general operating funds become available.21 A schedule describing the
annual debt service on the City's general obligation bonds and notes and loans
payable (and other liabilities) is attached as Exhibit K.
42. Health Benefit Liabilities. It is my understanding that the City's
post-employment benefit (OPEB) obligations arise from over 20 different program
options (15 different options alone for medical and prescription benefits) having
varying structures and terms that are available under the City's Employee Health
and Life Insurance Benefit Plan (the "Benefit Plan").22 As of June 30, 2011, the
most recent actuarial valuation available, there were 19,389 retirees eligible to
receive coverage under the Benefit Plan.23
43. The City's obligations under the Benefit Plan are financed on a
pay-as-you-go basis.24 As of June 30, 2011, the entirety of the actuarially accrued
liability for all City employees and retirees of approximately $5.72 billion was
21 2012 CAFR at p. 112. 22 2012 CAFR at p. 124. 23 2012 CAFR at p. 125. 24 2012 CAFR at p. 126.
13-53846 Doc 12 Filed 07/18/13 Entered 07/18/13 21:52:16 Page 20 of 52
Page 21
-21-
unfunded on an actuarial basis.25 The City's UAAL for OPEB liabilities increased
by nearly $1 billion between June 30, 2007, and June 30, 2011.26
44. In addition to the Benefit Plan, the City also offers a
pre-funded, single-employer, defined benefit plan providing death benefits based
upon an employee's years of creditable service (the "Supplemental Death Benefit
Plan").27 As of June 30, 2011 (the most recent actuarial valuation available),
actuarially accrued liabilities under the Supplemental Death Benefit Plan totaled
approximately $34.6 million, 74.3% of which is funded.28 UAAL under the
Supplemental Death Benefit Plan is approximately $8.9 million.29
Other Liabilities
45. In addition to the foregoing obligations, as of the end of fiscal
year 2012, the City owed approximately 264.6 million in other liabilities,
including, among other things: (a) $101.2 million in accrued compensated
absences, including unpaid accumulated vacation and sick leave balances;
(b) $86.5 million in accrued workers' compensation for which the City is
25 2012 CAFR at p. 127. 26 2012 CAFR at p. 127; Comprehensive Annual Financial Report of the City
of Detroit, Michigan for Fiscal Year Ended June 30, 2008, at p. 133. 27 2012 CAFR at p. 127. 28 2012 CAFR at p. 127. 29 2012 CAFR at p. 127.
13-53846 Doc 12 Filed 07/18/13 Entered 07/18/13 21:52:16 Page 21 of 52
Page 22
-22-
self-insured; and (c) $63.9 million in claims and judgments, including lawsuits and
claims other than workers' compensation claims.30
Significant Labor Cost Reductions & Changes in Restrictive Employment Terms
46. The City has reduced its active labor costs over the last two
years through a combination of (a) layoffs, (b) attrition, (c) salary reductions,
(d) furlough days, (e) medical plan design changes, (f) pension plan changes and
(g) changes in employment terms. The City's active labor work force has
decreased from approximately 11,824 employees in June 2011 to approximately
9,591 employees in June 2013. The City has also implemented a 10% reduction in
wages to majority of the workforce in addition to budgeted furlough days of 10%
to majority of the non-uniform employees. Medical and prescription drug plan
designs have been changed to reduce the costs associated with healthcare and
increase the percentage of contributions from active employees. The City has
made additional changes to pension provisions to reduce the future pension
benefits by changing variables, such as pension multipliers and cost of living
adjustment calculations. In addition, the City has made changes to employment
terms to reduce employee overtime costs. Despite these changes, the City's
disbursements continue to exceed receipts after taking into account the costs
30 2012 CAFR at pp. 100-04.
13-53846 Doc 12 Filed 07/18/13 Entered 07/18/13 21:52:16 Page 22 of 52
Page 23
-23-
associated with legacy liabilities such as pension, retiree healthcare and debt
service.
13-53846 Doc 12 Filed 07/18/13 Entered 07/18/13 21:52:16 Page 23 of 52
Page 24
I, the undersigned, declare under penalty of perjury that the foregoing is true
and correct.
Executed on July 18, 2013
By: /s/Gaurav Malhotra Gaurav Malhotra Principal Ernst & Young LLP
13-53846 Doc 12 Filed 07/18/13 Entered 07/18/13 21:52:16 Page 24 of 52
Page 25
EXHIBIT A
Cash Flow Forecasts
13-53846 Doc 12 Filed 07/18/13 Entered 07/18/13 21:52:16 Page 25 of 52
Page 26
General FundAnnual Cash Flow Summary
$ in millions Actual Preliminary Forecast ForecastFY 2012 FY 2013 FY 2014 FY 2015
Operating ReceiptsProperty taxes 567.0$ 518.2$ 468.4$ 444.2$ Income & util ity taxes 276.2 290.1 294.7 292.3 Gaming taxes 177.5 169.5 170.0 168.3 Municipal service fee to casinos 19.8 17.4 17.4 17.4 State revenue sharing 194.3 178.9 184.3 186.1 Other receipts 480.8 375.3 335.9 318.0
Total operating receipts 1,715.5 1,549.3 1,470.6 1,426.3
Operating DisbursementsPayroll, taxes, & deductions (454.2) (374.0) (345.6) (354.2) Benefits (203.4) (192.1) (178.6) (190.7) Pension contributions (103.9) (30.8) (175.9) (205.5) Subsidy payments (50.0) (31.4) (75.6) (84.0) Distributions (w/o DDA increment) (374.4) (332.3) (310.0) (294.0) DDA increment distributions (8.6) (12.1) (9.0) (9.0) Income tax refunds (16.9) (19.1) (17.0) (17.0) A/P and other (477.5) (408.0) (393.2) (378.1)
Sub‐total operating disbursements (1,688.9) (1,399.7) (1,504.9) (1,532.5)
POC and debt related payments (142.1) (118.1) (164.2) (154.2)
Total disbursements (1,831.0) (1,517.9) (1,669.1) (1,686.7)
Net cash flow before borrowings (115.5) 31.5 (198.5) (260.4)
Short term borrowings 50.0 10.0 20.0 ‐
Net cash flow (65.5) 41.5 (178.5) (260.4)
Beginning cash balance 95.3 29.8 71.3 (107.2) Net cash flow (65.5) 41.5 (178.5) (260.4)
Cash before required distributions 29.8$ 71.3$ (107.2)$ (367.6)$
Accumulated property tax distributions (27.9) (35.3) (36.1) (36.9) Cash net of distributions 1.9$ 36.0$ (143.3)$ (404.5)$
Memo:Accumulated deferrals (64.4) (118.7) (117.6) (124.4) Missed COP payment 6/14/13 ‐ (39.7) (39.7) (39.7) Refunding bond proceeds in escrow 28.6 71.7 51.7 51.7 Reimbursements owed to other funds tbd tbd tbd tbd
13-53846 Doc 12 Filed 07/18/13 Entered 07/18/13 21:52:16 Page 26 of 52
Page 27
Monthly Cash Flow Forecast FY 2014 ‐ Base Case
$ in millions 5 4 4 5 4 4 5 4 4 5 4 4Forecast Forecast Forecast Forecast Forecast Forecast Forecast Forecast Forecast Forecast Forecast Forecast ForecastJul‐13 Aug‐13 Sep‐13 Oct‐13 Nov‐13 Dec‐13 Jan‐14 Feb‐14 Mar‐14 Apr‐14 May‐14 Jun‐14 FY 2014
Operating ReceiptsProperty taxes 38.8$ 170.9$ 13.4$ 6.8$ 3.2$ 22.1$ 142.7$ 21.3$ 4.9$ 1.4$ 2.6$ 40.3$ 468.4$ Income & util ity taxes 28.7 22.7 22.3 28.3 22.7 22.3 28.3 23.5 22.7 28.3 22.3 22.7 294.7 Gaming taxes 14.6 14.1 8.9 23.1 10.4 9.4 22.1 9.9 15.1 17.4 13.2 11.8 170.0 Municipal service fee to casinos ‐ 7.6 ‐ ‐ 4.0 4.0 1.8 ‐ ‐ ‐ ‐ ‐ 17.4 State revenue sharing 30.7 ‐ 30.7 ‐ 30.7 ‐ 30.7 ‐ 30.7 ‐ 30.7 ‐ 184.3 Other receipts 27.2 25.8 25.9 32.9 26.3 25.9 32.9 27.1 26.3 32.9 25.9 26.3 335.9 Refinancing proceeds 20.0 ‐ ‐ ‐ ‐ ‐ ‐ ‐ ‐ ‐ ‐ ‐ 20.0
Total operating receipts 160.1 241.2 101.2 91.1 97.3 83.7 258.6 81.8 99.7 80.1 94.7 101.1 1,490.6
Operating DisbursementsPayroll, taxes, & deductions (31.0) (26.6) (26.6) (35.5) (26.6) (26.6) (31.0) (26.6) (26.6) (35.5) (26.6) (26.6) (345.6) Benefits (15.5) (15.5) (15.5) (15.5) (15.5) (15.5) (15.5) (14.0) (14.0) (14.0) (14.0) (14.0) (178.6) Pension contributions (14.7) (14.7) (14.7) (14.7) (14.7) (14.7) (14.7) (14.7) (14.7) (14.7) (14.7) (14.7) (175.9) Subsidy payments (7.6) (5.0) (6.3) (6.3) (6.3) (6.3) (6.3) (6.3) (6.3) (6.3) (6.3) (6.3) (75.6) Distributions ‐ tax authorities (15.7) (77.3) (42.3) (6.0) (1.1) (1.4) (60.6) (22.2) (17.4) (1.8) ‐ (7.2) (253.1) Distributions ‐ UTGO ‐ (12.0) ‐ ‐ ‐ ‐ ‐ ‐ (44.9) ‐ ‐ ‐ (56.9) Distributions ‐ DDA increment ‐ ‐ ‐ ‐ ‐ (8.0) ‐ ‐ ‐ ‐ ‐ (1.0) (9.0) Income tax refunds (2.2) (2.4) (0.5) (0.3) (1.3) (0.9) (0.5) (0.2) (0.3) (2.1) (1.1) (5.0) (17.0) A/P and other miscellaneous (36.3) (37.9) (29.3) (37.1) (30.1) (25.6) (40.8) (23.0) (33.5) (39.7) (30.0) (30.0) (393.2)
Sub‐total operating disbursements (122.9) (191.4) (135.1) (115.4) (95.5) (98.9) (169.3) (107.0) (157.8) (114.1) (92.7) (104.8) (1,504.9)
POC and debt related payments (7.4) (4.2) (5.8) (8.5) (7.3) (15.4) (7.3) (4.2) (5.7) (51.9) (7.3) (39.1) (164.2)
Total disbursements (130.2) (195.6) (140.9) (123.8) (102.9) (114.3) (176.7) (111.2) (163.6) (166.0) (100.0) (143.9) (1,669.1)
Net cash flow 29.8 45.5 (39.7) (32.7) (5.5) (30.6) 81.9 (29.4) (63.9) (86.0) (5.3) (42.8) (178.5) Cumulative net cash flow 29.8 75.4 35.7 3.0 (2.5) (33.1) 48.8 19.4 (44.4) (130.4) (135.7) (178.5)
Beginning cash balance 71.3 101.2 146.7 107.0 74.3 68.8 38.2 120.1 90.7 26.9 (59.1) (64.4) 71.3 Net cash flow 29.8 45.5 (39.7) (32.7) (5.5) (30.6) 81.9 (29.4) (63.9) (86.0) (5.3) (42.8) (178.5)
Cash before required distributions 101.2$ 146.7$ 107.0$ 74.3$ 68.8$ 38.2$ 120.1$ 90.7$ 26.9$ (59.1)$ (64.4)$ (107.2)$ (107.2)$
Accumulated property tax distribution (45.2) (68.7) (35.2) (33.7) (34.7) (49.8) (97.1) (92.0) (33.6) (32.9) (35.0) (36.1) (36.1) Cash net of distributions 55.9$ 78.0$ 71.8$ 40.7$ 34.1$ (11.6)$ 23.0$ (1.3)$ (6.7)$ (92.0)$ (99.3)$ (143.3)$ (143.3)$
Memo:Accumulated deferrals (119.3) (112.4) (112.8) (113.5) (113.9) (114.4) (115.0) (115.5) (116.0) (116.6) (117.1) (117.6) (117.6) Missed COP payment 6/14/13 (39.7) (39.7) (39.7) (39.7) (39.7) (39.7) (39.7) (39.7) (39.7) (39.7) (39.7) (39.7) (39.7) Refunding bond proceeds in escrow 51.7 51.7 51.7 51.7 51.7 51.7 51.7 51.7 51.7 51.7 51.7 51.7 51.7 Reimbursements owed to other funds tbd tbd tbd tbd tbd tbd tbd tbd tbd tbd tbd tbd tbd
13-53846 Doc 12 Filed 07/18/13 Entered 07/18/13 21:52:16 Page 27 of 52
Page 28
Monthly Cash Flow Forecast FY 2015 ‐ Base Case
$ in millions 5 4 4 5 4 4 5 4 4 5 4 4Forecast Forecast Forecast Forecast Forecast Forecast Forecast Forecast Forecast Forecast Forecast Forecast ForecastJul‐14 Aug‐14 Sep‐14 Oct‐14 Nov‐14 Dec‐14 Jan‐15 Feb‐15 Mar‐15 Apr‐15 May‐15 Jun‐15 FY 2015
Operating ReceiptsProperty taxes 36.8$ 162.1$ 12.7$ 6.4$ 3.1$ 21.0$ 135.3$ 20.2$ 4.7$ 1.3$ 2.5$ 38.2$ 444.2$ Income & util ity taxes 28.5 22.5 22.1 28.1 22.5 22.1 28.1 23.3 22.5 28.1 22.1 22.5 292.3 Gaming taxes 14.5 14.0 8.9 22.8 10.3 9.3 21.9 9.8 14.9 17.2 13.1 11.7 168.3 Municipal service fee to casinos ‐ 7.6 ‐ ‐ 4.0 4.0 1.8 ‐ ‐ ‐ ‐ ‐ 17.4 State revenue sharing 31.0 ‐ 31.0 ‐ 31.0 ‐ 31.0 ‐ 31.0 ‐ 31.0 ‐ 186.1 Other receipts 25.8 24.4 24.5 31.2 24.9 24.5 31.2 25.7 24.9 31.2 24.5 24.9 318.0 Refinancing proceeds ‐ ‐ ‐ ‐ ‐ ‐ ‐ ‐ ‐ ‐ ‐ ‐ ‐
Total operating receipts 136.6 230.6 99.2 88.6 95.8 80.9 249.3 79.1 98.0 77.8 93.2 97.3 1,426.3
Operating DisbursementsPayroll, taxes, & deductions (31.7) (27.2) (27.2) (36.4) (27.2) (27.2) (31.7) (27.2) (27.2) (36.4) (27.2) (27.2) (354.2) Benefits (15.9) (15.9) (15.9) (15.9) (15.9) (15.9) (15.9) (15.9) (15.9) (15.9) (15.9) (15.9) (190.7) Pension contributions (17.1) (17.1) (17.1) (17.1) (17.1) (17.1) (17.1) (17.1) (17.1) (17.1) (17.1) (17.1) (205.5) Subsidy payments (8.4) (5.6) (7.0) (7.0) (7.0) (7.0) (7.0) (7.0) (7.0) (7.0) (7.0) (7.0) (84.0) Distributions ‐ tax authorities (14.9) (74.7) (40.1) (5.7) (1.0) (1.3) (57.5) (21.0) (16.4) (1.7) ‐ (6.8) (241.2) Distributions ‐ UTGO ‐ (10.0) ‐ ‐ ‐ ‐ ‐ ‐ (42.7) ‐ ‐ ‐ (52.7) Distributions ‐ DDA increment ‐ ‐ ‐ ‐ ‐ (8.0) ‐ ‐ ‐ ‐ ‐ (1.0) (9.0) Income tax refunds (2.2) (2.4) (0.5) (0.3) (1.3) (0.9) (0.5) (0.2) (0.3) (2.1) (1.1) (5.0) (17.0) A/P and other miscellaneous (35.6) (29.5) (28.7) (36.4) (29.5) (29.5) (35.6) (29.5) (29.5) (35.6) (29.5) (29.5) (378.1)
Sub‐total operating disbursements (125.8) (182.5) (136.6) (118.8) (99.1) (106.9) (165.3) (118.0) (156.2) (115.8) (97.8) (109.6) (1,532.5)
POC and debt related payments (9.1) (4.2) (7.6) (7.0) (9.1) (14.9) (9.1) (4.2) (7.5) (31.1) (9.1) (41.4) (154.2)
Total disbursements (134.9) (186.7) (144.1) (125.8) (108.2) (121.8) (174.4) (122.2) (163.7) (146.9) (106.9) (151.0) (1,686.7)
Net cash flow 1.7 43.9 (45.0) (37.2) (12.5) (40.9) 74.9 (43.1) (65.7) (69.1) (13.7) (53.7) (260.4) Cumulative net cash flow 1.7 45.6 0.6 (36.6) (49.1) (90.0) (15.1) (58.3) (124.0) (193.0) (206.7) (260.4)
Beginning cash balance (107.2) (105.5) (61.6) (106.6) (143.8) (156.3) (197.2) (122.3) (165.4) (231.1) (300.2) (313.9) (107.2) Net cash flow 1.7 43.9 (45.0) (37.2) (12.5) (40.9) 74.9 (43.1) (65.7) (69.1) (13.7) (53.7) (260.4)
Cash before required distributions (105.5)$ (61.6)$ (106.6)$ (143.8)$ (156.3)$ (197.2)$ (122.3)$ (165.4)$ (231.1)$ (300.2)$ (313.9)$ (367.6)$ (367.6)$
Accumulated property tax distribution (45.5) (67.8) (36.0) (34.5) (35.5) (49.9) (94.7) (89.9) (34.5) (33.8) (35.8) (36.9) (36.9) Cash net of distributions (151.0)$ (129.4)$ (142.6)$ (178.3)$ (191.8)$ (247.1)$ (217.0)$ (255.3)$ (265.6)$ (334.0)$ (349.7)$ (404.5)$ (404.5)$
Memo:Accumulated deferrals (118.2) (118.8) (119.3) (119.9) (120.5) (121.0) (121.6) (122.2) (122.7) (123.3) (123.9) (124.4) (124.4) Missed COP payment 6/14/13 (39.7) (39.7) (39.7) (39.7) (39.7) (39.7) (39.7) (39.7) (39.7) (39.7) (39.7) (39.7) (39.7) Refunding bond proceeds in escrow 51.7 51.7 51.7 51.7 51.7 51.7 51.7 51.7 51.7 51.7 51.7 51.7 51.7 Reimbursements owed to other funds tbd tbd tbd tbd tbd tbd tbd tbd tbd tbd tbd tbd tbd
13-53846 Doc 12 Filed 07/18/13 Entered 07/18/13 21:52:16 Page 28 of 52
Page 29
EXHIBIT B
Ten-Year Projections
13-53846 Doc 12 Filed 07/18/13 Entered 07/18/13 21:52:16 Page 29 of 52
Page 30
($ in millions) Preliminary forecast 10‐year 2014 2015 2016 2017 2018 2019 2020 2021 2022 2023 total
RevenuesMunicipal income tax 243.4$ 247.3$ 249.0$ 250.7$ 252.4$ 254.0$ 255.6$ 257.8$ 260.9$ 264.0$ 2,535.0$ State revenue sharing 184.3 186.1 187.9 189.5 191.2 193.0 194.8 188.3 190.0 191.7 1,896.4 Wagering taxes 170.0 168.3 170.0 171.7 173.4 175.1 176.9 178.7 180.4 182.2 1,746.7 Sales and charges for services 124.8 119.4 118.2 117.0 115.7 114.5 113.4 112.3 113.2 114.2 1,162.6 Property taxes 118.4 110.2 105.7 100.8 100.5 99.6 99.7 100.2 100.8 102.1 1,038.0 Uti l i ty users' and other taxes 47.2 40.9 40.9 41.3 41.7 42.1 42.5 43.0 43.4 43.8 426.8 Other revenue 75.6 55.8 55.8 55.9 55.9 56.0 56.0 56.0 56.1 56.1 579.2 General Fund reimbursements 30.3 30.3 30.3 30.3 30.3 30.3 30.3 30.3 30.3 30.3 302.6 Transfers in (UTGO mil lage & non‐General Fund POCs) 89.0 87.9 83.8 84.4 83.9 81.2 80.6 80.0 65.0 61.2 797.1
Total revenues 1,082.8 1,046.2 1,041.5 1,041.4 1,045.0 1,045.7 1,049.8 1,046.3 1,040.1 1,045.7 10,484.5
ExpendituresSalaries/overtime/fringe (341.5) (341.9) (346.4) (352.5) (358.8) (365.1) (371.4) (378.4) (386.0) (393.7) (3,635.7) Health benefits ‐ active (51.2) (54.0) (57.4) (61.0) (64.5) (67.9) (71.2) (74.6) (78.4) (82.3) (662.5) Other operating expenses (292.9) (288.2) (295.9) (301.5) (309.7) (313.5) (320.0) (326.5) (335.3) (339.7) (3,123.2)
Operating expenditures (685.7) (684.1) (699.7) (715.0) (733.1) (746.5) (762.5) (779.5) (799.6) (815.7) (7,421.5)
Net operating surplus 397.2 362.0 341.8 326.3 311.9 299.2 287.2 266.8 240.5 230.0 3,063.0
Debt service (LTGO & UTGO) (135.9) (124.4) (119.4) (96.1) (95.0) (92.5) (91.8) (91.5) (74.8) (70.9) (992.4) POC ‐ principal and interest (61.0) (63.2) (65.4) (67.6) (69.9) (68.1) (69.0) (69.9) (70.7) (71.4) (676.3) POC swaps (50.6) (50.6) (50.6) (50.6) (50.6) (50.6) (49.8) (48.9) (48.1) (47.4) (498.0) Pension contributions (199.5) (233.1) (258.9) (285.9) (314.7) (321.4) (331.5) (337.2) (339.5) (343.0) (2,964.8) Health benefits ‐ retiree (140.7) (151.1) (161.6) (172.0) (182.3) (192.3) (201.9) (212.0) (222.6) (233.7) (1,870.0)
Legacy expenditures (587.6) (622.4) (655.9) (672.3) (712.6) (725.0) (744.0) (759.5) (755.8) (766.4) (7,001.5)
Total expenditures (1,273.3) (1,306.6) (1,355.6) (1,387.3) (1,445.7) (1,471.5) (1,506.5) (1,539.0) (1,555.3) (1,582.1) (14,423.0)
Deficit (excl. financing proceeds) (190.5) (260.4) (314.1) (346.0) (400.7) (425.8) (456.8) (492.6) (515.3) (536.4) (3,938.5)
Financing proceeds ‐ ‐ ‐ ‐ ‐ ‐ ‐ ‐ ‐ ‐ ‐
Total surplus (deficit) (190.5)$ (260.4)$ (314.1)$ (346.0)$ (400.7)$ (425.8)$ (456.8)$ (492.6)$ (515.3)$ (536.4)$ (3,938.5)$
Accumulated unrestricted General Fund deficit (427.5) (687.9) (1,002.0) (1,348.0) (1,748.7) (2,174.5) (2,631.3) (3,123.9) (3,639.2) (4,175.6)
Reinvestment in the CityDepartment revenue initiatives 22.9$ 22.1$ 24.4$ 24.2$ 24.5$ 24.7$ 25.0$ 25.3$ 25.6$ 25.9$ 244.6$ Additional operating expenditures (53.7) (37.0) (21.3) (22.0) (21.7) (22.7) (29.3) (29.3) (29.7) (30.7) (297.4) Capital investments (107.7) (74.5) (38.8) (51.9) (33.3) (30.8) (28.4) (29.5) (28.5) (29.0) (452.3) Bl ight (excludes heavy commercial) (50.0) (50.0) (100.0) (100.0) (100.0) (100.0) ‐ ‐ ‐ ‐ (500.0)
Total reinvestment in the City (188.5) (139.3) (135.7) (149.7) (130.5) (128.8) (32.8) (33.4) (32.6) (33.8) (1,005.2)
Adjusted surplus (deficit) (379.0)$ (399.7)$ (449.8)$ (495.6)$ (531.2)$ (554.6)$ (489.6)$ (526.1)$ (547.9)$ (570.2)$ (4,943.7)$
Adj. accumulated unrestricted General Fund deficit (615.9) (1,015.6) (1,465.4) (1,961.0) (2,492.2) (3,046.8) (3,536.4) (4,062.5) (4,610.4) (5,180.6)
13-53846 Doc 12 Filed 07/18/13 Entered 07/18/13 21:52:16 Page 30 of 52
Page 31
($ in millions) Preliminary forecast 10‐year 2014 2015 2016 2017 2018 2019 2020 2021 2022 2023 total
Total revenues 1,082.8$ 1,046.2$ 1,041.5$ 1,041.4$ 1,045.0$ 1,045.7$ 1,049.8$ 1,046.3$ 1,040.1$ 1,045.7$ 10,484.5$
Department revenue initiatives 22.9 22.1 24.4 24.2 24.5 24.7 25.0 25.3 25.6 25.9 244.6
Operating expenditures (685.7) (684.1) (699.7) (715.0) (733.1) (746.5) (762.5) (779.5) (799.6) (815.7) (7,421.5)
Additional operating expenditures (53.7) (37.0) (21.3) (22.0) (21.7) (22.7) (29.3) (29.3) (29.7) (30.7) (297.4)
Net operating surplus 366.4$ 347.2$ 344.9$ 328.5$ 314.6$ 301.2$ 282.9$ 262.9$ 236.4$ 225.2$ 3,010.2$
Reinvestment expenditures/adjustmentsReorganization (Capita l investments & Profess ional fees) (167.0) (111.7) (38.8) (51.9) (33.3) (30.8) (28.4) (29.5) (28.5) (29.0) (548.8) Bl ight (excludes heavy commercial ) (50.0) (50.0) (100.0) (100.0) (100.0) (100.0) ‐ ‐ ‐ ‐ (500.0) DC Pens ion contribution (10% Pol ice/Fi re, 5% other) (25.4) (25.7) (26.2) (26.6) (27.2) (27.7) (28.2) (28.7) (29.3) (29.9) (274.8) POC reimbursements (24.1) (25.4) (26.2) (26.8) (27.5) (27.1) (27.3) (27.4) (27.4) (27.4) (266.7) PLD decommiss ion ‐ (25.0) (25.0) (25.0) ‐ ‐ ‐ ‐ ‐ ‐ (75.0) Increased tax revenues 7.4 12.2 16.4 23.8 28.3 36.0 42.0 48.5 56.3 63.8 334.5
Total restructuring (259.1) (225.6) (199.8) (206.6) (159.6) (149.6) (42.0) (37.1) (29.0) (22.6) (1,330.9)
Funds available for legacy liabilities 107.3 121.6 145.2 122.0 155.0 151.6 240.9 225.7 207.4 202.6 1,679.3
Payments to secured cla ims (Subject to further review/negotiation)LTGO ‐ secured (18.7) (29.2) (29.2) (29.2) (29.2) (29.2) (29.2) (29.2) (29.2) (29.2) (281.6) UTGO ‐ secured (8.0) (9.8) (9.8) (9.8) (9.8) (9.8) (9.8) (9.8) (9.8) (9.8) (96.4) POC swaps (1) (50.6) (50.6) (50.6) (50.6) (50.6) (50.6) (49.8) (48.9) (48.1) (47.4) (498.0) Notes/loans payable ‐ ‐ ‐ ‐ ‐ ‐ ‐ ‐ ‐ ‐ ‐
Total payments to secured cla ims (77.3) (89.7) (89.7) (89.7) (89.7) (89.7) (88.9) (88.0) (87.2) (86.4) (876.0)
Funds available for unsecured claims 30.0$ 31.9$ 55.5$ 32.3$ 65.4$ 62.0$ 152.1$ 137.8$ 120.2$ 116.2$ 803.3$
Asset monetization / revenue opportuni ties tbd tbd tbd tbd tbd tbd tbd tbd tbd tbd ‐
Funds available for unsecured claims w/opportunities 30.0$ 31.9$ 55.5$ 32.3$ 65.4$ 62.0$ 152.1$ 137.8$ 120.2$ 116.2$ 803.3$
Estimated unsecured claimsUnsecured debt
LTGO ‐ unsecured 161.0$ UTGO ‐ unsecured 369.1 POC principal balance 1,428.8 Notes/loans payable 33.6
Sub‐tota l : Unsecured debt 1,992.5 Unsecured pens ion & OPEB
OPEB l i abi l i ty 5,718.3 Pens ion unfunded l iabi l i ty (PFRS) 1,437.0 Pens ion unfunded l iabi l i ty (DGRS) 2,037.0
Sub‐tota l : Pens ion & OPEB 9,192.3 Other unsecured i tems
Other l iabi l i ties 264.6 Other potentia l claims tbd
Sub‐tota l : Other 264.6
Estimated total unsecured claims 11,449.4$
Footnote:(1) Assumes continued payments as scheduled. Treatment to be determined.
13-53846 Doc 12 Filed 07/18/13 Entered 07/18/13 21:52:16 Page 31 of 52
Page 32
EXHIBIT C
13-53846 Doc 12 Filed 07/18/13 Entered 07/18/13 21:52:16 Page 32 of 52
Page 33
Legacy Expenditures (Assuming No Restructuring)
($ in millions) Fiscal year ended actual Preliminary forecast2008 2009 2010 2011 2012 2013 2014 2015 2016 2017
Legacy expendituresDebt service (LTGO) (66.6)$ (106.2)$ (63.5)$ (64.5)$ (62.6)$ (70.8)$ (70.9)$ (61.8)$ (61.8)$ (38.5)$ Debt service (UTGO) (67.2) (71.5) (72.4) (72.8) (73.0) (70.6) (64.9) (62.5) (57.6) (57.6) POC ‐ principal and interest (GF) (24.6) (20.9) (23.6) (33.5) (33.0) (46.8) (51.4) (53.3) (55.0) (56.9) POC ‐ principal and interest (EF, excl. DDOT) (1.8) (1.4) (1.5) (1.8) (2.0) (5.3) (5.9) (6.1) (6.4) (6.6) POC ‐ principal and interest (DDOT) (3.5) (2.8) (3.0) (3.6) (4.0) (3.3) (3.7) (3.8) (3.9) (4.1) POC ‐ swaps (GF) (38.6) (43.9) (44.7) (44.7) (44.8) (42.9) (42.8) (42.8) (42.7) (42.7) POC ‐ swaps (EF, excl. DDOT) (2.3) (2.0) (2.0) (2.0) (2.0) (4.8) (4.8) (4.8) (4.9) (4.9) POC ‐ swaps (DDOT) (4.5) (4.0) (4.0) (4.0) (4.0) (3.0) (3.0) (3.0) (3.0) (3.0) Pension contributions ‐ Public Safety (58.9) (31.4) (32.8) (81.6) (49.8) (46.1) (139.0) (163.0) (180.0) (198.0) Pension contributions ‐ Non‐Public Safety (10.6) (27.0) (11.1) (28.3) (25.4) (19.9) (36.9) (42.5) (47.7) (53.1) Pension contributions ‐ DDOT (6.8) (7.3) (6.9) (9.5) (10.9) (12.3) (23.6) (27.7) (31.2) (34.8) Health benefits ‐ retiree ‐ Public Safety (73.7) (80.2) (70.4) (79.6) (90.6) (91.5) (88.6) (95.2) (101.7) (108.0) Health benefits ‐ retiree ‐ Non‐Public Safety (47.4) (51.6) (50.6) (49.0) (49.2) (49.7) (38.8) (41.5) (44.6) (47.7) Health benefits ‐ retiree ‐ DDOT (8.2) (11.8) (11.2) (11.1) (10.3) (10.4) (13.3) (14.3) (15.3) (16.3)
Total legacy expenditures (414.6)$ (462.0)$ (397.9)$ (486.1)$ (461.6)$ (477.3)$ (587.6)$ (622.4)$ (655.9)$ (672.3)$
Total revenues (excl. financing proceeds) 1,397.7$ 1,363.3$ 1,291.0$ 1,316.8$ 1,196.9$ 1,121.9$ 1,082.8$ 1,046.2$ 1,041.5$ 1,041.4$
Total legacy expendituresas a % of total revenues 29.7% 33.9% 30.8% 36.9% 38.6% 42.5% 54.3% 59.5% 63.0% 64.6%
13-53846 Doc 12 Filed 07/18/13 Entered 07/18/13 21:52:16 Page 33 of 52
Page 34
EXHIBIT D
13-53846 Doc 12 Filed 07/18/13 Entered 07/18/13 21:52:16 Page 34 of 52
Page 35
Schedule of the sewage disposal system bonds and related state revolving loans as of June 30, 2012
Bond Date
Amount Issued
Range of Interest Rates
Maturity Date
Balance June 30, 2012 Insurer
Sewage Disposal System Revenue Bonds:
Series 1998‐A 12‐14‐06 $18,540,000 5.50 % 7/1/12‐17 $16,440,000 MBIA Series 1998‐A 12‐14‐06 49,075,000 5.25 7/1/18‐23 49,075,000 MBIA b Series 1998‐B 12‐14‐06 18,750,000 5.50 7/1/12‐17 16,510,000 MBIA Series 1998‐B 12‐14‐06 48,770,000 5.25 7/1/18‐23 48,770,000 MBIA b Series 1999‐A (* *) 12‐1‐99 33,510,118 0.00 7/1/12‐21 69,931,075 FGIC Series 2001‐B 9‐15‐01 110,550,000 5.50 7/1/23‐29 110,550,000 FGIC Series 2001‐C (1) 6‐5‐09 6,360,000 5.25 7/1/12‐19 4,930,000 Assured Guaranty Series 2001‐C (1) 6‐5‐09 148,510,000 6.50 to 7.00 7/1/20‐27 148,510,000 Assured Guaranty b Series 2001‐C (2) 5‐8‐08 3,275,000 3.50 to 4.00 7/1/12‐18 2,305,000 FGIC/Berkshire Hathaway Series 2001‐C (2) 5‐8‐08 119,630,000 4.00 to 5.25 7/1/19‐29 119,630,000 FGIC/Berkshire Hathaway b Series 2001‐D 9‐23‐01 92,450,000 Variable (a) 7/1/32 21,315,000 MBIA b Series 2001‐E 5‐8‐08 136,150,000 5.75 7/1/24‐31 136,150,000 FGIC/Berkshire Hathaway b Series 2003‐A 5‐22‐03 158,000,000 3.30 to 5.00 7/1/12‐13 84,125,000 Assured Guaranty Series 2003‐A 5‐22‐03 441,380,000 3.50 to 5.50 7/1/14‐32 128,940,000 Assured Guaranty b Series 2003‐B 6‐5‐09 150,000,000 7.50 7/1/32‐33 150,000,000 Assured Guaranty b Series 2004‐A 1‐09‐04 101,435,000 5.00 to 5.25 7/1/12‐24 74,380,000 Assured Guaranty Series 2005‐A 3‐17‐05 3,765,000 3.40 to 3.70 7/1/12‐15 2,495,000 MBIA Series 2005‐A 3‐17‐05 269,590,000 3.75 to 5.125 7/1/16‐35 236,770,000 MBIA b Series 2005‐B 3‐17‐05 40,215,000 3.40 to 5.50 7/1/12‐22 40,215,000 MBIA Series 2005‐C 3‐17‐05 22,065,000 5.00 7/1/12‐15 16,185,000 MBIA Series 2005‐C 3‐17‐05 41,095,000 5.00 7/1/16‐25 41,095,000 MBIA b Series 2006‐A 5‐8‐08 123,655,000 5.50 7/1/34‐36 123,655,000 FGIC/Berkshire Hathaway b Series 2006‐B 8‐10‐06 11,850,000 4.00 to 5.00 7/1/12‐16 7,960,000 FGIC Series 2006‐B 8‐10‐06 238,150,000 4.25 to 5.00 7/1/17‐36 238,150,000 FGIC b Series 2006‐C 8‐10‐06 8,495,000 5.25 7/1/16 8,495,000 FGIC Series 2006‐C 8‐10‐06 18,065,000 5.00 7/1/17‐18 18,065,000 FGIC b
13-53846 Doc 12 Filed 07/18/13 Entered 07/18/13 21:52:16 Page 35 of 52
Page 36
Bond Date
Amount Issued
Range of Interest Rates
Maturity Date
Balance June 30, 2012 Insurer
Series 2006‐D 12‐14‐06 370,000,000 Variable (a) 7/1/12‐32 289,430,000 Assured Guaranty/FSA b Series 2012‐A 6‐26‐12 95,445,000 5.00 7/1/14‐22 95,445,000 Assured Guaranty Series 2012‐A 6‐26‐12 564,335,000 5.00 to 5.50 7/1/23‐39 564,335,000 Assured Guaranty b Total Sewage Disposal System Revenue Bonds $2,863,856,075 * * ‐ Capital Appreciation Bonds a ‐ Interest rates are set periodically at the stated current market interest rate. b ‐ Indicates bonds are callable under terms specified in the indenture; all other bonds are noncallable.
13-53846 Doc 12 Filed 07/18/13 Entered 07/18/13 21:52:16 Page 36 of 52
Page 37
Bond Date Amount Issued
Range of Interest Rates Maturity Date
Balance June 30, 2012
State Revolving Loans:
Series 1992‐A‐SRF 6‐25‐92 $ 4,360,000 2.00% 4/1/13 $ 260,000Series 1992‐B‐SRF 9‐10‐92 1,915,000 2.00 10/1/12‐13 230,000Series 1993‐B‐SRF 9‐30‐93 6,603,996 2.00 10/1/12‐14 1,150,000Series 1997‐B‐SRF 9‐30‐97 5,430,174 2.25 10/1/12‐18 2,160,000Series 1999‐SRF‐1 6‐24‐99 21,475,000 2.50 4/1/13‐20 9,880,000Series 1999‐SRF‐2 9‐30‐99 46,000,000 2.50 10/1/12‐22 28,110,000Series 1999‐SRF‐3 9‐30‐99 31,030,000 2.50 10/1/12‐20 15,890,000Series 1999‐SRF‐4 9‐30‐99 40,655,000 2.50 10/1/12‐20 20,815,000Series 2000‐SRF‐1 3‐30‐00 44,197,995 2.50 10/1/12‐22 23,947,995Series 2000‐SRF‐2 9‐28‐00 64,401,066 2.50 10/1/12‐22 39,191,066Series 2001‐SRF‐1 6‐28‐01 82,200,000 2.50 10/1/12‐24 57,965,000Series 2001‐SRF‐2 12‐20‐01 59,850,000 2.50 10/1/12‐24 42,210,000Series 2002‐SRF‐1 6‐27‐02 18,985,000 2.50 4/1/13‐23 11,590,000Series 2002‐SRF‐2 6‐27‐02 1,545,369 2.50 4/1/13‐23 935,369Series 2002‐SRF‐3 12‐19‐02 31,549,466 2.50 10/1/12‐24 20,554,466Series 2003‐SRF‐1 6‐28‐03 48,520,000 2.50 10/1/12‐25 36,415,000Series 2003‐SRF‐2 9‐25‐03 25,055,370 2.50 4/1/13‐25 17,550,370Series 2004‐SRF‐1 6‐24‐04 2,910,000 2.125 10/1/12‐24 2,025,000Series 2004‐SRF‐2 6‐24‐04 18,353,459 2.125 4/1/13‐25 12,748,459Series 2004‐SRF‐3 6‐24‐04 12,722,575 2.125 4/1/13‐25 8,832,575Series 2007‐SRF‐1 9‐20‐07 156,687,777 1.625 10/1/12‐29 142,272,777Series 2009‐SRF‐1 4‐17‐09 22,684,557 2.50 4/1/13‐30 10,164,557Series 2010‐SRF‐1 1‐22‐10 6,793,631 2.50 4/1/13‐31 3,338,631
Total State Revolving Loans Payable $508,236,265
13-53846 Doc 12 Filed 07/18/13 Entered 07/18/13 21:52:16 Page 37 of 52
Page 38
EXHIBIT E
13-53846 Doc 12 Filed 07/18/13 Entered 07/18/13 21:52:16 Page 38 of 52
Page 39
Schedule of water system bonds and related state revolving loans as of June 30, 2012
Bond
Date Amount Issued Range of
Interest Rates Maturity Date
Balance June 30, 2012 Insurer
Water Supply System Revenue Bonds:
Series 1993 10‐15‐93 $ 38,225,000 6.50% 7/1/14‐15 $ 24,725,000 FGIC Series 1995‐B 10‐15‐95 60,485,000 5.55 7/1/12 8,480,000 MBIA Series 1997‐A 8‐01‐97 186,220,000 6.00 7/1/14‐15 13,430,000 MBIA Series 2001‐A 5‐01‐01 301,165,000 5.00 7/1/29‐30 73,790,000 FGIC b Series 2001‐C 5‐08‐08 4,055,000 3.50 to 4.25 7/1/12‐18 2,565,000 FGIC Series 2001‐C 5‐08‐08 186,350,000 4.50 to 5.75 7/1/19‐29 186,350,000 FGIC b Series 2003‐A 1‐28‐03 234,805,000 4.50 to 5.00 7/1/19‐34 178,785,000 MBIA b Series 2003‐B 1‐28‐03 41,770,000 5.00 7/1/34 41,770,000 MBIA b Series 2003‐C 1‐28‐03 4,335,000 Variable(a) 7/1/13‐14 4,335,000 MBIA Series 2003‐C 1‐28‐03 25,325,000 4.25 to 5.25 7/1/15‐22 25,325,000 MBIA b Series 2003‐D 8‐14‐06 3,180,000 4.00 to 4.20 7/1/12‐16 1,625,000 MBIA Series 2003‐D 8‐14‐06 139,575,000 4.25 to 5.00 7/1/17‐33 139,575,000 MBIA b Series 2004‐A 8‐14‐06 17,600,000 3.75 to 5.25 7/1/12‐16 17,580,000 MBIA Series 2004‐A 8‐14‐06 55,165,000 4.50 to 5.25 7/1/17‐25 55,165,000 MBIA b Series 2004‐B 8‐14‐06 52,840,000 4.00 to 5.00 7/1/12‐16 35,740,000 MBIA Series 2004‐B 8‐14‐06 100,990,000 4.25 to 5.00 7/1/17‐23 100,990,000 MBIA b Series 2005‐A 3‐11‐05 20,965,000 3.40 to 5.00 7/1/12‐15 8,445,000 FGIC Series 2005‐A 3‐11‐05 84,035,000 3.90 to 5.00 7/1/16‐35 84,035,000 FGIC b Series 2005‐B 5‐08‐08 19,070,000 4.00 to 5.50 7/1/12‐18 15,465,000 FGIC Series 2005‐B 5‐08‐08 175,830,000 4.75 to 5.50 7/1/19‐35 175,830,000 FGIC b Series 2005‐C 3‐11‐05 36,405,000 5.00 7/1/12‐15 23,175,000 FGIC Series 2005‐C 3‐11‐05 90,200,000 5.00 7/1/16‐22 90,200,000 FGIC b Series 2006‐A 8‐14‐06 42,795,000 5.00 7/1/13‐16 26,900,000 Assured Guaranty/FSA Series 2006‐A 8‐14‐06 237,205,000 5.00 7/1/17‐34 237,205,000 Assured Guaranty/FSA b Series 2006‐B 4‐1‐09 900,000 3.00 to 5.00 7/1/12‐19 800,000 Assured Guaranty/FSA Series 2006‐B 4‐1‐09 119,100,000 5.50 to 7.00 7/1/20‐36 119,100,000 Assured Guaranty/FSA b Series 2006‐C 8‐14‐06 12,585,000 4.00 to 5.00 7/1/12‐16 10,650,000 Assured Guaranty/FSA Series 2006‐C 8‐14‐06 208,060,000 5.00 7/1/17‐33 208,060,000 Assured Guaranty/FSA b
13-53846 Doc 12 Filed 07/18/13 Entered 07/18/13 21:52:16 Page 39 of 52
Page 40
Bond Date Amount Issued
Range of Interest Rates
Maturity Date
Balance June 30, 2012 Insurer
Series 2006‐D 8‐14‐06 4,430,000 4.00 to 5.00 7/1/12‐16 3,465,000 Assured Guaranty/FSA Series 2006‐D 8‐14‐06 142,160,000 4.25 to 5.00 7/1/17‐32 142,160,000 Assured Guaranty/FSA b Series 2011‐A 12‐22‐11 37,880,000 3.00 to 5.00 7/1/12‐21 37,880,000 N/A Series 2011‐A 12‐22‐11 341,710,000 5.00 to 5.75 7/1/22‐41 341,710,000 N/A b Series 2011‐B 12‐22‐11 7,455,000 2.496 to 5.00 7/1/12‐21 7,455,000 N/A Series 2011‐B 12‐22‐11 9,740,000 6.00 7/1/22‐33 9,740,000 N/A b Series 2011‐C 12‐22‐11 3,925,000 3.00 to 5.00 7/1/12‐21 3,925,000 N/A Series 2011‐C 12‐22‐11 99,965,000 4.50 to 5.25 7/1/23‐41 99,965,000 N/A b
Total Water Supply System Revenue Bonds $2,556,395,000
State Revolving Loans:
Series 2005 SRF‐1 9‐22‐05 $ 13,805,164 2.125% 10/1/12‐26 $ 10,575,164Series 2005 SRF‐2 9‐22‐05 8,891,730 2.125 10/1/12‐26 6,621,730Series 2006 SRF‐1 9‐21‐06 5,180,926 2.125 10/1/12‐26 3,945,926Series 2008 SRF‐1 9‐29‐08 2,590,941 2.500 10/1/12‐26 1,810,941
Total State Revolving Loans Payable $ 22,953,761 a ‐ Interest rates are set periodically at the stated current market interest rate. b ‐ Indicates bonds are callable under terms specified in the indenture; all other bonds are noncallable.
13-53846 Doc 12 Filed 07/18/13 Entered 07/18/13 21:52:16 Page 40 of 52
Page 41
EXHIBIT F
13-53846 Doc 12 Filed 07/18/13 Entered 07/18/13 21:52:16 Page 41 of 52
Page 42
Annual Debt Service on Revenue Bonds ($ in millions).
Fiscal Year Sewage Disposal Fund Water Fund Parking Fund Total Special
Revenue Principal Interest Principal Interest Principal Interest 2013 76.58 123.42 33.20 120.25 1.17 0.50 $355.12 2014 78.39 143.45 41.46 131.24 1.22 0.44 $396.20 2015 86.66 140.42 53.43 129.31 1.29 0.38 $411.49 2016 89.28 137.53 58.75 126.49 1.35 0.31 $413.71 2017 91.58 134.41 61.81 123.38 1.42 0.24 $412.84 2018‐22 503.05 621.32 353.35 568.23 4.03 0.30 $2,050.28 2023‐27 584.93 515.60 447.03 468.72 $2,016.28 2028‐32 733.64 380.44 555.24 344.23 $2,013.55 2033‐37 810.06 220.48 656.86 193.56 $1,880.96 2037‐42 338.56 35.90 318.25 51.62 $ 744.33 Total $3,392.73 $2,452.97 $2,579.38 $2,257.03 $ 10.48 $ 2.17 $10,694.76
13-53846 Doc 12 Filed 07/18/13 Entered 07/18/13 21:52:16 Page 42 of 52
Page 43
EXHIBIT G
13-53846 Doc 12 Filed 07/18/13 Entered 07/18/13 21:52:16 Page 43 of 52
Page 44
Schedule of COPs and Swap Contracts as of June 30, 2012
Bond Date Amount Issued
Range of Interest Rates
Maturity Date
Balance June 30, 2012 Insurer
Pension Obligation Certificates:
Series 2005‐A 6/2/05 $ 640,000,000 4.00 to 4.95% 6/15/13‐25 $ 503,365,000 FGIC/Syncora Series 2006‐A 6/12/06 148,540,000 5.989% 6/15/34‐35 148,540,000 FGIC Series 2006‐B 6/12/06 800,000,000 Variable 6/15/19‐34 800,000,000 FGIC/Syncora Total Pension Obligation Certificates $ 1,451,905,000
Cash‐Flow Hedges, Pay‐Fixed Interest Rate Swaps
Notional Amount
Effective Date
Fixed Rate Paid
Rate Received Fair Value
Swap Termination Date
Final Maturity of Bonds
Taxable Certificate of Participation:
SBSFPC‐0009 $ 96,621,000 6/12/06 6.36% 3mth LIBOR + .34% (57,173,124) 6/15/2034 6/15/2034SBSFPC‐0012 45,252,000 6/12/06 6.32 3mth LIBOR + .30% (23,055,836) 6/15/2029 6/15/202937380341 96,621,000 6/12/06 6.36 3mth LIBOR + .34% (57,181,711) 6/15/2034 6/15/203437380291 45,252,000 6/12/06 6.32 3mth LIBOR + .30% (23,056,802) 6/15/2029 6/15/2029SBSFPC‐0010 153,801,500 6/12/06 6.35 3mth LIBOR + .34% (91,309,463) 6/15/2034 6/15/2034SBSFPC‐0011 104,325,500 6/12/06 6.32 3mth LIBOR + .30% (48,098,696) 6/15/2029 6/15/202937380313 153,801,500 6/12/06 6.35 3mth LIBOR + .34% (91,322,376) 6/15/2034 6/15/203437380351 104,325,500 6/12/06 6.32 3mth LIBOR + .30% (48,104,661) 6/15/2029 6/15/2029 Total $ 800,000,000 (439,302,669)
13-53846 Doc 12 Filed 07/18/13 Entered 07/18/13 21:52:16 Page 44 of 52
Page 45
EXHIBIT H
13-53846 Doc 12 Filed 07/18/13 Entered 07/18/13 21:52:16 Page 45 of 52
Page 46
Annual Debt Service on COPs and Swap Contracts ($ in millions)
FiscalYear Principal Interest
Hedging Derivatives, Net Total
2013 23.10 39.57 44.38 107.052014 29.64 38.54 44.38 112.562015 33.27 37.18 44.38 114.832016 36.96 35.65 44.38 116.992017 40.96 33.87 44.38 119.21
2018‐22 242.83 140.50 217.21 600.542023‐27 311.24 88.33 198.83 598.402028‐32 416.31 61.83 118.89 597.032033‐35 317.59 26.44 13.23 357.26Total 1,451.90 501.91 770.06 2,723.87
13-53846 Doc 12 Filed 07/18/13 Entered 07/18/13 21:52:16 Page 46 of 52
Page 47
EXHIBIT I
13-53846 Doc 12 Filed 07/18/13 Entered 07/18/13 21:52:16 Page 47 of 52
Page 48
Schedule of UTGO Bonds as of June 30, 2012
Bond Date
Amount Issued
Range of Interest Rates
Maturity Date
Balance June 30, 2012 Insurer
Governmental Activities General Obligation Bonds ‐
Unlimited Tax: Series 1999‐A 4‐1‐99 $28,020,000 5.00 to 5.25% 4/1/13‐19 $21,040,000 Assured Guaranty b Series 2001‐A(1) 7‐15‐01 83,200,000 5.0 to 5.375 4/1/13‐21 80,400,000 MBIA b Series 2001‐B 7‐15‐01 23,235,000 5.375 4/1/13‐14 13,680,000 MBIA b Series 2002 8‐2‐02 29,205,000 4.00 to 5.13 4/1/13‐22 6,645,000 MBIA b Series 2003‐A 10‐21‐03 9,640,000 3.70 to 5.00 4/1/2013 2,575,000 Syncora Series 2003‐A 10‐21‐03 34,380,000 4.00 to 5.25 4/1/14‐23 34,380,000 Syncora b Series 2004‐A(1) 9‐9‐04 39,270,000 4.25 to 5.25 4/1/19‐24 39,270,000 Ambac b Series 2004‐B(1) 9‐9‐04 23,720,000 3.75 to 5.00 4/1/13‐14 16,175,000 Ambac Series 2004‐B(1) 9‐9‐04 29,365,000 4.0 to 5.25 4/1/15‐18 29,365,000 Ambac b Series 2004‐B(2) 9‐9‐04 17,270,000 4.16 to 5.24 4/1/13‐18 865,000 Ambac Series 2005‐B 12‐1‐05 13,840,000 4.00 to 5.00 4/1/13‐16 8,955,000 Assured Guaranty Series 2005‐B 12‐1‐05 37,920,000 4.30 to 5.00 4/1/17‐25 37,920,000 Assured Guaranty b Series 2005‐C 12‐1‐05 20,010,000 4.00 to 5.00 4/1/13‐16 12,230,000 Assured Guaranty a Series 2005‐C 12‐1‐05 10,795,000 4.30 to 5.25 4/1/17‐20 10,795,000 Assured Guaranty b Series 2008‐A 6‐9‐08 15,120,000 5.00 4/1/14‐18 15,120,000 Assured Guaranty Series 2008‐A 6‐9‐08 43,510,000 4.00 to 5.00 4/1/19‐28 43,510,000 Assured Guaranty b Series 2008‐B(1) 6‐9‐08 66,475,000 5.00 4/1/13‐18 37,905,000 Assured Guaranty Series 2010‐E 12‐16‐10 100,000,000 5.129 to 8.369 11/1/14‐35 100,000,000 N/A
Total General Obligation Bonds ‐ Unlimited Tax $510,830,000
a ‐ Indicates interest rates are reset periodically at the stated market interest rates. b ‐ Indicates bonds are callable under terms specified in the indenture; all other bonds are noncallable.
13-53846 Doc 12 Filed 07/18/13 Entered 07/18/13 21:52:16 Page 48 of 52
Page 49
EXHIBIT J
13-53846 Doc 12 Filed 07/18/13 Entered 07/18/13 21:52:16 Page 49 of 52
Page 50
Schedule of LTGO Bonds as of June 30, 2012
Bond Date
Amount Issued
Range of Interest Rates
Maturity Date
Balance June 30, 2012 Insurer
Governmental Activities General Obligation Bonds ‐
Limited Tax: Self‐Insurance Bonds:
Series 2003 10‐2‐03 $98,895,000 4.32 to 4.97% 5/1/2013 $17,770,000 Assured Guaranty Series 2004 9‐9‐04 62,285,000 4.16 to 4.85 4/1/13‐14 25,405,000 Ambac
General Obligation: Series 2005‐A(1) 6‐24‐05 21,325,000 4.27 to 4.53 4/1/13‐15 11,320,000 Ambac Series 2005‐A(1) 6‐24‐05 52,175,000 4.61 to 5.15 4/1/16‐25 52,175,000 Ambac b Series 2005‐A(2) 6‐24‐05 4,055,000 3.50 to 4.50 4/1/12‐15 2,145,000 Ambac Series 2005‐A(2) 6‐24‐05 9,475,000 4.00 to 5.00 4/1/16‐25 9,475,000 Ambac b Series 2005‐B 6‐24‐05 4,845,000 3.50 to 5.00 4/1/13‐15 2,835,000 Ambac Series 2005‐B 6‐24‐05 6,940,000 5.00 4/1/16‐21 6,940,000 Ambac b Series 2008‐A(1) 6‐9‐08 43,443,278 5.00 4/1/13‐16 43,443,278 N/A Series 2008‐A(2) 6‐9‐08 25,000,000 8.00 4/1/2014 25,000,000 N/A Distributable State Aid 2010 3‐18‐10 249,790,000 4.25 to 5.25 11/1/14‐35 249,790,000
N/A
Total General Obligation Bonds ‐ Limited Tax 446,298,278
b ‐ Indicates bonds are callable under terms specified in the indenture; all other bonds are noncallable.
13-53846 Doc 12 Filed 07/18/13 Entered 07/18/13 21:52:16 Page 50 of 52
Page 51
EXHIBIT K
13-53846 Doc 12 Filed 07/18/13 Entered 07/18/13 21:52:16 Page 51 of 52
Page 52
Annual Debt Service on General Obligation Debt & Other Liabilities ($ in millions)
Fiscal Year General Obligation
Bonds Notes and Loans
Payable Transportation Fund
Liabilities Total Principal Interest Principal Interest Principal Interest
2013 $82.71 $51.81 $1.56 $3.85 $0.81 $0.31 $141.07 2014 $81.63 $47.73 $3.25 $3.76 $0.00 $0.27 $136.64 2015 $68.36 $42.72 $3.38 $3.62 $2.66 $0.27 $121.02 2016 $66.87 $39.27 $3.65 $3.46 $2.80 $0.14 $116.19 2017 $49.89 $35.87 $6.09 $3.24 $0.00 $0.00 $95.10
2018-22 $254.12 $139.73 $31.33 $12.03 $0.00 $0.00 $437.21 2023-27 $150.59 $81.99 $30.46 $4.61 $0.00 $0.00 $267.65 2028-32 $101.54 $47.46 $10.26 $0.24 $0.00 $0.00 $159.50 2033-37 $101.43 $13.26 $33.60 $0.00 $0.00 $0.00 $148.29
Total $957.13 $499.84 $123.60 $34.83 $6.27 $1.00 $1,622.67 Figures above do NOT include $129.5 million in general fund refunding bonds issued in FY 2013, which
have increased outstanding debt balance further from FY 2012 balances.
13-53846 Doc 12 Filed 07/18/13 Entered 07/18/13 21:52:16 Page 52 of 52


![PUBLIC DOCUMENT - cloudflare.workscloudflare.works/files/[44-3] Thompson Declaration.pdf · PUBLIC DOCUMENT PUBLIC DOCUMENT PUBLIC DOCUMENT Case 1:15-cv-00064-RGA Document 44-3 Filed](https://static.documents.pub/doc/80x56/5a9cf3917f8b9a01398b9d4c/public-document-44-3-thompson-declarationpdfpublic-document-public-document.jpg)

