29
United States Coast Guard Risk Management Overview LCDR David Cooper CG-512: Office of Performance Management and Assessment [email protected] 202-372-2588

United States Coast Guard Risk Management
Overview
LCDR David CooperCG-512: Office of Performance Management and Assessment

“Because it is not feasible to secure our homeland against every conceivable threat, we have instituted risk management as the primary basis for policy and resource allocation decision making.”
» - DHS Strategic Plan 2008-2013
Secretary of Homeland Security
“Given the extensive number of vulnerabilities to manmade and natural disasters and the limitations on resources,
determining national priorities and the judicious distribution of resources are a major element of the department’s
mission. What is the status of risk analysis metrics and what is the plan and time frame for setting up a full-blown
system to govern the establishment of critical infrastructure programs, the priorities among national planning scenarios,
and the distribution of grants to state, local, and tribal entities? More broadly, how can DHS enhance risk
management as the basis of decision making?
Secretary Napolitano Issues First in a Series of Action Directives 21JAN09

National Strategy for Homeland Security
. . . We must apply a risk-based framework across all homeland security efforts in order to identify and assess potential hazards (including their downstream effects), determine what levels of relative risk are acceptable, and prioritize and allocate resources among all homeland security partners …

USCG & Risk Management
• A Principle of USCG Operations
• Challenging due to the multi-mission nature of the organization
• One criteria in USCG decision making
• Ultimately – an Integrated Performance Management System for Risk, Readiness & ROI

Basic Elements of Risk
RiskUnderstanding
Foundation for Risk Assessment• Historical
experience• Analytical
methods• Knowledge
and intuition
What cango wrong?
How likelyis it?
What are the impacts?
Risk ƒ Likelihood x Consequence

Key Coast Guard Risk Efforts• Maritime Security Risk Analysis Model (MSRAM): field level risk analysis tool to
support terrorism risk management decisions at all levels; integrates national level threat with geo-specific vulnerability and consequence data.
• Ports, Waterways and Coastal Security (PWCS) Outcome measure: Built off MSRAM we utilize a simplified, scenario based, event tree model to calculate the expected risk reduction of CG operational, regime and domain awareness activities.
• National Maritime Strategic Risk Assessment (NMSRA): an all hazard / all mission risk assessment; shows the residual risk or the risk after Coast Guard intervention in the maritime domain.
• Risk Management Module: Builds a field level, all mission risk analysis tool based off the NMSRA to support operational planning, and risk management decisions.
Challenges:• For terrorism profiles, we have a data-poor problem set with significant
uncertainty of expected attack frequencies, and to some extent consequence. • Heavy reliance on Subject Matter Expert judgment• assessing public “risk tolerance”, • accepted/equated values across consequence types and indirect or secondary
impacts, • geographic risk factors, including dealing with threat shifting and changes over
time. • Still a burgeoning field

Collaborative Efforts• DHS Risk Management and Analysis (RMA) efforts
– Homeland Security National Risk Assessment
• CREATE: Strong partnership to include: – Review of Coast Guard terrorism risk efforts– exchanging ideas and best practices– discussing and sharing methods, models, data, etc
• Leveraging CREATE strengths in– Risk analysis– Economic assessment, particularly calculation of
indirect/secondary economic impact consequences– Resource allocation methodology

Questions?

• Back-up slides

…is focused on defining the “problem”
Risk Assessment Phase
FY11 Risk Assessment
• Strategic Risk
• Operational Risk– National Maritime Strategic Risk
Assessment
• Mission Support Risk
• Institutional Risk

Risk Assessment Methodology • Name the undesirable incidents and scenarios within purview
that cause public loss– Statutes, Mandates, Roles and Missions
• Scope– Time horizon
• Consequence Table• Describe, for each incident the best way to estimate and
represent the risk:– Likelihood:
• Threat * Vulnerability * Consequence • Frequency * Consequence
• Assess the Risk– Systematic approach based on the HAZOP analysis technique– Performed using a team of subject matter experts – Leverages historical incident information and applicable models/studies.

Incidents• Grounding• Collision/Allision• Flooding/sinking• Fire/explosion• Personal injury/illness• Oil spills• Discharge of debris/sewage• Release of HAZMAT• Species damaged by marine
operations• Invasive species
introduction• U.S. EEZ encroachment• Fish stock non-sustainability
• Drug smuggling• Illegal migrant entry• Seasonal conditions
affecting waterways• Interruption of military
operations• Periodic/expected natural
disaster• Non-maritime incident
affecting a waterway• Nation state attack• Attack on Port Infrastructure• Transfer of WMD• Transfer of Terrorist

Example Maritime Accident Grounding of a Container Ship that results in:
Environmental Impacts5K Barrels of Fuel Oil Spilled
Deaths/Injuries1 Crew Member
Killed
Property Damage$15M of Damage to
Ship and Cargo$
Risk assessment process estimates the
national expected frequency that
groundings of container ships result in impacts
of each type and severity level

Facilitated analysisof scenarios
Risk Profiles
Expert judgment
Enterprise Data Sources
Process Overview
0
1000
2000
3000
4000
5000
6000
Floo
ding
-Sin
king
Pers
onne
l Mis
hap
Dru
g Sm
uggl
ing
Nat
ural
Dis
aste
r
Atta
ck o
n Po
rt In
frast
ruct
ure
or M
TSC
ollis
ion-
Allis
ion
Fore
ign
Illeg
al F
ishi
ngO
il Sp
illN
atio
n St
ate
Atta
ckN
on-M
ariti
me
Inci
dent
Dom
estic
Ille
gal F
ishi
ng
Inva
sive
Spe
cies
Intro
duct
ion
Dis
char
ge o
f Deb
ris/S
ewag
eG
roun
ding
Mar
ine
Cas
ualty
Affe
ctin
g W
ater
way
Inte
rrup
tion
of M
ilitar
y O
pera
tions
Seas
onal
Con
ditio
nsFi
re-E
xplo
sion
Illeg
al M
igra
nt E
ntry
Rel
ease
of H
AZM
AT
Spec
ies
Dam
aged
by
Mar
ine
Ope
ratio
ns
Method& Tool

0
1000
2000
3000
4000
5000
6000
Floo
ding
-Sin
king
Pers
onne
l Mish
apDr
ug S
mug
glin
gNa
tura
l Disa
ster
Atta
ck o
n Po
rt In
frast
ruct
ure
or M
TSCo
llisio
n-Al
lisio
nFo
reig
n Ille
gal F
ishin
gO
il Spi
llNa
tion
Stat
e At
tack
Non-
Mar
itime
Incid
ent
Dom
estic
Ille
gal F
ishin
g
Inva
sive
Spec
ies
Intro
duct
ion
Disc
harg
e of
Deb
ris/S
ewag
eG
roun
ding
Mar
ine
Casu
alty
Affe
ctin
g W
ater
way
Inte
rrupt
ion
of M
ilitar
y O
pera
tions
Seas
onal
Con
ditio
nsFi
re-E
xplo
sion
Illega
l Mig
rant
Ent
ryRe
leas
e of
HAZ
MAT
Spec
ies
Dam
aged
by
Mar
ine
Ope
ratio
ns
2006 Residual Risk ResultsAll incidents (excluding transfer of WMD or terrorists)
Category-8Category-7Category-6Category-5Category-4Category-3Category-2Category-1
Severity
Important Note: These are not suggested resourcing profiles! Context is required before these profiles are able to meaningfully inform planning and budgeting decisions.
13

2006 Residual Risk ResultsAll incidents
13
0
5000
10000
15000
20000
25000
30000
35000
Tran
sfer
of W
MD
Tran
sfer
of T
erro
rist
Floo
ding
-Sin
king
Pers
onne
l Mis
hap
Dru
g Sm
uggl
ing
Nat
ural
Dis
aste
r
Atta
ck o
n Po
rt In
frast
ruct
ure
or M
TSC
ollis
ion-
Allis
ion
Fore
ign
Illeg
al F
ishi
ngO
il Sp
illN
atio
n St
ate
Atta
ckN
on-M
ariti
me
Inci
dent
Dom
estic
Ille
gal F
ishi
ng
Inva
sive
Spe
cies
Intro
duct
ion
Dis
char
ge o
f Deb
ris/S
ewag
eG
roun
ding
Mar
ine
Cas
ualty
Affe
ctin
g W
ater
way
Inte
rrupt
ion
of M
ilitar
y O
pera
tions
Seas
onal
Con
ditio
nsFi
re-E
xplo
sion
Illeg
al M
igra
nt E
ntry
Rel
ease
of H
AZM
AT
Spec
ies
Dam
aged
by
Mar
ine
Ope
ratio
ns
Due to the highly uncertain nature of terrorism attacks, we conduct
sensitivity analyses on the credible range of frequencies and
consequences for these attacks.
0200400600800
1,0001,2001,4001,6001,800
Vess
els/ W
atersid
e Attack
Vess
els/ S
horesid
e Attack
Vess
els/ A
ircraft Attack
Vess
els/ S
tand-off W
eapo
ns
Vess
el/CB
RNE
Vess
el/Su
b-su
rface
Atta
ck
Vess
el/ Exp
loitatio
n/ In
ternal
Forces
Vess
el/ Exp
loitatio
n/ E
xternal
Forces
Facilitie
s/ Watersid
e Attack
Facilitie
s/ Sh
ores
ide A
ttack
Facilitie
s/ Aircraft Attack
Facilitie
s/Stand
-off Wea
pons
Facilitie
s/Sub
-surface
Atta
ck
From MSRAM

Uses of NMSRA Risk Information• Strategic Planning Direction
• Commandant’s budget intent
• Performance target setting process
• Operational effectiveness modeling
• Requirements development
• Mission analysis
• Resource Proposal development and evaluation
• Resource allocation

Maritime Security Risk Analysis Model
• Support tactical decisions at the field level by enabling users to consider the full spectrum of terrorist risks to assets within their AOR
• Support operational and strategic decisions by rolling up of field-level risk assessments to portray risk density of targets Sector, District, Area, HQ
ObjectiveCreate a field-level risk analysis tool to support
risk management decisions at all levels

How our PWCS / CMT Measure Works
Threat Vulnerability ConsequenceX X
1) Assessment of Risk - the 15 Scenarios that cause the most risk
Coast Guard T Reduction
Coast Guard V Reduction
Coast Guard C Reduction
Risk the CG Reduced
X X =
Risk the CG can Impact (we own)
=
Risk we Reduced
Risk we can Impact (own)=
2) Assessment of Performance
Our Annual Performance (% Risk Reduction)
15%2007=
20%2008=
• Transfer through the Maritime Domain of Terrorists
• Transfer through the Maritime Domain of WMD
• Waterside attack on Vessel
• Shoreside attack on Vessel
• Aircraft attack on Vessel
• Stand-off Weapons attack on Vessel
• CBRNE attack on Vessel
• Sub-surface Attack on Vessel
• Use of Vessel as Weapon - Exploitation by Internal Forces
• Use of Vessel as Weapon - Exploitation by External Forces
• Waterside attack on Facility
• Shoreside attack on Facility
• Aircraft attack on Facility
• Stand-off Weapons attack on a Facility
• Sub Surface attack on a Facility

CMT Strategic Risk Model
• Illustrate the layered security strategy that the USCG provides/could provide against each meta-scenario’s continuum to prevent, protect, respond, and recover
• Define the roles of USCG activities and how they relate to one another (e.g., detection, intervention, support)
• Calculate the magnitude of risk that is being reduced by the layered security strategy
• Provide a mechanism for estimating the risk reduction importance of individual activities within the layered security strategy for a scenario
• Estimate the cost associated with performing each activity/groups of activities
A simplified, scenario-based, event tree model used in planning efforts to:

Waterside attack on Vessel Scenario
Prevention(Threat Reduction)Protection(Vulnerability Reduction)Response & Recovery(Consequence Reduction)
Legend:
Step 1 – Define the Scenario

Waterside attack on Vessel Scenario
Prevention(Threat Reduction)Protection(Vulnerability Reduction)Response & Recovery(Consequence Reduction)
Legend:
Suspect Vessel Boarding 1
Specialized Use of Force 2
EscortVessel 4
End Game Prosecution 3
Step 2 – Identify USCG Interventions
5Intervene After Attack - Response

Specialized Use of Force
Suspect Vessel Boarding
End Game Prosecution
Waterside attack on Vessel Scenario
1
2
3
EscortVessel 4
5Intervene After Attack - Response
Prevention(Threat Reduction)Protection(Vulnerability Reduction)Response & Recovery(Consequence Reduction)
Legend:
Provides detection function to cue
“dependent” activities Intel
Step 3 – Identify which interventions depend on external detection

Specialized Use of Force
Suspect Vessel Boarding
End Game Prosecution
Waterside attack on Vessel Scenario
1
2
3
EscortVessel 4
5Intervene After Attack - Response
Prevention(Threat Reduction)Protection(Vulnerability Reduction)Response & Recovery(Consequence Reduction)
Legend:
Provides detection function to cue
“dependent” activities Intel
50%
18%
83%
93%
5%
93%Step 4 – Estimate the probability that the activity fails to perform its role

What types of activities were assessed?
• Probability that USCG activities successfully perform their role:– Detection Activities (e.g., MDA) Probability of
successfully detecting, tracking, and communicating attack information to dependent activities
– Dependent Activities Probability of successfully intervening given cuing by MDA
– Independent Activities Probability of successfully detecting and intervening
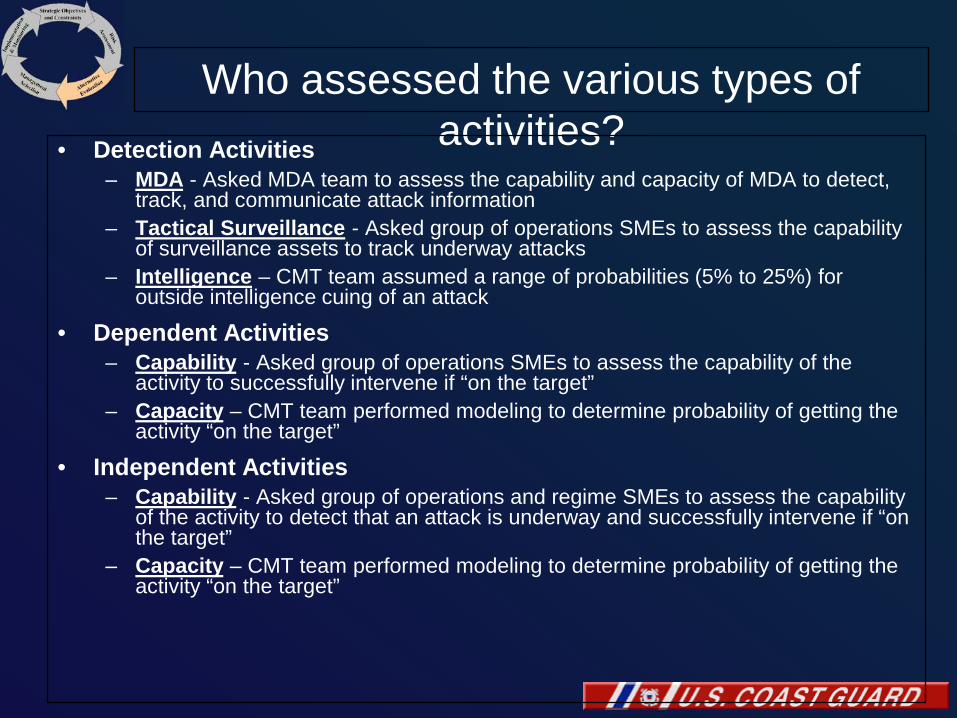
Who assessed the various types of activities?• Detection Activities
– MDA - Asked MDA team to assess the capability and capacity of MDA to detect, track, and communicate attack information
– Tactical Surveillance - Asked group of operations SMEs to assess the capability of surveillance assets to track underway attacks
– Intelligence – CMT team assumed a range of probabilities (5% to 25%) for outside intelligence cuing of an attack
• Dependent Activities– Capability - Asked group of operations SMEs to assess the capability of the
activity to successfully intervene if “on the target”– Capacity – CMT team performed modeling to determine probability of getting the
activity “on the target”
• Independent Activities– Capability - Asked group of operations and regime SMEs to assess the capability
of the activity to detect that an attack is underway and successfully intervene if “on the target”
– Capacity – CMT team performed modeling to determine probability of getting the activity “on the target”

How did they assess the activities?
• Highly Effective (HE) - 90-100%• Effective (E) - 75-90% • Substantial (S) - 25-75% • Limited (L) - 10-25% • Very Limited (VL) - 5-10%• Measurable (M) - 1-5%• Not Measurable (NM) - <1%

Threat Vulnerability Consequence
Specialized U
se of Force*
Suspect Vessel B
oarding*
End G
ame P
rosecution*
1 2 3
Escort Vessel
4 5Intervene A
fter A
ttack -R
esponse
Raw Risk700 RIN * 96% * 94% * 93% * 83% * 93% = 448 RIN
Residual RiskLine of Assurance Failure Probabilities
700-448 = 252 RIN
Risk Reduction
32%
*Lines of Assurance dependent on external detection activities (e.g., MDA)
Targets directly protected by USCG
activities
Targets not directly protected by USCG
activities
300-233 = 67 RIN319 RIN
1 2 3 5
Raw Risk300 RIN * 96% * 94% * 93% * 93% = 233 RIN
Residual RiskLine of Assurance Failure Probabilities
Step 5 – Calculate the risk impact of USCG interventions


