Minnesota Safety Rest Area Programs Market Research Telephone Survey February 1995-October 1998 Minnesota Department of Transportation Office of Technical Support Site Development Unit December 1998
Transcript
Minnesota Safety Rest Area Programs
Market Research Telephone Survey
February 1995-October 1998
Minnesota Department of Transportation
Office of Technical SupportSite Development Unit
December 1998
Minnesota Safety Rest Area Programs Market Research
Market ResearchTelephone Survey
February 1995 - October 1998
Prepared By: Market Research Unit - M.S. 150Minnesota Department of Transportation395 John Ireland BoulevardSt. Paul, MN 55155
andSite Development Unit - M.S. 686Office of Technical SupportMinnesota Department of Transportation395 John Ireland BoulevardSt. Paul, MN 55155
Prepared with Assistance from: Cook Research & Consulting, Inc.
6600 France Avenue SouthMinneapolis, MN 55435
This document is available in alternative formats to individuals with disabilities by calling (651) 296-9570 or through the Minnesota Relay Service at 1-800-627-3529.
Preface
The Minnesota Department of Transportation (Mn/DOT) operates a network of 55 full-servicesafety rest areas along the Interstate and high-volume non-interstate highways. Since 1969,Mn/DOT has conducted surveys at safety rest areas throughout the state. This data has providedthe basis for determining the size of buildings and parking lots and has also been used to validateand identify services that the public uses and desires to have available at safety rest areas.
To supplement this information and to improve the level of understanding of safety rest area usersas well as non-users, the Site Development Unit, with assistance from the Market Research Unit,conducted several market research studies during 1997 and 1998. Each of these studies weredesigned to expand Mn/DOT’s understanding of a specific market segment in order to improve thedelivery of safety rest area services.
The following studies were conducted:
1. Review of Historical Data The review of historical data assembled all of the information that Mn/DOT had already collected
in order to identify trends and to provide a summary of existing information. 2. Focus Groups Focus Groups were held with Minnesota citizens to identify public attitudes towards rest areas,
identify the kinds of services that rest area users expect and utilize at rest areas and to identifyissues surrounding the maintenance and operation of rest areas.
3. Statewide Telephone Survey A statewide telephone survey was conducted to identify the proportion of Minnesota citizens who
use rest areas and to identify reasons why some citizens do not use rest areas. This survey alsoincluded ratings of the importance and quality of the services currently available at safety restareas.
4. Evaluation of Nighttime Truck Parking The nighttime truck parking study identified where there is greater demand for nighttime truck
parking at safety rest areas than there are available spaces.
Separate reports are available from the Site Development Unit to document this research.
This report summarizes the information gathered in the “Usage and Satisfaction ResearchTelephone Survey”.
1997 Mn/DOT Rest Area Market Research Telephone Survey3
1997 Mn/DOT Rest Area Market Research Telephone Survey4
(List of Figures)
Figure 2. Approximate number of times respondents havedriven at least one hour or at least 75 miles on statehighways and interstate freeways within the State ofMinnesota in the past 3 years..... ............ ............ ............ ............ ............17
Figure 3. Respondent typically a driver or a passengerwhen traveling in a car or other type of motorized vehicle ........... ............18
Figure 4. The various types of facilities where respondentsstop while traveling on Minnesota's interstate freewaysand state highways, and the one type of facility whererespondents prefer to stop .......... ............ ............ ............ ............ ............19
Figure 5. The various types of facilities where Twin Citiesmetro area respondents stop while traveling on Minnesota'sinterstate freeways and state highways, and the one typeof facility where Twin Cities metro area respondents preferto stop............... ............ ............ ............ ............ ............ ............ ............20
Figure 6. The various types of facilities where respondentsfrom Greater Minnesota prefer to stop while traveling onMinnesota's interstate freeways and state highways, and theone type of facility at which Greater Minnesota respondentsprefer to stop .... ............ ............ ............ ............ ............ ............ ............21
Figure 7. Reasons respondents do not use highway restareas in Minnesota ........ ............ ............ ............ ............ ............ ............22
Figure 8. The one type of vehicle in which respondentsmost often travel when stopping at a highway rest area inMinnesota......... ............ ............ ............ ............ ............ ............ ............23
Figure 9. Times of the day or night respondents typicallystop at a highway rest area in Minnesota ............ ............ ............ ............24
Figure 10. Times of the day or night Twin Cities metroarea respondents and Greater Minnesota respondentstypically stop at a highway rest area in Minnesota........... ............ ............25
Figure 11. The most frequently mentioned reasons byrespondents for stopping at a highway rest area inMinnesota, and the one primary reason for stopping........ ............ ............26
Figure 12. The most frequently mentioned reasons byTwin Cities metro area respondents for stopping at ahighway rest area in Minnesota, and the one primaryreason for stopping........ ............ ............ ............ ............ ............ ............28
1997 Mn/DOT Rest Area Market Research Telephone Survey5
Figure 13. The most frequently mentioned reasons byGreater Minnesota respondents for stopping at ahighway rest area in Minnesota, and the one primaryreason for stopping........ ............ ............ ............ ............ ............ ............29
Figure 14. The most frequently mentioned facilitiestypically used by respondents when stopped at a highwayrest area in Minnesota ... ............ ............ ............ ............ ............ ............30
Figure 15. Additional facilities or services respondentswould like to see provided at the highway rest areas inMinnesota......... ............ ............ ............ ............ ............ ............ ............31
Figure 16. Mean (average) "importance" ratings forMinnesota highway rest area characteristics ....... ............ ............ ............32
Figure 17. Mean (average) "importance" ratings forMinnesota highway rest area characteristics rated bywomen and men ............ ............ ............ ............ ............ ............ ............34
Figure 18. Mean (average) "performance" ratings forState of Minnesota regarding state highway rest areacharacteristics... ............ ............ ............ ............ ............ ............ ............35
Figure 19. Comparison of scores between "importance"rating and "performance" rating for characteristics ofhighway rest areas in Minnesota ............ ............ ............ ............ ............36
Figure 20. Times of the day or night when a respondentwouldn't stop at a highway rest area in Minnesota ........... ............ ............38
Figure 21. Times of the day or night when women andmen wouldn't stop at a highway rest area in Minnesota ... ............ ............39
Figure 22. Reasons respondents do not stop at highwayrest areas in Minnesota . ............ ............ ............ ............ ............ ............40
Figure 23. What a respondent would tell an out-of-statefriend planning to travel through Minnesota if asked todescribe the highway rest areas in Minnesota ..... ............ ............ ............41
Figure 24. Possible descriptions for the highway restareas in Minnesota ........ ............ ............ ............ ............ ............ ............43
Figure 25. What respondents would change, if they could,about the highway rest areas in Minnesota.......... ............ ............ ............44
Figure 26. Respondents' overall rating comparing thehighway rest areas in Minnesota to rest areas in other states ........ ............45
1997 Mn/DOT Rest Area Market Research Telephone Survey6
Figure 27. How much respondents agree with thestatement, "It is perfectly acceptable to use highway taxfunds for the construction and maintenance of Minnesota'srest areas."........ ............ ............ ............ ............ ............ ............ ............46
Figure 28. How much respondents agree with thestatement, "Rest areas are important to travelers onMinnesota's state highways and interstate freeways." ...... ............ ............47
Figure 29. The highway rest area or rest areas thatrespondents were thinking about during the survey ......... ............ ............48
1997 Mn/DOT Rest Area Market Research Telephone Survey7
METHODOLOGY
Background & Purpose
For over two decades, Mn/DOT has been conducting on-site surveys at the safety rest areas that are located onMinnesota's state highways and interstate freeways. The surveys have provided profiles of rest area users for manysites throughout the state. These profiles have been used to assist Mn/DOT's Site Development Unit in designingsafety rest areas and managing the system of safety rest areas.
However, the on-site surveys are limited to basic opinion, attitude and behavior profiles of rest area users. Focusgroups were conducted in the Summer of 1997 to consult Minnesota motorists and commercial drivers who aresafety rest area users in order to collect more in-depth, qualitative, customer-satisfaction information. Through thiseffort, Mn/DOT identified a number of concerns and suggestions for improvement which provided additionaldirection for a subsequent statewide telephone survey of Minnesota citizens.
The on-site surveys have measured the opinions, attitudes and behaviors of only rest area users. Non-users havenot been represented in these surveys nor were they represented in the focus groups. In order to reach non-users, astatewide telephone survey of Minnesota citizens was commissioned. This telephone survey was designed to meetthe following specific objectives.
• Determine the proportion of citizens of Minnesota who regularly travel one hour or 75 miles from homeusing interstate freeways and state highways in Minnesota.
• Determine the proportion of Minnesota citizens who stop at safety rest areas while traveling onMinnesota's interstate freeways and state highways.
• Determine why Minnesota citizens who use interstate freeways and state highways make the decision tostop at safety rest areas and which services they typically use once stopped.
• Determine why Minnesota citizens who use interstate freeways and state highways make the decision toNOT stop at safety rest areas.
In addition to the study objectives identified above, this survey provides an opportunity to measure the opinions,attitudes and behaviors of rest area users. The following objectives apply specifically to rest area users:
• Identify the distribution of vehicles operated by rest area users.
• Identify the variation of rest area use by time of day.
• Identify the relative importance that rest area users place on specific services available at safety rest areas.
• Identify the satisfaction level that rest area users give to specific services available at safety rest areas.
• Determine the times of day and situations when regular safety rest area users would avoid using a safetyrest area.
• Determine overall attitudes towards safety rest areas.
• Determine the value Minnesota citizens place on having Mn/DOT provide safety rest areas on Minnesota'sinterstate freeways and state highways.
• Determine how safety rest areas in the State of Minnesota compare to safety rest areas in other states.
1997 Mn/DOT Rest Area Market Research Telephone Survey8
Cook Research & Consulting, Inc. of Minneapolis was commissioned to complete a telephone survey with citizensof Minnesota. Results of the study will be used by the Minnesota Department of Transportation to assess the usageof highway rest areas and measure citizens' overall satisfaction with them so that Mn/DOT can continue makinginformed customer-service decisions.
Sampling Frame and Population Breakdown
A listing of randomly-generated telephone numbers was obtained from a telephone sampling company. An attemptto include a household in the population consisted of at least two tries to that number before moving on to a nextrandomly-generated number. The population for this study consisted of 503 Minnesota citizens.
1997 Mn/DOT Rest Area Market Research Telephone Survey9
POPULATION BREAKDOWN
7 COUNTY METROAGE GROUPS
MALES FEMALES TOTAL
18 - 24 3.0% 3.2% 6.2%
25 - 34 5.5% 6.0% 11.5%
35 - 44 6.1% 6.0% 12.1%
45 - 54 4.3% 4.2% 8.5%
55 - 64 2.8% 2.8% 5.6%
65 - 74 2.2% 2.6% 4.8%
75 + 1.6% 2.8% 4.4%
GROUP COMPLETES (25.7%) (27.4%) (53.1%)
GREATER MINNESOTAAGE GROUPS
MALES FEMALES TOTAL
18 - 24 3.0% 2.0% 5.0%
25 - 34 4.5% 5.0% 9.5%
35 - 44 5.8% 5.3% 11.1%
45 - 54 3.9% 3.8% 7.7%
55 - 64 2.8% 2.8% 5.6%
65 - 74 2.0% 2.0% 4.0%
75 + 1.4% 2.6% 4.0%
GROUP COMPLETES (23.4%) (23.5%) (46.9%)
TOTAL COMPLETES (49.1%) (50.9%) (100.0%)
Figure 1. (Figure 1 identifies the proportions of the population by sex for Minnesota citizens, age 18 and older.The 503 citizens of Minnesota who were interviewed for this survey matched these proportions for age andgender.)
1997 Mn/DOT Rest Area Market Research Telephone Survey10
Margin of Error
The 503 completed questionnaires provide a 95% confidence level with a maximum margin of error of ± 4.4% inestimating the proportion of the population who express a certain characteristic or opinion. In other words, if 100samples (all of 503 in size) were drawn from this population, approximately 95 of the samples would reflectpercentages within ± 4.4% of the proportions for the entire population regarding the characteristic or opinion beingmeasured.
The margin of error explained above applies only to responses for the entire sample. When looking at theresponses of smaller segments, the margin of error will be larger. The 267 completed questionnaires for citizensliving in the Twin Cities metro area provide a 95% confidence level with a maximum margin of error of ± 6.0%.The 236 completed questionnaires for citizens living in Greater Minnesota provide a 95% confidence level of ±6.4%.
Collection Technique & Timing
All data were collected through the use of telephone interviews. Interviews were conducted during weekdayevening, weekend daytime and weekend evening hours when citizens of the State were more likely to be at home.Data collection was conducted from December 1 through December 22, 1997. The data collection was supervisedby staff from Cook Research & Consulting, Inc.
A copy of the questionnaire used is appended. A set of data tables upon which this report is based has beensubmitted separately.
1997 Mn/DOT Rest Area Market Research Telephone Survey11
SUMMARY OF FINDINGS
1997 Mn/DOT Rest Area Market Research Telephone Survey12
Note: When reviewing the Summary of Findings and the General Conclusions, they can be more thoroughlyunderstood if several other sections of the report are also reviewed. First, the questionnaire provides theactual phrasing for each question. A solid understanding of the context within which each question wasasked will enable Mn/DOT to more accurately interpret the findings. Second, the data tables providedetailed results for many different sample segments. Since the condensed nature of the Summary ofFindings and the General Conclusions does not allow all of these conclusions to be addressed, it isstrongly recommended that the data tables be reviewed and used to facilitate any major decisionsMn/DOT makes related to Minnesota's highway rest areas.
The Summary of Findings below highlights the major findings from the survey. Further information about thesefindings can be found in the section, "General Conclusions," which follows the Summary of Findings.
#1: The largest proportion of Minnesota citizens have a mobile life style.
#2: Nearly three-quarters of the respondents in the telephone survey are typically the driverswhen they travel.
#3: Approximately seven of every ten respondents have stopped at a highway rest area whiletraveling on state highways and interstate freeways in Minnesota.
#4: Nearly eight of every ten respondents from the Twin Cities metro area have stopped at ahighway rest area while traveling on Minnesota's highways.
#5: Over half of the respondents from Greater Minnesota have stopped at a highway rest areawhile traveling on Minnesota's highways and interstate freeways.
#6: Thirty percent of the respondents in the telephone survey (146) who travel on Minnesotastate highways and interstate freeways do not use highway rest areas.
#7: Nearly half of the respondents who do not use highway rest areas do not travel far enough toneed to stop there.
#8: Users of rest areas in Minnesota are most frequently driving cars.
#9: Minnesota's rest areas are used most during the afternoon.
#10: Respondents from both the Twin Cities metro and from Greater Minnesota stop mostfrequently at Minnesota's rest areas during the hours of noon to 5:00 p.m.
#11: Many rest area users decide to stop at a Minnesota rest area for more reasons than to justuse the restrooms.
#12: Nevertheless, the primary reason most respondents mention for stopping at a rest area is touse the restrooms.
#13: The primary reason some respondents give for stopping at a rest area concerns safetymatters.
#14: Respondents from the Twin Cities metro area also mention stopping at Minnesota's restareas for a variety of reasons.
#15: Reasons why respondents from Greater Minnesota stop at rest areas in Minnesota closelyparallel the reasons given by respondents from the Twin Cities metro area.
#16: Rest area users who were asked which facilities they typically use once they stop at aMinnesota rest area, most often mention using the restrooms (98.6%), the trash receptacles(84.6%), the drinking fountain or outdoor water faucet (73.1%) and the recyclingreceptacles (66.0%).
1997 Mn/DOT Rest Area Market Research Telephone Survey13
#17: For the most part, rest area users do not want any additional facilities or services provided atthe rest areas in Minnesota.
#18: Above all else, rest area users want clean restrooms at Minnesota's rest areas.
#19: Women tend to rate Minnesota highway rest area characteristics higher than men.
#20: Overall, outside-the-building "performance" characteristics (such as providing trashreceptacles, separate and adequate parking for large trucks, etc.) of Minnesota's rest areasare rated higher by rest area users than are inside-the-building "performance" characteristics(such as providing vending machines, tourist information, directions, etc.).
#21. When considering how respondents rate the "importance" of certain characteristics relatedto highway rest areas in Minnesota and how these same respondents rate Minnesota's"performance" on the same characteristics, there are areas where the State has anopportunity to improve, areas where the State is exceeding expectations and areas whereperformance equals importance.
#22: Over 40% of the rest area users would not stop at a highway rest area in Minnesota duringcertain times of the day or night.
#23: More women than men would not stop at a highway rest area in Minnesota in the earlierevening and early in the morning.
#24: Personal safety is the main reason respondents give for not stopping at Minnesota's restareas at particular times of the day/night.
#25: Many rest area users would describe Minnesota's highway rest areas as clean, wellmaintained, in good shape and a nice place to stop.
#26: Overall, respondents are positive toward the rest areas in Minnesota.
#27: When asked what they would change about the highway rest areas in Minnesota, one-third(34.3%) of the respondents mention that there is nothing they would change.
#28: Minnesota's rest areas are rated better or at least equal to the rest areas in other states.
#29: Most respondents support the use of tax funds for the construction and maintenance ofMinnesota's rest areas.
#30: Eight of every ten respondents in the telephone survey mention that Minnesota's rest areasare important to travelers.
#31: Most rest area users were thinking of rest areas on interstates -- I-35, I-94 or I-90 -- whilecompleting the survey.
1997 Mn/DOT Rest Area Market Research Telephone Survey14
1997 Mn/DOT Rest Area Market Research Telephone Survey15
GENERAL CONCLUSIONS
1997 Mn/DOT Rest Area Market Research Telephone Survey16
1997 Mn/DOT Rest Area Market Research Telephone Survey17
FREQUENCY OF TRAVELING ON MINNESOTA HIGHWAYS
1.8%
9.6%1.0%
12.7%
12.7%
62.2%Fewer than 5 times
5 to 10 times
11 to 20 times
More than 20 times
None/No times
Never travel/Neverleave home
Figure 2. Approximate number of times respondents have driven at least one hour or at least 75 miles onstate highways and interstate freeways within the State of Minnesota in the past 3 years. (This figureincludes all respondents.) (n=503)
Finding #1: The largest proportion of Minnesota citizens have a mobile life style.
All respondents in the telephone survey were asked approximately how many times they have driven atleast one hour or at least 75 miles on state highways and interstate freeways within the State of Minnesotain the previous three years. Three hundred thirteen (313) of the respondents (62.2%) mention driving atleast one hour or at least 75 miles on Minnesota state highways and interstate freeways more than 20 timesin the previous three years. One hundred seventy-six (176) respondents (35.0%) mention driving 20 orfewer times on state highways and interstate freeways while 14 respondents (2.8%) mention nevertraveling/never leaving home in this same time frame.
There is a significant difference between men and women from the Twin Cities metro area and their travelfrequency. More men than women from the Twin Cities metro area mention frequently traveling onMinnesota's highways and freeways. Sixty-nine percent (69%) of the men from the Twin Cities metro areamention traveling on highways more than 20 times in the previous three years while nearly 53% of thewomen in the Twin Cities mention traveling this often.
1997 Mn/DOT Rest Area Market Research Telephone Survey18
FREQUENCY OF DRIVING VERSUS RIDING
12.0%
71.5%
10.6% 5.5% 0.4% Passenger
Driver
Equal passenger anddriverVaries
Never travel/Neverleave hom e
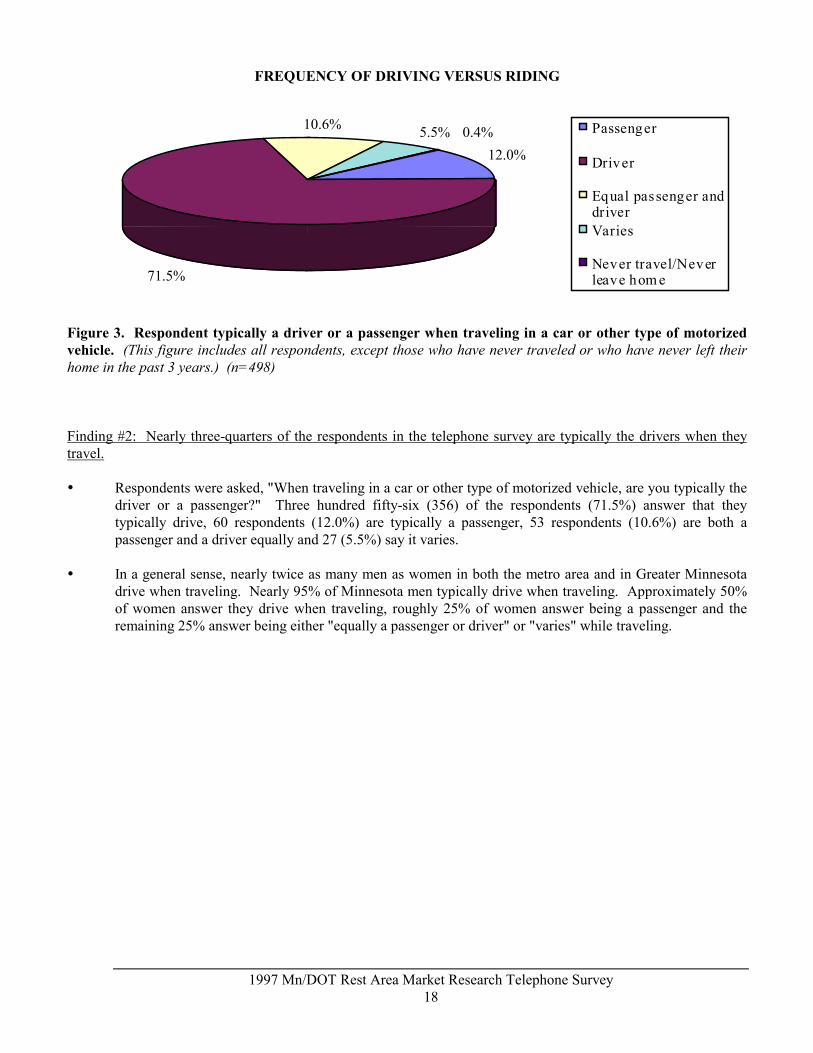
Figure 3. Respondent typically a driver or a passenger when traveling in a car or other type of motorizedvehicle. (This figure includes all respondents, except those who have never traveled or who have never left theirhome in the past 3 years.) (n=498)
Finding #2: Nearly three-quarters of the respondents in the telephone survey are typically the drivers when theytravel.
Respondents were asked, "When traveling in a car or other type of motorized vehicle, are you typically thedriver or a passenger?" Three hundred fifty-six (356) of the respondents (71.5%) answer that theytypically drive, 60 respondents (12.0%) are typically a passenger, 53 respondents (10.6%) are both apassenger and a driver equally and 27 (5.5%) say it varies.
In a general sense, nearly twice as many men as women in both the metro area and in Greater Minnesotadrive when traveling. Nearly 95% of Minnesota men typically drive when traveling. Approximately 50%of women answer they drive when traveling, roughly 25% of women answer being a passenger and theremaining 25% answer being either "equally a passenger or driver" or "varies" while traveling.
1997 Mn/DOT Rest Area Market Research Telephone Survey19
TYPES OF FACILITIES USED WHILE TRAVELING
A st ate, cou nty , o rcity park
A co nv en iencestore
A si t-d ow nrestau ran t
A fast fo odrestau ran t
A g as station
A rest area on thehig hw ay
0 20 40 60 80 10 0
A st ate, cou nty , o rcity park
A co nv en iencestore
A si t-d ow nrestau ran t
A fast fo odrestau ran t
A g as station
A rest area on thehig hw ay
Th e o ne facil ityprefer to sto p atwh ile trav eling
Facili ties stop atwh ile trav eling
Figure 4. The various types of facilities where respondents stop while traveling on Minnesota's interstatefreeways and state highways, and the one type of facility where respondents prefer to stop. (This figureincludes all respondents, except those who have never traveled or who have never left their homes in the past 3years.) (n=496)
Finding #3: Approximately seven of every ten respondents have stopped at a highway rest area while traveling onstate highways and interstate freeways in Minnesota.
Respondents who have traveled on Minnesota's highways and interstate freeways in the previous threeyears were asked to name all the various types of facilities where they stop while traveling. The mostfrequently mentioned facilities where respondents stop while traveling include gas stations (91.5%), fastfood restaurants (74.0%), highway rest areas (69.8%) and sit-down restaurants (65.5%).
Note: Percentages do not equal, and exceed, 100% because this is a question where a respondent could givemore than one answer when responding. Therefore, the number of answers may well be in excess of oneanswer per respondent.
Respondents were also asked the one type of facility where they prefer to stop while traveling. Gasstations (28.4%) and highway rest areas (24.2%) are most frequently mentioned. Fewer than 18% mentioneither sit-down restaurants or fast food restaurants as the places where they prefer to stop.
1997 Mn/DOT Rest Area Market Research Telephone Survey20
TYPES OF FACILITIES USED WHILE TRAVELING(TWIN CITIES METRO AREA RESPONDENTS)
A st ate, county , orcity park
A conveniencestore
A si t-downrestauran t
A fast foodrestauran t
A gas station
A rest area on thehighway
0 20 40 60 80 100
A st ate, county , orcity park
A conveniencestore
A si t-downrestauran t
A fast foodrestauran t
A gas station
A rest area on thehighway
The one facil ityprefer to stop atwhile traveling
Facili ties stop atwhile traveling
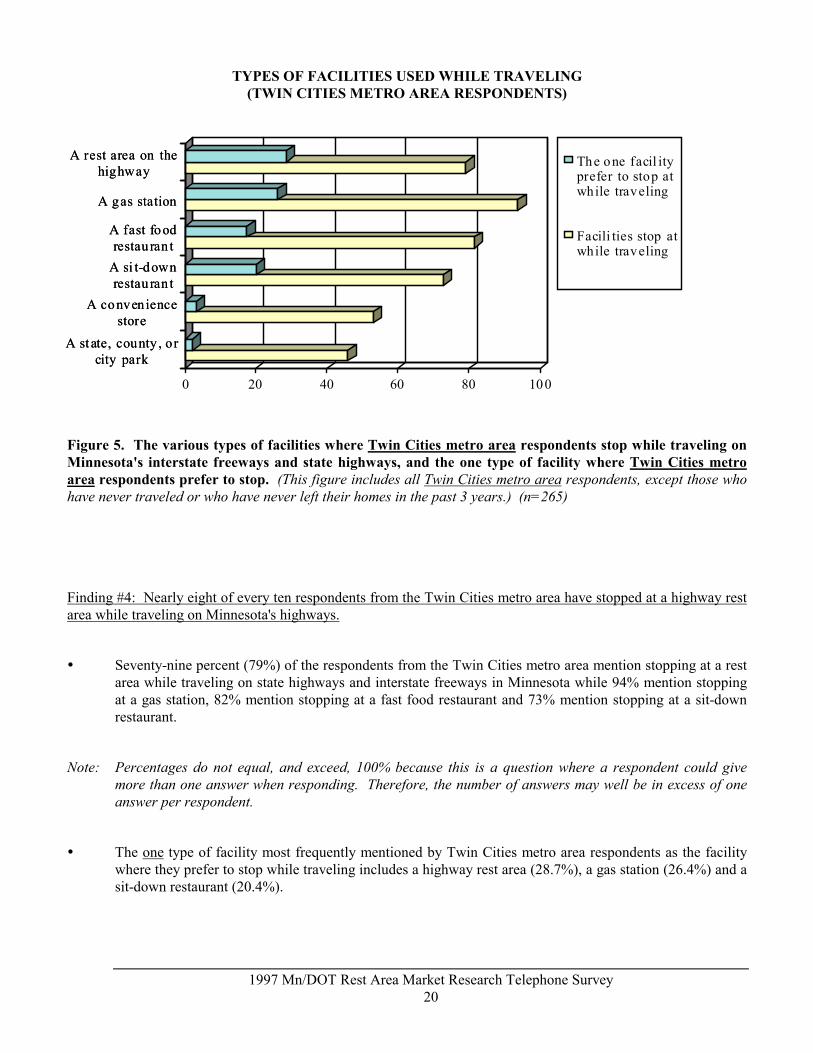
Figure 5. The various types of facilities where Twin Cities metro area respondents stop while traveling onMinnesota's interstate freeways and state highways, and the one type of facility where Twin Cities metroarea respondents prefer to stop. (This figure includes all Twin Cities metro area respondents, except those whohave never traveled or who have never left their homes in the past 3 years.) (n=265)
Finding #4: Nearly eight of every ten respondents from the Twin Cities metro area have stopped at a highway restarea while traveling on Minnesota's highways.
Seventy-nine percent (79%) of the respondents from the Twin Cities metro area mention stopping at a restarea while traveling on state highways and interstate freeways in Minnesota while 94% mention stoppingat a gas station, 82% mention stopping at a fast food restaurant and 73% mention stopping at a sit-downrestaurant.
Note: Percentages do not equal, and exceed, 100% because this is a question where a respondent could givemore than one answer when responding. Therefore, the number of answers may well be in excess of oneanswer per respondent.
The one type of facility most frequently mentioned by Twin Cities metro area respondents as the facilitywhere they prefer to stop while traveling includes a highway rest area (28.7%), a gas station (26.4%) and asit-down restaurant (20.4%).
1997 Mn/DOT Rest Area Market Research Telephone Survey21
TYPES OF FACILITIES USED WHILE TRAVELING(GREATER MINNESOTA RESPONDENTS)
A state, county, orcity park
A conveniencestore
A sit-downrestaurant
A fast foodrestaurant
A gas station
A rest area on thehighway
0 20 40 60 80 100
A state, county, orcity park
A conveniencestore
A sit-downrestaurant
A fast foodrestaurant
A gas station
A rest area on thehighway
The one facilityprefer to stop atwhile traveling
Facili ties stop atwhile traveling
Figure 6. The various types of facilities where respondents from Greater Minnesota prefer to stop whiletraveling on Minnesota's interstate freeways and state highways, and the one type of facility where GreaterMinnesota respondents prefer to stop. (This figure includes all Greater Minnesota respondents, except thosewho have never traveled or who have never left their homes in the past 3 years.) (n=231)
Finding #5: Over half of the respondents from Greater Minnesota have stopped at a highway rest area whiletraveling on Minnesota's highways and interstate freeways.
The largest proportion of respondents from Greater Minnesota have stopped at gas stations (88.7%), fastfood restaurants (65.4%), highway rest areas (58.9%) and sit-down restaurants (57.1%) while traveling onMinnesota's state highways and interstate freeways.
Note: Percentages do not equal, and exceed, 100% because this is a question where a respondent couldgive more than one answer when responding. Therefore, the number of answers may well be in excess ofone answer per respondent.
The one type of facility most frequently mentioned by Greater Minnesota respondents as the one wherethey prefer to stop while traveling includes a gas station (30.7%) a highway rest area (19.0%), a fast foodrestaurant (17.7%) and a sit-down restaurant (14.3%).
1997 Mn/DOT Rest Area Market Research Telephone Survey22
REASONS FOR NOT USING A REST AREA
PercentDon't travel that far/travel only a couple of hours/drive straight through/etc. 47.9%Have no need, purpose or reason to stop there/don't take the time/etc. 43.2Rather stop at a gas station or restaurant/can use bathrooms there/etc. 28.8Safety reasons/won't stop if traveling alone/etc. 8.9Not enough rest areas on the road/not on the roads traveled/etc. 7.5Other comments. 4.8
Figure 7. Reasons respondents do not use highway rest areas in Minnesota. (This figure includes respondentswho do not use highway rest areas while traveling and those who have never traveled or never left their homes inthe past 3 years. Percentages do not equal 100% due to multiple answers.) (n=146)
Finding #6: Thirty percent of the respondents in the telephone survey (146) who travel on Minnesota statehighways and interstate freeways do not use highway rest areas.
One hundred forty-six (146) respondents mention that they do not stop at rest areas while travelingMinnesota's state highways and interstate freeways. Sixty-three (63) of these respondents (43.2% of the146) mention they have no need or reason to stop at Minnesota's highway rest areas; 42 respondents(28.8% of the 146) prefer to stop at a gas station or restaurant.
Finding #7: Nearly half of the respondents who do not use highway rest areas do not travel far enough to need tostop there.
When asked their reasons for not stopping at rest areas in the State of Minnesota, 70 respondents (47.9%of the 146 who do not stop) mention not traveling far enough to need to stop or say they prefer to drivestraight through to their destination.
1997 Mn/DOT Rest Area Market Research Telephone Survey23
TYPE OF VEHICLE MOST OFTEN USED WHEN STOPPING ATA REST AREA
63.7%
32.0%0.6%
1.4%
1.7%0.6%
Car
Pick-up o r v an
RV
Mo torcycle
Semi-tracto r trailer
Som e o ther typ e o fco mm ercial truck
Figure 8. The one type of vehicle in which respondents most often travel when stopping at a highway restarea in Minnesota. (This figure includes respondents who use state highway rest areas while traveling.) (n=350)
Finding #8: Users of rest areas in Minnesota are most frequently driving cars.
Among the 350 respondents who are users of Minnesota's highway rest areas, nearly 64% travel in a carwhile stopping at a Minnesota rest area, 32% drive pick-ups or vans most often when stopping at rest areasin Minnesota and slightly more than 4% are driving other types of vehicles when they stop at a rest area inMinnesota.
1997 Mn/DOT Rest Area Market Research Telephone Survey24
TIMES OF DAY WHEN STOPPED AT A REST AREA
4:0 0 a.m . t o 8:0 0 a.m.
Mid nig ht to 4:0 0 a.m .
9:0 0 p.m . to m id nig ht
5:0 0 p.m . to 9 :00 p.m .
No on to 5 :00 p .m.
8:0 0 a.m . t o no on
0 10 20 30 40 50 60 70
4:0 0 a.m . t o 8:0 0 a.m.
Mid nig ht to 4:0 0 a.m .
9:0 0 p.m . to m id nig ht
5:0 0 p.m . to 9 :00 p.m .
No on to 5 :00 p .m.
8:0 0 a.m . t o no on
Figure 9. Times of the day or night respondents typically stop at a highway rest area in Minnesota. (Thisfigure includes respondents who use state highway rest areas while traveling.) (n=350)
Finding #9: Minnesota's rest areas are used most during the afternoon.
When asked which times of the day or night they typically stop at a rest area in Minnesota, 243 of the 350rest area users (69.4%) mention stopping at a rest area between the hours of noon and 5:00 p.m. Anadditional 152 users (43.4%) typically stop between the hours of 8:00 a.m. to noon while 120 rest areausers (34.3%) stop between 5:00 p.m. and 9:00 p.m. Fewer than 15% of rest area users stop between thehours of 9:00 p.m. and 8:00 a.m.
Note: Percentages do not equal, and exceed, 100% because this is a question where a respondent could givemore than one answer when responding. Therefore, the number of answers may well be in excess of oneanswer per respondent.
1997 Mn/DOT Rest Area Market Research Telephone Survey25
TIMES OF DAY WHEN STOPPED AT A REST AREA(TWIN CITIES AREA VERSUS GREATER MINNESOTA RESPONDENTS)
4:00 a.m . t o 8:00 a.m.
Midnight to 4:00 a.m .
9:0 0 p.m . to m idnight
5:0 0 p.m . to 9 :00 p.m .
Noon to 5 :00 p .m.
8:00 a.m . t o noon
0 10 20 30 40 50 60 70 80
4:00 a.m . t o 8:00 a.m.
Midnight to 4:00 a.m .
9:0 0 p.m . to m idnight
5:0 0 p.m . to 9 :00 p.m .
Noon to 5 :00 p .m.
8:00 a.m . t o noon
Metro area (n= 211) Greater M inneso ta (n=139)
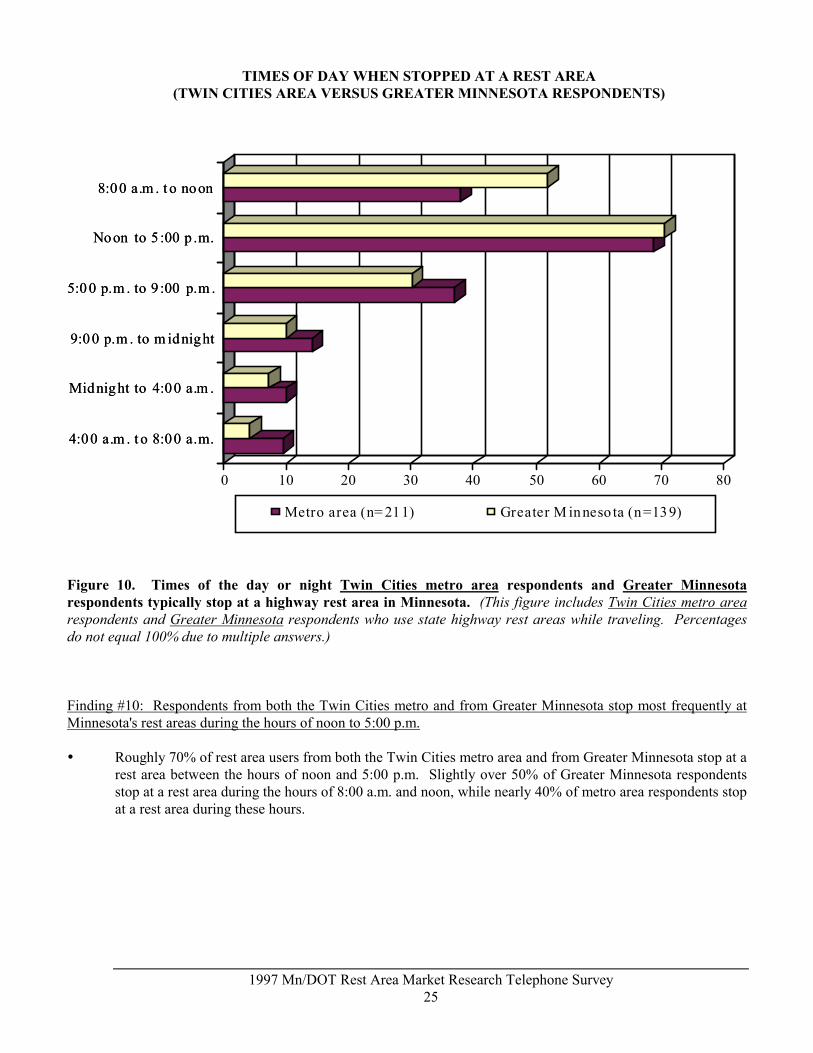
Figure 10. Times of the day or night Twin Cities metro area respondents and Greater Minnesotarespondents typically stop at a highway rest area in Minnesota. (This figure includes Twin Cities metro arearespondents and Greater Minnesota respondents who use state highway rest areas while traveling. Percentagesdo not equal 100% due to multiple answers.)
Finding #10: Respondents from both the Twin Cities metro and from Greater Minnesota stop most frequently atMinnesota's rest areas during the hours of noon to 5:00 p.m.
Roughly 70% of rest area users from both the Twin Cities metro area and from Greater Minnesota stop at arest area between the hours of noon and 5:00 p.m. Slightly over 50% of Greater Minnesota respondentsstop at a rest area during the hours of 8:00 a.m. and noon, while nearly 40% of metro area respondents stopat a rest area during these hours.
1997 Mn/DOT Rest Area Market Research Telephone Survey26
REASONS FOR STOPPING AT A REST AREA
0 10 20 30 40 50 60 70 80 90 100
Let children play
Vending machines
Tourist information
Rest or relax
Change drivers
Check or inspect vehicle
Eat a snack or meal
Get a drink of water
Walk or exercise
Use the restrooms
Primary reason for stopping
Most frequently mentioned reasons for stopping
Figure 11. The most frequently mentioned reasons by respondents for stopping at a highway rest area inMinnesota, and the one primary reason for stopping. (This figure includes respondents who use state highwayrest areas while traveling.) (n=350)
1997 Mn/DOT Rest Area Market Research Telephone Survey27
Finding #11: Many rest area users decide to stop at a Minnesota rest area for more reasons than to just use therestrooms.
When rest area users were asked their reasons for stopping at a rest area, the most frequently mentionedreason for stopping is, not surprisingly, to use the restroom (98.3%). Other frequently mentioned reasonsfor stopping are to walk or exercise (63.1%), to get a drink of water (56.9%) or to eat a snack or meal(46.9%).
Fewer than 20% of rest area users mention stopping to exercise a pet, sleep, change clothes or do paperwork.
Note: Percentages do not equal, and exceed, 100% because this is a question where a respondent couldgive more than one answer when responding. Therefore, the number of answers may well be in excess ofone answer per respondent.
Finding #12: Nevertheless, the primary reason most respondents mention for stopping at a rest area is to use therestrooms.
Rest area users were asked their primary reason for stopping at a rest area. The most frequently mentionedreason for stopping at a rest area is to use the restroom (78.9%), followed by to rest or relax (5.9%) or towalk or exercise (5.3%).
Finding #13: The primary reason some respondents give for stopping at a rest area concerns safety matters.
Thirty-three (33) respondents, or 9.4% of all rest area users, mention a safety reason for stopping at aMinnesota safety rest area. Nineteen (19), or 5.4%, of rest area users say they stop to rest or relax, 9 saythey stop to change drivers, 3 stop to check or inspect their vehicle and 2 stop to sleep.
1997 Mn/DOT Rest Area Market Research Telephone Survey28
REASONS FOR STOPPING AT A REST AREA(TWIN CITIES AREA RESPONDENTS)
L e t c h ild r en p la y
R e st or re la x
T o ur is t in fo rm a tion
V e n din g m a ch in es
C he c k o r in sp ec t v e h ic le
C ha n ge dr iv er s
E a t a sna c k o r m e a l
G e t a dr ink of w at er
W a lk o r e xe r c ise
U s e th e re s tr o om s
0 20 40 60 80 10 0
L e t c h ild r en p la y
R e st or re la x
T o ur is t in fo rm a tion
V e n din g m a ch in es
C he c k o r in sp ec t v e h ic le
C ha n ge dr iv er s
E a t a sna c k o r m e a l
G e t a dr ink of w at er
W a lk o r e xe r c ise
U s e th e re s tr o om s
P rim a ry re a so n f or s to pp ing
M o st f re q ue nt ly m e n tion e d r e as on s fo r s top p in g
Figure 12. The most frequently mentioned reasons by Twin Cities metro area respondents for stopping at ahighway rest area in Minnesota, and the one primary reason for stopping. (This figure includes Twin Citiesmetro area respondents who use state highway rest areas while traveling. Percentages do not equal 100% due tomultiple answers for "reasons for stopping.") (n=211)
Finding #14: Respondents from the Twin Cities metro area also mention stopping at Minnesota's rest areas for avariety of reasons.
Nearly all Twin Cities metro area respondents (99.1%) mention using the restroom as a reason for stoppingat a Minnesota safety rest area. Over half of these respondents also mention stopping to walk or exercise(65.9%), get a drink of water (58.3%) and eat a snack or meal (51.2%).
Along with the 77.0% of Twin Cities area respondents who say their use of a restroom is the one primaryreason for stopping at a rest area in Minnesota, 7.1% of the Twin Cities area respondents say they stop towalk or exercise, 6.1% say they stop to rest or relax and 4.1% stop to change drivers.
1997 Mn/DOT Rest Area Market Research Telephone Survey29
REASONS FOR STOPPING AT A REST AREA(GREATER MINNESOTA RESPONDENTS)
W e a the r a n dco ns tru c tion inf or m at ion
Ve n din g m a ch in es
C ha n ge dr iv er s
To ur ist in fo rm a tion
Ea t a sna c k o r m e a l
R e st or re la x
C he c k o r in sp ec t v e hic le
Ge t a dr ink of w at er
W a lk o r e xe r c ise
Us e th e re str o om s
0 20 40 60 80 10 0
W e a the r a n dco ns tru c tion inf or m at ion
Ve n din g m a ch in es
C ha n ge dr iv er s
To ur ist in fo rm a tion
Ea t a sna c k o r m e a l
R e st or re la x
C he c k o r in sp ec t v e hic le
Ge t a dr ink of w at er
W a lk o r e xe r c ise
Us e th e re str o om s
P rim a ry re a so n f or sto pp ing
M o st f re q ue nt ly m e n tion e d r e as on s fo r s top pin g
Figure 13. The most frequently mentioned reasons by Greater Minnesota respondents for stopping at ahighway rest area in Minnesota, and the one primary reason for stopping. (This figure includes GreaterMinnesota respondents who use state highway rest areas while traveling. Percentages do not equal 100% due tomultiple answers for "reasons for stopping.") (n=139)
Finding #15: Reasons why respondents from Greater Minnesota stop at rest areas in Minnesota closely parallel thereasons given by respondents from the Twin Cities metro area.
When Greater Minnesota respondents were asked their reasons for stopping at a rest area, the mostfrequently mentioned reason for stopping is to use the restroom (97.1%). Other frequently mentionedreasons for stopping are to walk or exercise (59.0%), to get a drink of water (54.7%) or to check or inspecttheir vehicle (46.0%).
When asked their primary reason for stopping at a rest area, respondents from Greater Minnesota mostfrequently mention stopping to use the restroom (81.7%).
1997 Mn/DOT Rest Area Market Research Telephone Survey30
FACILITIES MOST FREQUENTLY USED AT REST AREAS
Th e w alk ing pa ths
Th e p icnic f acil ities
Th e to ur ist in fo rm atio n
Th e b rochu re rack
Th e v end ing machin es
Th e m aps o n d isplay
Th e r ecyclin greceptac les
Th e d r ink ing fo un tai n
Th e tr a sh receptac les
Th e restroo ms
0 20 40 60 80 10 0
Th e w alk ing pa ths
Th e p icnic f acil ities
Th e to ur ist in fo rm atio n
Th e b rochu re rack
Th e v end ing machin es
Th e m aps o n d isplay
Th e r ecyclin greceptac les
Th e d r ink ing fo un tai n
Th e tr a sh receptac les
Th e restroo ms
Figure 14. The most frequently mentioned facilities typically used by respondents when stopped at ahighway rest area in Minnesota. (This figure includes respondents who use state highway rest areas whiletraveling.) (n=350)
Finding #16: Rest area users who were asked which facilities they typically use once they stop at a Minnesota restarea, most often mention using the restrooms (98.6%), the trash receptacles (84.6%), the drinking fountain oroutdoor water faucet (73.1%) and the recycling receptacles (66.0%).
Less frequently mentioned facilities used at rest areas include picnic facilities (38.0%), the walking paths(34.3%), information about weather, road conditions and construction (32.6%), the telephone (27.1%), thepet walking areas (16.9%), the children's play grounds (16.3%) and the diaper changing tables (5.4%).
Note: Percentages do not equal, and exceed, 100% because this is a question where a respondent could givemore than one answer when responding. Therefore, the number of answers may well be in excess of oneanswer per respondent.
1997 Mn/DOT Rest Area Market Research Telephone Survey31
ADDITIONAL FACILITIES OR SERVICES NEEDED AT REST AREAS
Comments on additional facilities or services needed PercentThe rest areas need attendants on duty/security on the premises/ state trooper or armedpoliceman visible in the evenings/etc. 5.4%The rest areas need more variety in the vending machines/more variety of vendingmachines/etc. 5.1The rest areas need to improve on their restroom facilities and amenities/etc.
4.9The rest areas could be bigger/more of them/etc. 2.6The rest areas need a gas station/restaurant/fast food/etc. 2.3The rest areas need more lighting/more lighting in parking lot/etc. 2.0The rest areas need a place for people to sleep/take a nap/etc. 2.0The rest areas need more pay phones/etc. 1.7
Miscellaneous comments on additional facilities or services PercentThe rest areas are fine/adequate/okay/etc. 11.4%The rest areas have everything you need/all the facilities and services are there/etc.
8.3The rest areas are great/good/the best/etc. 3.7All you require is a bathroom/too many facilities there already/ nothing more/etc.
2.9The rest areas are clean/sanitary/restrooms are clean/etc. 2.3No/None/Nothing. 32.3Can't think of any/Never thought about it. 14.6Don't know/Not sure. 6.6
Figure 15. Additional facilities or services respondents would like to see provided at the highway rest areasin Minnesota. (This figure includes respondents who use state highway rest areas while traveling.) (n=350)
Finding #17: For the most part, rest area users do not want any additional facilities or services provided at the restareas in Minnesota.
Rest area users who were asked about additional facilities or services they would like to see provided at therest areas in Minnesota can think of very few additions. Over half of the rest area users (53.5%) cannotthink of any additional facilities or services they would like to see provided at the rest areas. Another11.4% of rest area users mention that the rest areas are fine as they are, and 8.3% indicate the rest areasalready have everything rest area users need.
Additional facilities or services mentioned as items that users at rest areas would like to see providedinclude having security on the premises (5.4%), needing more variety in the vending machines (5.1%) andimproving the restroom facilities and amenities (4.9%).
Note: Percentages do not equal, and exceed, 100% because this is a question where a respondent could givemore than one answer when responding. Therefore, the number of answers may well be in excess of oneanswer per respondent.
1997 Mn/DOT Rest Area Market Research Telephone Survey32
MEAN "IMPORTANCE" RATINGS
Well maintained grounds(n=350)
Adequate parking forlarge trucks (n=348)
Separate parking area forlarge trucks (n=349)
Recycling receptacles(n=350)
Trash receptacles(n=350)
Well lit parking areas(n=349)
Access to emergencyphones (n=347)
Well lit buildings andrestrooms (n=350)
Well ventilatedrestrooms (n=350)
Clean restrooms (n=350)
0 2 4 6 8 10
Well maintained grounds(n=350)
Adequate parking forlarge trucks (n=348)
Separate parking area forlarge trucks (n=349)
Recycling receptacles(n=350)
Trash receptacles(n=350)
Well lit parking areas(n=349)
Access to emergencyphones (n=347)
Well lit buildings andrestrooms (n=350)
Well ventilatedrestrooms (n=350)
Clean restrooms (n=350)
Figure 16. Mean (average) "importance" ratings for Minnesota highway rest area characteristics. (Thisfigure includes respondents who use state highway rest areas while traveling.)
Finding #18: Above all else, rest area users want clean restrooms at Minnesota's rest areas.
Respondents were read a list of characteristics about rest areas and were asked to rate the importance ofeach characteristic when thinking about Minnesota's highway rest areas. They were asked to use a scale of"extremely important" to "not at all important" for rating each characteristic. Minnesotans, in particular,want rest areas with clean (9.59), well ventilated (9.41) and well lit (9.34) restrooms. (A rating of 10.0 =extremely important; a rating of 1.0 = not at all important.) Other highly important characteristics that restarea users want at Minnesota's rest areas include access to emergency phones (9.14), well lit parking areas(9.05) and trash receptacles (8.95).
Rest area characteristics that are rated as less important by rest area users include enough pay phones(6.58), attractive buildings (6.52), a picnic area (6.34), vending machines (6.23), a children's play area(6.08) and a pet walking area (5.41).
1997 Mn/DOT Rest Area Market Research Telephone Survey33
Note: While all the facilities were rated above average on importance (highest facility rating = 9.59; lowestfacility rating = 5.41), some facilities were rated more important than others. A facility that receives anaverage rating of an 8.00 or 9.00 can be considered as quite important while a facility receiving anaverage score of a 6.00 or 7.00 is of lesser importance, but is, nevertheless, still important. A rating of5.00 or lower would indicate that a facility is of little or no importance to the respondents.
1997 Mn/DOT Rest Area Market Research Telephone Survey34
MEAN "IMPORTANCE" RATINGS(DIFFERENCES BY GENDER)
Well maintained grounds
Adequate parking forlarge trucks
Separate parking area forlarge trucks
Recycling receptacles
Trash receptacles
Well lit parking areas
Access to emergencyphones
Well lit buildings andrestrooms
Well ventilatedrestrooms
Clean restrooms
0 2 4 6 8 10
Well maintained grounds
Adequate parking forlarge trucks
Separate parking area forlarge trucks
Recycling receptacles
Trash receptacles
Well lit parking areas
Access to emergencyphones
Well lit buildings andrestrooms
Well ventilatedrestrooms
Clean restrooms
Women
Men
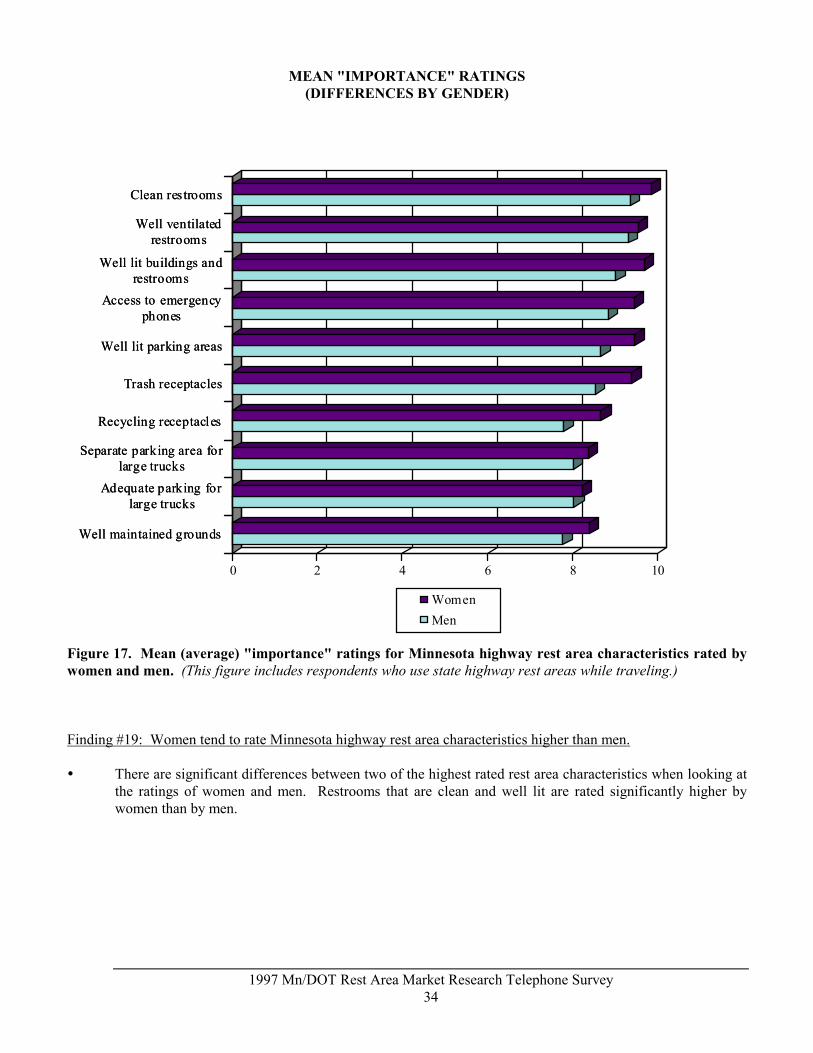
Figure 17. Mean (average) "importance" ratings for Minnesota highway rest area characteristics rated bywomen and men. (This figure includes respondents who use state highway rest areas while traveling.)
Finding #19: Women tend to rate Minnesota highway rest area characteristics higher than men.
There are significant differences between two of the highest rated rest area characteristics when looking atthe ratings of women and men. Restrooms that are clean and well lit are rated significantly higher bywomen than by men.
1997 Mn/DOT Rest Area Market Research Telephone Survey35
MEAN "PERFORMANCE" RATINGS
R e c y c l i n g r ec e p t a cl es(n = 3 2 0 )
A p i c n i c a re a ( n = 3 2 8 )
A t t ra c t i v e b u i l d i n g s(n = 3 4 6 )
W e l l l i t p a r k i n g a re a(n = 3 2 9 )
M a p s o n d i s p l a y t h ati n c l u d e d i s t an c e s (n = 3 3 4 )
W e l l l i t b u i l d i n g s a n dre s t r o o m s (n = 3 4 1 )
W e l l m a i n t a i n e d g ro u n d s(n = 3 4 8 )
A d e q u a t e p a rk i n g fo r l a r g et ru c k s ( n = 3 3 5 )
S e p a r at e p ar k i n g a r e a fo rl ar g e t r u c k s ( n = 3 4 2 )
T r a s h r e c e p t a c l e s ( n = 3 4 8 )
0 1 2 3 4 5 6 7 8 9
R e c y c l i n g r ec e p t a cl es(n = 3 2 0 )
A p i c n i c a re a ( n = 3 2 8 )
A t t ra c t i v e b u i l d i n g s(n = 3 4 6 )
W e l l l i t p a r k i n g a re a(n = 3 2 9 )
M a p s o n d i s p l a y t h ati n c l u d e d i s t an c e s (n = 3 3 4 )
W e l l l i t b u i l d i n g s a n dre s t r o o m s (n = 3 4 1 )
W e l l m a i n t a i n e d g ro u n d s(n = 3 4 8 )
A d e q u a t e p a rk i n g fo r l a r g et ru c k s ( n = 3 3 5 )
S e p a r at e p ar k i n g a r e a fo rl ar g e t r u c k s ( n = 3 4 2 )
T r a s h r e c e p t a c l e s ( n = 3 4 8 )
Figure 18. Mean (average) "performance" ratings for State of Minnesota regarding state highway rest areacharacteristics. (This figure includes respondents who use state highway rest areas while traveling.)
Finding #20: Overall, outside-the-building "performance" characteristics (such as providing trash receptacles,separate and adequate parking for large trucks, etc.) of Minnesota's rest areas are rated higher by rest area usersthan are inside-the-building "performance" characteristics (such as providing vending machines, touristinformation, directions, etc.).
Upon being read the same list of characteristics a second time, rest area users were to rate how well theState of Minnesota is doing in providing each of the characteristics. (A rating of 10.0 = doing an excellentjob; a rating of 1.0 = not doing well at all.) The performance characteristics with the highest ratings --where Minnesota is doing well -- include providing trash receptacles (8.90), having a separate parking areafor large trucks (8.74), having an adequate amount of parking space for large trucks (8.65) and having wellmaintained grounds (8.58).
The characteristics receiving the lowest "performance ratings" for the State of Minnesota includeproviding vending machines (7.77), providing tourist information about lodging, restaurants and otherrecreational activities (7.72), providing directions (7.68), having access to emergency phones (7.55),providing information about weather, road conditions and construction (7.13), providing a children's playarea (6.87) and having custodians on duty (6.49).
1997 Mn/DOT Rest Area Market Research Telephone Survey36
COMPARISON OF "IMPORTANCE" & "PERFORMANCE" RATINGSImportancemean score
Performancemean score
PerformanceDifference
Clean restrooms9.59
(n=350)8.11
(n=349) -1.48 *
Well ventilated restrooms9.41
(n=350)8.13
(n=344) -1.28 *
Well lit buildings and restrooms9.34
(n=350)8.50
(n=341) -0.84 *
Access to emergency phones9.14
(n=347)7.55
(n=285) -1.59 *
Well lit parking areas9.05
(n=349)8.23
(n=329) -0.82 *
Trash receptacles8.95
(n=350)8.90
(n=348) -0.05
Recycling receptacles8.22
(n=350)8.16
(n=320) -0.06A separate parking area for semis, buses, other large trucks, and vehicles pulling trailers
8.18(n=349)
8.74(n=342) +0.56 *
An adequate amount of parking space for semis and other large trucks
8.13(n=348)
8.65(n=335) +0.52 *
Well maintained grounds8.06
(n=350)8.58
(n=348) +0.52 *
Maps on display that include distances7.58
(n=349)8.31
(n=334) +0.73 *Information about weather, road conditions and construction
7.52(n=350)
7.13(n=296) -0.39 *
Directions7.28
(n=345)7.68
(n=308) +0.40
Custodians on duty6.91
(n=349)6.49
(n=306) -0.42 *Tourist information about lodging, restaurants and other recreational activities
6.59(n=350)
7.72(n=312) +1.13 *
Enough pay telephones6.58
(n=346)8.13
(n=322) +1.55 *
Attractive buildings6.52
(n=349)8.21
(n=346) +1.69 *
A picnic area6.34
(n=350)8.21
(n=328) +1.87 *
Vending machines6.23
(n=349)7.77
(n=322) +1.54 *
A children's play area6.08
(n=345)6.87
(n=266) +0.79 *
A pet walking area5.41
(n=343)8.14
(n=283) +2.73 *
* = Significant difference at 95% confidence interval.Figure 19. Comparison of scores between "importance" rating and "performance" rating forcharacteristics of highway rest areas in Minnesota. (This table includes respondents who rated these questionsand who use state highway rest areas while traveling.)
1997 Mn/DOT Rest Area Market Research Telephone Survey37
Finding #21. When considering how respondents rate the "importance" of certain characteristics related tohighway rest areas in Minnesota and how these same respondents rate Minnesota's "performance" on the samecharacteristics, there are areas where the State has an opportunity to improve, areas where the State is exceedingexpectations and areas where performance equals importance.
Figure 19 on the previous page reports the differences between the mean "importance" characteristicscores and the mean "performance" characteristic scores. Some of the characteristics with the largestnegative differences -- suggesting that respondents believe the importance of the characteristics outscoresthe performance by the State of Minnesota in providing the characteristics -- are access to emergencyphones (-1.59), clean restrooms (-1.48), well ventilated restrooms (-1.28) and well lit buildings andrestrooms (-0.84).
Some of the characteristics with the largest positive differences, where performance outscores importance -- suggesting respondents believe the performance by the State of Minnesota in providing the characteristicsoutscores the importance of the characteristics -- are a pet walking area (+2.73), a picnic area (+1.87) andattractive buildings (+1.69).
Areas where respondents rate importance characteristics and the State's performance closely includeproviding directions (+0.40), trash receptacles (-0.05), recycling receptacles (-0.06), information aboutweather, road conditions and construction (-0.39) and having custodians on duty (-0.42).
1997 Mn/DOT Rest Area Market Research Telephone Survey38
TIMES TO AVOID STOPPING AT A REST AREA
4:00 a.m. to 8:00 a.m.
Midnight to 4:00 a.m.
9:00 p.m. to midnight
5:00 p.m. to 9:00 p.m.
Noon to 5:00 p.m.
8:00 a.m. to noon
0 10 20 30 40 50 60 70 80 90
4:00 a.m. to 8:00 a.m.
Midnight to 4:00 a.m.
9:00 p.m. to midnight
5:00 p.m. to 9:00 p.m.
Noon to 5:00 p.m.
8:00 a.m. to noon
Figure 20. Times of the day or night when a respondent wouldn't stop at a highway rest area in Minnesota.(This figure includes respondents who use highway rest areas while traveling, and those who wouldn't stop at arest area at anytime.) (n=150)
Finding #22: Over 40% of the rest area users would not stop at a highway rest area in Minnesota during certaintimes of the day or night.
The 350 rest area users were asked if there was any time of the day or night when they would not stop at arest area in Minnesota. One hundred fifty (150) rest area users (42.9% of the 350) mention that there aretimes when they do not stop. Of these 150, 130 (86.7%) do not stop from midnight to 4:00 a.m. Another99 (66.0%) will not stop from 9:00 p.m. to midnight while 87 (58.0%) will not stop from 4:00 a.m. to 8:00a.m.
Note: Percentages do not equal, and exceed, 100% because this is a question where a respondent couldgive more than one answer when responding. Therefore, the number of answers may well be in excess ofone answer per respondent.
1997 Mn/DOT Rest Area Market Research Telephone Survey39
TIMES TO AVOID STOPPING AT A REST AREA(DIFFERENCES BY GENDER)
4:00 a.m. to 8:00 a.m.
Midnight to 4:00 a.m.
9:00 p.m. to midnight
5:00 p.m. to 9:00 p.m.
Noon to 5:00 p.m.
8:00 a.m. to noon
0 10 20 30 40 50 60 70 80 90
4:00 a.m. to 8:00 a.m.
Midnight to 4:00 a.m.
9:00 p.m. to midnight
5:00 p.m. to 9:00 p.m.
Noon to 5:00 p.m.
8:00 a.m. to noon
Women (n=103)Men (n=47)
Figure 21. Times of the day or night when women and men wouldn't stop at a highway rest area inMinnesota. (This figure includes women and men who use highway rest areas while traveling, and those whowouldn't stop at a rest area at anytime. Percentages do not equal 100% due to multiple answers.)
Finding #23: More women than men would not stop at a highway rest area in Minnesota in the earlier evening andearly in the morning.
One hundred fifty (150) rest area users answered there were times of the day or night when they would notstop at a rest area in Minnesota. One hundred three (103) respondents, or 68.7% of the 150, were womenand 47 (31.3%) were men. There is a significant difference between women and men as to when theywould not stop at a rest area in Minnesota. More women than men would not stop at a Minnesota rest areabetween the hours of 9:00 p.m. to midnight and from 4:00 a.m. to 8:00 a.m.
1997 Mn/DOT Rest Area Market Research Telephone Survey40
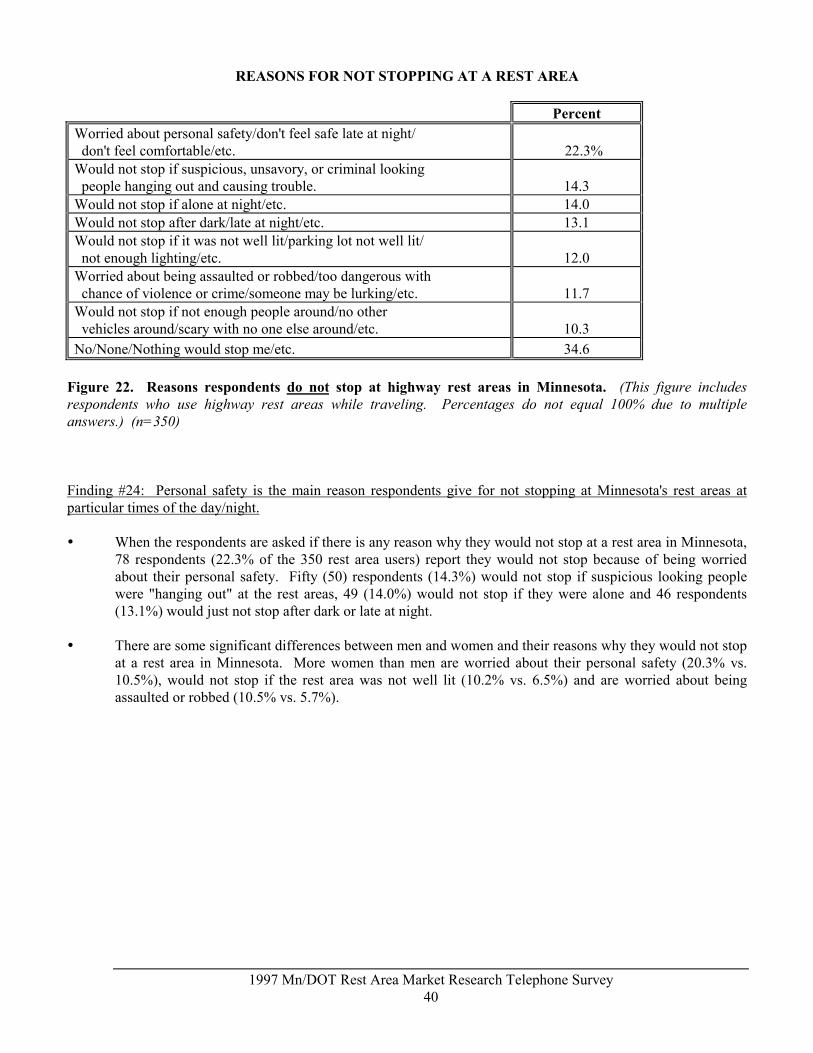
REASONS FOR NOT STOPPING AT A REST AREA
PercentWorried about personal safety/don't feel safe late at night/ don't feel comfortable/etc. 22.3%Would not stop if suspicious, unsavory, or criminal looking people hanging out and causing trouble. 14.3Would not stop if alone at night/etc. 14.0Would not stop after dark/late at night/etc. 13.1Would not stop if it was not well lit/parking lot not well lit/ not enough lighting/etc. 12.0Worried about being assaulted or robbed/too dangerous with chance of violence or crime/someone may be lurking/etc. 11.7Would not stop if not enough people around/no other vehicles around/scary with no one else around/etc. 10.3
No/None/Nothing would stop me/etc. 34.6
Figure 22. Reasons respondents do not stop at highway rest areas in Minnesota. (This figure includesrespondents who use highway rest areas while traveling. Percentages do not equal 100% due to multipleanswers.) (n=350)
Finding #24: Personal safety is the main reason respondents give for not stopping at Minnesota's rest areas atparticular times of the day/night.
When the respondents are asked if there is any reason why they would not stop at a rest area in Minnesota,78 respondents (22.3% of the 350 rest area users) report they would not stop because of being worriedabout their personal safety. Fifty (50) respondents (14.3%) would not stop if suspicious looking peoplewere "hanging out" at the rest areas, 49 (14.0%) would not stop if they were alone and 46 respondents(13.1%) would just not stop after dark or late at night.
There are some significant differences between men and women and their reasons why they would not stopat a rest area in Minnesota. More women than men are worried about their personal safety (20.3% vs.10.5%), would not stop if the rest area was not well lit (10.2% vs. 6.5%) and are worried about beingassaulted or robbed (10.5% vs. 5.7%).
1997 Mn/DOT Rest Area Market Research Telephone Survey41
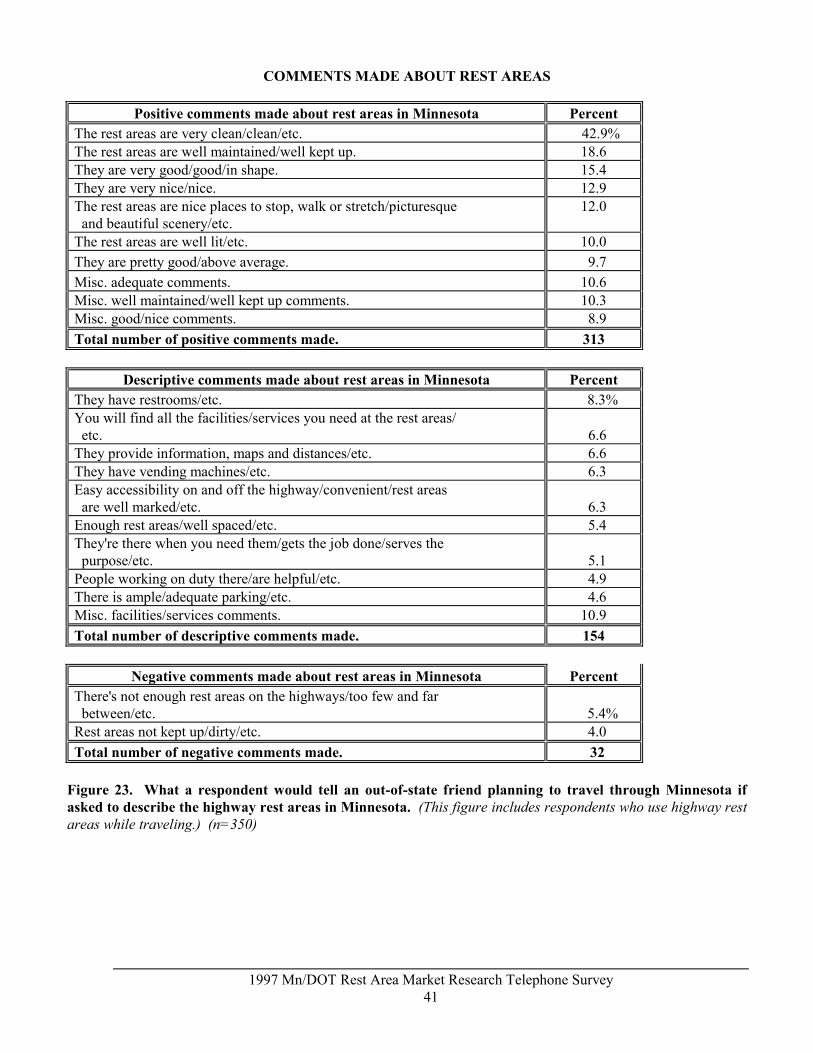
COMMENTS MADE ABOUT REST AREAS
Positive comments made about rest areas in Minnesota PercentThe rest areas are very clean/clean/etc. 42.9%The rest areas are well maintained/well kept up. 18.6They are very good/good/in shape. 15.4They are very nice/nice. 12.9The rest areas are nice places to stop, walk or stretch/picturesque and beautiful scenery/etc.
12.0
The rest areas are well lit/etc. 10.0
They are pretty good/above average. 9.7
Misc. adequate comments. 10.6Misc. well maintained/well kept up comments. 10.3Misc. good/nice comments. 8.9
Total number of positive comments made. 313
Descriptive comments made about rest areas in Minnesota PercentThey have restrooms/etc. 8.3%You will find all the facilities/services you need at the rest areas/ etc. 6.6They provide information, maps and distances/etc. 6.6They have vending machines/etc. 6.3Easy accessibility on and off the highway/convenient/rest areas are well marked/etc. 6.3Enough rest areas/well spaced/etc. 5.4They're there when you need them/gets the job done/serves the purpose/etc. 5.1People working on duty there/are helpful/etc. 4.9There is ample/adequate parking/etc. 4.6Misc. facilities/services comments. 10.9
Total number of descriptive comments made. 154
Negative comments made about rest areas in Minnesota PercentThere's not enough rest areas on the highways/too few and far between/etc. 5.4%Rest areas not kept up/dirty/etc. 4.0
Total number of negative comments made. 32
Figure 23. What a respondent would tell an out-of-state friend planning to travel through Minnesota ifasked to describe the highway rest areas in Minnesota. (This figure includes respondents who use highway restareas while traveling.) (n=350)
1997 Mn/DOT Rest Area Market Research Telephone Survey42
Finding #25: Many rest area users would describe Minnesota's highway rest areas as clean, well maintained, ingood shape and a nice place to stop.
When the rest area users (350 respondents) were asked to describe Minnesota's rest areas to an out-of-statefriend planning to travel through Minnesota, most of the comments are positive in nature compared tocomments that are negative (313 positive comments vs. 32 negatives). An additional 154 comments fromrest area users are simply descriptive in nature. Among the positive comments, nearly half of the rest areausers (150 or 42.9%) mention that Minnesota's rest areas are clean, 65 rest area users (18.6%) mention therest areas are well maintained, 54 (15.4%) say the rest areas are in good shape and 45 (12.9%) state the restareas are very nice.
Twenty-three (23) of the 154 respondents (6.6%) who mention something descriptive about Minnesota'srest areas say people will find all the facilities they will need at the rest areas while another 23 respondents(6.6%) say the rest areas provide the traveler with information, maps and distances. Twenty-two (22)respondents (6.3%) mention the rest areas provide vending machines; another 22 respondents say the restareas provide easy accessibility on and off the highway and 19 respondents (5.4%) say there are enoughrest areas, well spaced apart.
Among the negative comments, 19 respondents (5.4%) feel that there are not enough rest areas on thehighways while 14 respondents (4.0%) feel the rest areas are not kept up and are dirty.
Note: Percentages do not equal, and exceed, 100% because this is a question where a respondent couldgive more than one answer when responding. Therefore, the number of answers may well be in excess ofone answer per respondent.
1997 Mn/DOT Rest Area Market Research Telephone Survey43
DESCRIPTIONS OF REST AREAS
Clean
Pleas ing
Firs t rate
Too large
Adequate
Messy
At tractive
Too few in number
Well-main tained
Friendly
Satisfacto ry
Appealing
Com pletely safe
Clean
Pleas ing
Firs t rate
Too large
Adequate
Messy
At tractive
Too few in number
Well-main tained
Friendly
Satisfacto ry
Appealing
Com pletely safe
Com pletely Agree Som ewhat Agree Som ewhat Disagree Com pletely Disagree
Figure 24. Possible descriptions for the highway rest areas in Minnesota. (This figure includes respondentswho use state highway rest areas while traveling.) (n=350)
Finding #26: Overall, respondents are positive toward the rest areas in Minnesota.
Respondents were read a list of possible descriptions of Minnesota's rest areas. They were asked to ratehow much they agreed or disagreed with each description. (A rating of 4.0 = completely agree; a rating of1.0 = completely disagree.) The highest rated descriptions according to ratings from the respondents are:"well maintained," "satisfactory," "clean," "adequate" and "appealing."
1997 Mn/DOT Rest Area Market Research Telephone Survey44
RECOMMENDED CHANGES TO REST AREAS
PercentHave more rest areas/etc. 17.1%Have an attendant/security on duty 24 hours/etc. 16.0Have more/other facilities indoors/etc. 9.1The rest areas to have more/better lighting. 7.1Have cleaner restrooms. 6.9Have more/other facilities outdoors/etc. 6.3
Have more/cleaner amenities in restrooms/etc. 6.0
Nothing/No changes/etc. 34.3
Don't know/Not sure. 9.1
Figure 25. What respondents would change, if they could, about the highway rest areas in Minnesota. (Thisfigure includes respondents who use state highway rest areas while traveling.) (n=350)
Finding #27: When asked what they would change about the highway rest areas in Minnesota, one-third (34.3%)of the respondents mention that there is nothing they would change.
Upon being asked if there was anything they wanted to change about Minnesota's rest areas, 60 rest areausers (17.1% of the 350) state they want more Minnesota rest areas while 56 rest area users (16.0%) wantan attendant on duty 24 hours a day at the rest areas. An additional 32 rest area users (7.1%) wantimproved lighting at the rest areas and 24 (6.9%) want cleaner restrooms. Nearly one-third of the rest areausers (34.3%) note they would not change anything about Minnesota's rest areas.
Note: Percentages do not equal, and exceed, 100% because this is a question where a respondent couldgive more than one answer when responding. Therefore, the number of answers may well be in excess ofone answer per respondent.
1997 Mn/DOT Rest Area Market Research Telephone Survey45
RATING OF MINNESOTA REST AREAS VERSUS OTHER STATES
22.7%
29.9%
39.8%7.2% 0.4% Much better
Somewhat better
About the same
Somewhat worse
Don't know
Figure 26. Respondents' overall rating comparing the highway rest areas in Minnesota to rest areas inother states. (This figure includes respondents who have used Minnesota's highway rest areas while traveling andhave used rest areas in other states in the past 3 years.) (n=264)
Finding #28: Minnesota's rest areas are rated better or at least equal to the rest areas in other states.
Respondents who have stopped to use rest areas in other states were asked to compare those rest areas tothe ones in Minnesota. Over 50% of the respondents (139 from a total of 264) rate Minnesota's rest areasas much or somewhat better than rest areas in other states. One hundred five (105) respondents (39.8%)rate Minnesota's rest areas as being about the same as rest areas in other states. Nineteen (19) respondents(7.2%) rate Minnesota's rest areas as "somewhat worse" than rest areas in other states.
1997 Mn/DOT Rest Area Market Research Telephone Survey46
ACCEPTABILITY OF PUBLIC FUNDING FOR REST AREAS
58.6%
36.0% 1.0%3.6%
0.8% Completely agree
Somewhat agree
Somewhat disagree
Completely disagree
Don't know
Figure 27. How much respondents agree with the statement, "It is perfectly acceptable to use highway taxfunds for the construction and maintenance of Minnesota's rest areas." (This figure includes all respondents.)(n=503)
Finding #29: Most respondents support the use of tax funds for the construction and maintenance of Minnesota'srest areas.
All 503 respondents were asked how much they agreed or disagreed with the statement, "It is perfectlyacceptable to use highway tax funds for the construction and maintenance of Minnesota's rest areas." (Arating of 4.0 = completely agree; a rating of 1.0 = completely disagree.) Two hundred ninety-five (295)respondents (58.6%) completely agree with the statement, and another 181 respondents (36.0%) somewhatagree with this statement. Only 23, or 4.6%, of the respondents either somewhat or completely disagreewith using tax funds to construct and maintain Minnesota's rest areas.
1997 Mn/DOT Rest Area Market Research Telephone Survey47
IMPORTANCE OF REST AREAS TO TRAVELERS
79.7%
16.9%0.6%
2.2%
0.6% Completely agree
Somewhat agree
Somewhat disagree
Completely disagree
Don't know
Figure 28. How much respondents agree with the statement, "Rest areas are important to travelers onMinnesota's state highways and interstate freeways." (This figure includes all respondents.) (n=503)
Finding #30: Eight of every ten respondents in the telephone survey mention that Minnesota's rest areas areimportant to travelers.
Nearly 80% of all respondents (401 in total) completely agree with the statement, "Rest areas are importantto travelers on Minnesota's state highways and interstate freeways." Eighty-five (85) respondents (16.9%)somewhat agree with the statement compared to fewer than 3% (14 respondents) who note thatMinnesota's rest areas are not important to travelers.
1997 Mn/DOT Rest Area Market Research Telephone Survey48
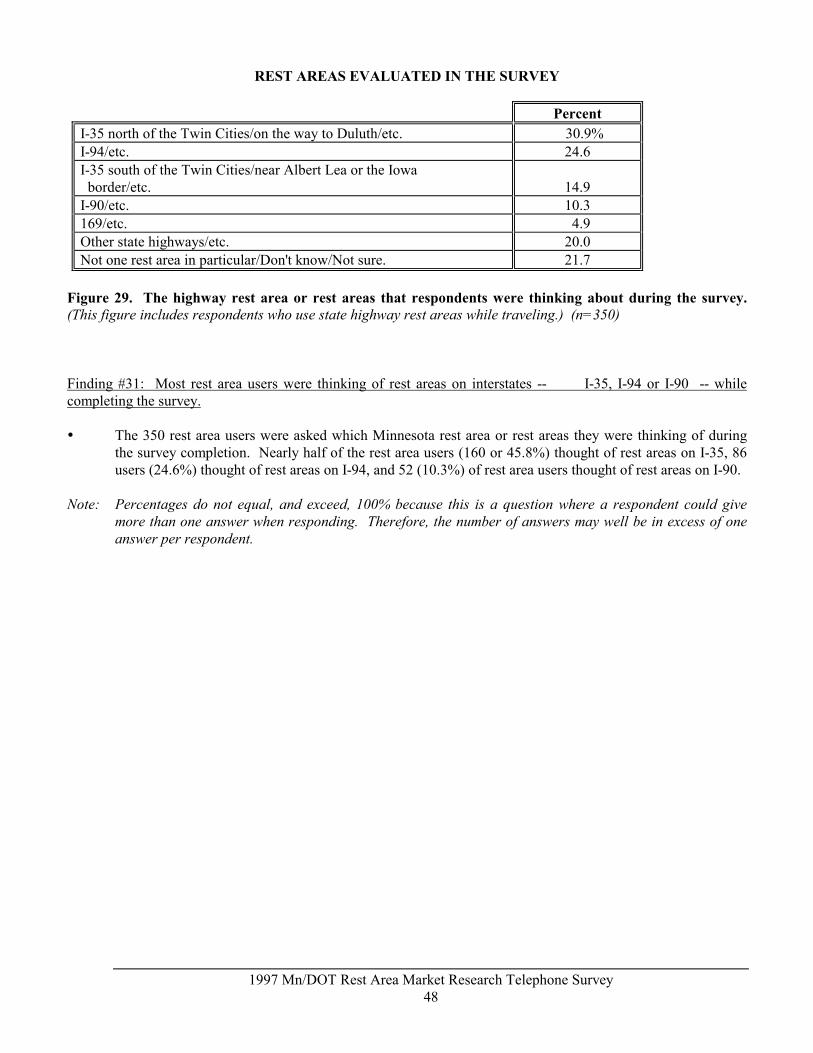
REST AREAS EVALUATED IN THE SURVEY
PercentI-35 north of the Twin Cities/on the way to Duluth/etc. 30.9%I-94/etc. 24.6I-35 south of the Twin Cities/near Albert Lea or the Iowa border/etc. 14.9I-90/etc. 10.3169/etc. 4.9Other state highways/etc. 20.0Not one rest area in particular/Don't know/Not sure. 21.7
Figure 29. The highway rest area or rest areas that respondents were thinking about during the survey.(This figure includes respondents who use state highway rest areas while traveling.) (n=350)
Finding #31: Most rest area users were thinking of rest areas on interstates -- I-35, I-94 or I-90 -- whilecompleting the survey.
The 350 rest area users were asked which Minnesota rest area or rest areas they were thinking of duringthe survey completion. Nearly half of the rest area users (160 or 45.8%) thought of rest areas on I-35, 86users (24.6%) thought of rest areas on I-94, and 52 (10.3%) of rest area users thought of rest areas on I-90.
Note: Percentages do not equal, and exceed, 100% because this is a question where a respondent could givemore than one answer when responding. Therefore, the number of answers may well be in excess of oneanswer per respondent.
1997 Mn/DOT Rest Area Market Research Telephone Survey49
0 to less than 5 years 5.0% 6.4% 8.0% 4.7% 3.4% 3.4% 3.3%5 to less than 10 years 4.2 3.7 5.1 2.3 4.7 2.5 6.810 to less than 15 years 3.8 5.2 7.2 3.1 2.1 1.7 2.515 to less than 20 years 6.2 7.5 9.4 5.4 4.7 5.1 4.220 to less than 30 years 16.7 15.7 10.9 20.9 17.8 15.3 20.330 years or more 34.4 34.1 31.2 37.2 34.7 35.6 33.9Entire life 28.8 26.2 27.5 24.8 31.8 35.6 28.0
Mean = 25.96 25.17 23.41 27.01 26.91 27.79 26.13
1997 Mn/DOT Rest Area Market Research Telephone Survey50


![DEPARTMENT OF THE INTERIOR Fish and Wildlife Service 50 ... · 1 DEPARTMENT OF THE INTERIOR Fish and Wildlife Service 50 CFR Part 17 [Docket No. FWS–HQ–ES–2018–0007; 4500030113]](https://static.documents.pub/doc/80x56/5fad5eacd07e8913ff3493e5/department-of-the-interior-fish-and-wildlife-service-50-1-department-of-the.jpg)


![DEPARTMENT OF THE INTERIOR Fish and Wildlife Service 50 ...€¦ · DEPARTMENT OF THE INTERIOR Fish and Wildlife Service 50 CFR Part 17 [Docket No. FWS–R8–ES–2012–0058] [4500030113]](https://static.documents.pub/doc/80x56/5f13c8bd413def3936322f83/department-of-the-interior-fish-and-wildlife-service-50-department-of-the-interior.jpg)
