UNITED STATES DEPARTMENT OF THE INTERIOR GEOLOGICAL SURVEY SEISMIC EVIDENCE FOR AN EXTENSIVE MS-BEARING LAYER AT SHALLOW DEPTH, OFFSHORE FROM PRUDHOE BAY, ALASKA Gary Boucher, Erk Reirnnitz, and Ed Kempema Open-file report 80- 809 This report is prel iminary and has not been edited or reviewed for con formi ty with Geological Survey standards
Transcript
UNITED STATES DEPARTMENT OF THE INTERIOR
GEOLOGICAL SURVEY
S E I S M I C EVIDENCE FOR AN EXTENSIVE MS-BEARING LAYER AT SHALLOW DEPTH, OFFSHORE FROM
PRUDHOE BAY, ALASKA
Gary Boucher, E r k Reirnnitz, and Ed Kempema
Open-file report 80- 809
T h i s report i s prel iminary and h a s n o t been edi ted o r reviewed f o r con formi t y w i t h Geological Survey s tandards
SEISMIC EVIDENCE FOR AN EXTENSIVE GAS-BEARING LAVER AT SHALLOW DEPTH, OFFSHORE FROM
PRUDHOE BAY, ALASKA
Gary Boucher, Erk Reimni t r , and Ed Kempema
ABSTRACT
High r e s o l u t i o n seismic r e f l e c t i o n data recorded of fshore from Prudhoe
Bay, Alaska, were processed d i g i t a l l y t o determine t h e r e f l e c t i v i t y s t r u c t u r e
of t h e u p p e m s t l a y e r s of t h e seafloor. A prominent r e f l e c t o r found a t 27 m
belo* t h e mud1 i n e (water depths 7-9 m) has a negat ive r e f l e c t i o n c o e f f i c i e n t
g rea ter than 0.5. The l a r g e acous t i c impedance cont ras t , coupled w i t h a
r e p o r t of gas encountered a t a corresponding depth I n a nearby d r i l l h o l e ,
shows t h a t t he r e f l e c t o r i s t h e upper boundary o f a zone con ta in ing gas. The
gas e x i s t s i n sandy gravel capped by s t i f f , s i l t y c l a y . Ana lys is o f unprocessed
convent ional h i gh-resol u t i o n records f r o m the region i n d i c a t e s t h a t the
gas-bearing l a y e r may extend over an area o f a t l e a s t SO km2 a t depths o f
19-35 m below t h e mud1 i n e . Similar-appearing r e f l e c t o r s , p r e v i o u s l y unexplained,
occur i n patches over wide regions o f t he s h e l f where o f f sho re o i l development
i s beginning a t a rap'id pace. Th is suggests the exerc ise o f cau t i on w i t h
respect t o poss ib le hazards from shal low gas pockets.
INTRODUCTION
During August 1979, t he authors tape-recorded h igh - reso lu t i on se ismic
r e f l e c t i o n data o f f sho re f r o 5 Prudhoe Bay, A l a s k a . Our purpose was t o app ly
v e r t i c a l seismic r e f l e c t i o n techniques, w i t h d i g i t a l processing, t o the
mapping and c h a r a c t e r i z a t i o n o f ice-bonded ma te r ia l I n t h e o f f s h o r e env i ron-
mnt near Prudhoe Bay. An unexpected r e s u l t o f t h a t s tudy i s t h e i d c n t i f i -
c a t i o n of a strong r e f l e c t o r a t depths between 19 and 35 m below t h e mudl ine
as the upper boundary o f a gas-bearing l a y e r . The i d e n t i f i c a t i o n i s supported
by evidence f r o m a nearby geotechnical borehole. I n t h i s paper, we d iscuss
the sef smic processing used, and we extend the r e s u l t s t o o ther seismic
records from t h e same general area. Our study shows t h a t the gas-bearing
l a y e r under l i es an area o f a t l e a s t 50 tm2 . He discuss some i m p l i c a t i o n s
o f these r e s u l t s r e l a t i v e t o o f fshore development i n the a rea .
GEOLOGIC SETTING
During February and March 1979, 20 geotechnical boreholes were d r i l l ed
and cored on Federal t r a c t s w i t h i n t h e Beaufor t Sea lease sale a r e a (Harding-
Lawson Assoc., 1949). The maximum depths o f the borehol es were between 24.8
and 91.8 m be1 ow the mud1 ine . I n t he course o f c o l l e c t i n g seismic p r o f i l e s
across a number o f these d r i l l holes, we no t i ced an anomalously s t rong sub-
bottom r e f l e c t o r i n t h e v i c i n i t y o f a d r i l l ho le a t 7o023.012'N, 147'41 -003' W
(Hole 11 o f Harding-Lawson Assoc . , 1979).
The d r i l l i n g l o g f o r ho le no. 17 ind i ca tes an upper 1 ayer o f predominant ly
s i l t y sand 3 m thick, under la in by a s t i f f o r very s t i f f s i l t w i t h t h i n l a y e r s
o f organic ma te r i a l and f i ne sand. Below 17 m, poss ib le t h i n i c e lenses
were observed, and below 24 m t h e ma te r ia l was ice-bonded. Around 25 m below
the mud1 ine , a l a y e r o f sandy gravel was penetrated, con ta in ing occasional
lenses o f ice-bonded sand. Whi le d r i l l i n g i n t h i s sandy gravel , flarnrnabl e
gas was observed bubb l ing ou t o f the d r i l l i n g mud. The ho le the re fo re was
terminated a t 29 m depth. This depth corresponds t o t h a t o f the s t rong s e i s m i c
r e f l e c t o r .
METHODS
Seismic evidence f o r t h e ex is tence o f ice-bonded sediment (permafrost)
i n o f f sho re areas o f the Beaufor t sea i n the pas t has been der ived main ly
from seismic r e f r a c t i o n s tud ies (Hunter and others, 1978, and Rogers and
&rack, 1978, f o r example) . However, s e i s m i c r e f l e c t i o n methods should
prov ide b e t t e r ho r i zon ta l r e s o l u t i o n and a more complete d e s c r i p t i o n o f v e r t i c a l
geometry. I n o rde r t o use se ismic r e f l e c t i o n methods t o i d e n t i f y ice-bonded
o r gas-bear ing sediments an t h e b a s l s o f measurable phys i ca l p rope r t i es , one
must d e r i v e r e f l e c t i o n c o e f f i c i e n t s from t h e ampl i tudes o f r e f l e c t i o n events .
However, most se ismic sources do not produce a s imp le waveform, which i s
e a s i l y measured i n t h e presence o f m u l t i p l e , c l o s e l y spaced r e f l e c t o r s and no ise.
Thus, deconvo lu t ion i s r e q u i r e d as an i n te rmed ia te s t e p t o conver t each se ismic
r e f l e c t i o n event i n t h e s i g n a l t o a waveform o f minimum d u r a t i o n whose ampl i tude
and p o l a r i t y can be e a s i l y measured. Berkhout (1977) exp la i ns why a zero-phase
wavelet i s t h e optimum waveform f o r making such measurements. Furthermore,
t h e w i d t h o f t he wave le t w i l l be a minimum i f the ampl i tude spectrum o f t h e
se ismic pu lse i s smooth and broad. I n t h i s s tudy, zero-phase wavelet decon-
v a l u t i o n was performed by c o n s t r u c t i n g an e x p l i c i t model o f t h e se ismic source
pu lse based on t h e d i r e c t (water-wave) a r r i v a l , which we de l i b e r a t ~ l y recorded.
Th is model f o r t h e se ismic source pu l se was then c ross -co r re l a ted w i t h t h e
se ismic t r a c e and i n v e r s e f i l t e r e d t o ach ieve t h e optimum seismic t r a c e f o r
making measurements. The use o f c r o s s - c o r r e l a t i o n i n t h i s way t o achieve a
zero-phase wavelet , and t h e d i g i t a l f i l t e r i n g i n v o l v e d a r e exp la i ned i n books
on d i g i t a l process ing, such as t h a t by Gold and Rader ( 1 969) . Because o f t h e
l i m i t e d s i g n a l bandwidth o f t h e f i n a l o u t p u t se ismic t r a c e , t h e se ismic wavelet
i s n o t a s i n g l e sp ike, b u t i s l i k e a W-shape w i t h smal l nega t i ve excurs ions,
as shown i n f i g . 1 . The wavelet's p o l a r i t y i s unambiguous so 1 ong as t h e
s i gna l - to -no ise r a t i o i s s u f f i c i e n t l y l a r g e .
Seismic r e f l e c t i o n d a t a were recorded on analog magnet ic t a p e us ing a
Uniboom source aboard t h e R / V KARLUK. We d i g i t i z e d t h e da ta a t a r a t e o f 10,000
samples per second f o r computer process ing, and performed zero-phase wavelet
deconvol u t i o n as exp l a ined above, The 1 i m i t s o f u s e f u l s i gnal f requency range
were 150 and 2000 Hz. The f u l l w i d t h o f t h e deconvolved se ismic pu lse was about
0.8 msec, corresponding t o a v e r t i c a l r e s o l u t i o n o f about 0.6 rn a t t h e speed
o f sound i n water .
dANALY S I S
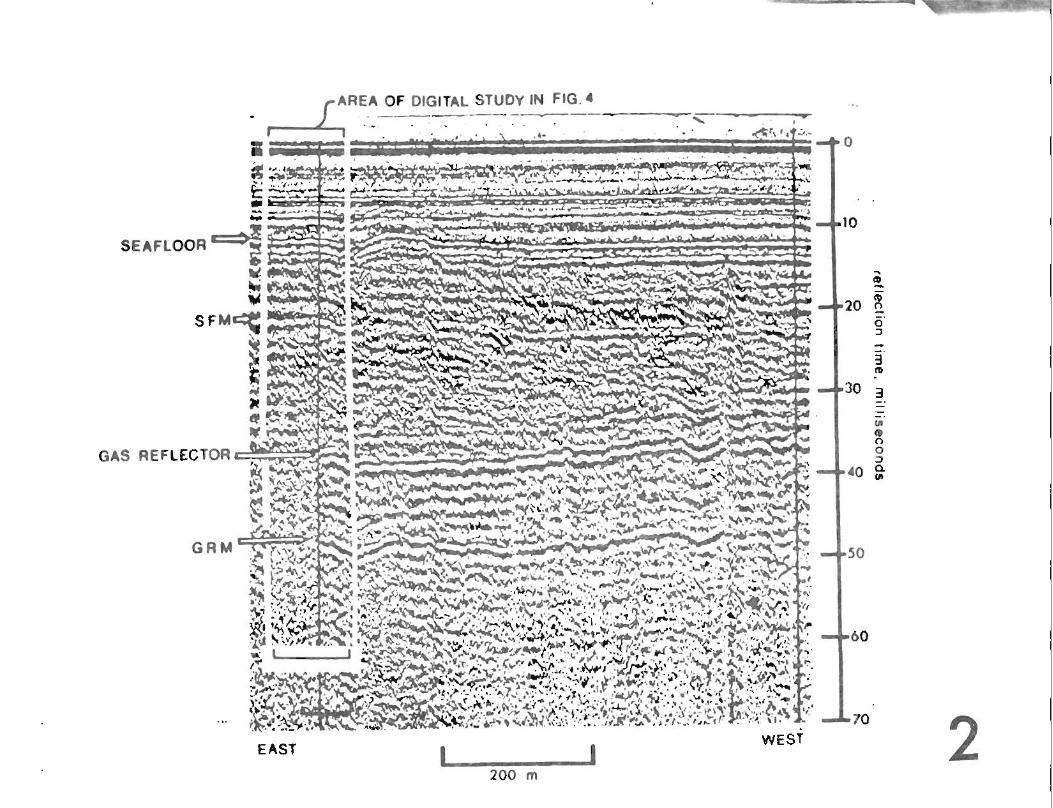
Figure 2 shows the shipboard seismic record, and de l ineates the small
area chosen fo r d e t a i l e d d i g i t a l ana l ys i s . Since the reco rd i s o f r a t h e r
poor qua1 i ty, we show a reprocessed sec t i on i n f igure 3. The prominent
re f l ec to r a t about 38 msec i s l a b e l e d as t h e "gas" r e f l e c t o r , and i t s f i r s t
water-col umn m u l t i p l e r e f l e c t i o n can be seen about 13 msec below. The records
i n f i gu res 2 and 3 have been subjected t o automatic gain con t ro l , b u t t he
r e f l e c t o r o f i n t e r e s t nevertheless appears s t rong. I n o rder t o quan t i f y t he
s t reng th o f t he r e f l e c t o r and determine i t s p o l a r i t y , t h e seismic sec t i on was
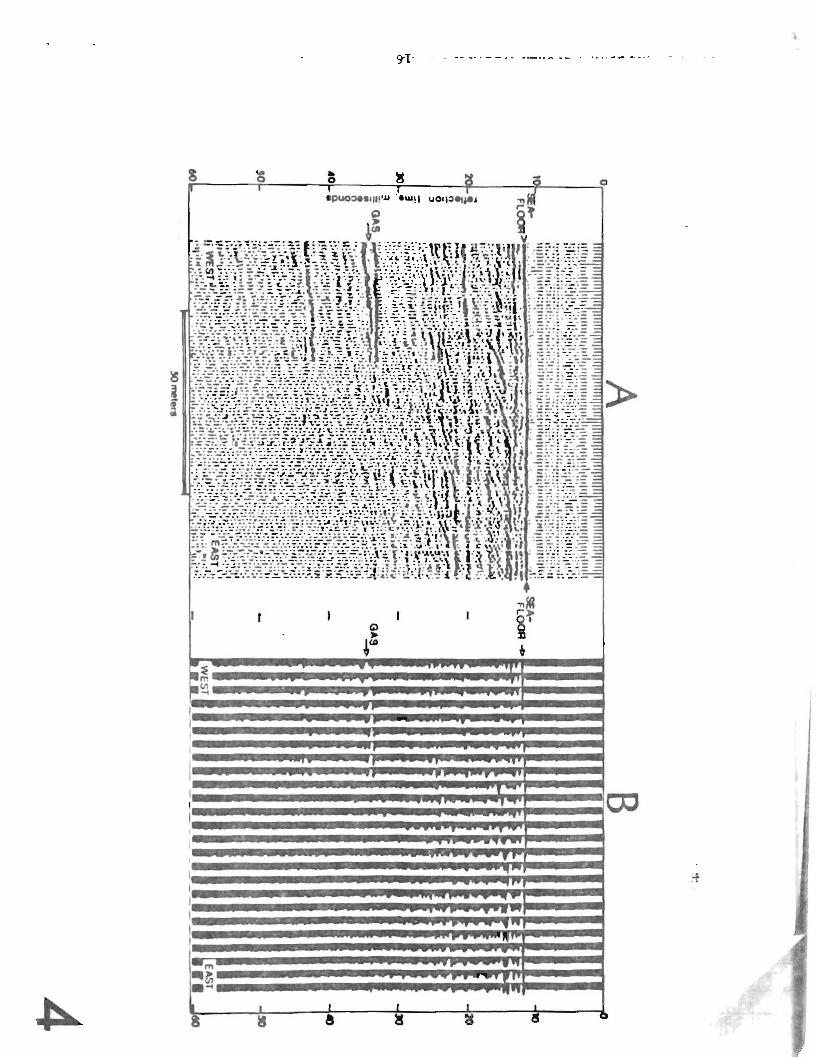
deconvolved and p l o t t e d as shown i n f i g u r e 4. On the l e f t s i de o f f i g u r e 2,
t h e deconvolved seismic record sec t i on i s shown. On the r i g h t s ide of f i gu re 4 ,
t he fu l l - amp l i t ude wiggle- t races are shown f o r the same data subjected t o 5 - fo ld
v e r t i c a l s tack ing . Here the r e l a t i v e s t reng th and reversed p o l a r i t y o f t he
prominent r e f l e c t o r a re apparent i n comparison w i t h the r e f e c t i o n f rom the
water-sediment i n t e r f a c e . To permi t q u a n t i t a t i v e measurements o f t h e r e f l e c t i o n
c o e f f i c i e n t o f t h e prominent r e f l e c t o r , t h e data were presented as i n f i g u r e 5.
a f t e r 2 0 - f o l d v e r t i c a l s tack ing t o f u r t h e r reduce random noise. We do n o t
know the ampli tude o f t h e outgoing seismic pulse, and t h e amp1 i t u d e o f t h e
seaf foor m u l t i p l e i s too small t o measure accura te ly . Therefore we cannot
measure r e f l e c t i o n c o e f f i c i e n t s d i r e c t l y . However, given a reasonable r e f l e c -
t i o n c o e f f i c i e n t o f a t l e a s t 0.2 (Hamilton, 1969) f o r t h e s i l t y sand a t t he
seaf loor , we can est imate t h e r e f l e c t i o n c o e f f i c i e n t o f t he s t rong subbottom
r e f l e c t o r . We compare the ampli tude o f t he sea f l oo r r e f l e c t i o n w i t h t h a t o f
t he subbottom r e f l e c t o r , and a l l o w f o r a r e t u r n path across several i n t e r f a c e s ,
i n c l u d i n g the sea f l oo r . We conclude t h a t t h e magnitude o f t he r e f l e c t i o n
c o e f f i c i e n t o f t h e gas r e f l e c t o r cannot be l e s s than 0.5. The fmpl ica t ions of
a r e f l e c t i o n c o e f f i c i e n t t h i s l a r g e become c l e a r from t h e f o l l o w i n g cons idera t ions .
The s imp les t approximation f o r the r e f l e c t i o n c o e f f i c i e n t , t h e Rayleigh plane-
wave r e f l e c t i o n c o e f f i c i e n t (Dobrin, 1960, p. 25) i s g iven by
R i s the amp1 l t ude r a t i o bctwtcn the lncddent and re f l ec ted plane waves a t
normal Incidence on rn Inter face, q I s the bulk densi ty o f the upper wdium
5 1s the bulk densi ty of the lower medium, and 7 r n d v 2 b e the sound
velocities f n the upper and lower media, mspcc t i ve ly . I f the acoustic Impedance.
p2v2, of the lower medium I s less than t h a t o f the v p p r medim, the r e f l e c t i o n
coe f f i c ien t wfll be negative and the r e f l e c t i o n w i l l be inverted. The physfcal
problem I s t o achleve the cont rast between q v , and p2v2 needed t o expla in
reflection coef f ic ient observations, gf ven the mater ia ls known t o be present.
Ye demonstrate the presence o f gas i n the r e f l e c t i n g layer by showing t ha t ,
even w i t h the m s t unfavorable assumptions f o r the product pl V1 , t h e r e q u i r e d
value of ~ 2 ~ 2 i s too smaf 1 t o be explained wi thout s i gn i f i can t amounts o f gas
t n the sed imnt pore space. Taking R = 0.5 (a mfnimum), pl = 1.8 c~/crn~, vl =
3000 nrec. and so lv ing f o r the required val ue o f p2v2, gives pZvZ = 1.8 x lo5
g cm'* stc- I , p m b a b l j an over estimate. Thls i s f a r too low f o r the sandy
gravel, probably frozen, known f r o m the d r i l l log t o be present,without i n t e r -
s t i t i a l gas. Therefore, a s i gn i f i can t quan t i t y o f gas must be present dn t h e
pore space o f the mater ia l under ly ing the n f l e c t l n g In te r face , serv ing t o
reduce b t h bulk densi ty and compressional v e l o c i t y enough t o achieve the
observed low value o f acoustic impedance, p Z v p The r e w r t o f bubblina anz
f r o m the d r i l l i n g l o g i s support ing evidence.
A cons t ra in t on the minimum thickness o f the gas-bearing layer i s a r u l e
of thumb t h a t a layer must be a t l eas t 1/5 o f a wavelength t h i c k t o y i e l d a
substant ia l re f lec t ion a t a given s ignal frequency. I n view o f the strength
of the r e f l e c t o r t h a t I s observed, I t i s more l i k e l y t o be a t least one-half
wavelength th i ck . Since we comnonly observe a strong reflection w i t h s ignals
peaking near 1200 HZ, we my conservatively s ta te t h a t the layer. where It i s
strongly mf lec t ing , 4s a t l eas t 1 m th lck. f fgu re 6 shows a magnified view
of a po r t i on o f f igure 4 . There i s an i nd i ca t i on o f a pos i t i ve r e f l e c t o r
about 1 .5 m below the gas re f l ec to r , which appears t o pinch out f u r t he r t o the
r i g h t . If t h i s lower r e f l ec to r represents the bottom o f the gas zone, then the
gas zone m y be a b i t more than a meter t h i c k . Othemlse we have no cons t ra in t
on the maximum thickness o f the gas xane.
The d i g i t a l se ismic 'ana~ys is was performed f o r a l oca t ion about 600 m
from d r i l l hole no. 11 . However, the pmminent sefsmic wflcctar can be
t raced t o the l oca t i on of the d r i l l ho le wlthout In te r rup t ion , and maintains
i t s character. Therefore we are conf ident t h a t the seismic data are co r rec t l y
cor re la ted w i t h the borehole data.
The charac te r i s t i c seismic r e f l ec to r i d e n t i f i e d as gas can be traced on
conventional h igh-resolut ion seismfc records from the surrounding area, obtained
dur ing several years .of seismic p r o f i l i n g . On these records (see f igu re 7),
the r e f l e c t o r i s recognized on the basis o f (1) i t s st rength (bearing i n mind
t h a t most of such records were made w i t h automatic gain con t ro l ) , (2) i t s
negative p o l a r i t y (sometimes ambiguous) . ( 3 ) I t s cont inu i t y over long distances,
and (4) i t s r e s t r i c t i o n t o a narrow range o f subbottom depths. I n some areas
the charac te r i s t i c r e f l ec to r appears weaker, but nevertheless prominent . The
apparently diminished r e f l e c t i o n amplitude may r e s u l t from a change I n some
property of the r e f l e c t i n g layer, f r o m a change I n the over ly ing sediments,
o r from the presence of boulders on the seaf loor. Figure 13 shows the seismic
t r a c k l i n e coverage ava i lab le i n the study area, and the areal extent o f the
gas-bearing layer mapped by use o f the seismic record as e i t h e r strong or weak.
- Ff gure 8 a l s o shows the depth o f the gas-bearing layer beneath the mud1 in@.
One charac te r i s t l c feature o f the gas-charged seismic r e f l e c t o r i s i t s abrupt,
unexplained terminat ion i n m n y areas. Where such terminations occur, f i gu re 8
shows the hundary of the gas patch as a s o l i d l i n e . Yhere the r e f l e c t o r . gradually dlmlnishes In strength, we omit ted the s o l i d l i n e .
DISCUSS ION
The strong gas re f l ec to r underlies an area of about 3 x 16 km, elongated
east-west, and located df rec tay w e s t of Namhal I s land along the seaward
boundary o f Stefansson Sound. A number o f t e s t borings i n the v i c i n i t y (Harding
and Lawson Assoc., 1979) show t h a t the anomlous r e f l e c t o r I s aqsociated wj th
a change from s t i f f marine c l a y - s i l t - f i n e sand t o an underlyfng t h i c k
accumulation o f presmably non-marine sandy gravel or gravelly sand. The
s t i f f s i l t y c lay apparently forms a seal, t rapp ing gas dn the coarser mater ia ls
below. The effect iveness o f the cap i s shown by a tack of gas i n s u r f i c l a l
sediment co l lec ted near t e s t bor ing 11 by P .W. Barnes (ora l communication).
Strong r e f l e c t o r s w i t h cha rac te r t s t l ca l l y abrupt terminations, s i m f l a r t o
the one under inves t iga t ion here, a r e widespread on the Beaufort Sea shel f.
The prevf ously unexplained phenomenon has 1 ed t o uncer ta in t ies i n i n t e rp re ta t i ons
and even t o mis in terpreta t ions o f regional shel f s t ra t igraphy. Thus, Reimnitz
e t a1 . (1972) mapped the strong anomalous r e f l e c t o r invest igated i n t h f s study
as the base o f a sect ion of Holocene marine sediments about 20 m t h i c k . Since
then Reinmitx and Ross (1 979) have shown t h a t the a r e a mapped here i s under la in
by gas-r lch sediments coincides w i t h areas where the Quaternary Gubic Formation
crops out and Holocene sediments are absent.
Judging by the bonuses o f fe red i n the recent StatelFederal lease sale,
the regfon here mapped as under la in by shallow gas a lso has high po ten t ia l f o r
petroleum accumulations a t depth. There f s evidence f o r n m r o u s shallow gas
rccunulat ions, s t i l l unmapped, i n other areas o f the Beaufort Sea s h e l f t ha t
rre await ing d tve lopmnt . Techniques used i n the present study a l low f o r
l d e n t i f i ca t i on of such accmulat lons by geophysical methods. Good d r i l l i n g
p rac t i ce w i l l call f o r precautionary measures where shallaw gas sccumulatJons
occur.
CONCLUSION
Ye have eppl fed q u a n t l t a t i ve d i g i t a l processing techniques t o high-
resolut ion seismic re f lec t ion data obtafned near Prudhoe Bay, ~lask;, t o
point ou t the presence of gas i n the pore space o f sca f loo r sediments a t shallow
depth. Analysis o f a sudte of seismic records f r o m the same area indfcates
tha t the gas-bearing layer, a t depths o f 20-35 m below the mud1 ine, under l ies
an area of more than 50 km2 west o f Narwhal Is land, about 25 km NE o f Prudhoe
Bay. S im i la r records f r o m other areas o f the shallow s h e l f i n the Beaufort
Sea suggest t h a t patches o f shallow gas are n widespread phenomenon, We suggest
t h a t appropriate a t t e n t i o n be given t o the po ten t ia l e f f ec t s o f shallow gas
deposits, as they may af fect of fshore engineering dcvel opments .
REFERENCES CITED
Harding-Lawson Assoc , , 1979, U .S .G .S . geotechnical i n v e s t i ga t fon Beaufor t
Sea 1979: a v a l l . from Nat iona l Geophysical and S o l a r - T e r r e s t r i a l Data
Center, Boulder, Colo., 3 vo l . + suppor t ing documents, Ref. # AK 17718.
Hunter, J. A., Neave, K. G., MacAulay, H, A.. and Hobson, G. 0.. (1978).
I n t e r p r e t a t i o n o f sub-seabottom permafrost i n t h e Beaufor t Sea by seismic
methods. P a r t I. Seismic r e f r a c t i o n methods, i n Nat iona l Research Council
o f Canada: Proceedings o f t he t h i r d i n t e r n a t i o n a l conference on permafrost,
1978, vo l . 1, p. 514-520.
Rogers, J. C.. and Morack, J. L. (1978) Geophysical i n v e s t i g a t i o n o f o f fshore
permafrost, Prudhoe Bay, Alaska, I n t e r p r e t a t i o n o f sub-seabottom permafrost
i n the Beaufor t Sea by seismic methods. Pa r t I . Seismic r e f r a c t i o n methods,
i n Nat ional Research Council o f Canada : Proceedings o f the t h i r d i n t e r n a t i o n a l
conference on permafrost, 7 978, p . 560-566. Reimnitz, Erk and Robin Ross, 1979, Lag deposi ts o f boulders i n Stefansson Sound,
Beaufor t Sea Alaska : U.S. Geological Survey Open F i l e Report 79-1 205, 26 p .
Reimnitz, E., Wolf. S. C . and Rodeick, C . A. 1972, P re l im ina ry i n t e r p r e t a t i o n
of seismic p r o f i l e s i n the Prudhoe Bay area, Beaufor t Sea, Alaska. U.S.
Geological Survey open f i l e r e p o r t 548, 11 p p .
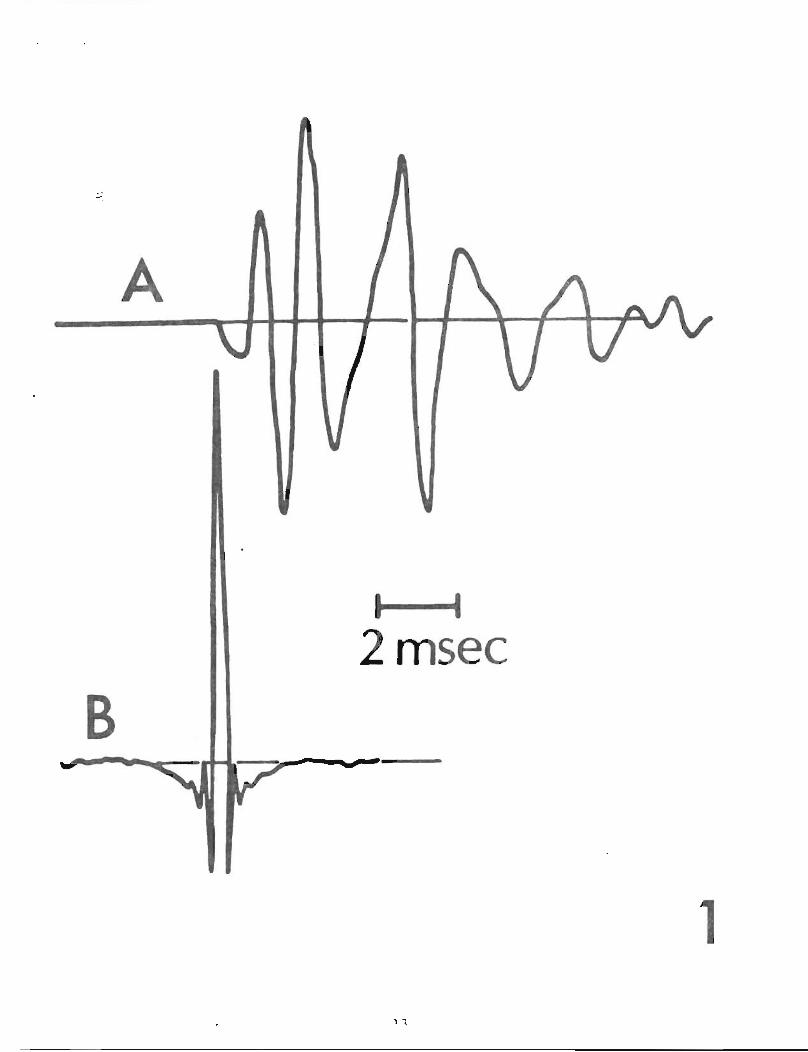
Figure 1. Zero-phase wavelet deconvol ution is applied to the seismfc trace
t o convert the seismic source pulse t o an approximately spl ke-1 ike
form, which permits maximum spat ial resolution and unabiguaus measurements
of amp1 itude and polarity. A . Typical isolated seismic source pulse,
representing the physical character is t ics o f the seismic source, as
modified by transmission through water, and f i l t e r i n g by the hydrophone
array, bandpass fil ters, and the recording and playback systems. The
energy i s spread out i n time over a number o f peaks and troughs o f the
waveform. B . Zero-phase wavelet deconvolution of the source pulse i n A . ,
i l l u s t r a t ing the syrmetry of the zero-phase reconstruction and the small
width resulting from inverse f i 1 t e r i n g , which equal izes spectral energy
over a broad range of frequency. The sense, o r polar i ty , o f the decon-
vol ved pulse i s unabiguous. The arr ival of the maximum energy o f the
pulse occurs a t the beginning of the waveform, rather than a t a l a t e r
time as i n the case of the original pulse in A . The deconvol ved pulse
i s not a perfect spf ke (delta-function) because the bandwidth of the
deconvol ved put se, though broad, is 1 imited by the frequency range of
good signal-to-noise rat io . The isolated pulse shown here represents a
s i n g l e seismic ref lector ; the actual seismfc t race consists of a t r a i n
of pulses, each produced by a reflecting interface.
Figure 2 . Section of shipboard seismic record, i n which the ref lector ident i f ied
i n t h i s s tudy as gas can be c lear ly seen. The portion of the record
within the box i s that subjected to detailed digi ta l analysis i n f i g . 4 .
The segment of the gas re f lec tor within the box includes a termination
of t he re f lec tor on the l e f t end . The water-cal umn mu1 t i p l e s of the
seafloor (SFM), and the gas ref lector (GRM) can be seen about 1 3 msec
be1 ow the primary ref l ections .
Figure 3. Replot, f rom magnetic tape, o f the same data as i n f i g . 2,
performed i n t h e l a b o r a t o r y by a r e a l - t ime se ismic processing system,
,- showing the s e a f l o o r and t h e gas r e f l e c t o r s , w i t h t h e i r water-column
mu1 t i p l e s , more c l e a r l y than i n t he poor qua1 i t y unprocessed shipboard
shown i n f i g . 2, The p o r t i o n o f record t r e a t e d i n f i g , 4 i s o u t l i n e d .
F igure 4. Deconvolved data f r o m the area out1 i ned i n f i g u r e s 2 and 3. A. C1 ipped
w igg le- t race presentatSon, corresponding t o a normal seismic sect ion, showing
o n l y t he p o s i t i v e p o r t i o n of the wavefonn. 0. Sam data, b u t subjected
t o 5-fol d v e r t i c a l s tack ing, w i thou t c l ipp ing, showing p o s i t i v e and
negat ive sfdes o f t he wave form, i n o rder t o emphasize the negat ive
p o l a r i t y o f t he gas r e f l e c t o r . These sect ions are reversed l e f t t o
r i g h t , compared t o f i g u r e s 2 and 3,
F igure 5. Large-scale w igg le- t race presenta t ion o f the same data as i n
f i g u r e 4, b u t subjected t o 20 - fo l d v e r t f c a l s tack ing . Zero-phase wave1 e t
deconvol u t i o n was performed before stack ing. The large-amp1 i tude negat ive
sp ike (oppos i te i n sense t o the sea f l o o r r e f l e c t i o n event) represef i t ing
t h e gas r e f l e c t o r shows the negat ive p o l a r i t y and s t reng th o f t h i s
r e f l e c t o r . Each t r a c e i s normal ized t o t h e l a r g e s t ampl i tude on t h e
t race . The d i r e c t a r r i v a l fo l lowed by i t s r e f l e c t i o n from t h e h u l l o f
boat can be seen ahead of the sea f l oo r r e f l e c t i o n , Under 20- fo ld
stacking. t h e gas r e f l e c t o r i s somewhat degraded i n ampl i tude because
t h e r e f l e c t o r i s somewhat curved, p a r t i c u l a r l y on t h e western-most t race .
Traces a re co r rec ted f o r spher ica l spreading.
6 - F igure 6. Magni f ied view o f the gas r e f l e c t o r shown i n f i g u r e 4 , presented
a t two l e v e l s of s e n s i t i v i t y . A . Trace c l i pped a t one-tenth o f maximum
ampl i tude, w i t h threshhol d a t zero ampl i tude, t o emphasize weakest
events. B. Trace c l i p p e d a t 4- tenths maximum ap t i t ude , w i t h th reshho ld
a t 0.1 o f t h e c l i p p i n g ampli tude, showing s t ronger events. The poss ib le
lower boundary o f t he gas-charged zone i s i nd i ca ted , along w i t h t h e
apparent pinch-out near t he cen te r o f t he p i c t u r e . The l a y e r may no t
i n fact p inch ou t completely, but may i ns tead become too t h i n t o be
resolved w i t h the range o f s igna l frequencies used ( l ess than 2000 Hz).
Figure 7. Conventional seismic records, se l ected from nearby t rack1 i nes shot
i n p r i o r years, showing c h a r a c t e r i s t i c v a r i a t i o n s o f t he gas r e f l e c t o r
ove r extended distances. I n general t h e te rminat ions and v a r i a t i o n s i n
s t reng th o f t he gas r e f l e c t o r a re unexplained, bu t may be due t o changes
i n the o v e r l y i n g sedimentary sec t i on o r t o changes i n t he r e f l e c t o r
i t s e l f.
Figure 8. Se ismic t r a c k l i n e coverage showing the ex ten t o f t h e gas r e f l e c t o r
i n Stefansson Sound. The r e f l e c t o r was f i r s t i d e n t i f i e d by seismic
s igna l ana lys i s and then mapped by comparing t h e s e c t i o n o f analyzed
record w i t h convent ional records from the area. The i n d i c a t e d r e f l e c t o r
depths below the mudline i n meters (smal l numbers w i t h i n the gas area)
a re based on r e f l e c t i o n t ime, assuming an average v e l o c i t y o f 2000 m/sec
i n the subbottom. The l o c a t i o n o f t h e d i g i t a l seismic ana lys is o f
f i g u r e 4 i s w i t h i n the do t represent ing d r i l l ho le 11 . The 5-meter
i sobath i s shown.
AREA OF DIGITAL STUDY IN FIG. 4 .. __-----.--- _ c , . . -\- - , I