Page 1
�
DATA FROM THE NATIONAL CENTER
FOR HEALTH STATISTICS e
x
LIFE TABLES: 1959-61
VOLUME 1 - NO. 1
U.S. DEPARTMENT OF
Anthony J.
PUBLIC
Luther L.
Washington, D.C.
UNITED STATES LIFE TABLES:
1959-61
HEALTH, EDUCATION, AND WELFARE
Celebrezze, Secretary
HEALTH SERVICE
Terry, Surgeon General
December 1964
Page 2
NATIONAL CENTER FOR HEALTH STATISTICS
FORREST E. LINDER, PH. D., Director
THEODORE D. WOOLSEY, ~r?j)z@~iWtOT
O. K.SAGEN,PH. D., zisskznt ~i7%?CtO?’
WALT R.SIM.MONS,M.A.,Statzkieal AdviJor
ALICEM.WATERHOUSE, M.D.,Medical Adviror
JAMES E.KELLY,D.D.s.,Dental Advisor
LOUISR.STOLCIS,M.A.,Executive Oficer
DIVISION OF HEALTH RECORDS STATISTICS
MONROEG. SIRIiEN, PH. D., Chief
PUBLIC HEALTH SERVICE PUBLICATION NO. 1252 - VOLUME l-NO. I
Page 3
---------------------------------------
-------------------------------------------
-------------------------------------
------------------------------
-------------------------------
-----------------------------------------------------
-------------------------------------------------------
CONTENTS
Generation andcurrent life tables
Decemial life tables, 1959-61 -------------------------------------------
Accuracy of life wblevdues
Measures of comparative longevity
Secular trend oflife mblevdues, 1900-1961
Explanation of the columns ofthe life table
Tables
1. Life table for the total population: United States, 1959-61-------------
2. Life table for total males: United States, 1959-61--------------------
3. Life table for total females: United States, 1959-61------------------
4. Life table for total whites: United States, 1959-61--------------------
5. Life table for white males: United States, 1959-61-------------------
6. Life table for white females: United States, 1959-61-----------------
7. Life table for total nonwhites: United States, 1959-61----------------
8. Life table for nonwhite males: United States, 1959-61----------------
9. Life table for nonwhite females: United States, 1959-61--------------
10. Proportion of persons dying during year at specified ages, whowere alive at beginning ofyear ofage, bycolor and sex: Death-regismation States, at 10-year intervals, 1900-1902 to 1959-61------------------
11. Number surviving to specified ages out of100,0OObom alive, bycolor and sex: Death-registration States, at 10-year intervals, 1900-1902 to 1959-61
12. Average remaining lifetime in years at specified ages, by color and sex: Death-registration States, at 10-year intervals, 1900-1902 to 1959-61
Page
3
3
3
4
5
5
8
10
12
14
16
18
20
22
24
26
28
30
Page 4
UNITED STATES LIFE TABLES:1959-61
6erreration and Current life Tables
The mortality rates for a specific period may be summarized by the life table method to obtain measures of comparative longevity. There are two types of life tables—the generation or
cohort life table and the current life table. The generation life table provides a “longitudinal” perspective in that it follows the mortality experience of an actual cohort–for example, all persons born in the year 1900—from the moment of birth through consecutive ages in successive calendar years. Based on age-specific mortality rates observed during consecutive calendar years, the generation life table reflects the mortality experience of a cohort from birth until no lives remain in the group.
The better-known current life table may, by contrast, be characterized as “cross-sectional.” Unlike the generation life table, the current life table does not represent the mortality experience of an actual cohort. Rather, the current life table considers a hypothetical cohort and assumes that it is subject throughout its existence to the age-specific mortality rates observed for an actual population during a particular period of relatively short duration (often 1 to 3 years).
Decennial life Tables, 1959-61
The life tables contained in this report are current life tables based on age-specific mortality rates for the period 1959-61. These mortality rates have been calculated from data of the 1960 census of population and deaths occurring in the United States in the 3-year period 1959-61. In deriving life table values at ages under 2, where census data are significantly affected by under-enumeration, use has been made also of reported births for each of the years 1957 to 1961. Tables
u-e given for whites and nonwhites, sepmately by sex and for both sexes combined, and also for the total population and for total males and total females (tables 1-9).
These tables are the most recent in a series of life tables that have been prepared at 10-year intervals for the death-registration States, which began with those for 1900-1902. Each of the tables in the series is based on a census of population and deaths in a 3-year period containing the census year. These decennial life tables differ in two main respects from the life tables pre-pared annually and published in the annual volumes Vita{ Statistics of the United States: (1) the annual tables are based on deaths of a single year and on postcensal population estim roes, rather than directly on the data of a decennial census, and (2) the annual tables are calculated by abbreviated methods.
The life tables in this report are the result of a joint effort by the National Center for Health Statistics, Public Health Service, and the Division of the Actuary, Social Security Administration. The Division of the Actuary played the primary role in developing the methodology used, while the computer programming and calculation of the life table values was primarily the responsibility of the National Center for Health Statistics.
Accuracy of life Table Valrrss
The accuracy of the life table values probably compares favorably with the accuracy of the statistics on which they are based. However, it is well known that the underlying data are subject to serious errors, the magnitude of which is usually difficult to estimate precisely. The only type of error that was deemed sufficiently serious to warrant adjustment prior to the calculation of the life tables concerned apparent inaccuracy in
3
Page 5
statements of age by nonwhites in the neighborhood of age 60. In order to avoid anomalous life table values, the nonwhite population at ages 55-64 years was reallocated between the 5-year groups 55-59 and 60-64.
Proportions dying (9X) at ages 9S and over, where the available data are especially scanty and unreliable, are not based on actual statistics at these ages. In part, this is also true of ages 85-94. Thus, the life table functions at ages 85 and above may not represent actual conditions, and, in fact, the proportions dying at ages 95 and over have the same numerical values in all nine tables.
A later publication will contain a complete description of the adjustments made in the basic data and of the methods and formulas by which the life tables were prepared.
Measures of Comparative longevity
The life table provides a convenient tool for comparing the longevity of different populations or of different subdivisions of a population. The customary measure of longevity is the average duration of life, also called the expectation of life at birth. This is the average number of years lived by the members of the life table cohort. Based on the mortality experience of 1959-61, the expectation of life at birth is 67.55 years for white males, 74.19 for white females, 61.48 for nonwhite males, and 66.47 for nonwhite females. These values reflect the higher mortality of males over females and of nonwhites over whites. Expectation of life at birth for white females is 6.64 years longer than for white males, and the corresponding excess for nonwhite females over non-white males is 4.99 years. However, because of the substantial y higher mortality of nonwhites over whites, the expectation of life at birth for white males exceeds that for nonwhite females by 1.08 years.
Expectation of life at birth (~ o) is strongly affected by the relatively large number of deaths occurring during the first year of life. In comparing the longevity of different populations, it may be desired to consider also expectation of life at age one ( ~1) , since this measure is not affected by the infant mortality rate. Indeed, as shown in tables 1-9, ($, is greater than ~~ in all population groups; those persons in the
hypothetical cohort who survive the hazards of infancy exhibit an increase in the average number of years of life remaining over the number expected when they were 1 year younger. The 1959-61 values of ~1 are 68.34 years for white males, 74.68 for white females, 63.50 for nonwhite males, and 68.10 for nonwhite females. The increase in expectation of life at age 1 over age O is substantial for nonwhite males and females (2. 02 and 1.63 years, respectively) but much less for white males and females (0.79 and 0.49 years, respectively); this reflects the higher infant mortality of the nonwhite population.
It may be of interest for certain purposes to examine average remaining lifetime at other ages. For example, ages 21, 62, and 65 may be regarded as representing, respectively, the attainment of adulthood, the minimum retirement age prescribed by the Social Security Act, and the normal retirement age. The 1959-61 values of expectation of life at age 21 are 49.33 years for white males, 55.32 for white females, 44.89 for nonwhite males, and 49.12 for nonwhite females. Corresponding values for age 62 are 14.75,18.13, 14.26, and 16.72 years; and for age 65 they are 12.97, 15.88, 12.84, and 15.12 years.
The concept of “expectation of life” is misleading if it is taken to imply the notion of fore-casting. It is important to understand that expectation of life values forecast average remaining lifetime only for the hypothetical cohort of the life table. Comparable forecasts for any actual population would have to take into consideration future mortality trends as well as current mortality rate ~+.
Another possible yardstick for comparing the longevity of different populations is the median length of life, or “probable lifetime, ” which is the age at which exactly half the members of the original life table cohort have died. When the cohort starts with 100,000 births, this would be the age at which there are just 50,000 survivors. Easily calculated from the ZXvalues in the life tables, the median length of life at birth, based on the mortality rates of 1959-61, is 71.45 years for b white males, 78.46 for white females, 65.62 for nonwhite males, and 70.61 for nonwhite females. In calculating the median length of life it is assumed that deaths are evenly distributed within the age interval containing the median age.
4
Page 6
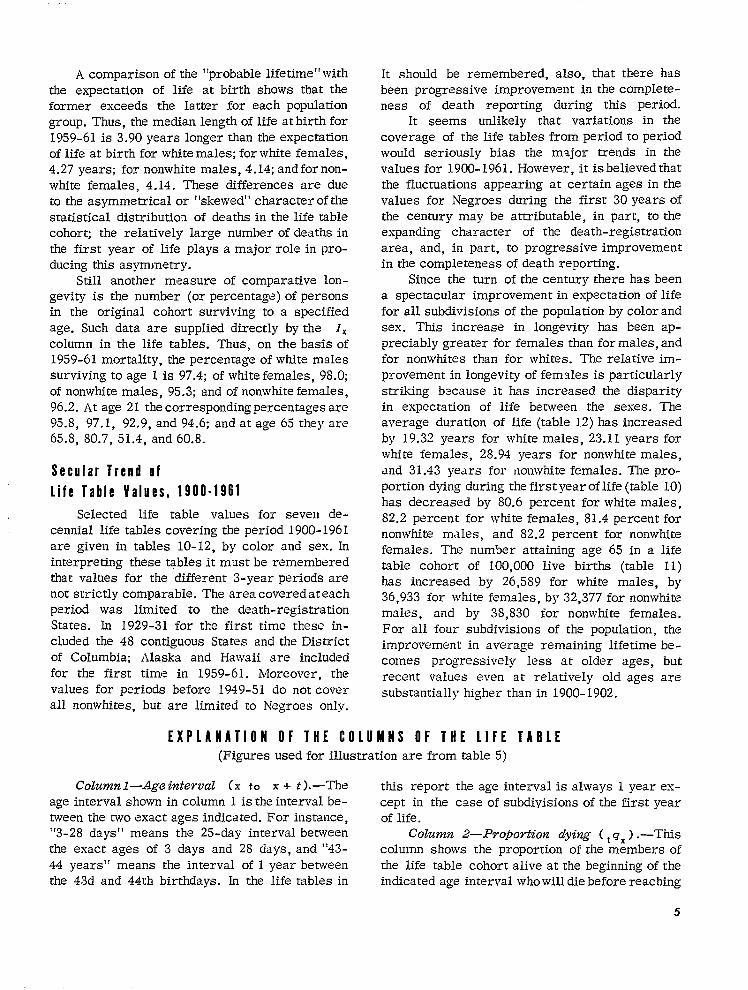
A comparison of the “probable lifetime” with the expectation of life at birth shows that the former exceeds the latter for each population group. Thus, the median length of life at birth for 1959-61 is 3.90 years longer than the expectation of life at birth for white males; for white females, 4.27 years; for nonwhite males, 4.14; and for non-white females, 4.14. These differences are due to the asymmetrical or “skewed” character of the statistical distribution of deaths in the life table cohorq the relatively large number of deaths in the first year of life plays a major role in producing this asymmetry.
Still another measure of comparative longevity is the number (or percentage) of persons in the original cohort surviving to a specified age. Such data are supplied directly by the 1~ column in the life tables. Thus, on the basis of 1959-61 mortality, the percentage of white males surviving to age 1 is 97.4; of white females, 98.0; of nonwhite males, 95.3; and of nonwhite females, 96.2. At age 21 the corresponding percentages are 95.8, 97.1, 92.9, and 94.6; and at age 65 they are 65.8, 80.7, 51.4, and 60.8.
Secular Trend of
life Table Values, 1900-1961
Selected life table values for seven decennial life tables covering the period 1900-1961 are given in tables 10-12, by color and sex. In interpreting these tables it must be remembered that values for the different 3-year periods are not strictly comparable. The area covered at each period was limited to the death-registration States. In 1929-31 for the first time these included the 48 contiguous States and the District of Columbia; Alaska and Hawaii are included for the first time in 1959-61. A40reover, the values for periods before 1949-51 do not cover all nonwhites, but are limited to Negroes only.
It should be remembered, also, that there has been progressive improvement in the completeness of death reporting during this period.
It seems unlikely that variations in the coverage of the life tables from period to period would seriously bias the major trends in the values for 1900-1961. However, it is believed that the fluctuations appearing at certain ages in the values for Negroes during the first 30 years of the century may be attributable, in part, to the expanding character of the death-registration area, and, in part, to progressive improvement in the completeness of death reporting.
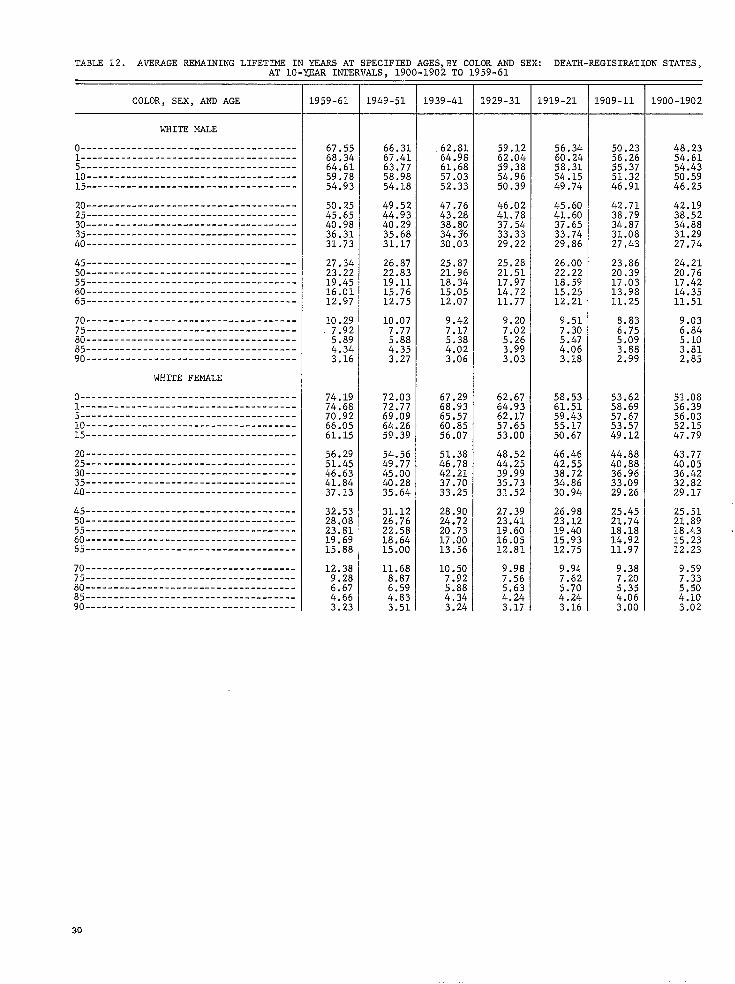
Since the turn of the century there has been a spectacular improvement in expectation of life for all subdivisions of the population by color and sex. This increase in longevity has been appreciably greater for females than for males, and for nonwhites than for whites. The relative improvement in longevity of females is particularly striking b?cause it has increased the disparity in expectation of life between the sexes. The average duration of life (table 12) has increased by 19.32 years for white males, 23.11 years for white females, 28.94 years for nonwhite males, and 31.43 j7fi?dC5 for nonwhite females. The pro-portion dying during the first year of life (table 10) has decreased by 80.6 percent for white males, 82.2 percent for white females, 81.4 percent for nonwhite males, and 82.2 percent for nonwhite females. The number attaining age 65 in a life table cohort of 100,000 live births (table 11) has increased by 26,589 for white males, by 36,933 for white females, by 32,377 for nonwhite males, and by 3S,830 for nonwhite females. For all four subdivisions of the population, the improvement in average remaining lifetime be-comes progressively less at older ages, but recent values even at relatively old ages are substantially higher than in 1900-1902.
EXPLANATION OF THE COLUMNS OF THE LIFE TABLE (Figures used for illustration are from table 5)
Column l—Age interval (x to x + t).—The age interval shown in column 1 is the interval be-tween the two exact ages indicated. For instance, “3-28 days” means the 25-day interval between the exact ages of 3 days and 28 days, and “43-44 years” means the interval of 1 year between the 43d and 44th birthdays. In the life tables in
this report the age interval is always 1 year except in the case of subdivisions of the first year of life.
Column 2—PYopoYtion dying ( ~q, ) .—Th.is column shows the proportion of the members of the life table cohort alive at the beginning of the indicated age interval who will die before reaching
5
Page 7
the end of that age interval (inmos Linstances, the next birthday). For example, for white males (table 5) in the age interval 3-28 days, the proportion dying is 0.00392—out of every 1,000 white male babies surviving 3 days after birth, 3.92 will die before reaching the age of 28 days. Similarly, for white males in the age interval 43-44 years, the proportion dying is 0.00454-out of every 1,000 white males reaching their 43d birthday, 4.54 would die before reaching their 44th birthday, on the basis of the mortality rates of 1959-61. When the age interval is 1 year, the symbol qX (instead of , qX) is generally used for the proportion dying.
Column 3—Nunzbcw WYViViW (Ix) .—’llk
column shows the number of persons, starting with a cohort of 100,000 live births, who survive to the exact age marking the beginning of the indicated age interval. Thus, out of 100,000 white male babies born alive, 98,418 will survive 3 days, 97,408 will complete the first year of life and enter the second, 95,755 will reach age 21, and 40,207 will live to age 75.
Column 4—Number dying (t dx ) .— This column shows the number dying in each successive age interval out of 100,000 live births. Thus, out of 100,000 white males born alive, 386 die be-tween the ages of 3 and 28 days, 2,592 die in the entire first year of life, and 415 in the year between their 43d and 44th birthdays. Evidently, each figure in column 4 is the difference be-tween two successive figures in column 3. When the age interval is 1 year, the symbol dX (instead of 1dX ) is generally used for the number dying.
Columns 5 and 6—Stationary population ( ~Lx and Tx ). — Suppose that a group of 100,000 persons like that assumed in columns 3 and 4 is born every year and that the proportions dying in each such group in each age interval throughout the lives of the members are exactly those shown in column 2. If there were no migration and if the births were evenly distributed over the calendar year, the survivors of these births would constitute what is called a stationary population—stationary because in such a population the number of persons living in any given age interval would never change. When an individual left an age interval, whether by death or by growing older and entering the next higher age interval, his place would immediately be taken by someone entering
from the next lower age interval. Thus, a census taken at any time in such a stationary community would always show the same total population and the same numerical distribution of that population among the various age intervaIs. In such a stationary population supported by 100,000 annual births, column 3 shows the number of persons who, each year, reach the exact age that m,zrks the beginning of the age interval indicated in column 1, and column 4 shows the number of per-sons who die each year in the indicated age interval.
column 5, ~Lx , shows the number of per-sons in the stationary population in the indicated age interval. For example, the figure shown for white males in the age interval 3-28 days is 6,722. This means that in a stationary population of white males supported by 100,000 annual births and with proportions dying in each age interval always in accordance with column 2, a census taken on any date would show 6,722 persons between the exact ages of 3 and 28 days. Similarly, the figure for white males in the year of life 43-44 is 91,198. Thus, the stationary population de-scribed would always contain 91,198 persons between their 43d and 44th birthdays. When the age interval is 1 year, the symbol L ~ is generally used instead of ~L ~ .
Column 6, T,, shows the total number of persons in the stationary population (column 5) in the indicated age interval and all subsequent age intervals. For example, in the stationary population of white males described in the pre-ceding paragraph, column 6 shows that there would be at any given moment a total of 6,754,034 per-sons who have survived at least 3 days following birth, and a total of 2,657,169 persons who have attained age 43. The population at all ages O and above (in other words, the total white male population of the stationary community) would be 6,754,846.
Column 7—AveYage Yemaining lifetime (&).-The average remaining lifetime (also called expectation of life) at any given age is the average number of years remaining to be lived by those surviving to that age, on the basis of a given set of age-specific rates of dying. In order to relate these figures to the preceding columns of the life table it is necessary to observe that the figures in column 5 of the life tables can also be interpreted
6
Page 8
in terms of a single life table cohort without introducing the concept of the stationar y population. From this point of view, each figure in column 5 represents the total time (in years) lived be-tween two indicated exact ages by all those reaching the earlier age among the survivors of a cohort of 100,000 iive births. Thus, the figure 6,722 for white males in the age interval 3-28 days is the total number of years of life lived between the exact ages of 3 and 28 days by the 98,418 (column 3) who reached the age of exactly 3 days out of 100,000 white males born alive. The corresponding figure (6,754 ,034 ) in column 6 is the total number of years lived after attaining the age of 3 days by the 98,418 reaching that exact age. Similarly, the figure 91,198 in column 5 for white males in the year of life 43-44 is the total number of years lived between their 43d and 44th birthdays by the 91,406 (column 3) who reached the 43d birthday out of the original cohort of 100,OOO,and the corresponding figure (2,657, 169) in column 6 is the total
number of years lived after attaining age 43 by the 91,406 reaching that age.
This number of years divided by the number of persons (2,657,169 divided by 91,406) gives 29.07 years as the average remaining lifetime at age 43. A similar division of 6,754,034 by 98,418 gives 68.63 years as the average remaining life-time at the age of 3 days.
Care must be exercised in drawing conclusions from the figures in column 7. Thus, in observing that the average remaining lifetime of white persons is greater than that of nonwhites, one should not conclude that the oldest ages reached by white persons necessarily exceed those attained by the most long-lived among the non-white. The difference in average length of life results from the fact that a greater proportion of nonwhites die before reaching old age. For example, the proportion surviving to age 65 is far greater among whites than among nonwhites; yet the average length of life remaining at age 65 is nearly the same for both groups.
7
Page 9
TABLE 1. LIFE TABLE FOR TRR TOTA.L POPULATION: UNITED STATES, 1959-61
AGE INTERVAL” PROPORT ION OF 100,000 BORN ALIVE STATIONARY POPULAT ION
DYING
Proportion
Period of life between two ages
alive at >eginning of age interval iying during
1iving at beginning of age interval
Wmber dying during
age interval
In the age interval
and all subsequent age intervals
interval
(1) (.2) (3) (4) (5) (6)
Xtox+f tqx lx ,Lx T,
of persons Number In this
DAYS
o-1 . . . . . . . . . . . . . . . . 0.01031 100*OOO 1,031 272 6,989,030 1-3................ .00456 98,969 451 541 6,988,758 3-28 ............... .00399 98,518 392 6,728 6,988,217 28-365 ............. .00732 98,126 719 90,274 6,981,489
YEARS
o-1 . . . . . . . . . . . . . . . . .02593 100,000 2,593 97,815 6,989,030 1-2 . . . . . . . . . . . . . . . . .00170 97,407 165 97,324 6,891,215 2-3 . . . . . . . . . . . . . . . . .00104 97,242 101 97,192 6.793.891 3-4 . . . . . . . . . . . . . . . . .00080 97,141 78 97, 102 6;696;699 4-5 . . . . . . . . . . . . . . . .00067 97,063 65 97,031 6,599,597
5-6 . . . . . . . . . . . . . . . . .00059 96,998 57 96,969 6,502,566 6-7 . . . . . . . . . . . . . . . . .00052 96,941 50 96,916 6,405,597 7-a . . . . . . . . . . . . . . . . .00047 96,891 46 96,068 6,308,681 8-9 . . . . . . . . . . . . . . . . .00043 96,845 42 96,824 6,211,813 9-10 . . . . . . . . . . . . . . . .00039 96,803 38 96,784 6,114,989
10-11 .............. .00037 96,765 36 96,747 6,018,205 11-12 .............. .00037 96,729 36 96,711 5,921,458 12-13 .............. .00040 96,693 39 96,674 5,824.747 13-14 .............. .00048 96,654 46 96,630 5,728,073 14-15 .............. .00059 96,608 57 96,580 5,631,443
15-16 . . . . . . . . . . . . . . .00071 96,551 68 96,517 5,534,863 16-17 . . . . . . . . . . . . . . .00082 5’6,483 80 96,443 5,438,346 17-18 . . . . . . . . . . . . . . .00093 96,403 89 96,358 5,341.903 18-19 . . . . . . . . . . . . . . .00102 96,3L4 98 96,265 5,245,545 19–20 . . . . . . . . . . . . . . .00108 96,216 105 96,163 5,L49,280
20-21 . . . . . . . . . . . . . . .00115 96,111 110 96,056 5,053,117 21-22 . . . . . . . . . . . . . . .00122 96,001 118 95,942 4,957,061 22-23 . . . . . . . . . . . . . . .00127 95,883 122 95,822 4,861,119 23-24 . . . . . . . . . . . . . . .00128 95,761 123 95,700 4,765,297 24-25 . . . . . . . . . . . . . . .00127 95,638 121 95,578 4,669,597
25-26 .............. .00126 95,517 120 95,456 4,574,019 26-27 .............. .00125 95*397 120 95,337 4,478,563 27-28 .............. .00126 95,277 120 95,217 4,383,226 28-29 .............. .00130 95,157 123 95,095 4,288,009 29-30 .............. .00136 95,034 129 94,970 4,192,914
30-31 . . . . . . . . . . . . . . .00143 94,905 13.5 94,836 4,097,944 31-32 . . . . . . . . . . . . . . .00151 94,769 143 94,698 4,003,108 32-33 . . . . . . . . . . . . . . .00160 94,626 151 94,551 3,908,410 33-34 . . . . . . . . . . . . . . .00170 94,475 160 94,395 3,813,859 34-35 . . . . . . . . . . . . . . .00181 94.315 171 94,229 3,719,464
35-36. . . . . . . . . . . . . . .00194 94, 14!+ 183 94,053 3,625,235 36-37 . . . . . . . . . . . . . . .00209 93,961 196 93,863 3,531,182 37-38 . . . . . . . . . . . . . . .00228 93,765 214 93,658 3,437,319 38-39 . . . . . . . . . . . . . . .00249 93,551 232 93,435 ~,343,661 39-40 . . . . . . . . . . . . . . .00273 93,319 255 93,191 3,250,226
40-41 .............. .00300 93,064 279 92,925 3,157,035 41-42 .............. .00330 92,785 306 92,632 3,064,110 42-43 .............. .00362 92,479 335 92,311 2,971,478 43-44 .............. .00397 92,144 366 91,961 2,879,167 44-45 .............. .00435 91,778 400 91,578 2,787,206
45-46 .............. .00476 91,378 435 91,161 2,695,628 46-47 .............. .00521 90,943 473 90,707 2,604,467 47-48 .............. .00573 90.47’0 519 90,210 2,513,760 48-49 .............. .00633 89,951 569 89,667 2,423,550 49-50 .............. .00700 89,382 626 89,069 2,333,883
AVERAGEREMAINING LIFETINE
Averagenumber of
rears of liferemaining at>eginning of~ge interval
(7)0
ex
69.89?0.6270.9371.15
69.8970.7569.8768.9467.99
67.0466.0865.1164.1463.17
62.1961.2260.2459.2658.29
57.3356.3755.4154.4653.52
52.5851.6450.7049.7648.83
47.8946.9546.0045.0644.12
43.18 42.24 41.30 40. 3-I 39.44
38.51 37.58 36.66 35.74 34.83
33.9233.0232.1331.2530.37
29.5028.6427.7926.9426.11
8
Page 10
TABLE 1. LIFI,TA13LX FOR THE TOTAL POPULATION: UNITED STATES, 19S9-6I—Con.
PROPORTIONAGE INTERVAL DYING OF 100,000 BORN ALIVE STAT IONARY POPULATION.
Proportionof persons Number In this
Period of life alive at living at Number dying In the age and allduringbetween two ages >eginning of >eginning of age interval interval subsequentage interval
iying during >ge interval age intervals
interval
(1) (2) (3) (4) (5) (6)
Xtox+t tqx lx ,dx ~Lx Tx
YEARS
50-51 .............. .00774 88,756 687 88,412 2,244,814 51-52 .............. .00852 88,069 751 07,693 2,156,402 52-53 .............. .00929 87,318 811 86,913 2,068,709 53-s4 .............. .01005 86,507 870 86,072 1,981,796 54-55 .............. .C1082 85.637 926 85,174 1,895,724
55-56 . . . . . . . . . . . . . . .01161 84,711 983 84.220 1,810,550 56-57 . . . . . . . . . . . . . . .01249 83,728 1s047 83,204 1,726,330 57-58 . . . . . . . . . . . . . . .01352 82,68L 1.117 82,123 1,643,126 58-59 . . . . . . . . . . . . . . .01473 81,564 1,202 80,962 1,561,003 59-60 . . . . . . . . . . . . . . .01611 80,362 1,295 79,715 1,480,041
60-61 . . . . . . . . . . . . . . .01761 79,067 1,392 78,371 1,400.326 6L-62 . . . . . . . . . . . . . . .01917 77,675 1,489 76,930 1,321,955 62-63 . . . . . . . . . . . . . . .C2082 76,186 1,586 75,393 1,245,025 63-64 . . . . . . . . . . . . . . .02252 74,600 1,680 73,760 1,169,632 64-65 . . . . . . . . . . . . . . .02431 72,920 1,773 72,033 1,095,872
65-66 . . . . . . . . . . . . . . .C2622 71,147 1,866 70,214 1,023,839 66-67 . . . . . . . . . . . . . . .02828 69,281 1,959 68,302 953,625 6-i-68 . . . . . . . . . . . . . . .03053 67.322 2*055 66,295 885,323 68-69 . . . . . . . . . . . . . . .03301 65,267 2,155 64,189 819,028 69-70 . . . . . . . . . . . . . . .03573 63,112 2,255 61,985 754,839
70-71 . . . . . . . . . . . . . . .03866 60,857 2s352 59,681 692,854 71-72 . . . . . . . . . . . . . . .04182 58,505 2,447 57,282 633,173 72-73 . . . . . . . . . . . . . . .04530 56s058 2,539 54,788 575,891 73-74 . . . . . . . . . . . . . . .04915 53*519 2,631 52,204 521,103 74-75 . . . . . . . . . . . . . . .05342 50,880 2,718 49,529 460,899
75-76 .............. .05799 48,170 2,794 46,773 419,370 76-77.............. .C6296 45,376 2,857 43.948 372,597 77-78.............. .06867 42,519 2,920 41,059 328,649 78-79.............. .07535 39*599 2,983 38,108 287,590 79-80 .............. .08302 36,616 3,040 35,096 249.402
80-81 .............. .09208 33,576 3,092 32, o3O 214,386 81-82 . . . . . . . . . . . . . . .10219 30,484 3,115 28.926 182,356 82-83 . . . . . . . . . . . . . . .11244 27,369 3,078 25,830 153,430 83-84 . . . . . . . . . . . . . . .12195 24,291 2,962 22.811 127,600 84-85 . . . . . . . . . . . . . . .13067 21,329 2,787 19*935 104.789
85-86 .............. .14380 18,542 2,666 17,209 84,854 86-87.............. .15816 15,876 2,511 14s 620 67,645 87-88.............. .17355 13,365 2,320 12,205 53,025 88-89 .............. .19032 11,045 2,102 9.995 40,820 89-90 .............. .20835 8,943 1,863 8,011 30,825
90-91 . . . . . . . . . . . . . . .22709 7,080 1,608 6,276 22,814 91-92 . . . . . . . . . . . . . . .24598 5,472 1,346 4,799 16,538 92-93 . . . . . . . . . . . . . . .26477 4,126 1,092 3,580 11.739 93-94 . . . . . . . . . . . . . . .28284 3,034 858 2.605 8.159 9+95 . . . . . . . . . . . . . . .29952 2,176 652 1,849 5;554
95-96 .............. .31416 1,524 479 1,285 3,705 96-97 .............. .32915 1,045 344 873 2,420 97-98.............. .34450 701 241 580 1,547 98-99 .............. .36018 460 166 377 967 99-100 ............. .37616 294 111 239 590
100-101............ .39242 183 72 147 351 101-102 . . . . . . . . . . . . .40891 111 45 89 204 102-103 . . . . . . . . . . . . .42562 66 28 52 115 103-104 . . . . . . . . . . . . .44250 38 17 29 63 104-105 . . . . . . . . . . . . .45951 21 10 17 34
105-106 . . . . . . . . . . . . .47662 11 5 8 17 106-107 . . . . . . . . . . . . .49378 6 3 5 9 107-108 . . . . . . . . . . . . .51095 3 2 2 4 108-109 . . . . . . . . . . . . .52810 1 0 1 2 109-110 . . . . . . . . . . . . .54519 1 1 1 1
Averagenumber of
years of liferemaining at>eginning ofage interval
25.2924.4923.6922.9122.14
21.3720.6219.8719.1418.42
17.7117.0216.34L5.6815.03
14.3913.7613.1512.5511.96
11.3810.8210.279.749.21
8.718.217.737.266.81
6.395.985.615.254.91
4.584.263.973.703.45
3.223.022.852.692.55
2.432.322.212.102.01
1.911.831.751.671.60
1.53L.461.401.351.29
9
Page 11
TABLE 2. LIFE TABLE FOR TOTAL MALES: UNITED STATES, 1959-61
....
AGE INTERVAL’ - PROPORTION OF 100,000 BOLT ALIVE STATIONARY POPULATIONW~G
Proportionof persons Number In this
Period of life alive ac living at [umber dying In the age and all
duringage interval iying during ~ge interval age intervals
interval
(1) (2) (3) (4) (5) (6)
Xtox+t tqx lx ~dx ~Lx T,
DAYS
o-1 . . . . . . . . . . . . . . . . 0.01157 100*OOO 1,157 273 6,679,892 1-3................ .00532 98,843 526 539 6,679,6L9 3-28............... .00450 98,317 443 6,713 6,679,080 28-365 ............. .00805 97,874 787 90,010 6,672,367
YEARS
o-1 ................ .02913 100,000 2,913 97,535 6,679,892 1-2 . . . . . . . . . . . . . . . . .00181 97,087 176 96,999 6,582,357 2-3 . . . . . . . . . . . . . . . . .00115 96.911 111 96*e55 6,485,358 3-4 . . . . . . . . . . . . . . . . .00088 96,800 86 96,758 6,388,503 4-5 . . . . . . . . . . . . . . . . .00074 96,714 71 96,678 6,291,745
between two ages >eginning of >eginning of ~ge interval interval subsequent
5-6 . . . . . . . . . . . . . . . . .00066 96,643 63 96,612 6,195,067 6-7 . . . . . . . . . . . . . . . . .00060 96,580 58 96,551 6,098,455 7-8 . . . . . . . . . . . . . . . . .CO055 96.522 53 96,496 6,001,904 8-9 . . . . . . . . . . . . . . . . .00051 96,469 49 96,445 5,905,408 9-10 . . . . . . . . . . . . . . . .00047 96,420 45 96,398 5,808,963
1!3-11.............. .00044 96,375 42 96,354 5,712,565 11-12.............. .00044 96,333 43 96,312 5,616,211 12-13.............. .00050 96,290 48 96,266 5,519.899 13-14.............. .00062 96,242 60 96,212 5,423,633 14-15.............. .00078 96,182 75 96,145 5,327,421
15-16 . . . . . . . . . . . . . . .00097 96,107 93 96,060 5,231,276 16-17 . . . . . . . . . . . . . . .00114 96,014 109 95,960 5,135,216 17-18 . . . . . . . . . . . . . . .00131 95,905 126 95,842 5,039,256 18-19 . . . . . . . . . . . . . . .00145 95,779 138 95,710 4,943,414 19-20 . . . . . . . . . . . . . . .00156 95,641 150 95,566 4,847,704
20-21 . . . . . . . . . . . . . . .00169 95,491 161 95,411 4,752,138 21-22 . . . . . . . . . . . . . . .00180 95,330 172 95,244 4,656,727 22-23 . . . . . . . . . . . . . . .00187 95,158 177 95,069 4,561,483 23-24 . . . . . . . . . . . . . . .00187 94,981 178 94,892 4,466,4L4 24-25 . . . . . . . . . . . . . . .00181 94,803 172 94,717 4,371,522
. 25-26 . . . . . . . . . . . . . . .C0175 94,631 165 94,549 4,276.805 26-27. . . . . . . . . . . . . . .00169 94,466 160 94,386 4, L82,256 27-28 . . . . . . . . . . . . . . .00167 94,306 158 94,227 4,087,870 28-29 . . . . . . . . . . . . . . .00169 94,148 158 94,069 3,993,643 29-30 . . . . . . . . . . . . . . .00174 93,990 164 93,908 3,899,574
30-31 . . . . . . . . . . . . . . .00181 93,826 170 93,741 3;805,666 31-32 . . . . . . . . . . . . . . .00189 93,656 177 93,567 3,711,925 32-33 . . . . . . . . . . . . . . .00199 93,479 186 93,386 3,618,358 33-34 . . . . . . . . . . . . . . .00210 93,293 196 93,195 3,524,972 34-35 . . . . . . . . . . . . . . .00224 93,097 208 92,993 3,431,777
35-36 . . . . . . . . . . . . . . .00240 92,089 223 92,777 3,338,784 36-37 . . . . . . . . . . . . . . .00259 92.666 24o 92,546 3,246.007 37-3e . . . . . . . . . . . . . . .00281 92,426 260 92,297 3, L53,461 38-39 . . . . . . . . . . . . . . .00308 92,166 283 92,024 3,061,164 39-40 . . . . . . . . . . . . . . .C0338 91,883 311 91,727 2,969,140
40-41 . . . . . . . . . . . . . . .C0373 91,572 342 91,401 2,877,413 41-42 . . . . . . . . . . . . . . .00412 91,230 376 91,042 2,786.012 42-43 . . . . . . . . . . . . . . .00455 90,854 413 90,647 2,694,970 43-44 . . . . . . . . . . . . . . .00501 90,441 453 90,215 2,604,323 44-45 . . . . . . . . . . . . . . .C0551 89,988 496 89,739 2,514.108
45-46 . . . . . . . . . . . . . . .00605 e9.492 542 89,221 2,424,369 46-47 . . . . . . . . . . . . . . .00665 88,950 591 88,655 2,335,148 47-48 . . . . . . . . . . . . . . .C0735 88,359 650 88,033 2,246,493 48-49 . . . . . . . . . . . . . . .00818 87,709 717 87,351 2,158,460 49-50 . . . . . . . . . . . . . . .00911 06,992 793 86,595 2,071,109
AVERAGEREMAININGLIFETINB
Averagenumber of
7ears of life:emaining at>eginning ofIge interval
(7)
66.8067.5867.9368.17
66.8067.8066.9266.0065.05
64.1063.1462.1861.2260.25
59.2758.3057.3356.3555.39
54.4353.4852.5451.6150.69
49.7748.8547.9447.0246.11
45.19 44.27 43.35 42.42 41.49
40.5639.6338.7137.7836.86
35.9435.0334.1233.2132.31
31.4230.5429.6628.8027.94
27.0926.2525.4224.6123.81
10
Page 12
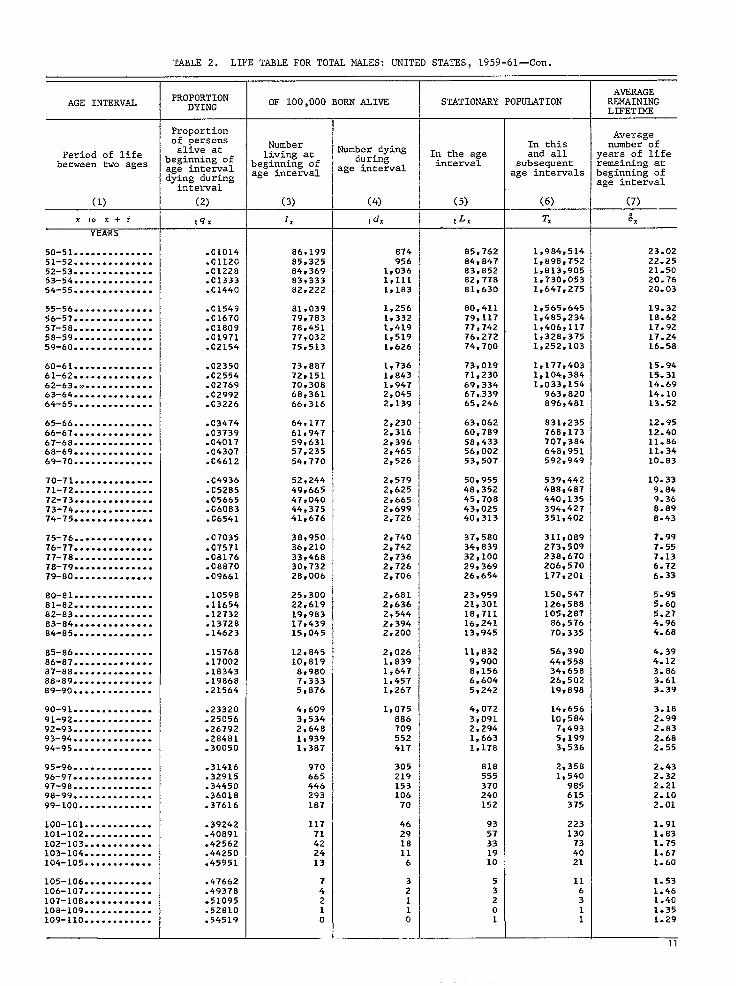
TA81’E 2. LIFE TABLE FOR TOTAL MALES: UNITED STATES, 1959-61—Con.
AGE INTERVAL PROPORTION OF 100,000 BORN ALIVE STATIONARY POPULATION
DYING
Proportionof persons Number In this
Period of life alive at living at Number dying In the age and allduringbetween two ages >eginning of >eginning of age interval interval subsequentZge interval Ige interval lge intervalsiying during
interval
(1) (2-J (3) (4) (5) (6)
Xtox+t tqx 1, , d. T=
YEARS
50-51.............. .01014 86,199 874 85,762 1,984,514 51-52.............. .01120 85,325 956 84,847 1,898,752 52-53.............. .C1228 84,369 1,036 83,852 1,813,905 53-54 .............. .C1333 83,333 1,111 82,778 1,730,053 54-55.............. .C1440 82,222 1,183 81,630 1,647,275
55-56.............. .C1549 81,039 1,256 80,411 1,565,645 56-57.............. .C1670 79,783 1,332 79,117 1,485,234 57-58.............. .C1809 78,451 1,419 77,742 1,406,117 58-59 .............. .01971 77,032 1,519 76,272 1,328,375 59-60 .............. .C2154 75,513 1,626 74,700 1,252.103
60-61.............. .C2350 73.887 1,736 73,019 1,177,403 61-62 .............. .C2554 72,151 1,843 71,230 1,104,384 62-63 .0............ .02769 70,308 1,947 69,334 1,033.154 63-64.............. .C2992 68,361 2,045 67,339 963,820 64-65 .............. .C3226 66,316 2,139 65,246 896,481
65-66 .............. .C3474 64,177 2,230 63,062 831,235 66-67.............. .03739 61,947 2,316 60,789 768,173 67-68.............. .04017 59,631 2.396 58*433 707,384 68-69 .............. .C4307 57,235 2,465 56,002 648,951 69-7’0.............. .C4612 54.770 2,526 53,507 592.949
70-71 .............. .C4936 52,244 2,579 50,955 539,442 71-72.............. .C5285 49,665 2,625 48,352 488,487 72-?3 .............. .05665 47,040 2,665 45,7o8 440,135 73-74 .............. .06083 44,375 2.699 43,025 394,427 74-75.............. .C6541 41,676 2,726 40,313 351,402
75-76 .............. .07035 38,950 2,740 37,580 311,089 76-77.............. .07571 36,210 2,742 34,839 273,509 77-78.............. .08176 33,468 2,736 32,100 238,670 78-79.............. .08870 30,732 2.726 29,369 206,570 79-80 .............. .09661 28.006 2,706 26,654 177,201
80-81.............. .10598 25,300 2.681 23,959 150,547 81-82 .............. .11654 22,619 2,636 21,301 126,588 82-83 .............. .12732 19,983 2,544 18,711 105,287 83-84 .............. .13728 17*439 2*394 16,241 86,576 84-05.............. .14623 15,045 2,200 13,945 70.335
85-86.............. .15768 12,845 2,026 11,832 56,390 86-87 .............. .17002 10,819 1.839 9,900 44,558 87-88.............. .i8343 8,980 1,647 8,156 34,658 88-89 .............. .19868 7.333 1,457 6.604 26,502 89-90.............. .21564 5,876 1,267 5,242 19,898
90-9 L.............. .23320 4,609 1,075 4,072 1+,656 9L-92 .............. .25056 3*534 886 3,091 10,584 92-93 .............. .26792 2,648 709 2,294 7,493 93-94 .............. .28481 1,939 552 1,663 5,199 94-95 .............. .30050 1.387 417 1,178 3,536
95-96 .............. .31416 970 305 818 2,358 96-97.............. .32915 665 219 555 1,540 97-98 .............. .34450 446 153 370 985 98-99 .............. .36018 293 106 240 615 99- LOO............. .37616 187 70 152 375
100-lG1............ .39242 117 46 93 223 101-102............ .40891 71 29 57 130 102-1C3............ .42562 +2 18 33 73 103-104............ .44250 24 11 19 40 104-105............ .45951 13 6 10 21
105-106............ .47662 7 3 5 11 106-107............ .49378 4 2 3 6 107-108............ .51095 2 1 2 3 108-109 ............ .52810 1 1 0 1 109-110............ .54519 0 0 1 1
AVFR4GERF.MAININGLIFETIME
Averagenumber of
7ears of lifezemaining at>eginning of>ge interval
(7)
23.0222-2521.5020.7620.03
19.3218.6217.92L7.2416.58
15.9415.3114.6914.1013.52
12.9512-4011.86lL.3410-83
10.339.849.368.898.43
7.997.557.136.726.33
5.955.6o5.274.964.68
4.394.123.863.613.39
3.182.992.832.682.55
2.432.322.212.102.01
1.911.831.751.671.60
1.531.461.401.35L.29
11
Page 13
TABLE 3. LIFE TABLE FOR TOTAL FEMALES: UNITED STATES, 1959-61
PROPORT IONAGE INTERVAL DYING OF 100,000 BORN ALIVE STATIONARY POPULATION
Proportionof persons Number In this
between two ages >eginning of ]ge interval lying during
>eginning of age interval
during q;e interval interval subsequent
)ge intervals
interval
(1) (.2) (3) (4) (5) (6)
Xtox+f lx ~dx T,
DAYS
o-1 . . . . . . . . . . . . . . . . 0.00898 100,000 898 272 7,324,402 1-3................ .00376 99,102 372 542 7,324,130 3-28 ............... .00345 98,730 341 6,744 7,323,588 28-365 ............. .C0656 98,389 645 90,551 7,316,844
YEARS
o-1................ .02256 100,000 2,256 98,109 7,324.402 1-2................ .00158 9-7.744 155 97,666 7,226,293 2-3 . . . . . . . . . . . . . . . . .00093 97,589 91 97,544 7,L28,627 3-4 . . . . . . . . . . . . . . . . .CO071 97,498 69 97,463 7,031,083 4-5 . . . . . . . . . . . . . . . . .00060 97.429 58 97,400 6,933,620
5-6 . . . . . . . . . . . . . . . . .00052 97,371 51 97,346 6,836,220 6-7 . . . . . . . . . . . . . . . . .00045 97.320 43 97,298 6,738,874 7-8 . . . . . . . . . . . . . . . . .00039 97,277 39 97,258 6,641,576 8- ’3 . . . . . . . . . . . . . . . . .00035 97,238 34 97,221 6,544,318 9-10 . . . . . . . . . . . . . . . .00032 97.204 31 97,189 6,447,097
10-11.............. .CO030 97,173 29 ’97,159 6,349,908 11-12.............. .00029 97,144 28 97,129 6,252,749 12-13.............. .00030 97,116 30 97,101 6,155,620 13-14.............. .00034 97,086 33 97,070 6,058,519 14-15.............. .00038 97,053 37 97,035 5,961,449
15-16.............. .00044 97,016 43 96,995 5,864,414 16-17.............. .00050 96,973 48 96,949 5,767,419 17-18.............. .00055 96,925 53 96,898 5,670,470 18-19.............. .00059 96,872 57 96,844 5,573,572 19-20.............. .00061 96,815 59 96,785 5,476,728
Period of life alive at living at (umber dying In the age and all
20-21 . . . . . . . . . . . . . . .00064 96,756 62 96,725 5,379,943 21-22 . . . . . . . . . . . . . . .00067 96,694 65 96,662 5,283,218 22-23 . . . . . . . . . . . . . . .00070 96,629 68 96,596 5,186,556 23-24 . . . . . . . . . . . . . . .00073 96,561 70 96,526 5,089,960 24-25 . . . . . . . . . . . . . . .00076 96,491 73 96,454 4,993,434
25-26 .............. .00079 96,4M 76 96,380 4,896,980 26-27 .............. .00082 96,342 80 96,302 4,800,600 27-28.............. .CO087 96,262 83 96,221 4,704,298 2a-29.............. .00092 96,179 89 96.134 4,608,077 29-30 .............. .00098 96,090 9’4 96; 043 4,511,943
30-31 . . . . . . . . . . . . . . .00106 95,996 102 95,945 4;415.900 31-32 . . . . . . . . . . . . . . .00114 95,894 109 95,840 4,319.955 32-33 . . . . . . . . . . . . . . .00122 95,785 117 95,727 4,224,115 33-34 . . . . . . . . . . . . . . .C013L 95,668 125 95,605 4,128,388 34-35 . . . . . . . . . . . . . . .00140 95,543 134 95,476 4,032,783
35-36 . . . . . . . . . . . . . . .C0151 95,409 144 95,337 3,937,307 36-37 . . . . . . . . . . . . . . .00163 95,265 155 95,187 3,841,970 37-38 . . . . . . . . . . . . . . .00177 95,110 168 95,025 3,746,783 38-39 . . . . . . . . . . . . . . .00192 94,942 183 94,851 3,651,758 39-40 . . . . . . . . . . . . . . .00210 94,759 199 94.659 3,556,907
40-41 . . . . . . . . . . . . . . .00230 94,560 217 94,451 3,462,248 41-42 . . . . . . . . . . . . . . .00251 94,343 237 94,225 3,367,797 42-43 . . . . . . . . . . . . . . .00274 94,106 258 93,976 3,273,572 43-44 . . . . . . . . . . . . . . .00298 93,848 28o 93,708 3,179,596 44-45 . . . . . . . . . . . . . . .00324 93,568 303 93,417 3,085,888
45-46 . . . . . . . . . . . . . . .00351 93,265 327 93,102 2,992,471 46-47 . . . . . . . . . . . . . . .00381 92,938 355 92,760 2,899,369 47-48 . . . . . . . . . . . . . . .00415 92,583 384 92,391 2,806,609 48-49 . . . . . . . . . . . . . . .00453 92,199 418 91,991 2,714,218
49-50 . . . . . . . . . . . . . . .00495 91,781 454 91,554 2,622,227
AVEk4GEREMAININGLIFETIME
Averagenumber of
rears of I,iferemaining at>eginning of~ge interval
(7)o ex
73.24 73.90 74.18 74.37
73.24 73.93 73.05
72.12 71.17
70.21 69.24 68.28 67.30 66.33
65.35 64.37 63.38 62-40 61.42
60.4559.4’758.5057.5456.57
55.6054.6453.6752.7151.75
50.79 49.83 48.87 47.91 46.96
46.00 45.05 44.10 43.15 42.21
41.27 40.33 39.39 38.46 37.54
36.61 35.70 34.79 33.88 32.98
32.09 31.20 30.31
29.44 28.57
12
Page 14
TABLE 3. LIFE TABLE FOR TOTAL FENALES: UNITED STATES, 1959-61—Con.
PROPORTIONAGE INTERVAL DYING
OF 100,000 BORN ALIVE STATIONARY POPULATION
Proportionof persons Number In this
between two ages beginning of age interval dying during
>eginning of age interval
during ige interval interval subsequent
age intervals
interval
(1) (2) (3) (4) (5) (6)
Xtox+f tqx lx *dx Tx YtARS
50-51 .............. .C0541 91,327 494 91,080 2,530,673 51-52.............. .00590 90,833 536 90,565 2,439,593 52-53.............. .C0639 90,297 577 90,008 2,349,028 53-54 .............. .C0686 89,720 616 89,412 2,259,020 54-55.............. .00733 89,104 653 88.778 2,169,608
55-56.............. .C0783 88,451 693 88,104 2,080,830 56-57.............. .00841 87,758 738 87,389 1,992,726 57’-58.............. .00911 87,020 793 86,623 1,905,337 58-59.............. .00997 86.227 860 85,797 1,818,714 59-60 .............. .01097 85,367 937 84,898 1,732,917
60-61 .............. .01209 84,430 1,021 83,919 1,648,019 61-62.............. .C1327 83,409 1,107 82,856 1,564,;00 62-63 .............. .C1451 82,302 1,194 81,705 1,481,244 63-64.............. .C1578 81,108 1,280 80,468 1,399,539 64-65.............. .01711 79.828 1,366 79,145 1,319,071
65-66.............. .C1854 78,462 1,454 77*735 1,239,926 66-67.............. .C2014 77,008 1,551 76,233 1,162,191 67-68 .............. .C2199 75,457 1,659 74,627 1,085,958 60-69 .............. .C2415 73,798 1,782 72,907 1,011,331 69-70 .............. .02661 72,016 1,916 71,057 938,424
70-71 .............. .02929 70,100 2,053 69,074 867,367 71-72 .............. .03219 68,047 2,191 66,951 798,293 72-73 .............. .03546 65,856 2,335 64,689 73L,342 73-74.............. .03914 63,521 2,486 62,278 666,653 74-75.............. .04327 61,035 2,641 59,714 604,375
75-76 .............. .C4767 58,394 2,784 57,002 544,661 76-77.............. .05246 55,610 2,917 54,152 487,659 ?7-78.............. .05$304 52,693 3,058 51,164 433* 507 78-79.............. .C6469 49,635 3,211 48,030 382,343 79-80.............. .07240 46,424 3,361 44,743 334,313
80–81 .............. .C814+ 43,063 3,508 41,309 289,570 81-82 .............. .09143 39,555 3,616 37,747 248,261 82-83 .............. .10154 35*939 3,649 34,114 210,514 83-84 .............. .11096 32,290 3,583 30,498 176,400 84-85 .............. .11975 28.707 3,438 26,988 145,902
85-86.............. .13423 25,269 3,392 23,573 118,914 86-87 .............. .15009 21,877 3,284 20,235 95,341 87-88.............. .16689 18,593 3,103 L7,042 75,106 88-89.............. .18478 15,490 2.862 14,059 58,064 69-90 .............. .20364 12.628 2,572 11,343 44,005
90-91 .............. .22329 10,056 2,245 8.933 32,662 91-92 .............. .24327 7.811 1,900 6,861 23,729 92-93 .............. .26302 5,911 1,555 5,134 16,86B 93-94 .............. .28181 4,356 1,227 3,742 11,734 94-95 .............. .29903 3,129 936 2,661 7,992
95-96 .............. .31416 2,193 689 1,848 5,331 96-97 .............. .32915 1,504 495 1,257 3,483 97-98 .............. .34450 1,009 348 835 2,226 ‘38-99.............. .36018 661 238 542 1,391 99-lCO............. .376L6 423 159 344 849
100-101............ .39242 264 104 212 505 101-102 ............ .40891 160 65 128 293 102-103............ .42562 95 41 74 165 103-104 ............ .44250 54 24 43 91 104-105............ .45951 30 14 23 48
105-106............ .47’662 16 7 12 25 106-107............ .49378 9 5 7 13 107-108............ .51095 4 2 3 6 108-109............ .52810 2 1 2 3 109-110 ............ .54519 1 1 0 1
Period of life alive at living at Wnnber dying In the age and all
AVEIWGERENAININGLIFETIMR
Averagenumber of
years of liferemaining at>eginning ofage interval
(7)
27.7126.8626.0125.1824.35
23.5322.7121.9021.0920.30
19.5218.7518.0017.2616.52
15.8015.0914.3913.7013.03
12.3711.7311.1110.499.90
9.338.778.237.707.20
6.726.285.865.465.08
4.714.364.043.753.48
3.253.042.852.692.55
2.432.322.212.102.01
1.91”1.831.751.671.60
1.531.461.401.351.29
Page 15
TABLE 4. LIFE TABLE FOR TOTAL WHITES: UNITED STATRS, 1959-61
PROPORTIONAGE INTERVAL DYING OF 100,000 BORN ALIVR STATIONARY POPULATION
Proportionof persons Number In this
Period of life alive at living at
lumber dying In the age and allduringbetween two ages )eginning of >eginning of Lge interval interval subsequentIge intervallying during 3ge interval lge intervals
interval
(1) (2) (3) (4) (5) (6)
Xtox+t Iqx lx , dx ~Lx T,
DAYS
o-1 . . . . . . . . . . . . . . . . 0.00957 100*OOO 957 273 7,073,023 1-3................ .00433 99,043 428 541 7,072,750 3-28............... .00343 98,615 339 6,737 7,072,209 28-365 ............. .00572 98,276 562 90,484 7,065,472
YEARS
o-1 . . . . . . . . . . . . . . . . .02286 100,000 2,286 98,035 7,073,023 1-2................ .00144 97,714 141 97,643 6,974,980 2-3................ .00092 97,573 90 97,528 6,877,345 3-4................ .00072 97,483 70 97,449 6,779,817 4-5................ .00062 97,413 60 97,383 6,682,368
5-6................ .00055 97,353 54 97,326 6,584, 85 6-7................ .00049 97,299 48 97,275 6,487,6% 9 7-a................ .00045 97.251 43 97,230 6,390,384 8-9................ .00041 97,208 40 97,188 6,293, L54 %lo............... .00038 97,168 37 97,L49 6,195,966
10-11.............. .00035 97,131 34 97,115 6,098,817 11-12.............. .CO035 97,097 34 97,080 6,001,702 12-13.............. .00038 97,063 37 97,045 5,904,622 13-14.............. .00046 97,026 44 97,004 5,807,577 14-15.............. .00056 96,982 54 96,955 5,710,573
15-16.............. .00068 96,928 66 96,895 5,613,618 16-17.............. .00079 96,862 76 96,825 5,516,723 17-18.............. .00089 96,7J36 06 96,742 5,419,898 18-19.............. .00096 96,70 O 94 96,653 5,323,156 19-20.............. .00102 96,606 98 96,558 5,226,503
20-21.............. .00107 96,508 103 96,456 5,129,945 21-22.............. .00113 96,405 109 96,350 5,033,489 22-23 .............. .00116 96,296 112 96,240 4,937,139 23-24 .............. .00116 96,1B4 111 96, 129 4,840,899 24-25 .............. .00113 96,073 108 96,0~9 4,744,770
25-26 .............. .00110 95,965 106 95,912 4,648,751 26-27 .............. .00108 95,859 103 95,8o8 4,552,839 27-28 .............. .00107 95,756 103 95,705 4,457,031 28-29.............. .0010’3 95,653 104 95,601 4,361,326 29-30.............. .00114 95.549 109 95,494 4,265,725
30-31.............. .00120 95,440 114 95,382 4;170,231 31-32.............. .00126 95,326 121 95,266 4,074,849 32-33 .............. .00134 95,205 127 95, 141 3,979.583 33-34.............. .00142 95,078 135 95,011 3,884,442 34-35 .............. .00152 94,943 145 94,870 3,789,431
35-36.............. .00164 94*790 155 94,720 3,694,561 36-37 .............. .00178 94,643 168 94,559 3,599,841 37-38 .............. .00194 94*475 183 94,383 3,505,282 38-3~.............. .00213 94.292 201 94,192 3,4L0,899 39-40.............. .00235 94,091 221 93,980 3,316,707
40-41 .............. .00260 93,870 244 93, 748 3,222,727 41-42.............. .00287 93,626 269 93,491 3,128,979 42-43 .............. .00318 93.357 296 93,209 3,035,488 43-44 .............. .C0351 93,061 327 92,898 2,942,279 44-45 .............. .!20388 92,734 360 92,553 2,849,381
45-46 .............. .00428 92,374 396 92, 176 2,756,828 46-47.............. .00472 91,978 434 91,761 2,664,652 47-48 .............. .00522 91,544 478 91,305 2,572,891 48-49 .............. .00579 91,066 527 90,802 2,481,586 49-50 .............. .C0642 90,539 581 90.249 2,390,784
AVEFL4GEREMAININGLIFETIMR
Averagenumber of
Tears of liferemaining at>eginning ofige interval
(7)0ex
70.7371.4171.7271.89
70.7371.3870.4869.5568.60
67.6466.6865.7164.7463.77
62.7961.8160.8359.8658.88
57.9256.9556.0055.0554.10
53.1652.2151.2750.3349.39
48.4447.5046.5545.6044.64
43.6942.7541.8040.8639.91
38.9738.0437.1036.1735.25
34.3333.4232.5131.6230.73
29.8428.9728.1127.2526.41
14
Page 16
TABLE 4. LIFE TABLE FOR TOTAL WHITES: UNITED STATES. 1959-61—Cur:.
PROPORTIONAGE INTERVAL DYING OF 100,000 BORN ALIVE STATIONARY POPULATION
Proportionof persons Number In this
between two ages >eginning of age interval iying during
>eginning of ~ge interval
during age interval interval subsequent
age intervals
interval
(1) (2) (3) (4) (5) (6)
YEARS
50-51 .............. .00711 89,958 639 89,638 2,300,535 51-52 .............. .00784 89,319 701 88,969 2,21 O,I397 52-53 .............. .C0857 88,618 759 88,239 2,121,928 53-54 .............. .C0928 87,859 815 87,451 2,033,689 54-55 .............. .01000 87,044 871 86,608 1,946,238
55-56 .............. .01075 86,173 927 85,710 1,859,630 56-57 .............. .01160 85.246 988 84,752 1,773,920 57-58 .............. .01259 84;258 1,061 83.727 1,68’2,168 58-59 .............. .01377 83,197 1,145 82,625 1,605,441 59-60 .............. .01512 82,052 1,241 81,431 1,522,816
60-61 .............. .01659 80,811 1,340 80,141 1,441,385 61-62 .............. .01813 79,47L 1,441 78,75L 1,361,244 62-63 .............. .C1977 78,030 1,543 77,258 1,282,493 63-64 .............. .02148 76,487 1,642 75,666 1,205,235 64-65 .............. .02328 74,845 1.743 73*974 1,129,569
65-66 .............. .02521 73,102 1,842 72,181 1,055,595 66-67 .............. .C2730 71,260 1s946 70,287 983,414 67-68 .............. .C2959 69,314 2,051 68,289 913,127 68-69 .............. .03211 67,263 2,159 66,183 844,838 69-70 .............. .03487 65,104 2,270 63,969 778,655
70-71 .............. .03784 62,834 2,378 61.645 714,686 71-72.............. .C4105 60,456 2,482 59,215 653,041 72-73 .............. .C4462 57,974 2.587 56.681 593.826 73-74 .............. .04864 55,387 2;693 54,040 537, L45 74-75 .............. .05312 52,694 2,799 51,294 483.105
75-76 .............. .C57’35 49,895 2,892 48.449 431,811 76-77 .............. .C6320 47,003 2,971 45,518 383.362 77-78 .............. .06916 44,032 3,045 42,50’7 337,844 78-79 .............. .07602 40,987 3,116 39,430 295,335 79-80 .............. .C8382 37,871 3,174 36,284 255,905
80-81 .............. .09299 34,697 3,226 33,084 219.621 81-82 .............. .10324 31,471 3,249 29.846 186,537 82-83 .............. .11370 28,222 3s209 26,617 156,691 83-84 .............. .12350 25,013 3,089 23,468 130.074 84-85 .............. .13260 21,924 2,907 20,471 106,606
85-86 .............. .14602 19,017 2,777 17,628 86,135 86-87 .............. .16065 16,240 2,609 14*935 68,507 87-88 .............. .17624 13,631 2,402 12,430 53.572 88-89 .............. .19307 11,229 2,168 10,145 41,142 89-90 .............. .21102 9,061 1,912 8, 104 30,997
90-91 .............. .22955 7,149 1,641 6,329 22,893 91-92 .............. .24814 5,508 1,367 4,824 16,564 92-93 .............. .26656 4,141 1,104 3,589 11,740 93-94 .............. .28421 3,037 863 2,6o6 8,151 94-95 .............. .30035 2, L74 653 1,847 5*545
95-96 .............. .31416 1,521 478 1.282 3,698 96-97 .............. .32915 1,043 343 872 2,416 97-98 .............. .34450 700 241 579 1.544 98-99 .............. .36018 459 165 376 965 99-100 ............. .37616 294 111 239 589
100-101 ............ .39242 183 72 147 350 10L-102 ............ .40891 111 45 88 203 102-103 ............ .42562 66 28 52 115 103-104 ............ .44250 38 17 29 63 104-105 ............ .45951 21 10 17 34
Period of life alive at living at
Number dying In the age and all
Xtox+f tqx
105-106 ............ .47662 11 8 17106-107 ............ .49378 6 5 9107-108 ............ .51095 3 2 4108-109 ............ .52810 1 1 2109-110 ............ .54519 1 1 1
—..
AVER4GEREMAININGLIFET’INE
Averagenumber of
fears of liferemaining at>eginning ofIge interval
(7)
25.5724.7523.9423.1522.36
21.58 ,20.8120.0519.3018.56
17.8417.1316.4415.7615.09
14.447.3.8013.1712.5611.96
11.3710.8010.249.709.17
8.658.167.677.216.76
6.335.935.555.204.86
4.534.223.933.663.42
3.203.012.842.682.55
2.432.322.212.102.01
1.911.831.751.671.60
1.531.461.401.351.29
15
Page 17
TABLE 5. LIFE TABLE FOR WHITE MALES: UNITED STATES, 1959-61
PROPORTIONAGE INTERVAL DYING OF 100,000 BORN ALIVE STATIONARY POPULATION
Proportionof persons
Number In this
between two ages beginning of age interval dying during
>eginning of *ge interval
during age interval interval subsequent
age intervals
interval
(1) (2) (3) (4) (5) (6)
Xtox+t tqx J, ,dx ,Lx T, DAYS
o-1 . . . . . . . . . . . . . . . . 0.01079 100,000 1,079 272 6,754,846 1-3................ .00509 98,921 503 540 6,754,574 3-28............... .00392 98,418 386 6,722 6,754,034 28-365 ............. .00636 98,032 624 90.230 6,747,312
YEARS
o-1................ .02592 100,000 2,592 97,764 6,754,846 1-2................ .00153 97,408 149 97,334 6,657,082 2-3................ .00101 97,259 99 97,210 6,559,748 3-4................ .00081 97,160 78 97.121 6,462,538 4-5................ .CO069 97,082 67 97;048 6,365,417
5-6................ .00062 97,015 60 96,985 6,268,Z69 6-7................ .00057 96,955 55 96.927 6,171,3%4 7-8................ .00053 96,900 52 96,874 6,074,457 a-9................ .00049 96,848 47 96,825 5,977,583 9-10............... .00045 96,801 43 96,779 5,880,758
‘ 10-11.............. .00042 96,758 40 96,738 5,783,979 11-12.............. .CO042 96,718 40 96,698 5,687,241 12-13.............. .00047 96,678 46 96,655 5,590,543 13-14.............. .00059 96,632 56 96,604 5,493,888 14-15.............. .00075 96,576 73 96,539 5,397,284
15-16.............. .00093 96.503 90 96,458 5,300,745 16-17.............. .00111 96,413 107 96,359 5,204,287 17-18.............. .00126 96,306 121 96,246 5,107,928 18-19.............. .00139 96,185 134 96,118 5,011,682 19-20.............. .00149 96,051 143 95,979 4,915,564
20-21.............. .00159 95,908 153 95,831 4,819,585 21-22.............. .00169 95,755 162 95,674 4,723,754 22-23 .............. .00174 95,593 167 95,509 4,628,080 23-24.............. .00172 95,426 163 95*345 4,532,571 24-25 .............. .00165 95,263 157 95,184 4,437,226
25-26 .............. .00156 95,106 149 95,032 4,342,042 26-27 .............. .00149 94,957 141 94,887 4,247,010 27-28 .............. .00145 94,816 13i 94,747 4,152,123 2a-29.............. .00145 94.679 137 94,611 4,057,376 29-30 .............. .00149 94,542 141 94,471 3,962,765
30-31.............. .00156 94,401 147 94,327 3,868,294 31-32.............. .C0163 94,254 154 94,177 3,773,967 32-33 .............. .00171 94,100 161 9+,020 3,679,790 33-34.............. .00181 93,939 170 93,855 3,585,770 34-35.............. .CO193 93,769 180 93,679 3,491,915
35-36.............. .00207 93,589 194 93,491 3,398,236 36-37.............. .C0225 93,395 210 93,290 3,304,745 37-38.............. .00246 93,185 229 93,070 3,211,455 38-39.............. .00270 92,956 251 92,830 3,118,385 39-40 .............. .00299 92.705 278 92,566 3,025,555
40-41 .............. .00332 92,427 306 92.274 2,932,989 41-42.............. .00368 92,121 339 91,952 2,840,715 42-43 .............. .C0409 91.782 376 91,594 2,748,763 43-44 .............. .00454 91,406 415 91,198 2,657.169 44-45 .............. .00504 90,991 458 90,762 2,565,971
Period of life alive at living at
Number dying In the age and all
45-46.............. .C055B 90,533 505 90,280 2,475,20946-47.............. .00617 90.028 556 89.751 2,384,92947-4a .............. .00686 89,472 613 89.165 2,295,17848-49 .............. .00766 88,859 681 88;519 2,206,01349-50.............. .00856 88,178 754 87,801 2,117,494
Averagenumber of
years of lj-feremaining atbeginning ofage interval
(7)0
ex
67.5568.2868.6368.83
67.5568.3467.4566.5165.57
64.6163.6562.6961.7260.75
59.7858.8057.8356.8555.89
54.9353.9853.0452.1051.18
50.2549.3348.4147.5046.58
45.6544.7343.7942.8541.92
40.9840.0439.1038.1737.24
36.3135.3834.4633.5532.64
31.7330.8429.9529.0728.20
27.3426.4925.6524.8324.01
16
Page 18
TABLE 5. LIFE TABLE FOR WHITE MALES: UNITED STATES, 1959-61-Con.
PROPORTIONAGE INTRRVAL DYING OF 100,000 BORN ALIVE STATIONARY POPULATION
Proportionof persons Number In this
Period of life alive at
living at Number dying In the age and all
between two ages ~ge interval iying during age interval age interval
interval age intervals
interval
(1) (2) (3) (4) (5) (6)
Xtox+t tqx ~dx ,Lx Tx
YEARS
50-51.............. .00955 87,424 835 87,007 2,029,693 51-52 .............. .clo5f 86,589 916 86,131 1,942,686 52-53 .............. .01162 85,673 995 85,176 1,856,555 53-54 .............. .C1264 84,678 1,071 84, M2 1,771,379 54-55.............. .C136E 83,607 1,144 83,035 1,687.237
55-56.............. .01475 82,463 1,216 81,855 1,604,202 56-57’.............. .C1592 81,247 1,295 80,599 1,522,347 57-5a.............. .0173C 79,952 1,383 79,261 1,441,748 58-59 .............. .01891 78,569 1,486 77,826 1,362,487 59-60.............. .C2C74 77,083 1,598 76,284 1,284,661
60-61 .............. .02271 75.485 1,714 74,628 1,208,377 61-62.............. .0247( 73,771 1,827 72,858 1,133,749 62-63 .............. .0269C 71,944 1*935 70,976 1,060,891 63-64 .............. .02912 70.009 2,039 68,990 989,915 64-65.............. .03142 67.970 2,136 66,902 920,925
65-66.............. .03385 65,834 2,231 64,718 854,023 66-67.............. .03652 63,603 2,323 62,441 789,305 67’-68.............. .0393C 61,280 2,409 60,076 726,864 68-69 .............. .C4225 58.871 2,487 57,627 666,788 69-70.............. .04538 56,384 2,559 55,105 609,161
70-71.............. .04871 53,825 2,621 52,514 554,056 71-72 .............. .0523C 51,204 2,678 49,865 501,542 72-73 .............. .0562? 48,526 2,729 47,161 451,677 73-74.............. .0606C 45*797 2,775 44,410 404,516 74-75.............. .06542 43,022 2,815 41,615 360.106
75-76.............. .07066 40,207 2,841 38,786 318,491 76-77.............. .C7636 37.366 2,853 35,940 279,705 77-78.............. .08271 34*513 2,855 33,056 243,765 78-79.............. .G8986 31,658 2,844 30,236 210,679 79-80.............. .0978a 28.814 2,821 27,403 180,443
80-81 . . . . . . . . . . . . . . .10732 25,993 2,789 24,599 153,040 81-82.............. .11799 23,204 2,738 21,835 128,441 82-83.............. .12895 20.466 2,639 19.146 106,606 83-84.............. .1392C 17,827 2,482 16.586 87,460 84-85.............. .14861 15*345 2,280 14,205 70,874
05-86 .............. .1603S 13,065 2,096 12,017 56.669 86-87 .............. .17303 10,969 1,898 10,020 44,652 87-88 .............. .18665 9,071 1,693 8,225 34,632 88-89.............. .20194 7,378 1,490 6,633 26,407 89-90 .............. .21877 5,888 1.288 5,244 19,774
90-91.............. .23601 4.600 1,086 4,058 14,530 91-92 .............. .25289 3,514 888 3,070 10,472 92-93 .............. .26973 2,626 709 2,271 7,402 93-94.............. .286L2 1,917 548 1,643 5,131 ‘94-95.............. .30128 1,369 413 1,163 3,488
95-96.............. .31416 956 300 806 2,325 96-97.............. .32915 656 216 548 1,519 97-98 .............. .34450 440 152 364 971 98-99.............. .36018 288 103 237 607 99-100 ............. .37616 185 70 150 370
100-101............ .39242 115 45 92 220 101-102............ .40891 70 29 56 128 102-103 ............ .42562 41 17 32 72 103-104 ............ .44250 24 11 19 40 104-105 ............ .45951 13 6 10 21
105-106............ .47662 7 3 6 11 106-107 ............ .49378 4 2 2 5 107-108 ............ .51095 2 1 2 3 108-109............ .52810 1 1 0 1 109-110............ .54519 0 0 1 1
>eginning 0 f beginning of during subsequent
—
AVERAGERENA ININGLIFETINE
Averagenumber of
years of liferemaining atbeginning ofage interval
(7)
23.2222.4421.6720.9220.18
19.4518.74lB.0317.3416.67
16.0115.3714.75L4.1413.55
12.9712.4111-8611.3310.80
10.299.809.318.838.37
7.927.497.066.656.26
5.895.545.214.914.62
4.344.073.823.583.36
3.162.982.822.682.55
2.432.322.212.102.01
1.911.831.751.671.60
1.531.461.401.351.29
17
Page 19
TABLE 6. LIFE TABLE FOR WHITE FEMALES: UNITED STATES, 1959-61
AGE INTERVAL PROPORTION OF 100,000BORN ALIVE STATIONARY POPULATIONDYING
Proportionof persons Number In this
Period of life alive at living at Number dying In the age and all
beginning of duringbetween two ages age interval >eginning of age interval interval subsequent
dying during ~ge interval age intervals
interval
(2) (3) (4) (5) (6)
Xtox+t tclx lx ,dx ,Lx T,
DAYs
o-1................ 0.00828 100,000 82a 272 7,419, 159 1-3................ .00353 99,172 350 542 7,418,aa7 3-28............... .00292 98,822 2a9 6,753 7,418,345 28-365 ............. .00505 9a,533 497 90,752 7,411,592
YEARS
o-l~ . . . . . . . . . . . . . . . .01964 100,000 1,964 9a,319 7,419,159 1-2................ .00135 98,036 132 97,970 7,320, a40 2-3................ .00081 97,904 80 97,864 7,222,870 3-4................ .00063 97,a24 62 97,793 7,125,006 4-5................ .00055 97,762 53 97,735 7,027,213
5-6................ .00047 97,709 46 97,6a6 6,929,478 6-7................ .00041 97,663 41 97,643 6.a31.792 7-8................ .00037 97,622 36 97,604 6,734, L49 8-9................ .00033 97,586 32 97,570 6,636,545 9-10............... .CO030 97,554 29 97,540 6,53a* 975
10-11 . . . . . . . . . . . . . . .Oooze 97,525 2a 97.511 6,441,435 11-12.............. .00028 97,497 27 97,4a3 6,343,924 12-13.............. .00029 97,470 2a 97,456 6,246,441 13-14.............. .00032 97,442 31 97,426 6,t4a,9a5 14-15.............. .00036 97,411 36 97,393 6,051,559
15-16.............. .00041 97,375 40 97,356 5,954,16616-17.............. .00047 97,335 45 97.312 5,a56,81017-18.............. .00051 97,290 50 97,265 5,759,49a18-19.............. .00054 97,240 52 97,215 5,662,233
.............. .00055 97,188 53 97,161 5.565,01a
20-21.............. .00056 97,135 55 97,107 5,467,a57 21-22 .............. .CO058 97,080 56 97,052 5,370,750 22-23 .............. .CO060 97,024 59 96,995 5,273,69a 23-24 .............. .00062 96,965 60 96.935 5,176,703 24-25.............. .00063 96,905 61 96.875 5,079,76a
25-26 .............. .00065 96,a44 63 96,a12 4,~7s2,893 26-27.............. .0006a 96,7al 66 96,748 4,aa6,0al 27-28.............. .00071 96,715 68 96,681 4,7a9,333 28-29 .............. .00074 96,647 72 96,611 4,692,652 29-30 .............. .00079 96,575 76 96,536 4,596,041
30-31.............. .000a5 96,499 82 96,45a 4,499,505 31-32.............. .00091 96,417 88 96,373 4,403,047 32-33.............. .00097 96,329 93 96,2a3 4,306,674 33-34.............. .00105 96,236 101 96,1a5 4,210,391 34-35.............. .00113 96,135 109 96,0al 4,114,206
35-36.............. .00122 96,026 117 95,967 4,0~a,125 36-37.............. .00133 95,909 127 95.a46 3,922,15a 37-38.............. .00145 95,7a2 139 95,712 3,a26,312 38-39.............. .00158 95,643 151 95,568 3,730,600 39-40.............. .00174 95.492 166 95,409 3,635,032
40-41 .............. .00190 95,326 181 95,236 3,539,623 41-42 .............. .00209 95,145 199 95,045 3,444,3a7 42-43 .............. .00229 94,946 218 94,837 3,349,342 43-44 .............. .00252 94,72a 239 94,609 3,254,505 44-45 .............. .00276 94,4a9 261 94,359 3,159,a96
45-46.............. .00303 94,228 285 94,0a6 3,065,537 46-47.............. .00331 93,943 311 93,787 2,97 L,451 47-48.............. .00362 93,632 339 93,462 2,877,664 48-49.............. .00396 93,293 370 93,108 2,784,202 49-50 .............. .00432 92,923 401 92,723 2,691,094
19-20
AVERAGEREMAININGLIFETINE
Averagenumber of
years of Liferemaining atbeginning ofage interval
74.1974.aI75.0775.22
74.1974.6873.7a72.a371.aa
70.9269.956a-986a.ol67.03
66.0565.0764.0963.1062.12
61.1560.1759.205a.2357.26
56.2955.3254.3553.3952.42
51.4550.4949.5248.5547.59
46.6345.6744.7143.7542.80
41.&1440.a939.9539.013a.07
37.1336.2035.2a34.3633.44
32.5331.6330.7329.842a.96
la
Page 20
TABLE 6. LIFE TABLE FOR WHITE FENALES: UNITED STATES, 1959-61—Con.
PROPORTION ALIVE STATIONARY POPULATIONAGE INTERVAL DYING OF 100,000 i3L3RN
Proportionof persons Number In this
between two ages ige interval ]eginning of
iying during
)eginning of ]ge interval
during Ige interval
interval subsequent Ige intervals
interval
(1) (2) (3) (4) (5)
Xtox+f t’?x , Cix ~Lx T,
YEARS
50-51 . . . . . . . . . . . . . . .00473 92,522 43a 92,302 2,598.371 51-52 . . . . . . . . . . . . . . .00517 92,084 476 91.846 2,506,069 52-53 . . . . . . . . . . . . . . .00560 91,608 512 91,352 2,414,223 53-54 . . . . . . . . . . . . . . .00601 91,096 548 90,822 2,322,871 54-55 . . . . . . . . . . . . . . .00642 90,548 581 90,258 2,232.049
55-56 . . . . . . . . . . . . . . .00687 89,967 618 89,657 2,141,791 56-57 . . . . . . . . . . . . . . .G0740 89,349 661 89,019 2,052,134 57-58 . . . . . . . . . . . . . . .C0805 88,688 714 88,331 1,963,115 5a-59 . . . . . . . . . . . . . . .00886 87,974 779 87,584 1,874,784 59-60 . . . . . . . . . . . . . . .00981 87,195 856 86,767 1,787,200
60-61 . . . . . . . . . . . . . . .C1C88 86,339 939 85,870 1,700s433 61-62 . . . . . . . . . . . . . . .01203 85,400 1,027 84,887 1,614,563 62-63 . . . . . . . . . . . . . . .01325 84,373 1,118 83,814 1,529,676 63-64 . . . . . . . . . . . . . . .01454 83.255 1*21O 82,650 1,445,862 64-65 . . . . . . . . . . . . . . .01592 82;o45 1;306 8L,392 1,363,212
65-66 . . . . . . . . . . . . . . .01742 80,739 1,406 80,036 1,281,820 66-67 . . . . . . . . . . . . . . .01909 79,333 1,515 78,575 1,201,784 67-68 . . . . . . . . . . . . . . .C2100 77,818 1,634 77,002 1,123,209 68-69 . . . . . . . . . . . . . . .C2319 76,184 1,766 75,301 1,046,207 69-70 . . . . . . . . . . . . . . .0256? 74,418 1,911 73,462 970,906
70-71 . . . . . . . . . . . . . . .02836 72,507 2,056 71.480 897,444 7L-7Z . . . . . . . . . . . . . . .03129 70,451 2,204 69,349 825,964 72-73 . . . . . . . . . . . . . . .03462 68,247 2,363 67,065 756.615 73-74 . . . . . . . . . . . . . . .03845 65,884 2,533 64,618 689,550 7’4-75 . . . . . . . . . . . . . . .C4278 63,351 2,710 61,996 624,932
75-76 . . . . . . . . . . . . . . .C4742 60,641 2.876 59,203 562,936 76-77 . . . . . . . . . . . . . . .C5245 57,?65 3,029 56,250 503,733 77-78 . . . . . . . . . . . . . . .C5827 54,736 3,190 53,141 447,483 78-79 . . . . . . . . . . . . . . .C6509 51,546 3*355 49,869 394,342 79-80 . . . . . . . . . . . . . . .C7294 48,191 3,515 46,433 344*473
eo-t?l . . . . . . . . . . . . . . .08213 44,676 3,670 42,841 298,040 81-82 . . . . . . . . . . . . . . .C9231 41,006 3,785 39,114 255,199 82-83 . . . . . . . . . . . . . . .10264 37.221 3,820 35,311 216.085 83-84 . . . . . . . . . . . . . . .11235 33.401 3,753 31,524 180,774 84-85 . . . . . . . . . . . . . . .12151 29,648 3,602 27,847 149,250
85-86 . . . . . . . . . . . . . . .13625 26,046 3*549 24,272 121,403 86-87 . . . . . . . . . . . . . . .15237 22,497 3,428 20,783 97,131 87-88 . . . . . . . . . . . . . . .16936 19,069 3,229 17,454 76.340 88-89 . . . . . . . . . . . . . . .18731 15,840 2,967 14,356 58;894 89-9 G . . . . . . . . . . . . . . .20611 12,873 2,654 LL.546 44,538
90-91 . . . . . . . . . . . . . . .22560 10,219 2,305 9,067 32.992 91-92 . . . . . . . . . . . . . . .24536 7.914 1,942 6,943 23,925 92-93 . . . . . . . . . . . . . . .26401 5,972 1,581 5,181 i6,982 93-94 . . . . . . . . . . . . . . .28322 4,391 1,244 3.769 11,801 94-95 . . . . . . . . . . . . . . .29908 3.147 944 2.675 8,032
95-96 . . . . . . . . . . . . . . .31416 2,203 692 1,858 5,357 96-97 . . . . . . . . . . . . . . .32915 1.511 497 1,262 3,499 97-9a . . . . . . . . . . . . . . .34450 1,014 349 839 2,237 98-99 . . . . . . . . . . . . . . .36018 665 240 545 1,398 99-100 . . . . . . . . . . . . . .37616 425 160 345 853
100-101 ............ .39242 265 104 214 508 101-102............ .4089L 161 66 128 294 102-103 ............ .42562 95 40 75 166 103-104 ............ .44250 55 24 42 91 104-105............ .45951 31 15 24 .49
Period of life alive at living at
lumber dying In the age and all
105-106............ .47662 16 7 12 25 106-107 ............ .49376 9 5 7 13 107-108............ .51095 4 2 3 6 108-109 ............ � .52810 2 1 2 3 109-110............ .54519 1 1 0 1
AVERAGEREMAININGLIFETIME
Averagenumber of
Tears of life:emaining at>eginning oflge interval
(7)
28.0827.2226.3525.5024.65
23.8122.9722.1421.3120.50
19.6918.9118.1317.3716.62
15.8815.1514.4313.7313.05
12.3811.7211.0910.479.86
9.288.728.187.657.15
6.676.225.815.415.03
4.664.324.003.723.46
3.233.022.842.692.55
2.432.322.212.102.01
1.911.831.751.671.60
1.531.461.401.351.29
19
Page 21
TABLE 7. LIFE TABLE FOR TOTAL NONWHITES: UNITED STATES, 1959-61
AGE INTERVAL PROPORTION OF 100,000 BORN ALIVE STATIONARY POPULATIONDYING
Proportionof persons
Number In thisPeriod of life alive at
living at Number dying In the age and all
age interval dying during age interval age interval
age intervals interval
(1) (2) (3) (4) (5) (6)
Xtox+t tqx ~dx ~Lx
DAYS
0-1 . . . . . . . . . . . . ...4 0.01435 100,000 1,43! 272 6,391,37! 1-3................ .0058C 98,565 571 538 6,391,10: 3-28 . . . . . . . . . . . ...< .00701 97,994 68E 6,682 6,390,56! 28-365 . . . . . . . . . . ..s .0161E 97,306 1,574 89,122 6,383,88:
between two ages beginning of oeginning of during
interval subsequent
o-1 . . . . . . . . . . . . . . . . .04268 100,000 4,26t 96,614 6,391,375 1-2................ .00313 95.732 30C 9!5,582 6,294,761 2-3................ .0017s 95.432 17C 95.348 6,199,17S 3-4 . . . . . . . . . . . . . . . . .00124 95,262 lle 95,202 6,103,831 4-5 . . . . . . . . . . . . . . . . .00097 95.144 93 95,090 6,008,62S
5-6 . . . . . . . . . . . . . . . . .00082 95,051 95,012 5,913,531 b-7 . . . . . . . . . . . . . . . . .00071 94,973 67 94,939 5,818,515 1-8 . . . . . . . . . . . . . . . . .00062 94,906 59 94,876 5,723,58C 8-9 . . . . . . . . . . . . . . . . .00056 94,847 53 94,820 5,628,704 9-10 . . . . . . . . . . . . . . . .00052 94,794 94,770 5,533,884
10-11 . . . . . . . . . . . . . . .00050 94,745 48 94,721 5,439,114 11-12 . . . . . . . . . . . . . . .00051 94,697 48 94,673 5,344,393 12-13 . . . . . . . . . . . . . . .00056 94,649 54 94,621 5,249,72C 13-14 . . . . . . . . . . . . . . .00065 94,595 62 94.565 5,155,09s 14-15 . . . . . . . . . . . . . . .00078 94*533 73 94;496 5,060,534
15-16 . . . . . . . . . . . . . . .00092 94,460 87 94,417 4,966,038 16-17 . . . . . . . . . . . . . . .00107 94,373 100 94,323 4,871,621 17-18 . . . . . . . . . . . . . . .00123 94,273 116 94,215 4,777,298 18-19 . . . . . . . . . . . . . . .00139 94,157 131 94,091 4,683,083 19-20 . . . . . . . . . . . . . . .00156 94,026 146 93,953 4,588,992
20-21 . . . . . . . . . . . . . . .00173 93,880 163 93,798 4,495,039 21-22 . . . . . . . . . . . . . . .00191 93*717 180 93,627 4,401,241 22-23 . . . . . . . . . . . . . . .00207 93.537 193 93,440 4,307,614 23-24 . . . . . . . . . . . . . . .00219 93,344 205 93,242 4,214,174 24-25 . . . . . . . . . . . . . . .00229 93,139 214 93,032 4,120,932
25-26 . . . . . . . . . . . . . . .00239 92,925 221 92,814 4,027,900 26-27 . . . . . . . . . . . . . . .00250 92,704 232 92,588 3,935,086 27-20 . . . . . . . . . . . . . . .00263 92,472 243 92,351 3.842,498 28-29 . . . . . . . . . . . . . . .00279 92,229 257 92.100 3,750,147 29-30 . . . . . . . . . . . . . . .00297 91,972 273 91,835 3,658,047
30-31 . . . . . . . . . . . . . . .00317 91,699 291 91,554 3,566,212 31-32 . . . . . . . . . . . . . . .00339 91,408 310 91,252 3,474,658 32-33 . . . . . . . . . . . . . . .00362 91,09s 329 90,934 3,383,406 33-34 . . . . . . . . . . . . . . .00386 90,769 351 90.593 3,292,472 34-35 . . . . . . . . . . . . . . .00412 90,418 312 90,232 3,201,879
35-36 . . . . . . . . . . . . . . .00439 90,046 395 89.849 3,111,647 36-37 . . . . . . . . . . . . . . .00469 89,651 421 89,440 3,021,798 37-38 . . . . . . . . . . . . . . .00505 89,230 451 89,005 2,932,358 38-39 . . . . . . . . . . . . . . .00548 88,779 486 88,535 2,843,353 39-40 . . . . . . . . . . . . . . .00596 88,293 527 88,030 2,754,818
40-41 . . . . . . . . . . . . . . .00650 87,766 570 87*4el 2,666,788 41-42 . . . . . . . . . . . . . . .00707 87, L96 617 86,887 2,579,307 42-43 . . . . . . . . . . . . . . .00760 86,579 658 86,251 2,492,420 43-44 . . . . . . . . . . . . . . .00t308 85,921 693 85,574 2,406.169 44-45 . . . . . . . . . . . . . . .00853 85,228 727 84,864 2;320;595
45-46 . . . . . . . . . . . . . . .00898 84,501 759 84,121 2,235,731 46-47 . . . . . . . . . . . . . . .00952 83.742 798 83,343 2,151,610 47-48 . . . . . . . . . . . . . . .01024 82,944 849 82,520 2,068,267 48-49 . . . . . . . . . . . . . . .01120 82,095 920 81,635 1,985,747 49-50 . . . . . . . . . . . . . . .01236 81,175 1,003 80,674 1,904,112
AVERAGEREMAINING LIFETIME
Averagenumber of
years of liferemaining atbeginning ofage interval
(7) o ex
63.91 64.84 65.21 65.61
63.91 65.75 64.96 64.07 63.15
62.21 61.26 60.31 59.35 58.38
57.41 56.44 55.47 54.50 53.53
52.57 51.62 50.68 49.74 48.81
47.88 46.96 46.05 45.15 44.25
43.35 42.45 41.55 40.66 39.77
38.89 38.01 37.14 36.27 35.41
34.56 33.71 32.86 32.03 31.20
30.39 29.58 28.79 28.00 27.23
26.46 25.69 24.94 24.19 23.46
20
Page 22
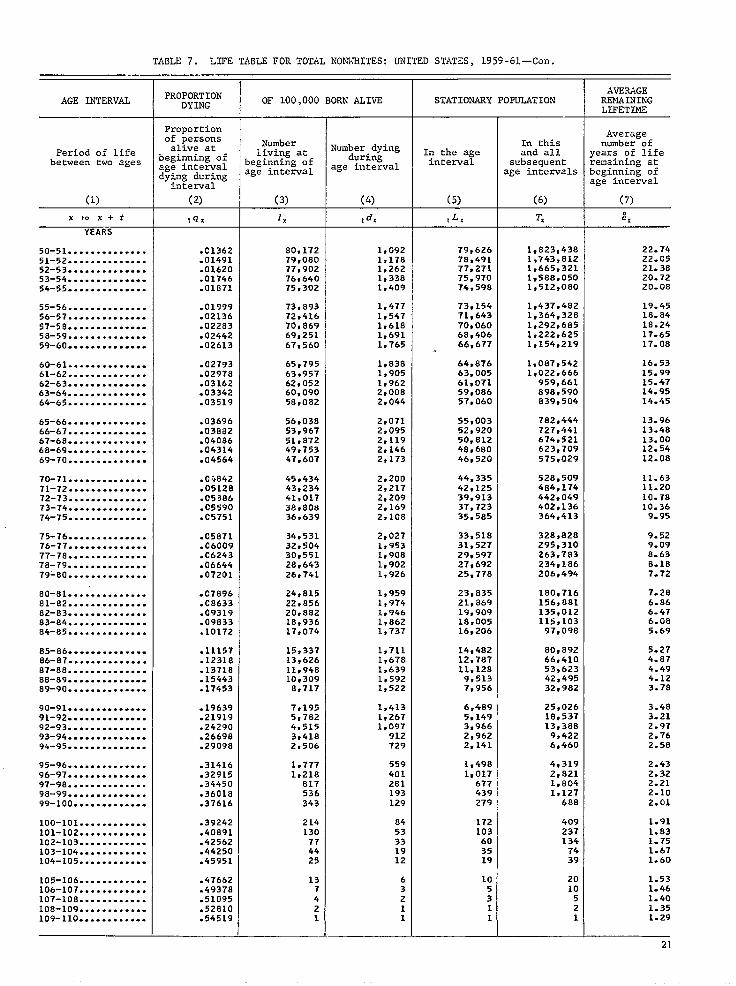
TABLE 7. LIFE TABLE FOR TOTAL NONWHITES: UNITED STATES, 1959-61—Con.
PROPORTIONAGE INTERVAL DYING OF 100,000 BORN ALIVE STATIONARY POPULAT ION
Proportion Averageof persons Number In this number of
Period of life alive at living at Wmber dying In the age and all years of lifeduringbetween two ages beginning of >eginning of ~ge interval interval subsequent remaining atage interval
interval ~ge interval
(1) (2) (3) (4) (5) (6) (7)
Xtox+t !Clx lx ,dx ~Lx Tx 0 ex
YEARS
50-51.............. .C1362 80,172 1,092 79,626 1,823,438 22.74 51-52.............. .01491 79,080 1,178 78.491 1,743,812 22.05 52-53.............. .01620 77,902 1,262 77,271 1,665,321 21.38 53-54.............. .01746 76,640 1,338 75;970 1.588,050 20.72 54-55.............. .01871 75,302 1.409 74,598 1,512,080 20-08
55-56.............. .01999 73,893 1,477 73*154 1,437.482 19.45 56-57 .............. .02136 72.416 1*547 7L,643 1,364,328 18.84 57-58.............. .02283 70,869 1,618 70,060 1,292,685 18.24 58-59 .............. .02442 69,251 1,691 68,406 1,222.625 17.65 59-60.............. .02613 67,560 1,765 66,677 1,154,219 17.08
60-61 .............. .02793 65,795 1.838 64,876 1,087,542 16.53 61-62 .............. .02978 63.957 1,905 63.005 1,022,666 15.99 62-63.............. .03162 62,052 1,962 61,071 959,661 15.47 63-64 .............. .03342 60,090 2.008 59,086 898,590 14.95 64-65.............. .03519 58,082 2,044 57.060 839.504 14.45
65-66 .............. .03696 56,038 2.071 55,003 782,444 13.96 66-67 .............. .03882 53,967 2,095 52,920 727,441 13.48 67-68 .............. .04086 51,872 2,119 50.812 674,521 13.00 68-69 .............. .04314 49.753 2.146 48;680 623,709 12.54 69-70 .............. .04564 47,607 2,173 46,520 575,029 12.08
70-71 .............. .0+842 45*434 2,200 44,335 528,509 11.63 71-72 .............. .05128 43,234 2,217 42.125 484,174 11.20 72-73.............. .05386 41,017 2,209 39,913 442,049 10.78 73-74 .............. .05590 38.808 2.169 37,723 402,136 10.36 74-75.............. .05751 36,639 2,108 35.58S 364,413 9.95
75-76 .............. .05871 34*531 2,027 33,518 328,828 9.52 76-77 .............. .06009 32,504 1,9s3 31,527 295,310 9.09 77-78 .............. .06243 30,551 1,908 29,597 263,783 8.63 78-79 .............. .06644 28,643 1.902 27,692 234,186 8.18 79-80 .............. .07201 26,741 1,926 25.778 206,494 7.72
80-81.............. .07896 24,81.5 1,959 23,835 180,716 7.28 81-82 .............. .08633 22,856 1,974 2L,869 156,881 6.86 82-83.............. .09319 20.882 1.946 19,909 135,012 6.47 83-84 .............. .09833 18,936 1,862 18,005 115,103 6.08 84-85 .............. .10172 17,074 1,737 16,206 97,098 5.69
85-86.............. .11157 15,337 1,711 14,482 80,892 5.27 86-87 .............. .12318 13,626 1,678 12,787 66,410 4.87 87-88.............. .13718 11,948 1,639 11,128 53,623 4.49 88-89.............. .15443 10,309 1.592 9,513 42,495 4.12 89-90.............. .17453 8,717 1,522 7,956 32,982 3.78
90-91 .............- .19639 7,195 1,413 6,489 25,026 3.48 91-92 .............. .21919 5,782 1,267 5,149 18,537 3.21 92-93 .............. .24290 4*515 1,097 3,966 13,388 2.97 93-94 .............. .26698 3,418 912 2,962 9,422 2.76 94-95 .............. .29098 2,506 729 2.141 6,460 2.58
95-96 .............. .31416 1.777 559 1,498 4.319 2.43 96-97 .............. .32915 1,218 401 1,017 2,821 2.32 97-98 .............. .34450 817 281 677 1.804 2.21 98-99.............. .36018 536 193 439 1,127 2.10 99-100 ............. .37616 343 129 279 688 2.01
100-101 ............ .39242 214 84 172 409 1.91 101-102 ............ .40891 130 53 103 237 1.83 102-103 ............ .42562 77 33 60 134 1.75 103-104 ............ .44250 44 19 35 74 1.67 104-105 ............ .45951 25 12 19 39 1.60
105-106 ............ .47662 13 6 10 20 1.53 106-107 ............ .4937a 7 3 5 10 1.46 107-108 ............ .51095 2 3 5 1.40 108-109 ............ .52810 1 1 1.35 109-110............ .54519 i I 1.29
dying during +ge interval age intervals >eginning of
21
Page 23
TABLE 8. LIFE TABLE FOR NONWHITE MALES : UNITED STATES, 1959-61
PROPORTIONAGE INTERVAL DYING OF 100,000 BORN ALIVE STATIONARY POPULATION
Proportionof persons Number In this
between two ages beginning of age interval dying during
>eginning 0f age interval
during xge interval interval subsequent
age intervals
interval
(1) (2) (3) (4) (5) (6)
Xtox+f t9x , dx ~Lx Tx
Dil ‘fS
o-1 . . . . . . . . . . . . . . . . 0.01594 100,000 1,594 271 6,148,198 1-3................ .00659 98,406 648 537 6,147,927 3-28............... .00773 $17,758 756 6,664 6,147,390 28-365 ............. .01753 97,002 1,701 88,782 6,140,726
YEARS
o-1................ .04699 100,000 4,699 96,254 6,140,198 1-2................ .00337 95,301 321 95,141 6,051,944 2-3................ .00197 94,980 187 94,887 5,956,803 3-4................ .00134 94,793 127 94,729 5,861,916 4-5................ .00102 94,666 96 94,618 5,767,187
5-6 . . . . . . . . . . . . . . . . .00087 94,570 83 94,528 5,672,569 6-7 . . . . . . . . . . . . . . . . .00076 94,487 72 94,451 5,578,041 7-a . . . . . . . . . . . . . . . . .00068 94,415 64 94,383 5,483,590 8-’9 . . . . . . . . . . . . . . . . .00063 94,351 60 94,321 5,389,207 9-10 . . . . . . . . . . . . . . . .00060 94,291 57 94,263 5,294,886
10-11.............. .00060 94,234 57 94,206 5,200,623 11-12.............. .00064 94.177 60 94,147 5,106,417 12-13.............. -00072 94,117 68 94,083 5,012,270 13-14.............. .00085 94,049 80 94,009 4,918,187 14-15.............. .00102 93,969 95 93,922 4,824,178
15-16.............. .00120 93,874 113 93,817 4,730,256 16-17.............. .00140 93,761 132 93,696 4,636,439 17-18.............. .00162 93,629 151 93,553 4,542,743 18-19.............. .00186 93,478 174 93,391 4,449,190 19-20.............. .00210 93,304 196 93,207 4,355,799
20-21.............. .00236 93,108 219 92,998 4,262,592 21-22 .............. .00262 92,889 244 92,767 4,169,594 22-23 .............. .00283 92,645 262 92,514 4,076,827 23-24.............. .00298 92,383 275 92,246 3,984,313 24-25 .............. .00307 92,108 283 91,966 3,892,067
Period of life alive at 1iving at lumber dying In the age and all
25-26.............. .00316 91,825 290 91,680 3,800,101 26-27 .............. .00327 91,535 299 91.385 3,708,421 27-28.............. .00339 91,236 310 91,082 3,617,036 2a-29 .............. .00353 90,926 321 90,765 3,525,954 29-30 .............. .00370 90,605 335 90.438 3,435,189
30-31.............. .00389 90,270 351 90,094 3,344,75L 31-32.............. .00409 89,919 367 89,736 3,254,657 32-33.............. .00431 89,552 386 89,358 3,164,921 33-34.............. .00455 89,166 406 88,963 3,075,563 34-35.............. .00483 88,760 429 88,546 2,986,600
35-36 .............. .00513 88,331 453 88,104 2,898,”054 36-37.............. .00546 87,876 479 87,639 2,809,950 37-38.............. .00585 87.399 512 87,143 2,722,3il 38-39.............. .00633 86,887 550 86,612 2,635,168 39-40 .............. .00688 86,337 593 86,040 2,548,556
40-41 . . . . . . . . . . . . . . .00749 85,744 643 85,423 2.462,516 41-42 . . . . . . . . . . . . . . .00814 85,101 692 84,754 2,377,093 42-43 . . . . . . . . . . . . . . .00875 84,409 739 84,040 2,292,339 43-.44 . . . . . . . . . . . . . . .C0931 83,670 779 83,280 2,208,299 44-45 . . . . . . . . . . . . . . .00984 82,891 816 82,484 2,125,019
45-46 . . . . . . . . . . . . . . .01038 82,075 851 81,650 2,042,535 46+7. . . . . . . . . . . . . . .01101 81,224 894 80,776 1,960,885 47-48 . . . . . . . . . . . . . . .01183 80,330 951 79,855 1,880,109 48-49 . . . . . . . . . . . . . . .01292 79,379 1,025 78,866 1,800,254 49-50 . . . . . . . . . . . . . . .01422 78,354 1,115 77,796 1,721,388
AVEMGEREMAININGLIFETIME
Averagenumber of
years of liferemaining at>eginning 0fage interval
(7)
61.48 62.48 62.88 63.31
61.48 63.50 62.7261.8460.92
59.9859.0358.0857.1256.15
55.19 54.22 53.26 52.29 51.34
50.3949.4548.5247.6046.68
45.7844.8944.0043.1342.26
41.38 40.51 39.65 38.78 37.91
37.0536.2035.3434.4933.65
32.8131.9831.1530.3329.52
28.72 27.93 27.16 26.39 25.64
24.8924.1423.4022.6821.97
22
Page 24
TABLE 8. LIFE TABLE FOR NONWHITE NALES: UNITED STATES, 1959-61—Con.
PROPORTIONAGE INTERVAL DYING OF 100,000 BORN ALIVE STATIONARY POPULATION
Proportionof persons Number In this
between two ages >eginning of Ige interval iying during
beginning of age interval
during age interval
interval subsequent Ige intervals
interval
(1) (2) (5) (6)
Xtox+t Iqx 1. , dx ~Lx T,
YEARS
50-51.............. .01565 77,239 1,208 76,636 1,643,592 51-52.............. .01710 76,031 1,300 75,380 1,566,956 52-53 .............. .C1854 74,731 1,386 74,039 1,491,576 53-54 .............. .C1994 73.345 1,462 72,6i4 1,417,537 54-55 .............. .02131 71,883 1,532 71,117 1,344,923
55-56 .............. .02273 70.351 1,599 69.552 1,273,806 56-57.............. .02427 68,752 1,668 67,918 1,204.254 57-58 .............. .02589 67,084 1,737 66.215 1,136,336 5a-59 .............. .02762 65,347 1,805 64,444 1,070,121 59-60.............. .02947 63,542 1,873 62,606 1,005,677
60-61 .............. .C3137 61,669 1,934 60,702 943,071 61-62 .............. .03335 59*735 1.992 58,739 882,369 62-63 .............. .03554 57*743 2.052 56,717 823,630 63-64 .............. .03801 55,691 2,117 54,632 766,913 64-65 .............. .04072 53,574 2,182 52,483 712,281
65-66 .............. .04365 51,392 2,243 50,270 659.798 66-67 .............. .04665 49,149 2,293 48,003 609,528 67-66 .............. .04953 46.856 2,321 45,696 561,525 68-69 .............. .05213 44*535 2.321 43,374 515,829 69-70.............. .C5448 42,214 2,300 41,064 472,455
70-71 .............. .C5690 39*9L4 2,271 38,778 431,391 7L-72 .............. .05944 37,643 2,238 36,525 392,613 72-73 .............. .C6177 35.405 2.186 34,312 356,088 73-74 .............. .06375 33,219 2,118 32,159 321,776 74-75 .............. .06548 31,101 2,037 30,083 289,617
75-76 .............. .06673 29.064 1,939 28,095 259,534 76-77.............. .06803 27,125 1,845 26,202 231,439 77-78.............. .0703? 25,280 1,779 24.390 205,237 78-79 .............. .07460 23,501 1,753 22,624 180,847 79-80 .............. .08065 21.748 1,754 20,871 158,223
80-81 .............. .08836 19,994 1,767 19,110 137,352 61-82.............. .09668 18,227 1,762 17,346 118,242 82-83.............. .10452 16.465 1,721 15,604 100.896 83-84 .............. .11038 14*744 1,627 13,931 85;292 84-85 .............. .11410 13,117 1,497 12,368 71,361
85-86.............. .12280 11,620 1,427 10,906 58,993 86-87 .............. .13313 10,193 1,357 9,515 48,087 87-88 .............. .14588 8,836 1,289 8,192 38,572 88-89 .............. .16219 ?.547 1,224 6,935 30,380 89-90.............. .18166 6,323 1,149 5,748 23.445
90-91 .............. .20304 5,174 1,050 4,650 17,697 91-92.............. .22519 4,124 929 3,659 13,047 92-93 .............. .24791 3*195 792 2,799 9,388 93-94 .............. .27050 2,403 650 2,078 6,589 94-95 .............. .29270 1,753 513 1,497 4,511
95-96 .............. .31416 1,240 390 1,045 3,014 96-97 .............. .32915 850 28o 710 1,969 97-98 .............. .34450 570 196 472 1,259 98-99 .............. .36018 374 135 307 787 99-100 ............. .37616 239 90 194 480
100-101 ............ .39242 149 58 120 286 101-102 ............ .40891 91 37 72 166 102-103 ............ .42562 54 23 43 94 103-104 ............ .44250 31 14 24 51 104-105 ............ .45951 17 8 13 27
Period of life alive at living ac Number dying
In the age and al1
105-106 ............ .47662 9 4 7 14106-107 ............ .49370 5 3 4 7107-108 ............ .51095 2 1 1 3108-109 ............ .52810 1 0 1 2109-110 ............ .54519 1 1 1 1
AVEPJiGEREMAININGLIFETIM3Z
Averagenumber of
years of liferemaining atbeginning ofage interval
(n
ex
21.2820.6119.9619.3318.71
18.1117.5216.9416.3815.83
-,15.2914.7714.2613.7713.30
L2.8412.4011.9811.5811.19
10.8110.4310.269.699.31
8.938.538.127.707-28
6.876.496.135.785.44
5.084.724.374.033.71
3.423.162.942.742.57
2.432.322.212.102.01
1.911.831.751.671.60
1.531.461.401.351.29
23
Page 25
TABLE 9. LIFE TABLE FOR NONWHITE FEMALES : UNITED STATES, 1959-61
PROPORTIONAGE INTERVAL DYING OF 100,000 BORN ALIVE STATIONARY POPULAT ION
Proportionof persons Number In this
Period of life alive at
living at Number dying In the age and allduringbetween two ages beginning of >eginning 0f age interval interval subsequentage interval
dying during age interval age intervals
interval
(1) (2) (3) (4) (5) (6)
Xtox+t tqx lx ,Lx T,— DAYS
o-1................ 0.01272 100,000 1,272 272 6,646,6431-3................ .00500 98,728 494 539 6,646,3713-28............... .00628 98,234 617 6,701 6,645,83228-365 ............. .C1480 97,617 1,445 89,468 6,639,131
YEARS
o-1................ .c3a2a 100,000 3,828 96,980 6,646,643 1-2 . . . . . . . . . . . . . . . . .00289 96,L72 278 96,034 6,549,663 2-3 . . . . . . . . . . . . . . . . .C0160 95,894 153 95,817 6,453,629 3-4 . . . . . . . . . . . . . . . . .00115 95,741 110 95,607 6,357,812 4-5 . . . . . . . . . . . . . . . . .00092 95,631 88 95,587 6,262,125
5-6 . . . . . . . . . . . . . . . . .00077 95*543 74 95,506 6,166,538 6-7 . . . . . . . . . . . . . . . . .00066 959469 63 95,437 6,071,032 7-8 . . . . . . . . . . . . . . . . .00056 95,406 53 95,380 5,975,595 8-9 . . . . . . . . . . . . . . . . .00049 95,353 46 95,330 5,680,215 9-10 . . . . . . . . . . . . . . . .00043 95,307 42 95,286 5,784,885
10-11.............. .CO040 95,265 37 95,24.$ 5,689,599 11-12.............. .00039 95,228 37 95,209 5,594,353 12-13.............. .00041 95,191 39 95,172 5,499,144 13-14.............. .00046 95,152 44 95, 129 5,403,972 14-15.............. .00053 95,108 51 95,083 5,308,843
15-16.............. .00063 95,057 59 95,028 5,213,760 16-17.............. .00073 94,998 70 94,963 5,118,732 17-18.............. .00084 94,928 79 94,888 5,023,769 18-19.............. .00094 94,849 90 94,804 4,928,881 19-20.............. .00104 94,759 99 94,710 4,834,077
20-21.............. .00116 9.4.660 109 94,606 4,739,367 21-22 .............. .00128 94,551 121 94,490 4,644,761 22-23 .............. .00140 94,430 133 94,363 4,550,271 23-24 .............. .00150 94,297 141 94,227 4,455,908 24-25.............. .00160 94,156 151 94,080 4,361,681
25-26.............. .00171 94,005 161 93,925 4,267,601 26-27 .............. .00182 93,844 171 93,758 4,173,676 27-28 .............. .C0197 93,673 184 93,581 4,079,910 28-29 .............. .00214 93,489 200 93,389 3,986,337 29-30 .............. .00234 93,289 219 93.179 3,892,948
30-31.............. .00256 93,070 238 92,951 3,799,769 31-32.............. .00279 92,832 259 92,702 3,706,818 32-33.............. .00303 92,573 281 92,433 3,614,116 33-34 .............. .00326 92,292 300 92,142 3,521,683 34-35 .............. .00350 91,992 322 91,830 3,429,541
35-36 .............. .00374 91,670 343 91,499 3,337,711 36-37.............. .00402 91,32’7 367 91,143 3,246,212 37-38.............. .00434 90,960 394 90,763 3,155,069 38-39.............. .00471 90,566 427 90,352 3,064,306 3+40 .............. .C0514 90.139 463 89,908 2,973,954
40-41 . . . . . . . . . . . . . . .00561 89,676 504 89,424 2,884,046 41-42 . . . . . . . . . . . . . . .00611 89,172 544 88,900 2,794,622 42-43 . . . . . . . . . . . . . . .C0656 88,628 582 88,337 2,705,722 43-44 . . . . . . . . . . . . . . .00696 88,046 612 87,740 2,617,385 44-45 . . . . . . . . . . . . . . .00733 87,434 641 87,113 2,529,645
45-46 .............. .00769 86,793 668 86,460 2,442,532 46-47 .............. .00814 86,125 701 85,774 2,356.072 47-4a .............. .C0875 85,424 747 85,051 2,270,298 48-49.............. .00957 84,677 811 84,272 2,185,247 49-50 .............. .01058 83,866 887 83,422 2,100,975
AVEMGEREMAININGLIFETIME
Averagenumber of
years of liferemaining at>eginning of9ge interval
(7)
66.4767.3267.6568.01
66.4768.1067.3066.4165.48
64.5463.5962.6361.6760.70
59.7258.7557.7756.7955.82
54.8553.8852.9251.9751.01
50.07 49.12 48.19 47.25 46.32
45.4044.4743.5542.6441.73
40.8339.9339.0438.1637.28
36.4135.5534.6933.8432.99 .
32.1631.3430.5329.7328.93
28.14 27.36 26.58 25.8125.05
24
Page 26
‘TAl~LE9. LIFE TABLE FOR NOhl!HITE FEMALES: UN I.I’EDSTATES. 1959-61—Can.
AVERAGE AGE INTERVAL PROPORTION
OF 100,000BORN ALIVE STATIONARY POPULATION REMAININGDYING LIFETIME
Proportion Averageof persons Number In this number of
Period of life alive at
living at Number dying In the age and all Fears of lifeduringbetween two ages >eginning of >eginning of age interval interval subsequent :emaining atage interval ige interval age intervals ]eginning of
interval
(1) (2) (3) (4) (6)
Xtox+t tqx Ix ,dx T,
YEARS
50-51 . . . . . . . . . . . . . . .01167 82,979 968 82,495 2,017,55? 24.31 51-52 . . . . . . . . . . . . . . .01279 82,011 1,049 81,486 l,935,05f 23.60 52-53 . . . . . . . . . . . . . . .01392 80,962 1,128 80,398 1,853,572 22. S9 53-54 . . . . . . . . . . . . . . .01504 79,834 1,201 79,234 1,773,174 22.21 54-55 . . . . . . . . . . . . . . .01617 78,633 1,271 77,998 I,693,94C 21.54
55-56 . . . . . . . . . . . . . . .01731 77,362 1,339 76,692 1,615,942 20.89 56-57 . . . . . . . . . . . . . . .01852 76,023 1,408 75,319 1,539,25C 20.25 57-58 . . . . . . . . . . . . . . .01983 74.615 1,480 73,875 1,463,931 19.62 58-59 . . . . . . . . . . . . . . .c213a 73, L35 1,557 72,357 l,390,05t 19.01
59-60 . . . . . . . . . . . . . . .02287 71,578 1,637 70,759 l,317,69S 18.41
60-61 . . . . . . . . . . . . . . .02459 69,941 1,720 69,081 1.246,94C 17.83
61-62 . . . . . . . . . . . . . . .02632 68,221 1.795 67,323 1,177,855 17.27 62-63 . . . . . . . . . . . . . . .02784 66,426 1,849 65,501 l,llo*53t i6.72
63-64 . . . . . . . . . . . . . . .02901 64,577 1,874 63,639 1,045,035 16.18 64-65 . . . . . . . . . . . . . . .02995 62,703 1,878 61,764 981,39t 15.65
65-66 . . . . . . . . . . . . . . .03C72 60,825 1,868 59.891 919,632 15.12
66-67 . . . . . . . . . . . . . . .03162 58,957 1,865 58,025 859,741 14.58 67-68 . . . . . . . . . . . . . . .03296 57,092 1,882 56,151 801,71t 14.04 68-69 . . . . . . . . . . . . . . .C3500 55,210 1,932 54,244 745,565 13.50 69-70 . . . . . . . . . . . . . . .03762 53,278 2,004 52,276 691,321 12.98
70-71 . . . . . . . . . . . . . . .04066 51,274 2,o85 50,231 639,04! 12.46 71-72 . . . . . . . . . . . . . . .04372 49, i89 2,151 48,114 588,81~ 11.97 72-73 . . . . . . . . . . . . . . .046.46 47,038 2.185 45*945 540, 70C 11.+9 73-74 . . . . . . . . . . . . . . .04853 44,853 2; 177 43,765 494,75! 11.03 74-75 . . . . . . . . . . . . . . .05007 42,676 2,136 41,608 450,99C 10.57
75-76 . . . . . . . . . . . . . . .05127 40,540 2,079 39,500 409,38: 10.10 76-77 . . . . . . . . . . . . . . .05274 38,461 2,028 37,447 369,88: 9.62
77-78 . . . . . . . . . . . . . . .G551C 36,433 2,008 35,429 332.435 9.12 7a-79 . . . . . . . . . . . . . . .05891 34.425 2.030 33,410 297; oot 8.63 79-80 . . . . . . . . . . . . . . .0642C 32,395 2;080 31,355 263,59( 8.14
80-81 . . . . . . . . . . . . . . .0706C 30,315 2.140 29,246 232,241 7.66 81-82 . . . . . . . . . . . . . . .07731 28,175 2,178 27,086 202, 99! 7.20 82-83 . . . . . . . . . . . . . . .0834S 25,997 2,171 24,911 175,905 6.77 83-84 . . . . . . . . . . . . . . .08813 23,826 2,099 22,777 150,99( 6.34 84-85 . . . . . . . . . . . . . . .C9127 21,727 1,983 20,735 128,221 5.90
85-86 . . . . . . . . . . . . . . .10205 19,744 2,015 18,736 107,48t 5.44 86-87 . . . . . . . . . . . . . . .11467 17,729 2s033 16,713 88,75C 5.01 87-88 . . . . . . . . . . . . . . .12972 15,696 2,036 14.677 72,03i 4.59 88-89 . . . . . . . . . . . . . . .14790 13,660 2,020 12,650 57,36( 4.20 89-90 . . . . . . . . . . . . . . .16879 11,640 1,965 10,657 44,71( 3.84
90-91 . . . . . . . . . . . . . . .19137 9.675 1,852 8,749 34,05: 3.52 91-92 . . . . . . . . . . . . . . .21496 7,823 1,681 6,983 25,301 3.23 92-93 . . . . . . . . . . . . . . .23959 6.142 1.472 5,406 18,321 2.98 93-94 . . . . . . . . . . . . . . .26478 4,670 1,236 4,052 12,915 2.77 94-95 . . . . . . . . . . . . . . .28995 3,434 996 2,936 8,863 2.58
95-96 . . . . . . . . . . . . . . .31416 2,438 766 2,055 5,927 2.43 96-97 . . . . . . . . . . . . . . .32915 1,672 550 1,397 3,872 2.32 97-98 . . . . . . . . . . . . . . .34450 1.122 387 928 2,475 2.21 98-99 . . . . . . . . . . . . . . .36018 735 265 603 1 * 547 2.10 99-100 . . . . . . . . . . . . . .37616 470 177 382 944 2.01
100-101 . . . . . . . . . . . . .39242 293 115 236 562 1.91 101-102 . . . . . . . . . . . . .40891 178 73 142 326 1.83 102-103 . . . . . . . . . . . . .42562 105 44 83 184 1.75 103-104 . . . . . . . . . . . . .44250 61 27 47 101 1.67 104-105 . . . . . . . . . . . . .45951 34 16 26 54 1.60
iying during lge interval
105- 106 . . . . . . . . . . . . .47662 18 8 14 28 1.53 106-107 . . . . . . . . . . . . .49378 10 5 7 14 1.46 107-108 . . . . . . . . . . . . .51095 5 3 4 7 1.40 108-109 . . . . . . . . . . . . .5281C 2 1 2 3 1.35 109-110 . . . . . . . . . . . . .54519 1 1 0 1 1.29
25
Page 27
-------------------------------------
-------------------------------------------------------
-------------------------------------
-------------------------------------
TABLE 10. PROPORTIONOF PERSONSDYING DURING YEAR AT SPECIFIEDAGES, WHO WRREAGE, BY COLOR AND SEX: DEATH-REGISTK4TTON.STATES,AT 1O-YEARINTERVALS,
COLOR, SEX, AND AGE 1959-61 1949-51 1939-41 1929-31
WRITE MALE
o--------------------------------------0.02592 0.03069 0.04812 0.06232l--------------------------------------.0015: .00212 .00487 .009935--------------------------------------.00062 .00082 .00138 .00266lo .00042 .00060 .00100 .00147lo-------------------------------------.0009: .00105 .00143 .00213
25-------------------------------------.00156 ,00171 .00243 .0037130-------------------------------------.00156 .00182 .00279 .0041335-------------------------------------.00207 .00248 .00363 .0051040-------------------------------------.00332 .00391 .00513 .00679
;:------------------, .00558 .00637 .00766 .00929 .00955 .01012 .01155 ..01278
55-------------------------------------.01475 .01587 .01737 .0181960-------------------------------------.02271 .02381 .02548 .0264465-------------------------------------.03389 .03445 .03685 .03865
70-------------------------------------.04871 .05027 .05454 .0579675-------------------------------------.07066 .07499 .08313 .0852680-------------------------------------.10732 .10993 .12471 .12997
20-------------------------------------.0015$ .00162 .00212 .00318
85-------------------------------------.16039 .16304 .18104 .1846890-------------------------------------.23601 .22890 .24894 .24550
WHITE FEMALE
85-_--------------
o--------------------------------------.01964 .02355 .03789 .04963l--------------------------------------.00135 .00189 .00432 .008795--------------------------------------.00047 .00060 .00110 .0022010-------------------------------------.00028lo-------------------------------------,00041
.00040
.00053 .00070 .00096
.00113
.00164
do .00056 .00073 .00145 .0027725-------------------------------------.00065 ..00088 .00182 .0033930-------------------------------------.00085 .00115 .00220 .0037435-------------------------------------.00122 .00161 .00278 .0043340-------------------------------------.00190 .00242 .00368 .00532
45-------------------------------------.00303 .00373 .00523 .0070250-------------------------------------.00473 .00561 .00762 .00959
.00687 .00853 .01128 .01375R------------------------------------ .01088 .01340 .01714 .0206365-------------------------------------.01742 .02063 .02643 .03125
70-------------------------------------,02836 .03409 .04233 .0486675-------------------------------------.04742do._--------------:::::::::::::::::::::.08213
.0~650
.09060 .06889 .10819
.07460
.11742.13625 .13965 .16294 ,17086
90-------------------------------------.22560 .20657 .23141 .23151
LIVE AT GINNING900-1902 O 1959-6
1919-21 1909-1.1
0.08025 0.12326.01619 .02821.00395 .00471.00211 .00238.00291 .00283
.00427 .00489
.00504 .00554
.00573 .00660
.00669 .00852
.00750 .01022
.00926 .01264
.01.174 .01553
.01653 .02150
.02462 ,03075
.03499 .04379
.05463 .06214
.08191 .09253
.11973 .13575
.18232 .19111
.23819 .25517
.06392 .10226
.01459 ,02583
.00349 .00447
.00179 .00206
.00249 .00265
.00433 .00420
.00552 .00522
.00603 .00603
.00642 .00713
.00676 .00803
.00814 .00991
.01067 .01259
.01463 .01793
.02173 .02583
.03168 .03786
.05023 .05663
.07597 .08252
.11341 .12579
.17044 .17832
.23061 .24759
YEAR OF
1900-1902
0.13345.03447.00606.00274.00334
.00594
.00704
.00799
.00932
.01060
.01263
.01537
.02118
.02859
.04166
.05894,08843.13353.1.9176.26278
.11061
.03115
.00589
.00246
.00339
.00554,00679.00772.00839.00931
.01063Ln&
.02506
.03641
.05369
.08039
.12115
.17460
.24532
26
Page 28
-----------------------------------
-------------------------------------
-------------------------------------
-------------------------------------
-------------------------------------
TABLE 10. PROPORTION OF PERSONSDYING DURING YEAR AT SPECIFIEDAGES, WHO WERR ALIVE AT SINNINGC YEAR OF AGE, BY COLOR AND SEX: DEATH-REGISTRAT -.ION STATES.AT 10-YEAR INTERVALS,1900-1902TO 359-61—C n.
—
COLOR,SEX, AND AGE 1959-61 1949-51 1939-41’ L929-311 1919-211 1909-11’ 900-19021
NONWHITEMALE
o-------------------------------------- 0.04699 0.05089 0.08228 o mm;; 0.10501 0.21935 0.25326l-------------------------------------- .00337 .00466 .00937 .02549 .066S2 .077315--------------------------------------.00087 .00124 .00186 .00295 .00425 .00S56 .010s710-------------------------------------.00060 .00084 .00138 .00211 .00269 .00502 .0062S15-------------------------------------.00120 .00164 .00274 .00433 .00577 .007s7 .00s51
20-------------------------------------.00236 .00314 .00544 .00s5s .010s5 .01196 .011s925-------------------------------------.00316 .00409 .00733 .01096 .01174 .01228 .0130730-------------------------------------.00389 .00492 .00872 .01275 .01204 .01496 .0131735-------------------------------------.00513 .00646 .01071 .01484 ,01416 .0172S .0150540-------------------------------------.00749 .00879 .01362 .01s13 .01459 .02103 .0165S
45-------------------------------------.01038 .01285 .01859 .02240 .01713 .02399 .021S55f3-- .01565 .01909 .02536 .02750 .01915 .03142 .0255355-------------------------------------.02273 .02762 .03248 .03392 .024S4 .03950 .03s1s60-------------------------------------.03137 .03676 .03910 .04140 .03172 .05079 .0439s65-------------------------------------.04365 .04576 .04685 .05072 .03s93 .06433 .0541s
70-------------------------------------.05690 75-------------------------------------.06673
.05620
.07108 .05799 .07803
.0701s
.092S2 .05911 .0s197
.0s39s
.11277 .07532.09951
80-------------------------------------.08836 .09086 .10730 .12991 .11368 .13127 .14053.12280 .11944 .13783 .17761 .166S5 .179S2 .U3743
;;-------------------------------------.20304 .18255 .17417 .22032 .20724 .20101 .23916
NONWHITE FEMALE
o-------------------------------------- .03828 .04087 .06584 W();; .0s749 .1ss07 .21475l-------------------------------------- .00289 .00388 .00796 .02304 .05ss4 .070245--------------------------------------.00077lo .0004015-------------------------------------.00063
.00107
.00055
.00125
.00175 :::;:;
.002S4
.00161
.00512
.00456
.002S6
.006S1
.00847
.0051s
.00949
.01054
.00772
.01026
20-------------------------------------.00116 25-------------------------------------.00171
.00227
.00303 j::;; .00ss2
.01034 .01159 .01275
.01074
.00999 .01139.01092
30-------------------------------------.00256 .00390 .00733 .01159 .01330 .01202 .011s035-------------------------------------.00374 .00542 .00924 .01322 .01461 .01405 .0133s40-------------------------------------.00561 .00770 .01181 .01625 .01537 .01750 .01556
45-------------------------------------.00769 .01127 .01602 .0201s .01S67 .02125 .0213050-------------------------------------.01167 .01599 .02187 .02665 .02279 .02552 .0231S55-------------------------------------.01731 .02239 .0285S .03499 .02S7S .034s5 .0322560-------------------------------------.02459 .02954 .03472 .04220 .03739 .0455s .0395165-------------------------------------.03072 .03704 .04090 .04935 .04336 .06037 .05407
70-------------------------------------.04066 .04553 .%912 .06174 .05957 .07127 .0660075-------------------------------------.05127 do .07060
.05773
.07327 .06294 .0S127
.07341
.097s4 .07322 .10317
.0s747
.1196S .0s6s6.10704
85-------------------------------------.10205 .09270 .10529 .12S34 .136S7 .16105 .14135go .19137 .15535 .14132 .17203 .1S5S6 .17234 .1s7s0
‘Figuresfor the nonwhite groups cover only Negroes. However, in no case did the Negro population compriseless t~an 95 percent of the c=rreiponding nonfihit; population.
NOTE.—For 1900-1902and 1909-11,data are for the death-registration States of L900, which consisted of 10States and the Districtof Columbia;for 1919-21,for the death-registrationStates of 1920, which consistedof 34 States and the Districtof Columbia;for 1929-31,1939-41,and 1949-51, for the entire continentalUnited States;for 1959-61the entire continentalUnited States and Alaska and Hawaii.
27
Page 29
------------------------------------
-------------------------------------
-------------------------------------
--------------------------------------
------------------------------
-------------------------------------
------------------------------------
----------------------
---------
TABLE 11. NUMBER SURVIVINGTO SPECIFIED AGES OUT OF 100,( BORN A VE, BY CC IRAND SEX: DEATH-RRGISTMTION STATES. AT 10-YEAR INTERVALS. 900-1902 o 1959-6
COLOR, SEX, AND AGE 1959-61 1949-51 1939-41 1929-31 1919-21 1909-11 1900-1902 .—
WHITE MALE
0--” 100,000 100,Oocl-------------------------------------- 97,408 96,9315-------------------------------------- 97,015 96,40210------------------------------------- 96,758 96,06915-------------------------------------96,503 95,728
Zo 95,908 95,10425-------------------------------------95,106 94,29430-------------------------------------94,401 93,48935-------------------------------------93,589 92,54340-------------------------------------92,427 91,173
45-------------------------------------90,533 89,00250-------------------------------------87,424 85,60155-------------------------------------82,463 80,496do 75,485 73,17265-------------------------------------65,834 63,541
70-------------------------------------53,825 51,73575-------------------------------------40,207 38,10480-------------------------------------25,993 24,00585-------------------------------------13,065 12,015do------------------------------------- 4,600 4,209
WHITE FEMALE
o 100,000 100,0001-------------------------------------- 98,036 97,6455-------------------------------------- 97,709 97,19910------------------------------------- 97>525 96,96015-------------------------------------97,375 96,756
20------------------:::::::::::::::::::97,135 96,45425------------------ 96,844 96,07230-------------------------------------96,499 95,60535-------------------------------------96,026 94,97740-------------------------------------95,326 94,080
45-------------------------------------94,228 92,725513------- 92,522 90,68555-------------------------------------89,967 87>699
86,339 83>279;;-------------------------------------80,739 76,773
70- 72,507 67,54575-------------------------------------60,641 54,39780--------------+ 44,676 38,02685-------------------------------------26,046 21,34890---------------------------- 10,219 8,662
LOO,000 100,000 100,000 100,000 100,000 95,188 93,768 91,975 87,674 86,655 94,150 91,738 88,842 82,972 80,864 93,601 90,810 87,530 81,519 79,?.09 93,089 90,074 86,546 80,549 78,037
92,293 88,904 84,997 79,116 76,37691,241 87,371 83,061 77,047 73,90790,092 85,707 80,888 74,810 71,21988,7L3 83,812 78>441 72,108 68,24586,880 81,457 75,733 68,848 64,954
84,285 78,345 72,696 65,11,5 61,36980,521 74,288 69,107 60,741 57,27475>156 68,981 64,574 55,622 52,491.67,787 61,933 58,498 48,987 46,45258,305 52,964 50,663 40,862 39,245
46,739 41,880 40,873 31,527 30,64033,404 29,471 29,205 21,585 21,38719,860 17,221 17>655 12,160 12,2669,013 7,572 .8,154 5,145 5,2522,812 2>356 2,568 1,523 1,523
100,000 100,000 100,000 100,000 100,00096,211 95,037 93,608 89,774 88,93995,309 93,216 90,721 85,349 83>42694,890 92,466 89,564 83,979 81,72394,534 91,894 88,7L2 83,093 80,680
93,984 90,939 87,281 81,750 78,978 93,228 89,524 85,163 79,865 76,588 92,320 87,972 82,740 77>676 73,887 91,211 86,248 80,206 75,200 70,971 89,805 84,256 77>624 72,425 67,935
87,920 81,780 74,871 69,341 64,677 85,267 78,572 71,547 65,629 61,005 81,520 74,321. 67,323 61,053 56,509 76,200 68,462 61,704 54,900 50,752 68,701 60,499 54,299 47,086 43,806
58,363 49,932 44,638 37,482 35,206 44,685 37>024 32,777 26,569 25,362 283882 23,053 20>492 15,929 15,349 14,487 10,937 9,909 7>152 7,149 5,061 3,719 3,372 2,291 2,322
28
Page 30
--------------------------------------
-------------------------------------
,.--., . . ..,. -,, -a. . . . . . . . . . . m- .-,, -“” .,--”,-? ,..,TABLE 11. NUMBER SURVIVINGTO SPECIFIED AGES OUT OF 100,0( Bum! Al
STATES.AT 10-YEARINTERVALS.i91 -1902TO 959-61— ?. L .- —— .-_——— —.
COLOR, SEX, AND AGE L959-61 1949-51 1939-411 1929-311 1919-2L1 1909-111 900-19021——
NOi’WHITEMALE
o 100,000 100,000 100,000 LOO,000 100,000 100,000 100,000 l-------------------------------------- 95,301 94,911 91,772 91,268 89,499 78,065 74,674 5--------------------------------------94,570 93,921 90,082 88,412 85,195 68,589 64,385 10-------------------------------------94,234 93,453 89,393 87,311 83,768 66,377 61,730 15-------------------------------------93,874 92,965 88,610 86,152 82,332 64,478 59,667
20-------------------------------------93,10825-------------------------------------91,825
91,941 90,285
86,968 83,621 84,227 79,516
79,057 74,540
61,426 57,736
56,733 53,285
30-------------------------------------90,270 88,327 80,979 75,083 70,344 54,073 49,867 88,331 85>940 77,221 70,049 65,873 49,865 46>541
.&------------------------------------ 85,774 82,832 72,780 64,710 61,353 45,414 42,989
45-------------------------------------82,075 78,686 67,346 58,432 56,589 40,563 39,230 50-------------------------------------77,239 72,891 60,495 51,748 51,880 35,427 34,766 55-------------------------------------70,351 ;;>;;; 52>426 44,436 46,581 29,754 29,987 60-------------------------------------61,669 43,833 36,790 40,506 23,750 24,194 65-------------------------------------51>392 45:198 35,371 29,314 34,042 17,806 19,015
70-------------------------------------39,914 35,018 27,236 ,21>741 26,923 12,295 13,829 < 29,064 v 25,472 ~19 ,456 ,14,419 18,854 7,494 8,89275-------------------------------------
80-------------------------------------19,994 16,904 12,186 :-T.8,239 11,615 3,894 ;,:$3: 85-------------------------------------11,620 9,898 6,444 --3,660 5,605 1,747 90------------------------------------- 5,174 4,642 2,836 1,246 2,040 595 ’634
NOiWHITEFENALE
o-------------------------------------- 100,000 100,000 100,000 100,000 100,000 100,000 100,000 l-------------------------------------- 96,172 95,913 93,416 92,796 91,251 81,493 78,525 5--------------------------------------95,543 95,055 91,906 90,185 87,149 72>768 68,056 10-------------------------------------95,265 94,679 91,308 89,201 85,607 70,508 65,111 15-------------------------------------95,057 94,343 90,594 88,088 83,954 68,218 62,384
20-------------------------------------94,660 93>544 88,736 133,grJ; 80,154 64,764 59,05325-------------------------------------94,005 92,336 86,198 75,359 61,430 55,795
91,670 :::::::::::::::::::::::::::::::::::::::89,676
88,805 80,092 86,052 76,084
72,192 67,271
65,857 61,130
54,595 50,568
49,567 46,146
45-------------------------------------86,793 82,257 71>157 61,365 56,230 45,947 42,279 50-------------------------------------82,979 77,007 64,885 54,920 50,780 40,886 37,681 55-------------------------------------77,362 70,196 57,314 47,074 44,742 35,415 33,124 60-------------------------------------69,941 61,758 48,928 3S,761 37,954 28,908 27>524 65-------------------------------------60,825 52,358 40,504 30,S52 31,044 22,302 21,995.
70-------------------------------------51,274 42,612 32,354 23,341 24,107 15,871 16,140 .- - -75-------------------------------------40,540 32,9S1 w24 ,302 16,576 17,216 10,657 11,066 - ,“ 80-------------------------------------30,315~5-------------------------------------19,744
23,712 17,039 15,550 10,622
10,s22 6,033
11,151 5,972
6,3243,(329 ..-;>;:; ‘ --,
30-------------------------------------93,070 90,799 83,384 76:816 70,633 58,281 52,773
90------------------------------------- 9,675 8,590 5,652 2,774 2.579 1,206 1:492 . :~:zI
1Figures for the nonwhitegroups cover only Negroes. Huwever,in no case did the Negro populationcompriseless than 95 percentof the correspondingnonwhitepopulation.
NOTE .—For 1900-1902and 1909-11,data are for the death-registrationStates of 1900,which consistedof 10States and the Districtof Columbia;for 1919-21,for the death-registrationStates of 1920, which consistedof 34 States and the Districtof Columbia;for 1929-31,1939-41,and 1949-51, for the entire continentalUnited States;for 1959-61the entire continentalUnited States and Alaska and Hawaii.
29
Page 31
-------------------------------------
----------------------------------
-------------------------------------
TABLE 12. AVERAGE REMAININGLIFETIMEIN YEARS AT SPECIFIEDAGES,BY COLORAND SEX: DEATH-REGISTRATIONSTATES,AT 10-Y&ARINTERVALS,1900-1902TO 1959-61
COLOR, SEX, AND AGE 1959-61 1949-51 1939-41 1929-31 1919-21 1909-11 1900-1902
WHITE NALE
o-------------------------------------- 66.31 62.81 59.12 56.34 50.23 l-------------------------------------- 67.41 64.98 62.04 60.24 56.26 5-------------------------------------- 63.77 61.68 59.38 58.31 55.37 10------------------------------------- 58.98 57.03 54.96 54.15 51.32 15------------------------------------- 54.18 52.33 50.39 49.74 46.91
20------------------------------------- 50.25 25-------------------------------------45.65
49.52 44.93
47.76 43.28
46.02 41.78
45.60 41.60
:;.;; 42.19 38.52
30-------------------------------------40.98 40.29 38.80 37.54 37.65 34:87 34.88 35------------------------------------- 36.31 35.68 34.56 33.33 33.74 31.08 31.29 40------------------------------------- 31.73 31.17 30.03 29.22 29.86 27,43 27.74
45------------------------------------- 27.34 26.87 25.87 25.28 26.00 23.86 24.21 50------------------------------------- 23.22 22.83 21.96 21.51 22.22 20.39 20.76 55------------------------------------- 19.45 19.11 18.34 17.97 18.59 17.03 17.42 60------------------------------------- 16.0165------------------------------------- 12.97
15.76 12.75
15.05 12.07
14.72 11.77
15.25 12.21
13.98 11.25
14.35 11.51
70------------------------------------- 10.29 10.07 9.42 9.20 9.51 8.83 9.03 75------------------------------------- 7.92 7.77 7.17 7,02 7.30 6,75 6.84 80------------------------------------- 5.89 5.88 5.38 5.26 5.47 5.09 5.10 85------------------------------------- 4.34 90------------------------------------- 3.16
4.35 3.27
p; 3.99 3.03
4.06 3.18
3.88 2.99
3.81 2.85
KHITE FEMALE
o-------------------------------------- 74.19 72.03 67.29 62.67 58.53 53.62 51.08 l--------------------------------------74.68 72.77 68.93 64.93 61.51 58.69 56.39 5-------------------------------------- i“.;; 69.09 65.57 62.17 59.43 57.67 56.03 10------------------------------------- 64.26 60.85 57.65 55.17 53.57 52.15 lo------------------------------------- 61:15 59.39 56.07 53.00 50.67 49,12 47.79
do 56.29 54.56 51.38 48.52 46.46 44.88 25------------------------------------- 51.45 49.77 46.78 ;;.;; 42.55 40.88 30------------------------------------- 46.63 45.00 :;.;; 38.72 36.96 35------------------------------------- 41.84 40.28 35:73 34.86 33.09 40------------------------------------- 37.13 35.64 33:25 31.52 30.94 29.26
45------------------------------------- 32.53 31.12 28.90 27.39 26.98 25.45 25.51 50------------------------------------- 28.08 26.76 24.72 23.41 23.12 21.74 21.89 55------------------------------------- 23.81 22.58 20.73 19.60 19.40 18.18 18.43 60------------------------------------- 19.69 18,64 17.00 16.05 15.93 14.92 15.23 65------------------------------------- 15.88 15.00 13.56 12.81 12.75 11.97 12,23
7(3--- 12.38 11.68 10.50 9.98 9.94 9.38 9.59 75------------------------------------- 9.28 8.87 7.92 7.56 7.62 7.20 7.33 80------------------------------------- 6.67 6.59 5.88 5.63 5.70 5.35 5.50
4.66 4.83 4.34 4.24 4.24 4.06 4.10 ;:------------------------------------- 3.23 3.51 3.24 3.17 3.1,6 3.00 3.02
30
Page 32
-------------------------------------
------------------------
-------------------------------------
TABLE 12. AVERAGERENAININGLIFETIMEIN YEARS AT SPECIFIEDAGES,BY COLORAND SEX: DEATH-REGISTMTIONSTATES, AT 1O-YEARINTERVALS,1900-1902TO 1959-61-Con. .———
COLOR, SEX, AND AGE 1959-61 1949-51 1939-411 1929-311 1919-21’ 1909-11’ ,900-19021
NONWHITEMALE
o-------------------------------------- 61.48 58.91 52.26 47.55 47.14 34.05 32.54 l-------------------------------------- 63.50 61.06 55.93 51.08 51.63 42.53 42.46 5-------------------------------------- 59.98 57.69 52.95 48.69 50.18 44.25 ;;.;; 10------------------------------------- 55.1915------------------------------------- 50.39
52.96 48.23
48.34 43.74
44.27 39.83
45.99 41.75
40.65 36.77 38:26
Zo 45.78 43.73 39.52 35.95 38.36 33.46 35.11 25------------------------------------- 41.38 39.49 ;;.;; 32.67 35.54 30.44 32.21 30------------------------------------- 37.05 35.31 29.45 32.51 27.33 29.25 35------------------------------------- 32.81 31.21 28:48 26.39 29.54 24.42 26.16 40------------------------------------- 28.72 27.29 25.06 23.36 26.53 21.57 23.12
45------------------------------------- 24.89 23.59 21.88 20.59 23.55 18.85 20.09 50------------------------------------- 21.28 20.25 19.06 17.92 20.47 16.21 17.34 55------------------------------------- 18.11 17.36 16.60 15.46 17.50 13.82 14.69 60------------------------------------- 15.29 14.91 14.37 13.15 14.74 11.67 12.62 65------------------------------------- 12.84 12.75 12.21 10.87 12.07 9.74 10.38
70------------------------------------- 10.81 1:.1: 10.11 :.;; 9.58 8.00 8.33 75------------------------------------- 8.93 8.17 7.61 6.58 6.60 80------------------------------------- 6.87 7:07 6.58 5:42 5.83 5.53 5.12 85------------------------------------- 5.08 5.38 5.34 4.30 4.53 4.48 :.;; 90------------------------------------- 3.42 3.78 4.23 3.42 3,60 4.01 .
NONWITE FBNALE
o-------------------------------------- 66.47 62.70 55.56 49.51 $. f); 37.67 35.04 l-------------------------------------- 68.10 64.37 58.46 52.33 45.15 43.54 5-------------------------------------- 64.54 60.93 55.40 49.81 48:70 46.42 46.04 10------------------------------------- 59.72 56.17 50.75 45.33 44.54 42.84 $.;; 15------------------------------------- 54.85 51.36 46.13 40.87 40.36 39.18
20-------------:::::::::::::::::::::::: 50.07 46.77 42.04 37.22 37.L5 36.14 36.89 45.40
;:::::::::::::: 40.83 42.35 38.02
38.20 34.40
33,93 30.67
34.35 31.48
32.97 29.61
33.90 30.70
35------------------------------------- 36.41 33.82 30.71 27.47 28.58 26.44 27.52 40------------------------------------- 32.16 29.82 27.19 24.30 25.60 23.34 24.37
45------------------------------------- 28.I-4 26.07 23.89 21.39 22.61 20.43 :;.:3 50------------------------------------- 24.31 22.67 20.95 18.60 19.76 17.65 55------------------------------------- 20.89 19.62 18.38 16.27 17.09 14.98 15:88 60------------------------------------- 17.83 16.95 16.10 14.22 14.69 12.78 13.60 65------------------------------------- 15.12 14.54 13.93 12.24 12.41 10.82 11.38
70------------------------------------- 12.46 12.29 1;.;: 10.38 10.25 9.22 9.62 10.10 10.15 :.;: 8.37 7.55 7.90
::------------------------------------- 7.66 8.15 8:02 6.58 6.05 ;.$; 85------------------------------------- 5.44 6.15 6.41 5:48 5.22 5.09 90------------------------------------- 3.52 4.13 4.96 4.20 4.07 4.50 4:01
1Figures for the nonwhitegroups cover only Negroes. However,less than 95 percentof the correspondingnonwhitepopulation.
in no case did the Negro populationcomprise
NOTE—For 1900-1902and 1909-11,data are for the death-registrationStates of 1900,which consisted of 10Statesand the Districtof Columbia;for 1919-21,for the death-registrationStates of 1920, which consistedof 34 Statesand the Districtof Columbia;for 1929-31,1939-41, and 1949-51,for the entire continentalUnited States;for 1959-61the entirecontinentalUnited States and Alaska and Hawaii.
31
* U. S. GOVERNMENT PRINTUJG OFFICE :1964 0-755-838