United States Natural Resources 11 Campus Boulevard Department of Conservation Suite 200 Agriculture Service Newtown Square, PA 19073 Subject: SOI – Geophysical Field Assistance Date: 8 June 2004 To: Dr. Heidi Hadley BLM Salinity Coordinator, UC 247 USDOI Bureau of Reclamation 125 South State Street, Rm 6107 Salt Lake City, UT 84138-1147 Purpose: Electromagnetic induction (EMI) provided detailed information and maps of apparent conductivity (EC a ) for a transit sources salinity loading study along the upper reaches of the San Rafael River, Utah. Principal Participants: Beth Anderson, Soil Scientist, USDA-NRCS, Price, UT Janis Boettinger, Assoc. Professor, Utah State Univ., Logan, UT Mark Dean, Hydrologist, USDI-BLM, Salt Lake City, UT Jim Doolittle, Research Soil Scientist, USDA-NRCS-NSSC, Newtown Square, PA Heidi Hadley, Hydrologist, USDI-BLM, Salt Lake City, UT James Hereford, Student Physical Scientists, USDI-BLM, Salt Lake City, UT John Lawley, Research Associate, Utah State Univ., Logan, UT Shawn Nield, Soil Scientist, USDA-NRCS, Logan, UT Leland Sasser, Soil Scientist, USDA-NRCS, Price, UT Wes Tuttle, Soil Scientist, USDA-NRCS-NSSC, Wilkesboro, NC Activities: All activities were completed during the period of 18 to 21 May 2004. Summary: 1. Within all four survey areas, linear features of high (>150 mS/m) EC a were observed. In general, EC a in excess of 40 to 80 mS/m is indicative of high concentrations of soluble salts. Generally, in these areas, the contribution of salts far outweighs the contribution of moisture, clay content, clay type, and cation exchange capacity on EC a . The location and orientation of these bands of higher EC a suggest seepage of salt bearing waters from adjoining alluvial fans, bedrock escarpments, and terrace scarps. These waters leave high concentrations of residual salts in the soil near the bases of these features. 2. The Fuller Bottom North site had the highest averaged and most variable EC a recorded during this investigation. Based on EC a , this site is considered to be the most saline. Though not temperature corrected, values of EC a measured at this site are comparable to measurement made at the other two sites that were surveyed within Fuller Bottom last year. In addition, similar vertical (depth) trends were observed in the 2003 and 2004 data collected with the EM38DD and EM31 meters. 3. The lowest and less variable EC a were record at the Red Ledges site. Unlike the other surveyed, the averaged EC a was lowest at the Red Ledges site and generally increased with increasing EMI profiling depth (EM38DD horizontal dipole orientation < EM38DD vertical dipole orientation < EM31 vertical dipole orientation). A terrace scrap at this site produced noticeably changes in EC a as it was crossed. It is presumed that subsurface lateral flow of groundwater laden with soluble salts periodically discharges along this scarp producing the higher EC a .
Transcript
United States Natural Resources 11 Campus Boulevard Department of Conservation Suite 200 Agriculture Service Newtown Square, PA 19073 Subject: SOI – Geophysical Field Assistance Date: 8 June 2004 To: Dr. Heidi Hadley
BLM Salinity Coordinator, UC 247 USDOI Bureau of Reclamation 125 South State Street, Rm 6107 Salt Lake City, UT 84138-1147
Purpose: Electromagnetic induction (EMI) provided detailed information and maps of apparent conductivity (ECa) for a transit sources salinity loading study along the upper reaches of the San Rafael River, Utah. Principal Participants: Beth Anderson, Soil Scientist, USDA-NRCS, Price, UT Janis Boettinger, Assoc. Professor, Utah State Univ., Logan, UT Mark Dean, Hydrologist, USDI-BLM, Salt Lake City, UT Jim Doolittle, Research Soil Scientist, USDA-NRCS-NSSC, Newtown Square, PA Heidi Hadley, Hydrologist, USDI-BLM, Salt Lake City, UT James Hereford, Student Physical Scientists, USDI-BLM, Salt Lake City, UT John Lawley, Research Associate, Utah State Univ., Logan, UT Shawn Nield, Soil Scientist, USDA-NRCS, Logan, UT Leland Sasser, Soil Scientist, USDA-NRCS, Price, UT Wes Tuttle, Soil Scientist, USDA-NRCS-NSSC, Wilkesboro, NC Activities: All activities were completed during the period of 18 to 21 May 2004. Summary:
1. Within all four survey areas, linear features of high (>150 mS/m) ECa were observed. In general, ECa in excess of 40 to 80 mS/m is indicative of high concentrations of soluble salts. Generally, in these areas, the contribution of salts far outweighs the contribution of moisture, clay content, clay type, and cation exchange capacity on ECa. The location and orientation of these bands of higher ECa suggest seepage of salt bearing waters from adjoining alluvial fans, bedrock escarpments, and terrace scarps. These waters leave high concentrations of residual salts in the soil near the bases of these features.
2. The Fuller Bottom North site had the highest averaged and most variable ECa recorded during this
investigation. Based on ECa, this site is considered to be the most saline. Though not temperature corrected, values of ECa measured at this site are comparable to measurement made at the other two sites that were surveyed within Fuller Bottom last year. In addition, similar vertical (depth) trends were observed in the 2003 and 2004 data collected with the EM38DD and EM31 meters.
3. The lowest and less variable ECa were record at the Red Ledges site. Unlike the other surveyed, the averaged
ECa was lowest at the Red Ledges site and generally increased with increasing EMI profiling depth (EM38DD horizontal dipole orientation < EM38DD vertical dipole orientation < EM31 vertical dipole orientation). A terrace scrap at this site produced noticeably changes in ECa as it was crossed. It is presumed that subsurface lateral flow of groundwater laden with soluble salts periodically discharges along this scarp producing the higher ECa.
2
4. At Hambrick Bottom, broad spatial patterns of ECa appear to remain consistent over time (June 2003 & May 2004 EMI surveys).
5. At the Hambrick Bottom West site, bands of high ECa appear to connect a high ECa zone near the base of the
escarpment and an alluvial fan with the San Rafael River. Similar continuous and direct flow paths between the bedrock escarpment and the San Rafael River were absent or poorly expressed in the other surveyed areas.
6. Maps of apparent conductivity contained in this report for the three survey sites along the San Rafael River
will increase our understanding of the hydrogeology of these sites and aid the positioning of additional piezometers. CD’s of the data collected in this study have been prepared and forwarded to Heidi Hadley and Shawn Nield under a separate cover letter.
It was Wes Tuttle’s and my privilege to work with you, and the BLM and NRCS staffs in Utah. With kind regards, James A. Doolittle Research Soil Scientist National Soil Survey Center cc: B. Ahrens, Director, USDA-NRCS, National Soil Survey Center, Federal Building, Room 152,100 Centennial Mall
North, Lincoln, NE 68508-3866 J. Boettinger, Associate Professor, Plants, Soils, and Biometeorology Department, Utah State University, 4820 Old
Main Hill, Ag. Sci. Bldg., Room 354, Logan, UT 84322-4820 R. Lewis, Acting State Soil Scientist, USDA-NRCS, PO Box 11350, Salt Lake City, UT 84147-0350 M. Golden, Director of Soils Survey Division, USDA-NRCS, Room 4250 South Building, 14th & Independence Ave.
SW, Washington, DC 20250 S. Nield, Soil Scientist, USDA-NRCS, Price Service Center, 350 N 400 E. Price, UT 84501-2571 C. Olson, National Leader, Soil Investigation Staff, USDA-NRCS, National Soil Survey Center, Federal Building,
Room 152,100 Centennial Mall North, Lincoln, NE 68508-3866 L. Sasser, Soil Scientist, USDA-NRCS, Price Service Center, 350 N 400 E. Price, UT 84501-2571 W. Tuttle, Soil Scientist, USDA-NRCS-NSSC, P.O. Box 974, Federal Building, Room 206, 207 West Main Street,
Wilkesboro, NC 28697
3
Background: The San Rafael River is located on the Colorado Plateau and is underlain by different geologic formations. Several of these formations contain large amounts of calcium, sodium, selenium, and magnesium compounds, which create high levels of total dissolved solids and salinity problems along the San Rafael River (Hadley, 2002). The dissolution of soluble salts in the soil and substrata is a major source of the salt loading within the San Rafael River. The San Rafael River is a major tributary to the Green River that flows into the Colorado River. Law and Hornsby (1982) reported that 52 percent of the salinity loading that occurs in the upper Colorado River Basin is from naturally diffused and non-irrigated sources. In order to control salt loading along the San Rafael and other rivers in the Colorado River Basin, knowledge of surface runoff and groundwater inflow into streams is needed. The purpose of this study is to develop and test methodologies for determining major transit mechanisms and sources of salt loads that reach the San Rafael River. Electromagnetic induction was used to characterize several sites, locate monitoring sites, and infer areas of salt concentrations associated with surface runoff or groundwater inflow. Electromagnetic Induction (EMI): Electromagnetic induction uses electromagnetic energy to measure the apparent conductivity (ECa) of earthen materials. Apparent conductivity is a weighted, average conductivity measurement for a column of earthen materials to a specific depth (Greenhouse and Slaine, 1983). Interpretations of EMI data are based on the identification of spatial patterns within data sets. Though seldom diagnostic in themselves, lateral and vertical variations in ECa have been used to infer changes in soils and geologic materials. Variations in ECa are produced by changes in the electrical conductivity of earthen materials. The electrical conductivity of earthen materials will increase with increases in soluble salt, water, and clay contents (Kachanoski et al., 1988; Rhoades et al., 1976). The electrical conductivity of soils is influenced by the type and concentration of ions in solution, amount and type of clays in the soil matrix, volumetric water content, and temperature and phase of the soil water (McNeill, 1980b). In rocks, electrical conductivity is affected by the porosity, permeability, clay content, as well as by the concentration of dissolved-solids in the included water. Different salts have different mobility’s and electrical conductivities. Cook and Williams (1998) noted that NaCl, CaCl2, MgCl2, and Na2SO4 have similar electrical conductivity, but MgSO4, CaSO4, and NaHCO3 have lower conductivities at equivalent salt concentrations. In areas of saline soils, 65 to 70 percent of the variance in ECa has been related to changes in the concentration of soluble salts alone (Williams and Baker, 1982). Moderate to high correlations have been found between ECa and saturated paste extract (ECe), the most accepted and accurate method of determining soil salinity (de Jong, 1979; Williams and Baker, 1982; and Wollenhaupt et al., 1986). Studies have demonstrated that EMI can be used to map and provide reasonably accurate estimates of soil salinity (Williams and Baker, 1982; van der Lelij, 1983; Diaz and Herrero, 1992). Equipment: Electromagnetic induction instruments used in this study were the EM31 and EM38DD meters. These meters are portable and need only one person to operate. No ground contact is required with either meter. These meters measured the ECa of the underlying earthen materials. Values of ECa are expressed in milliSiemens per meter (mS/m). For each meter, lateral resolution is approximately equal to the intercoil spacing. Geonics Limited manufactures the EM31 and EM38DD meters.1 McNeill (1980a) has described the principles of operation for the EM31 meter. The EM31 meter has a 3.66-m intercoil spacing and operates at a frequency of 9,810 Hz. When placed on the soil surface, the EM31 meter has theoretical penetration depths of about 3.0 and 6.0 meters in the horizontal and vertical dipole orientations, respectively (McNeill, 1980a). Geonics Limited (2000) has described the operating procedures for the EM38DD meter. The EM38DD meter has a 1-m intercoil spacing and operates at a frequency of 14,600 Hz. When placed on the soil surface, it has effective penetration depths of about 0.75 and 1.5 m in the horizontal and vertical dipole orientations, respectively (Geonics Limited, 2000). The EM38DD meter consists of two EM38 meters bolted together and electronically coupled. One meter acts as a master unit (meter that is positioned in the vertical dipole orientation and having both transmitter and
1 Trade names are used to provide specific information. Their mention does not constitute endorsement by USDA-NRCS.
4
receiver activated) and one meter acts as a slave unit (meter that is positioned in the horizontal dipole orientation with only the receiver switched on). The EM38DD meter provides simultaneous measurements in both dipole orientations. The Geonics DAS70 Data Acquisition System was used to record and store both EMI and GPS data.2 The acquisition system consists of the EM38DD or the EM31 meter, and an Allegro field computer, and a GPS receiver. With the logging system, the meters are keypad operated and measurements can either be automatically or manually triggered. To help summarize the results of this study, the SURFER for Windows (version 8) program, developed by Golden Software, Inc., was used to construct two-dimensional simulations. 2Grids were created using kriging methods with an octant search. Field Procedures: Each meter was operated with the DAS70 Data Acquisition System and all measurements were georeferenced with either a Holux GM-210 or a Trimble AG114 GPS receiver. Each meter was operated in the continuous mode with measurements recorded at either a 1- or 2-sec interval. The meters were generally orientated with their long axis parallel to the direction of traverse. The EM38DD was held about 2 inches above the ground surface. The EM31 meter was held at hip height and surveys were carried out in the vertical dipole orientation. Walking at a fairly uniform pace across a specified area completed an EMI survey. Surveys were completed in areas known as: Fuller Bottom, Hambrick Bottom, and Red Ledges. Some negative ECa were recorded with the EM38DD meter. Prior to plotting, the EM38DD data were zero adjusted. Zero adjustment results in the lowest measurement being made equal to zero and all other data being adjusted upwards by the same number used to make the lowest measurement equal to zero. Spatial patterns of apparent conductivity are known to be temporally variable (mostly related to changes in soil moisture and temperature). Temporal variation in soil moisture and temperature are expected to cause differences in measured conductivity. Though the surveys discussed in this report were completed during the “wetter” time of the year, wetness is a relative term in this arid environment and soil moisture did not appear to vary appreciably at the sites during the two survey periods (June 2003 and May 2004). The conductivity of moist materials is linear proportion to temperature and changes at a rate of about 2.2% per degree centigrade (McNeill, 1980b). The seasonal effect of temperature differences in a moderately conductive material is typically several mS/m and is considered significant to any temporal study. Unfortunately, temperature data were not obtained for the 2003 survey and while soil temperatures averaged 58o F during this study, the data were not corrected to a standard temperature of 25o C. At each site, the areas surveyed with the two meters though similar were not identical. As a consequence, the enclosed plots will show slightly different survey boundaries and areas. Study Areas: Three sites adjoining the San Rafael River were selected for detailed EMI surveys. These sites are referred to as Fuller Bottom, Hambrick Bottom, and Red Ledges. Each site contained soils that formed in alluvium and colluvium over different lithologies. Fuller Bottom is located in Section 1, T. 20 S., R 9 E. Fuller Bottom is underlain by the Carmel formation. Hambrick Bottom is located in Section 27, T. 19 S., R 9 E. Hambrick Bottom is underlain by the contact of the Summerville and Morrison formations. Red Ledges is located in Section 1, T. 20 S., R 9 E. Red Ledges is underlain by the Entrada formation. Results: Fuller Bottom: In 2003, two areas were surveyed within Fuller Bottom. This year, a more northerly site was surveyed. The site is bounded on the north and northeast by a bedrock escarpment carved into the Carmel formation and on the southeast by the San Rafael River. The Carmel formation consists of gypsiferous sandstone and shales with some soft gypsum bedrock.
2 Trade names are used to provide specific information. Their mention does not constitute endorsement by USDA-NRCS.
5
Table 1 summarizes the EMI survey results from Fuller Bottom. Within this site, measured ECa ranged from about 5 to 500 mS/m. With the EM38DD meter, ECa increased and became slightly more variable with increasing depth. In the shallower-sensing, horizontal dipole orientation, ECa averaged about 144 mS/m with a standard deviation of about 77 mS/m. One-half the observations had an ECa between 80.5 and 198.9 mS/m. In the deeper-sensing, vertical dipole orientation, ECa averaged about 179 mS/m with a standard deviation of about 89 mS/m. One-half the observations had an ECa between 111.0 and 240.9 mS/m. With the EM31 meter, ECa was only measured in the vertical dipole orientation. Apparent conductivity averaged about 166 mS/m with a standard deviation of about 52 mS/m. One-half the observations had an ECa between 127.0 and 198.8 mS/m.
Table 1. Basic EMI Statistics for the Fuller Bottom Site EM38DD-VDO EM38DD-HDO EM31-VDO Number 4321 4321 4266 Minimum 13.0 4.9 59.5 Maximum 497.0 437.9 378.4 25%-TILE 111.0 80.5 127.0 75%-TILE 240.9 198.9 198.8 Average 179.1 144.2 166.4 Standard Deviation
89.5 77.3 51.9
This site had the highest ECa values recorded during this investigation and is presumed to be the most saline. Though not temperature corrected, values of ECa measured at this site are comparable to measurement made at the other two sites within Fuller Bottom last year. In addition, similar vertical (depth) trends were observed in the data collected with the two meters.
6
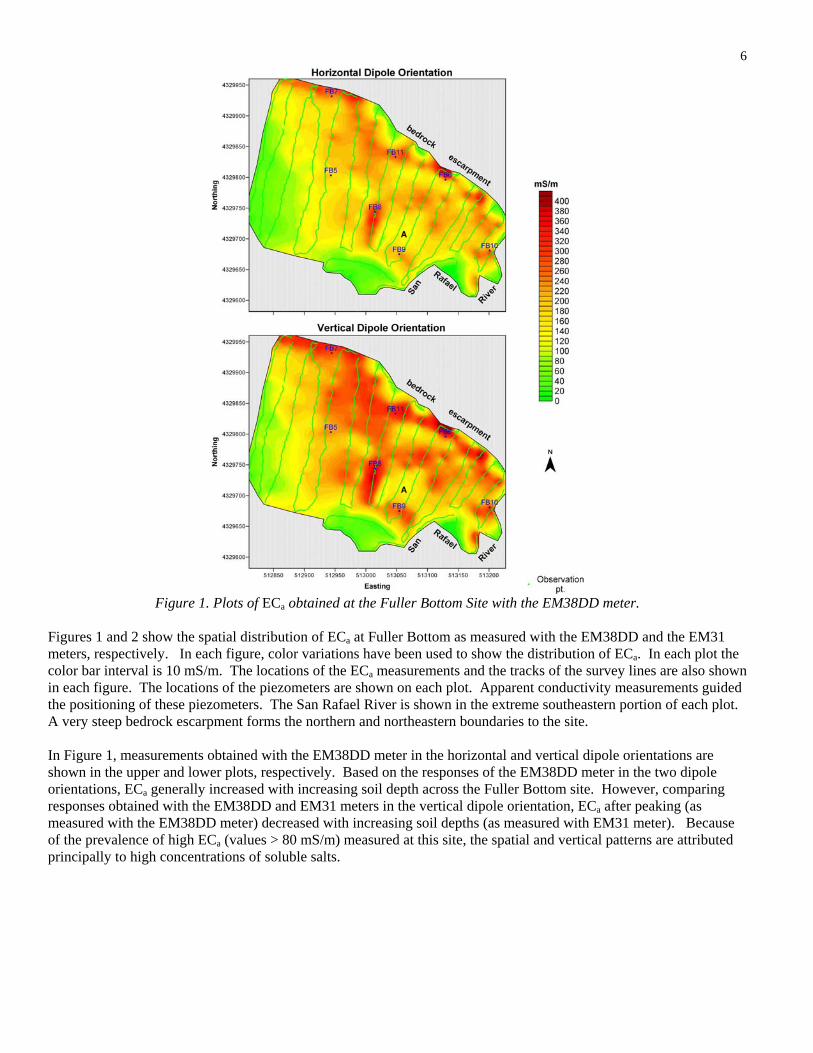
Figure 1. Plots of ECa obtained at the Fuller Bottom Site with the EM38DD meter.
Figures 1 and 2 show the spatial distribution of ECa at Fuller Bottom as measured with the EM38DD and the EM31 meters, respectively. In each figure, color variations have been used to show the distribution of ECa. In each plot the color bar interval is 10 mS/m. The locations of the ECa measurements and the tracks of the survey lines are also shown in each figure. The locations of the piezometers are shown on each plot. Apparent conductivity measurements guided the positioning of these piezometers. The San Rafael River is shown in the extreme southeastern portion of each plot. A very steep bedrock escarpment forms the northern and northeastern boundaries to the site. In Figure 1, measurements obtained with the EM38DD meter in the horizontal and vertical dipole orientations are shown in the upper and lower plots, respectively. Based on the responses of the EM38DD meter in the two dipole orientations, ECa generally increased with increasing soil depth across the Fuller Bottom site. However, comparing responses obtained with the EM38DD and EM31 meters in the vertical dipole orientation, ECa after peaking (as measured with the EM38DD meter) decreased with increasing soil depths (as measured with EM31 meter). Because of the prevalence of high ECa (values > 80 mS/m) measured at this site, the spatial and vertical patterns are attributed principally to high concentrations of soluble salts.
7
Figure 2. Plot of ECa data for Fuller Bottom obtained with the EM31 meter that was operated in the vertical dipole
orientation.
Pervasively high ECa characterizes the Fuller Bottom site. Only 84 of the 4266 measurements (about 2%) obtained with the EM31 meter were less than 80 mS/m. For the EM38DD meter, of the 3421 total measurements only 599 and 848 (about 18 and 25%) obtained in the vertical and horizontal dipole orientations, respectively, were less than 80 mS/m. While relatively high values were recorded across the site, ECa generally decreased away from the base of the bedrock escarpment and towards the river. This pattern suggests that the bedrock and not the river is the major contributor to ECa and associated soil salinity. In figures 1 and 2, zones of high ECa form conspicuous bands that parallel the base of the bedrock escarpment. This pattern suggests an association: the contribution and seepage of soluble salts into the alluvial deposits from the bedrock. Extending and generally dissipating outwards from the base of the escarpment are irregular bands of higher ECa. These bands suggest possible flow paths associated with alluvial channel fill deposits. Most bands appear to follow the general trend of the bedrock escarpment and are not connected with the San Rafael River. However, a prominent band of higher ECa extends from the base of the escarpment and trends past several piezometers (FB11, FB8, and FB9) to the San Rafael River. In each plot, an insular area of lower ECa (labeled A) is surrounded by a belt of higher ECa. This area may represent a slightly higher lying swell or an area of coarser textured materials that influences groundwater flow. The belt of higher ECa that surrounds A may represent an area of edge effect discharge. Several washes bisect the escarpment. Where these washes debouch from the escarpment and form alluvial fans, ECa is noticeably lower.
Red Ledges: Table 2 summarizes the survey results of the EMI surveys at the Red Ledges site. The lowest and less variable ECa
were record at the Red Ledges site. Within this site, ECa ranged from about –7 to 243 mS/m. Negative values are attributed to calibration errors and surface or near-surface metallic artifacts. With the EM38DD meter, ECa increased and became slightly more variable with increasing depth. In the shallower-sensing, horizontal dipole orientation, ECa averaged 37.5 mS/m with a standard deviation of 40.1 mS/m. One-half the observations had an ECa between 10.8 and 51.4 mS/m. In the deeper-sensing, vertical dipole orientation, ECa averaged 50.1 mS/m with a standard deviation of 48.3 mS/m. One-half the observations had an ECa between 17.9 and 68.2 mS/m. The increased ECa with increasing depth is attributed to higher salt and clay contents at greater soil depths.
8
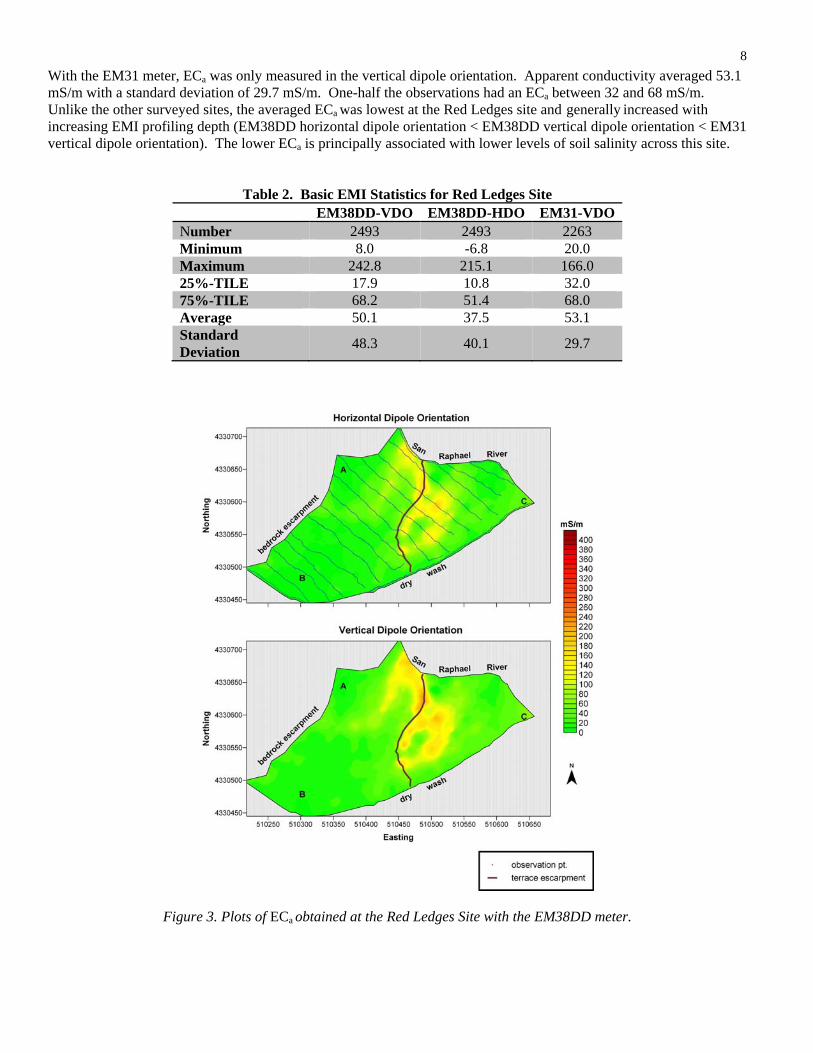
With the EM31 meter, ECa was only measured in the vertical dipole orientation. Apparent conductivity averaged 53.1 mS/m with a standard deviation of 29.7 mS/m. One-half the observations had an ECa between 32 and 68 mS/m. Unlike the other surveyed sites, the averaged ECa was lowest at the Red Ledges site and generally increased with increasing EMI profiling depth (EM38DD horizontal dipole orientation < EM38DD vertical dipole orientation < EM31 vertical dipole orientation). The lower ECa is principally associated with lower levels of soil salinity across this site. Table 2. Basic EMI Statistics for Red Ledges Site
EM38DD-VDO EM38DD-HDO EM31-VDO Number 2493 2493 2263 Minimum 8.0 -6.8 20.0 Maximum 242.8 215.1 166.0 25%-TILE 17.9 10.8 32.0 75%-TILE 68.2 51.4 68.0 Average 50.1 37.5 53.1 Standard Deviation
48.3 40.1 29.7
Figure 3. Plots of ECa obtained at the Red Ledges Site with the EM38DD meter.
9
Figures 3 and 4 show the spatial distribution of ECa across the Red Ledges site as measured with the EM38DD and the EM31 meters, respectively. In each plot, color variations have been used to show the distribution of ECa. In each plot the isoline interval is 10 mS/m. The locations of the observation points and the tracks of the EMI traverse lines are shown in each figure. In each plot, the location of the San Rafael River, bedrock escarpment, and a dry wash are labeled. The San Rafael River forms a portion of the northeast boundary to the site. Dense brush limited the extent of the survey area to the northeast. A bedrock escarpment forms a continuous wall and the northwest boundary to the site. A small, incised, dry wash that flows into the San Rafael River forms the southern boundary to the site. Also shown in these plots is the approximate location of a conspicuous terrace scarp. This scrap is about 1 to 2 m high and is very abrupt. With each meter, ECa changed noticeably as this terrace scarp was crossed. It is presumed that subsurface lateral flow of groundwater laden with soluble salts periodically discharges along this scarp producing the higher ECa. A small alluvial fan is located near “A” in each plot. This fan has formed in coarser textured materials. At the base of this fan, ECa increases abruptly. This abrupt and contrasting change in ECa is depicted in both figures 3 and 4, and outlines the base of the alluvial fan. As with the terrace scarp, subsurface lateral flow of groundwater laden with soluble salts is presumed to periodically discharges along the base of the fan producing the higher ECa. A large area of shallow, coarser-textured, wind blown deposits is located near “B.” The low clay and soluble salt contents of these deposits are responsible for the lower ECa near B. Lower-lying and wetter soils occur near “C.” In Figure 3, increased moisture and soluble salt contents of these soils are believed to responsible for the higher ECa near C. While spatial patterns of ECa are complex and variable, they closely adhere to soil and landscape patterns.
Figure 4. Apparent conductivity of the Red Ledges Site obtained with the EM31 meter in the vertical dipole
orientation. Hambrick Bottom: This is the only site that was surveyed in both June 2003 and May 2004. Hambrick Bottom is composed of alluvial deposits overlying the contact of the Summerville and Morrison formations. Table 3 summarizes the results of the EMI surveys at Hambrick Bottom. Within this site, ECa ranged from about –7 to 351 mS/m. Negative values are attributed to calibration errors and surface or near-surface metallic artifacts. With the EM38DD meter, ECa increased and became slightly more variable with increasing depth. In the shallower-sensing, horizontal dipole orientation, ECa averaged 50.3 mS/m with a standard deviation of about 58 mS/m. One-half the observations had an ECa between about 8 and 71 mS/m. In the deeper-sensing, vertical dipole orientation, ECa averaged about 71 mS/m with a standard deviation of about 71 mS/m. One-half the observations had an ECa between about 19 and 97 mS/m. With the EM31 meter, ECa was only measured in the vertical dipole orientation. Apparent conductivity averaged about 70 mS/m with
10
a standard deviation of about 53 mS/m. One-half the observations had an ECa between about 33 and 88 mS/m. The increased ECa with increasing depth is attributable principally to higher contents of soluble salts at greater soil depths. The high variability of EMI responses is attributed to variations in the concentration of soluble salts within the site.
Table 3. Basic EMI Statistics for Hambrick Bottom Site EM38DD-VDO EM38DD-HDO EM31-VDO Number 4757 4757 2264 Minimum 5.0 -7.2 17.0 Maximum 351.4 288.0 266.0 25%-TILE 18.6 7.5 33.0 75%-TILE 97.4 71.4 88.0 Average 70.8 50.3 70.9 Standard Deviation
70.5 58.2 53.1
Figure 5. Plots of ECa obtained at the Hambrick Bottom Site with the EM38DD meter.
Figure 5 and 6 show the spatial distribution of ECa across the Hambrick site as measured with the EM38DD and the EM31meters, respectively. In Figure 5, measurements obtained with the EM38DD meter in the horizontal and vertical dipole orientations are shown in the left- and right-hand plots, respectively. In each plot, color variations have been used to show the distribution of ECa. In each plot the isoline interval is 10 mS/m. The locations of the observation points and the EMI traverse lines are shown in each figure. The San Rafael River (SRR) forms the western and southwestern boundaries of the site. Steep cliffs of the red Summerville formation form the eastern and northern boundary of the survey area. In each plot, the location of the San Rafael River and bedrock escarpment are labeled.
11
Figure 6. Apparent conductivity of the Hambrick Site obtained with the EM31 meter in the vertical dipole orientation.
In figures 5 and 6, areas of high ECa form conspicuous linear bands that border an alluvial fan (near A), and bedrock escarpments (exposed bedrock extends along the entire eastern and northern borders of the site). In general, these bands of high ECa appear to emanate from the bases of fans and escarpments and extend down slope towards the San Rafael River. These bands of high ECa are believed to represent zones of subsurface seepage: areas that receive larger amounts of soluble salt and moisture. Comparing figures 5 and 6, it is apparent that ECa peaks at intermediate depths (most pronounced responses appear to be recorded with the EM38DD meter in the vertical dipole orientation) and then remain decreases with increasing depth (as shown in the EM31 data in Figure 6). Hambrick Bottom West: Hambrick Bottom West is composed of alluvial deposits overlying the contact of the Summerville and Morrison formations. Table 4 summarizes the results of the EMI surveys at Hambrick Bottom West. Within this site, ECa ranged from about 0 to 324 mS/m. With the EM38DD meter, ECa increased and became slightly more variable with increasing depth. In the shallower-sensing, horizontal dipole orientation, ECa averaged about 97 mS/m with a standard deviation of about 66 mS/m. One-half the observations had an ECa between about 40 and 144 mS/m. In the deeper-sensing, vertical dipole orientation, ECa averaged about 121 mS/m with a standard deviation of about 74 mS/m. One-half the observations had an ECa between about 57 and 177 mS/m. With the EM31 meter, ECa was only measured in the vertical dipole orientation. Apparent conductivity averaged 102.8 mS/m with a standard deviation of about 53 mS/m. One-half the observations had an ECa between about 56 and 140 mS/m. The increased ECa with increasing
12
depth is attributable principally to higher contents of soluble salts at greater soil depths. The high variability of EMI responses is attributed principally to variations in the concentration of soluble salts within the site.
Table 4. Basic EMI Statistics for Hambrick Bottom West Site EM38DD-VDO EM38DD-HDO EM31-VDO Number 2225 2225 1958 Minimum 8.5 0.4 21.0 Maximum 323.6 280.2 259.0 25%-TILE 56.9 40.5 55.5 75%-TILE 176.8 143.9 140.5 Average 121.3 96.9 102.8 Standard Deviation
74.5 66.1 53.1
Figure 7. Plots of ECa obtained at the Hambrick Bottom West Site with the EM38DD meter. Figures 7 and 8 show the spatial distribution of ECa across the Hambrick West site as measured with the EM38DD and EM31 meters, respectively. In Figure 7, measurements obtained with the EM38DD meter in the horizontal and vertical dipole orientations are shown in the upper and lower plots, respectively. In both figures, color variations have
13
been used to show the distribution of ECa. In each plot the isoline interval is 10 mS/m. The locations of the observation points and the EMI traverse lines are shown in each figure. The San Rafael River forms the southern and southeastern boundaries of the survey area. Steep cliffs of the red Summerville formation form the eastern portion of the northern boundary to the survey area. In each plot, the location of the San Rafael River and bedrock escarpment are labeled.
Figure 8. Apparent conductivity of the Hambrick Bottom West Site obtained with the EM31 meter in the vertical dipole
orientation. In figures 7 and 8, areas of high ECa form a conspicuous east-west trending band at the base of the bedrock escarpment and an alluvial fan (see A in each plot). This is characteristic of the other survey sites as well. Three rather conspicuous bands (near B, C, and D) of high ECa appear to connect the high ECa zone at the base of the escarpment and alluvial fan with the San Rafael River. Similar continuous and direct flow paths between the bedrock escarpment and the San Rafael River were absent or poorly expressed in the other surveyed areas. Conclusions: Within the surveyed sites, linear features of high ECa were observed. The location and orientation of these features of higher ECa suggest seepage from adjoining fans, terrace scarps, and bedrock escarpments. Salt-bearing waters appear to follow lithologic and stratigraphic boundaries and drain from the base of these topographic features. These waters leave high concentrations of residual salts in the soil near the bases of alluvial fans, terrace scarps, and bedrock escarpments. References: Cook, P. G. and B. G. Williams. 1998. Electromagnetic Induction Techniques; Part 8 of the Basics of recharge and discharge. CSIRO Publishing, Collingwood, Australia. de Jong, E., A. K. Ballantyne, D. R. Cameron, and D. L. Read. 1979. Measurement of apparent electrical conductivity of soils by an electromagnetic induction probe to aid salinity surveys. Soil Sci. Soc. Am. J. 43:810-812. Diaz, L., and J. Herrero. 1992. Salinity estimates in irrigated soils using electromagnetic induction. Soil Sci. 154(2): 151-157.
14
Geonics Limited. 2000. EM38DD ground conductivity meter: Dual dipole version operating manual. Geonics Ltd., Mississauga, Ontario. Greenhouse, J. P., and D. D. Slaine. 1983. The use of reconnaissance electromagnetic methods to map contaminant migration. Ground Water Monitoring Review 3(2): 47-59. Hadley, H. 2002. Transit sources of salinity loading in the San Rafael River, Colorado River Basin, Utah. Executive Project Summary. USDI BLM, Salt Lake City, Utah. Kachanoski, R. G., E. G. Gregorich, and I. J. Van Wesenbeeck. 1988. Estimating spatial variations of soil water content using noncontacting electromagnetic inductive methods. Can. J. Soil Sci. 68:715-722. Law, J. P. Jr., and A. G. Hornsby. 1982. The Colorado River salinity problem: Water Supply and Management 6(1-2): 87-104. McNeill, J. D. 1980a. Electromagnetic terrain conductivity measurement at low induction numbers. Technical Note TN-6. Geonics Ltd., Mississauga, Ontario. McNeill, J. D. 1980b. Electrical Conductivity of soils and rocks. Technical Note TN-5. Geonics Ltd., Mississauga, Ontario. Rhoades, J. D., P. A. Raats, and R. J. Prather. 1976. Effects of liquid-phase electrical conductivity, water content, and surface conductivity on bulk soil electrical conductivity. Soil Sci. Soc. Am. J. 40:651-655. van der Lelij, 1983. Use of electromagnetic induction instrument (Type EM-38) for mapping soil salinity. Water Resources Commission, Murrumbidgee Division, New South Wales, Australia. Williams, B. G., and G. C. Baker. 1982. An electromagnetic induction technique for reconnaissance surveys of soil salinity hazards. Australian Journal of Soil Res. 20: 107-118. Wollenhaupt, N. C., J. L. Richardson, J. E. Foss, and E. C. Doll. 1986. A rapid method for estimating weighted soil salinity from apparent soil electrical conductivity measured with an aboveground electromagnetic induction meter. Can J. Soil Sci. 66:315-321.