Page 1
UNITED STATES
SECURITIES AND EXCHANGE COMMISSION Washington, D.C. 20549
FORM 10-Q
(Mark One)
QUARTERLY REPORT PURSUANT TO SECTION 13 OR 15(d) OF THE SECURITIES EXCHANGE
ACT OF 1934
For the quarterly period ended May 29, 2010
OR
TRANSITION REPORT PURSUANT TO SECTION 13 OR 15(d) OF THE SECURITIES EXCHANGE
ACT OF 1934
For the transition period from to
Commission File Number: 1-9595
BEST BUY CO., INC. (Exact name of registrant as specified in its charter)
Minnesota 41-0907483
(State or other jurisdiction of incorporation or organization) (I.R.S. Employer Identification No.)
7601 Penn Avenue South
Richfield, Minnesota 55423
(Address of principal executive offices) (Zip Code)
(612) 291-1000 (Registrant’s telephone number, including area code)
N/A (Former name, former address and former fiscal year, if changed since last report)
Indicate by check mark whether the registrant (1) has filed all reports required to be filed by Section 13 or 15(d) of the Securities Exchange Act
of 1934 during the preceding 12 months (or such shorter period that the registrant was required to file such reports), and (2) has been subject to such
filing requirements for the past 90 days. Yes No
Indicate by check mark whether the registrant has submitted electronically and posted on its corporate Web site, if any, every Interactive Data
File required to be submitted and posted pursuant to Rule 405 of Regulation S-T (§ 229.405 of this chapter) during the preceding 12 months (or for
such shorter period that the registrant was required to submit and post such files). Yes No
Indicate by check mark whether the registrant is a large accelerated filer, an accelerated filer, a non-accelerated filer, or a smaller reporting
company. See the definitions of ―large accelerated filer,‖ ―accelerated filer‖ and ―smaller reporting company‖ in Rule 12b-2 of the Exchange Act.
Large accelerated filer Accelerated filer
Non-accelerated filer Smaller reporting company
Indicate by check mark whether the registrant is a shell company (as defined in Rule 12b-2 of the Exchange Act). Yes No
APPLICABLE ONLY TO ISSUERS INVOLVED IN BANKRUPTCY PROCEEDINGS DURING THE PRECEDING FIVE YEARS:
Indicate by check mark whether the registrant has filed all documents and reports required to be filed by Sections 12, 13 or 15(d) of the
Securities Exchange Act of 1934 subsequent to the distribution of securities under a plan confirmed by a court. Yes No
APPLICABLE ONLY TO CORPORATE ISSUERS:
Indicate the number of shares outstanding of each of the issuer’s classes of common stock, as of the latest practicable date. Common Stock, $.10
Par Value — 416,930,000 shares outstanding as of July 2, 2010.
Page 2
2
BEST BUY CO., INC.
FORM 10-Q FOR THE QUARTER ENDED MAY 29, 2010
INDEX
Part I — Financial Information .......................................................................................................................................................... 3
Item 1. Condensed Consolidated Financial Statements (Unaudited) ........................................................................ 3
a) Condensed consolidated balance sheets as of May 29, 2010; February 27, 2010; and May 30, 2009 .......... 3
b) Consolidated statements of earnings for the three months ended May 29, 2010, and May 30, 2009 ........... 5
c) Consolidated statements of changes in shareholders’ equity for the three months ended May 29, 2010,
and May 30, 2009 ........................................................................................................................................ 6
d) Consolidated statements of cash flows for the three months ended May 29, 2010, and May 30, 2009 ........ 7
e) Notes to condensed consolidated financial statements ................................................................................. 8
Item 2. Management’s Discussion and Analysis of Financial Condition and Results of Operations ....................... 28
Item 3. Quantitative and Qualitative Disclosures About Market Risk ...................................................................... 37
Item 4. Controls and Procedures ............................................................................................................................... 38
Part II — Other Information 39
Item 2. Unregistered Sales of Equity Securities and Use of Proceeds ...................................................................... 39
Item 4. Reserved ....................................................................................................................................................... 39
Item 6. Exhibits ......................................................................................................................................................... 39
Signatures .......................................................................................................................................................................................... 40
Page 3
3
PART I — FINANCIAL INFORMATION
ITEM 1. CONSOLIDATED FINANCIAL STATEMENTS
BEST BUY CO., INC.
CONDENSED CONSOLIDATED BALANCE SHEETS
ASSETS
($ in millions, except per share amounts)
(Unaudited)
May 29,
2010
February 27,
2010
May 30,
2009
CURRENT ASSETS
Cash and cash equivalents..................................................................... $ 1,239 $ 1,826 $ 535
Short-term investments ......................................................................... 205 90 8
Receivables ........................................................................................... 1,579 2,020 1,427
Merchandise inventories ....................................................................... 6,335 5,486 5,486
Other current assets ............................................................................... 1,030 1,144 954
Total current assets ........................................................................... 10,388 10,566 8,410
PROPERTY AND EQUIPMENT, NET ................................................... 3,982 4,070 4,184
GOODWILL ............................................................................................. 2,386 2,452 2,296
TRADENAMES, NET ............................................................................. 153 159 167
CUSTOMER RELATIONSHIPS, NET ................................................... 247 279 305
EQUITY AND OTHER INVESTMENTS ............................................... 323 324 421
OTHER ASSETS ...................................................................................... 477 452 431
TOTAL ASSETS ...................................................................................... $ 17,956 $ 18,302 $ 16,214
NOTE: The consolidated balance sheet as of February 27, 2010, has been condensed from the audited consolidated financial
statements.
See Notes to Condensed Consolidated Financial Statements.
Page 4
4
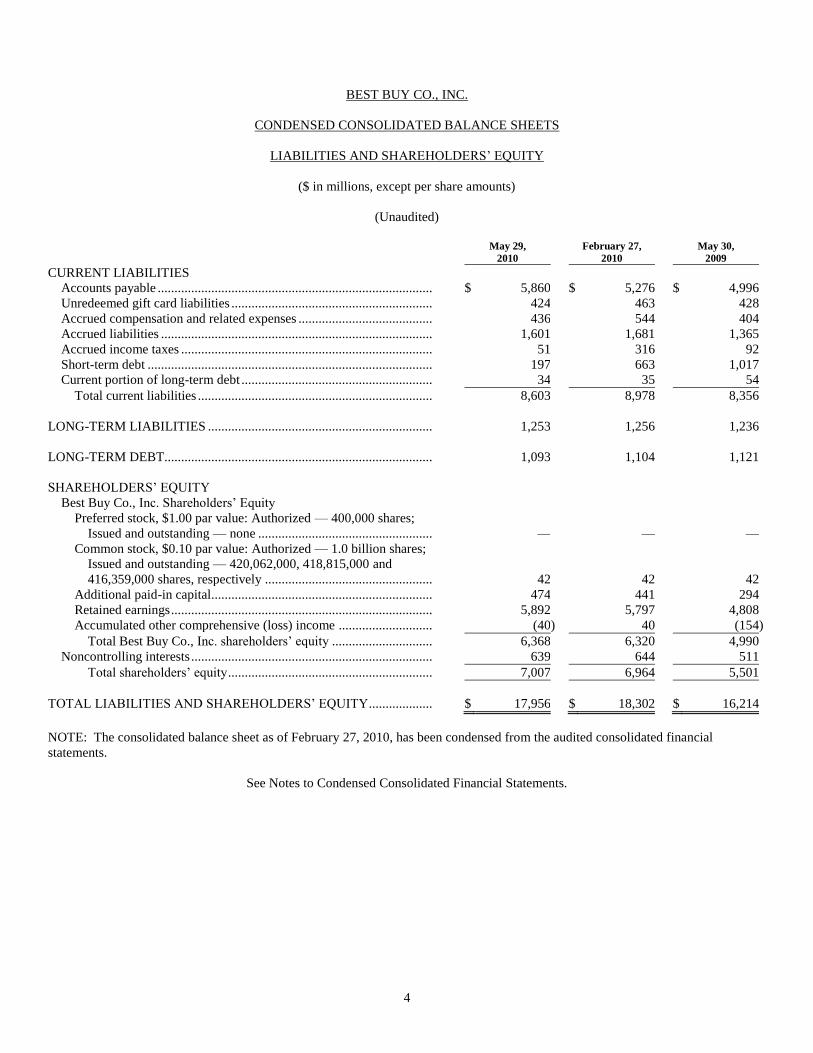
BEST BUY CO., INC.
CONDENSED CONSOLIDATED BALANCE SHEETS
LIABILITIES AND SHAREHOLDERS’ EQUITY
($ in millions, except per share amounts)
(Unaudited)
May 29,
2010
February 27,
2010
May 30,
2009
CURRENT LIABILITIES
Accounts payable .................................................................................. $ 5,860 $ 5,276 $ 4,996
Unredeemed gift card liabilities ............................................................ 424 463 428
Accrued compensation and related expenses ........................................ 436 544 404
Accrued liabilities ................................................................................. 1,601 1,681 1,365
Accrued income taxes ........................................................................... 51 316 92
Short-term debt ..................................................................................... 197 663 1,017
Current portion of long-term debt ......................................................... 34 35 54
Total current liabilities ...................................................................... 8,603 8,978 8,356
LONG-TERM LIABILITIES ................................................................... 1,253 1,256 1,236
LONG-TERM DEBT................................................................................ 1,093 1,104 1,121
SHAREHOLDERS’ EQUITY
Best Buy Co., Inc. Shareholders’ Equity
Preferred stock, $1.00 par value: Authorized — 400,000 shares;
Issued and outstanding — none .................................................... — — —
Common stock, $0.10 par value: Authorized — 1.0 billion shares;
Issued and outstanding — 420,062,000, 418,815,000 and
416,359,000 shares, respectively .................................................. 42 42 42
Additional paid-in capital.................................................................. 474 441 294
Retained earnings .............................................................................. 5,892 5,797 4,808
Accumulated other comprehensive (loss) income ............................ (40 ) 40 (154 )
Total Best Buy Co., Inc. shareholders’ equity .............................. 6,368 6,320 4,990
Noncontrolling interests ........................................................................ 639 644 511
Total shareholders’ equity ............................................................. 7,007 6,964 5,501
TOTAL LIABILITIES AND SHAREHOLDERS’ EQUITY ................... $ 17,956 $ 18,302 $ 16,214
NOTE: The consolidated balance sheet as of February 27, 2010, has been condensed from the audited consolidated financial
statements.
See Notes to Condensed Consolidated Financial Statements.
Page 5
5
BEST BUY CO., INC.
CONSOLIDATED STATEMENTS OF EARNINGS
($ in millions, except per share amounts)
(Unaudited)
Three Months Ended
May 29,
2010
May 30,
2009
Revenue ................................................................................................................................... $ 10,787 $ 10,095
Cost of goods sold .................................................................................................................... 7,994 7,538
Gross profit .............................................................................................................................. 2,793 2,557
Selling, general and administrative expenses ........................................................................... 2,480 2,209
Restructuring charges............................................................................................................... — 52
Operating income ..................................................................................................................... 313 296
Other income (expense) ...........................................................................................................
Investment income and other ............................................................................................... 12 9
Interest expense .................................................................................................................... (23 ) (23 )
Earnings before income tax expense ........................................................................................ 302 282
Income tax expense .................................................................................................................. 121 126
Net earnings including noncontrolling interests ...................................................................... 181 156
Net earnings attributable to noncontrolling interests ............................................................... (26 ) (3 )
Net earnings attributable to Best Buy Co., Inc. ........................................................................ $ 155 $ 153
Earnings per share attributable to Best Buy Co., Inc.
Basic .................................................................................................................................... $ 0.37 $ 0.37
Diluted ................................................................................................................................. $ 0.36 $ 0.36
Dividends declared per common share .................................................................................... $ 0.14 $ 0.14
Weighted average common shares outstanding (in millions) ..................................................
Basic .................................................................................................................................... 420.3 415.2
Diluted ................................................................................................................................. 431.7 425.7
See Notes to Condensed Consolidated Financial Statements.
Page 6
6
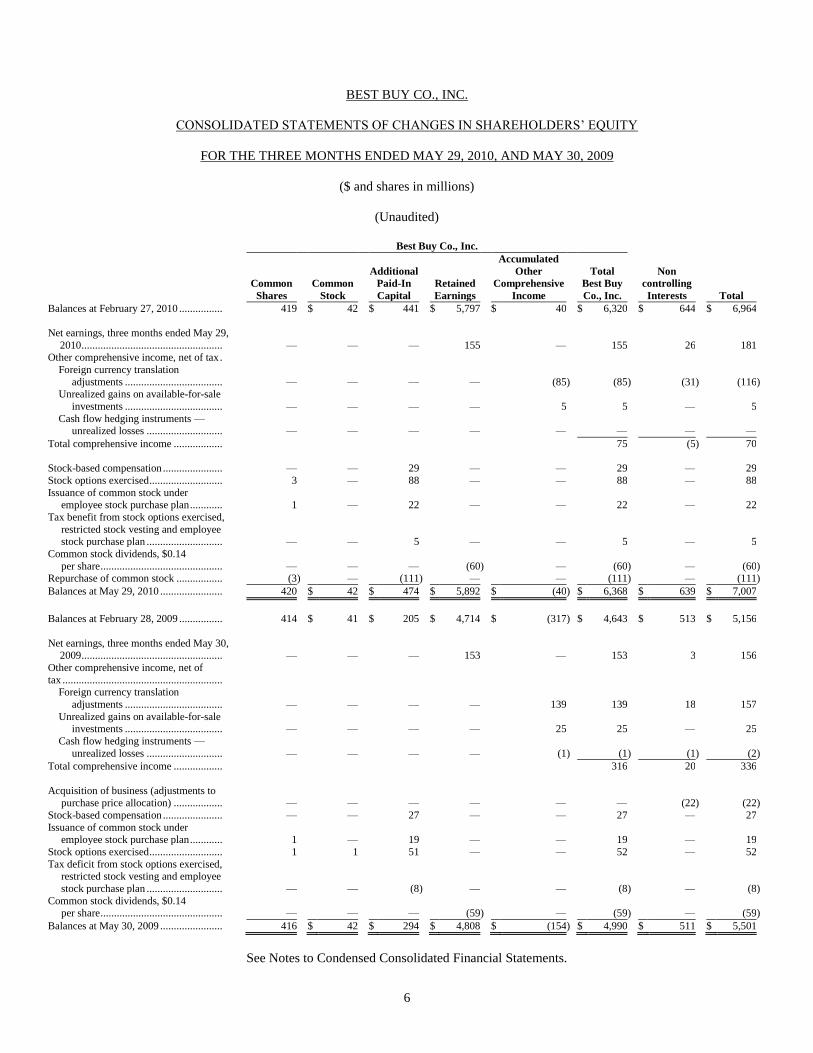
BEST BUY CO., INC.
CONSOLIDATED STATEMENTS OF CHANGES IN SHAREHOLDERS’ EQUITY
FOR THE THREE MONTHS ENDED MAY 29, 2010, AND MAY 30, 2009
($ and shares in millions)
(Unaudited)
Best Buy Co., Inc.
Common
Shares
Common
Stock
Additional
Paid-In
Capital
Retained
Earnings
Accumulated
Other
Comprehensive
Income
Total
Best Buy
Co., Inc.
Non
controlling
Interests Total
Balances at February 27, 2010 ................ 419 $ 42 $ 441 $ 5,797 $ 40 $ 6,320 $ 644 $ 6,964
Net earnings, three months ended May 29,
2010 .................................................... — — — 155 — 155 26 181 Other comprehensive income, net of tax .
Foreign currency translation
adjustments .................................... — — — — (85 ) (85 ) (31 ) (116 ) Unrealized gains on available-for-sale
investments .................................... — — — — 5 5 — 5
Cash flow hedging instruments — unrealized losses ............................ — — — — — — — —
Total comprehensive income .................. 75 (5 ) 70
Stock-based compensation ...................... — — 29 — — 29 — 29
Stock options exercised ........................... 3 — 88 — — 88 — 88
Issuance of common stock under employee stock purchase plan ............ 1 — 22 — — 22 — 22
Tax benefit from stock options exercised,
restricted stock vesting and employee stock purchase plan ............................ — — 5 — — 5 — 5
Common stock dividends, $0.14
per share ............................................. — — — (60 ) — (60 ) — (60 )
Repurchase of common stock ................. (3 ) — (111 ) — — (111 ) — (111 )
Balances at May 29, 2010 ....................... 420 $ 42 $ 474 $ 5,892 $ (40 ) $ 6,368 $ 639 $ 7,007
Balances at February 28, 2009 ................ 414 $ 41 $ 205 $ 4,714 $ (317 ) $ 4,643 $ 513 $ 5,156
Net earnings, three months ended May 30, 2009 .................................................... — — — 153 — 153 3 156
Other comprehensive income, net of
tax ........................................................... Foreign currency translation
adjustments .................................... — — — — 139 139 18 157
Unrealized gains on available-for-sale investments .................................... — — — — 25 25 — 25
Cash flow hedging instruments —
unrealized losses ............................ — — — — (1 ) (1 ) (1 ) (2 )
Total comprehensive income .................. 316 20 336
Acquisition of business (adjustments to
purchase price allocation) .................. — — — — — — (22 ) (22 )
Stock-based compensation ...................... — — 27 — — 27 — 27
Issuance of common stock under employee stock purchase plan ............ 1 — 19 — — 19 — 19
Stock options exercised ........................... 1 1 51 — — 52 — 52
Tax deficit from stock options exercised, restricted stock vesting and employee
stock purchase plan ............................ — — (8 ) — — (8 ) — (8 )
Common stock dividends, $0.14 per share ............................................. — — — (59 ) — (59 ) — (59 )
Balances at May 30, 2009 ....................... 416 $ 42 $ 294 $ 4,808 $ (154 ) $ 4,990 $ 511 $ 5,501
See Notes to Condensed Consolidated Financial Statements.
Page 7
7
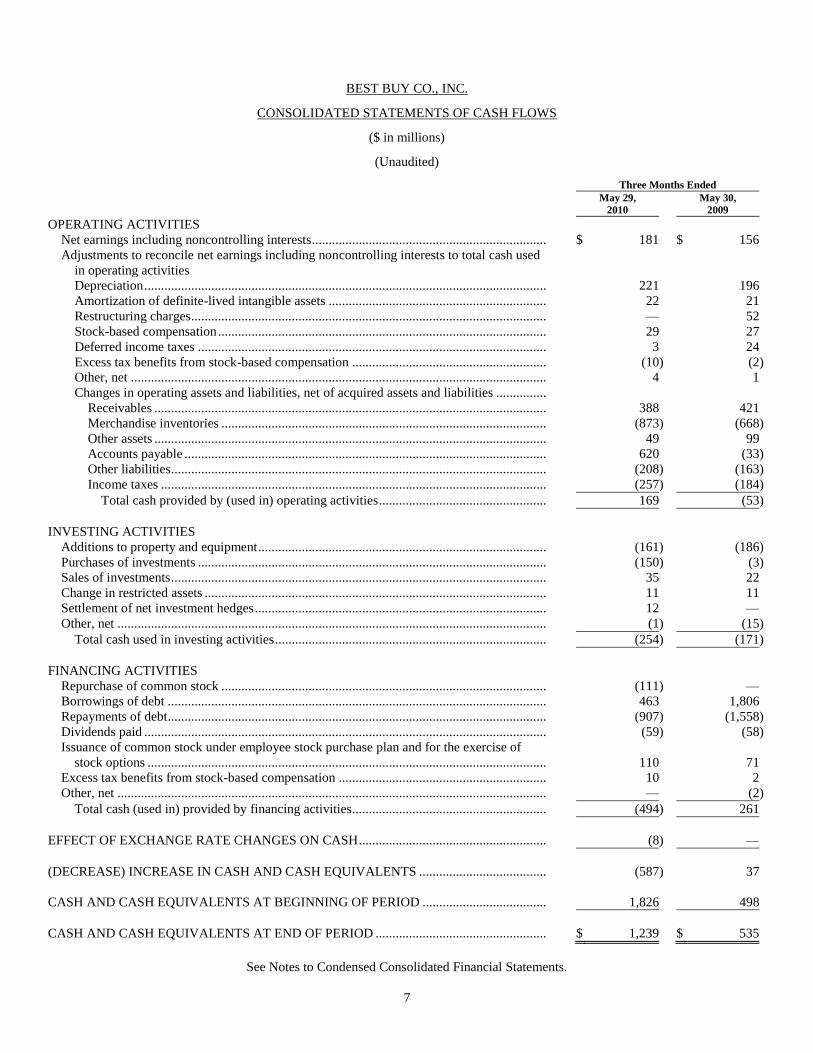
BEST BUY CO., INC.
CONSOLIDATED STATEMENTS OF CASH FLOWS
($ in millions)
(Unaudited)
Three Months Ended
May 29,
2010
May 30,
2009
OPERATING ACTIVITIES
Net earnings including noncontrolling interests...................................................................... $ 181 $ 156
Adjustments to reconcile net earnings including noncontrolling interests to total cash used
in operating activities
Depreciation ........................................................................................................................ 221 196
Amortization of definite-lived intangible assets ................................................................. 22 21
Restructuring charges .......................................................................................................... — 52
Stock-based compensation .................................................................................................. 29 27
Deferred income taxes ........................................................................................................ 3 24
Excess tax benefits from stock-based compensation .......................................................... (10 ) (2 )
Other, net ............................................................................................................................ 4 1
Changes in operating assets and liabilities, net of acquired assets and liabilities ...............
Receivables ..................................................................................................................... 388 421
Merchandise inventories ................................................................................................. (873 ) (668 )
Other assets ..................................................................................................................... 49 99
Accounts payable ............................................................................................................ 620 (33 )
Other liabilities................................................................................................................ (208 ) (163 )
Income taxes ................................................................................................................... (257 ) (184 )
Total cash provided by (used in) operating activities .................................................. 169 (53 )
INVESTING ACTIVITIES
Additions to property and equipment ...................................................................................... (161 ) (186 )
Purchases of investments ........................................................................................................ (150 ) (3 )
Sales of investments ................................................................................................................ 35 22
Change in restricted assets ...................................................................................................... 11 11
Settlement of net investment hedges ....................................................................................... 12 —
Other, net ................................................................................................................................ (1 ) (15 )
Total cash used in investing activities ................................................................................. (254 ) (171 )
FINANCING ACTIVITIES
Repurchase of common stock ................................................................................................. (111 ) —
Borrowings of debt ................................................................................................................. 463 1,806
Repayments of debt................................................................................................................. (907 ) (1,558 )
Dividends paid ........................................................................................................................ (59 ) (58 )
Issuance of common stock under employee stock purchase plan and for the exercise of
stock options ....................................................................................................................... 110 71
Excess tax benefits from stock-based compensation .............................................................. 10 2
Other, net ................................................................................................................................ — (2 )
Total cash (used in) provided by financing activities.......................................................... (494 ) 261
EFFECT OF EXCHANGE RATE CHANGES ON CASH ........................................................ (8 ) —
(DECREASE) INCREASE IN CASH AND CASH EQUIVALENTS ...................................... (587 ) 37
CASH AND CASH EQUIVALENTS AT BEGINNING OF PERIOD ..................................... 1,826 498
CASH AND CASH EQUIVALENTS AT END OF PERIOD ................................................... $ 1,239 $ 535
See Notes to Condensed Consolidated Financial Statements.
Page 8
8
BEST BUY CO., INC.
NOTES TO CONDENSED CONSOLIDATED FINANCIAL STATEMENTS
($ in millions, except per share amounts)
(Unaudited)
1. Basis of Presentation
Unless the context otherwise requires, the use of the terms ―Best Buy,‖ ―we,‖ ―us‖ and ―our‖ in these Notes to Condensed
Consolidated Financial Statements refers to Best Buy Co., Inc. and its consolidated subsidiaries.
In the opinion of management, the accompanying condensed consolidated financial statements contain all adjustments
necessary for a fair presentation as prescribed by accounting principles generally accepted in the United States (―GAAP‖). All
adjustments were comprised of normal recurring adjustments, except as noted in these Notes to Condensed Consolidated
Financial Statements.
Historically, we have realized more of our revenue and earnings in the fiscal fourth quarter, which includes the majority of the
holiday shopping season in the U.S., Europe and Canada, than in any other fiscal quarter. Due to the seasonal nature of our
business, interim results are not necessarily indicative of results for the entire fiscal year. The interim financial statements and
the related notes in this Quarterly Report on Form 10-Q should be read in conjunction with the consolidated financial
statements and related notes included in our Annual Report on Form 10-K for the fiscal year ended February 27, 2010.
In order to align our fiscal reporting periods and comply with statutory filing requirements in certain foreign jurisdictions, we
consolidate the financial results of our Europe, China, Mexico and Turkey operations on a two-month lag. There were no
significant intervening events which would have materially affected our consolidated financial statements had they been
recorded during the three months ended May 29, 2010.
In preparing the accompanying condensed consolidated financial statements, we evaluated the period from May 30, 2010
through the date the financial statements were issued for material subsequent events requiring recognition or disclosure. Other
than the sale of our Speakeasy business, as discussed in Note 13, Subsequent Event, no such events were identified for this
period.
New Accounting Standards
Consolidation of Variable Interest Entities — In June 2009, the Financial Accounting Standards Board (―FASB‖) issued new
guidance on the treatment of a consolidation of variable interest entities (―VIE‖) in response to concerns about the application
of certain key provisions of pre-existing guidance, including those regarding the transparency of an involvement with a VIE.
Specifically, this new guidance requires a qualitative approach to identifying a controlling financial interest in a VIE and
requires ongoing assessment of whether an entity is a VIE and whether an interest in a VIE makes the holder the primary
beneficiary of the VIE. In addition, this new guidance requires additional disclosures about an involvement with a VIE and any
significant changes in risk exposure due to that involvement. This new guidance is effective for fiscal years beginning after
November 15, 2009. As such, we adopted the new guidance on February 28, 2010, and determined that it did not have an
impact on our consolidated financial position or results of operations.
Transfers of Financial Assets — In June 2009, the FASB issued new guidance on the treatment of transfers of financial assets
which eliminates the concept of a ―qualifying special-purpose entity,‖ changes the requirements for derecognizing financial
assets, and requires additional disclosures in order to enhance information reported to users of financial statements by providing
greater transparency about transfers of financial assets, including securitization transactions, and an entity’s continuing
involvement in and exposure to the risks related to transferred financial assets. This new guidance is effective for fiscal years
beginning after November 15, 2009. As such, we adopted the new guidance on February 28, 2010, and determined that it did
not have an impact on our consolidated financial position or results of operations.
Page 9
9
2. Investments
Investments were comprised of the following:
May 29,
2010
February 27,
2010
May 30,
2009
Short-term investments
Money market fund ...................................................................................... $ 2 $ 2 $ 8
U.S. Treasury bills ....................................................................................... 150 — —
Debt securities (auction-rate securities) ....................................................... 53 88 —
Total short-term investments ........................................................................... $ 205 $ 90 $ 8
Equity and other investments
Debt securities (auction-rate securities) ....................................................... $ 180 $ 192 $ 298
Marketable equity securities ........................................................................ 87 77 79
Other investments ........................................................................................ 56 55 44
Total equity and other investments .................................................................. $ 323 $ 324 $ 421
Debt Securities
Our debt securities are comprised of auction-rate securities (―ARS‖). We classify our investments in ARS as available-for-sale
and carry them at fair value. ARS were intended to behave like short-term debt instruments because their interest rates reset
periodically through an auction process, most commonly at intervals of seven, 28 and 35 days. The auction process had
historically provided a means by which we could rollover the investment or sell these securities at par in order to provide us
with liquidity as needed.
In February 2008, auctions began to fail due to insufficient buyers, as the amount of securities submitted for sale in auctions
exceeded the aggregate amount of the bids. For each failed auction, the interest rate on the security moves to a maximum rate
specified for each security, and generally resets at a level higher than specified short-term interest rate benchmarks. To date, we
have collected all interest due on our ARS and expect to continue to do so in the future.
As a result of the persistent failed auctions, and the uncertainty of when these investments could be liquidated at par, we have
classified all of our investments in ARS as non-current assets within equity and other investments in our condensed consolidated
balance sheet at May 29, 2010, except for $53, which was marketed and sold to us by UBS AG and its affiliates (collectively,
―UBS‖) and is classified within short-term investments. In October 2008, we accepted a settlement with UBS pursuant to which
UBS issued to us Series C-2 Auction Rate Securities Rights (―ARS Rights‖). The ARS Rights provide us the right to receive the
full par value of our UBS-brokered ARS plus accrued but unpaid interest at any time between June 30, 2010, and July 2, 2012.
We sold $41 of ARS at par during the first three months of fiscal 2011, of which $35 were UBS-brokered ARS redeemed prior
to the date specified by the ARS Rights. However, at May 29, 2010, our entire remaining ARS portfolio, consisting of 39
investments in ARS having an aggregate value at par of $243, was subject to failed auctions. Subsequent to May 29, 2010, and
through July 6, 2010, we sold $93 of ARS at par value, including the remaining $53 of the UBS-brokered ARS pursuant to the
ARS Rights.
Our ARS portfolio consisted of the following, at fair value:
Description Nature of collateral or guarantee
May 29,
2010
February 27,
2010
May 30,
2009
Student loan bonds .......................................
Student loans guaranteed 95% to
100% by the U.S. government $ 214 $ 261 $ 274
Municipal revenue bonds .............................
100% insured by AA/Aa-rated bond
insurers at May 29, 2010 19 19 24
Total fair value plus accrued interest(1)............. $ 233 $ 280 $ 298
(1)
The par value and weighted-average interest rates (taxable equivalent) of our ARS were $243, $285 and $312, and 1.49%,
1.10% and 1.59%, respectively, at May 29, 2010, February 27, 2010, and May 30, 2009, respectively.
At May 29, 2010, our ARS portfolio was 75% AAA/Aaa-rated, 11% AA/Aa-rated and 14% A/A-rated.
Page 10
10
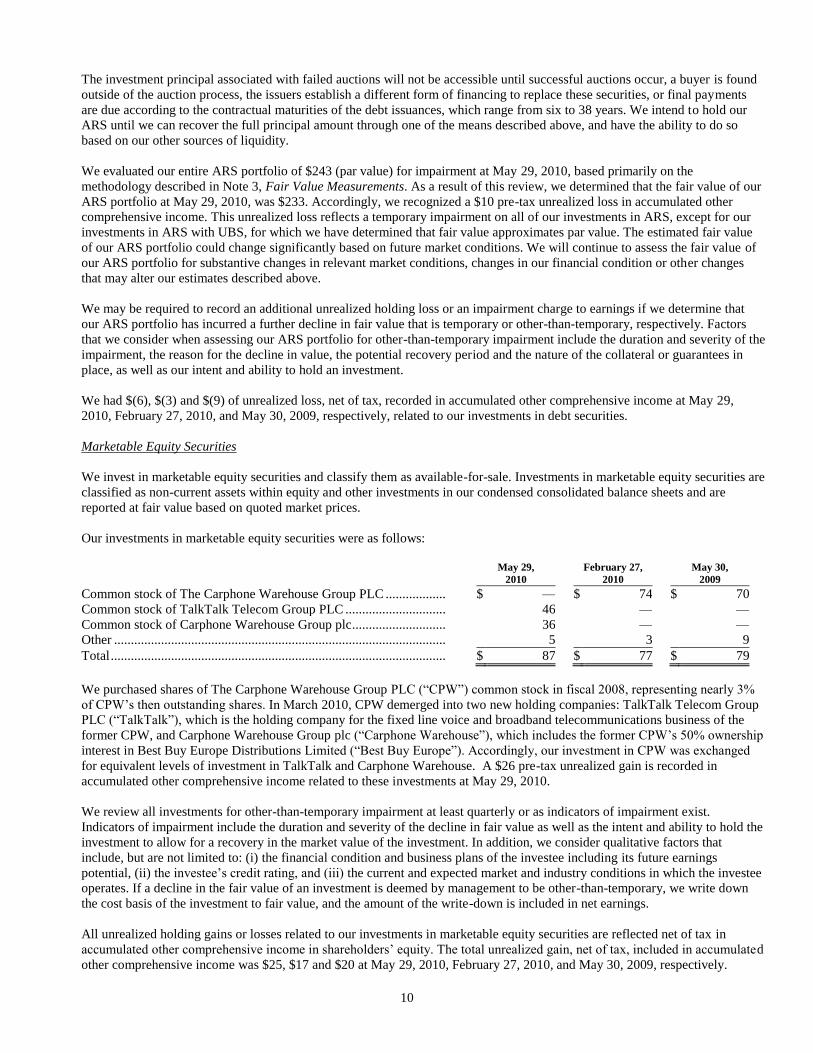
The investment principal associated with failed auctions will not be accessible until successful auctions occur, a buyer is found
outside of the auction process, the issuers establish a different form of financing to replace these securities, or final payments
are due according to the contractual maturities of the debt issuances, which range from six to 38 years. We intend to hold our
ARS until we can recover the full principal amount through one of the means described above, and have the ability to do so
based on our other sources of liquidity.
We evaluated our entire ARS portfolio of $243 (par value) for impairment at May 29, 2010, based primarily on the
methodology described in Note 3, Fair Value Measurements. As a result of this review, we determined that the fair value of our
ARS portfolio at May 29, 2010, was $233. Accordingly, we recognized a $10 pre-tax unrealized loss in accumulated other
comprehensive income. This unrealized loss reflects a temporary impairment on all of our investments in ARS, except for our
investments in ARS with UBS, for which we have determined that fair value approximates par value. The estimated fair value
of our ARS portfolio could change significantly based on future market conditions. We will continue to assess the fair value of
our ARS portfolio for substantive changes in relevant market conditions, changes in our financial condition or other changes
that may alter our estimates described above.
We may be required to record an additional unrealized holding loss or an impairment charge to earnings if we determine that
our ARS portfolio has incurred a further decline in fair value that is temporary or other-than-temporary, respectively. Factors
that we consider when assessing our ARS portfolio for other-than-temporary impairment include the duration and severity of the
impairment, the reason for the decline in value, the potential recovery period and the nature of the collateral or guarantees in
place, as well as our intent and ability to hold an investment.
We had $(6), $(3) and $(9) of unrealized loss, net of tax, recorded in accumulated other comprehensive income at May 29,
2010, February 27, 2010, and May 30, 2009, respectively, related to our investments in debt securities.
Marketable Equity Securities
We invest in marketable equity securities and classify them as available-for-sale. Investments in marketable equity securities are
classified as non-current assets within equity and other investments in our condensed consolidated balance sheets and are
reported at fair value based on quoted market prices.
Our investments in marketable equity securities were as follows:
May 29,
2010
February 27,
2010
May 30,
2009
Common stock of The Carphone Warehouse Group PLC .................. $ — $ 74 $ 70
Common stock of TalkTalk Telecom Group PLC .............................. 46 — —
Common stock of Carphone Warehouse Group plc ............................ 36 — —
Other ................................................................................................... 5 3 9
Total .................................................................................................... $ 87 $ 77 $ 79
We purchased shares of The Carphone Warehouse Group PLC (―CPW‖) common stock in fiscal 2008, representing nearly 3%
of CPW’s then outstanding shares. In March 2010, CPW demerged into two new holding companies: TalkTalk Telecom Group
PLC (―TalkTalk‖), which is the holding company for the fixed line voice and broadband telecommunications business of the
former CPW, and Carphone Warehouse Group plc (―Carphone Warehouse‖), which includes the former CPW’s 50% ownership
interest in Best Buy Europe Distributions Limited (―Best Buy Europe‖). Accordingly, our investment in CPW was exchanged
for equivalent levels of investment in TalkTalk and Carphone Warehouse. A $26 pre-tax unrealized gain is recorded in
accumulated other comprehensive income related to these investments at May 29, 2010.
We review all investments for other-than-temporary impairment at least quarterly or as indicators of impairment exist.
Indicators of impairment include the duration and severity of the decline in fair value as well as the intent and ability to hold the
investment to allow for a recovery in the market value of the investment. In addition, we consider qualitative factors that
include, but are not limited to: (i) the financial condition and business plans of the investee including its future earnings
potential, (ii) the investee’s credit rating, and (iii) the current and expected market and industry conditions in which the investee
operates. If a decline in the fair value of an investment is deemed by management to be other-than-temporary, we write down
the cost basis of the investment to fair value, and the amount of the write-down is included in net earnings.
All unrealized holding gains or losses related to our investments in marketable equity securities are reflected net of tax in
accumulated other comprehensive income in shareholders’ equity. The total unrealized gain, net of tax, included in accumulated
other comprehensive income was $25, $17 and $20 at May 29, 2010, February 27, 2010, and May 30, 2009, respectively.
Page 11
11
Other Investments
The aggregate carrying values of investments accounted for using either the cost method or the equity method, at May 29, 2010,
February 27, 2010, and May 30, 2009, were $56, $55 and $44, respectively.
3. Fair Value Measurements
Fair value is the price that would be received to sell an asset or paid to transfer a liability (an exit price) in the principal or most
advantageous market for the asset or liability in an orderly transaction between market participants on the measurement date.
We use a three-tier valuation hierarchy based upon observable and non-observable inputs:
Level 1 — Unadjusted quoted prices that are available in active markets for the identical assets or liabilities at the measurement
date.
Level 2 — Significant other observable inputs available at the measurement date, other than quoted prices included in Level 1,
either directly or indirectly, including:
Quoted prices for similar assets or liabilities in active markets;
Quoted prices for identical or similar assets in non-active markets;
Inputs other than quoted prices that are observable for the asset or liability; and
Inputs that are derived principally from or corroborated by other observable market data.
Level 3 — Significant unobservable inputs that cannot be corroborated by observable market data and reflect the use of
significant management judgment. These values are generally determined using pricing models for which the assumptions
utilize management’s estimates of market participant assumptions.
Assets and Liabilities that are Measured at Fair Value on a Recurring Basis
The fair value hierarchy requires the use of observable market data when available. In instances in which the inputs used to
measure fair value fall into different levels of the fair value hierarchy, the fair value measurement has been determined based on
the lowest level input that is significant to the fair value measurement in its entirety. Our assessment of the significance of a
particular item to the fair value measurement in its entirety requires judgment, including the consideration of inputs specific to
the asset or liability. The following tables set forth by level within the fair value hierarchy, our financial assets and liabilities
that were accounted for at fair value on a recurring basis at May 29, 2010, February 27, 2010, and May 30, 2009, according to
the valuation techniques we used to determine their fair values.
Page 12
12
Fair Value Measurements
Using Inputs Considered as
Fair Value at
May 29,
2010
Quoted Prices
in Active
Markets for
Identical Assets
(Level 1)
Significant
Other
Observable
Inputs
(Level 2)
Significant
Unobservable
Inputs
(Level 3)
ASSETS
Cash and cash equivalents
Money market funds .................................... $ 232 $ 232 $ — $ —
U.S. Treasury bills ....................................... 200 200 — —
Short-term investments ........................................
Money market fund ...................................... 2 — 2 —
U.S. Treasury bills ....................................... 150 150 — —
Auction-rate securities ................................. 53 — — 53
Other current assets
Money market funds (restricted cash) .......... 120 120 — —
U.S. Treasury bills (restricted cash) ............. 10 10 — —
Foreign currency derivative instruments ...... 1 — 1 —
Equity and other investments ...............................
Auction-rate securities ................................. 180 — — 180
Marketable equity securities ........................ 87 87 — —
Other assets
Marketable equity securities that fund
deferred compensation ............................. 79 79 — —
Foreign currency derivative instruments ...... 1 — 1 —
LIABILITIES
Long-term liabilities
Deferred compensation ................................ 66 66 — —
Fair Value Measurements
Using Inputs Considered as
Fair Value at
February 27,
2010
Quoted Prices
in Active
Markets for
Identical Assets
(Level 1)
Significant
Other
Observable
Inputs
(Level 2)
Significant
Unobservable
Inputs
(Level 3)
ASSETS
Cash and cash equivalents
Money market funds ...................................... $ 752 $ 752 $ — $ —
U.S. Treasury bills ......................................... 300 300 — —
Short-term investments ..........................................
Money market fund ........................................ 2 — 2 —
Auction-rate securities ................................... 88 — — 88
Other current assets
Money market funds (restricted cash) ............ 123 123 — —
U.S. Treasury bills (restricted cash) ............... 25 25 — —
Foreign currency derivative instruments ........ 4 — 4 —
Equity and other investments .................................
Auction-rate securities ................................... 192 — — 192
Marketable equity securities .......................... 77 77 — —
Other assets
Marketable equity securities that fund
deferred compensation ............................... 75 75 — —
LIABILITIES
Long-term liabilities
Deferred compensation .................................. 61 61 — —
Page 13
13
Fair Value Measurements
Using Inputs Considered as
Fair Value at
May 30,
2009
Quoted Prices
in Active
Markets for
Identical Assets
(Level 1)
Significant
Other
Observable
Inputs
(Level 2)
Significant
Unobservable
Inputs
(Level 3)
ASSETS
Short-term investments
Money market fund ...................................... $ 8 $ — $ 8 $ —
Other current assets
U.S. Treasury bills (restricted cash) ............. 85 85 — —
Money market funds (restricted cash) .......... 60 60 — —
Foreign currency derivative instruments ...... 3 — 3 —
Equity and other investments ...............................
Auction rate securities .................................. 298 — — 298
Marketable equity securities ........................ 79 79 — —
Other assets
Marketable equity securities that fund
deferred compensation ............................. 67 67 — —
LIABILITIES
Accrued liabilities
Foreign currency derivative instruments ...... 6 — 6 —
Long-term liabilities
Deferred compensation ................................ 56 56 — —
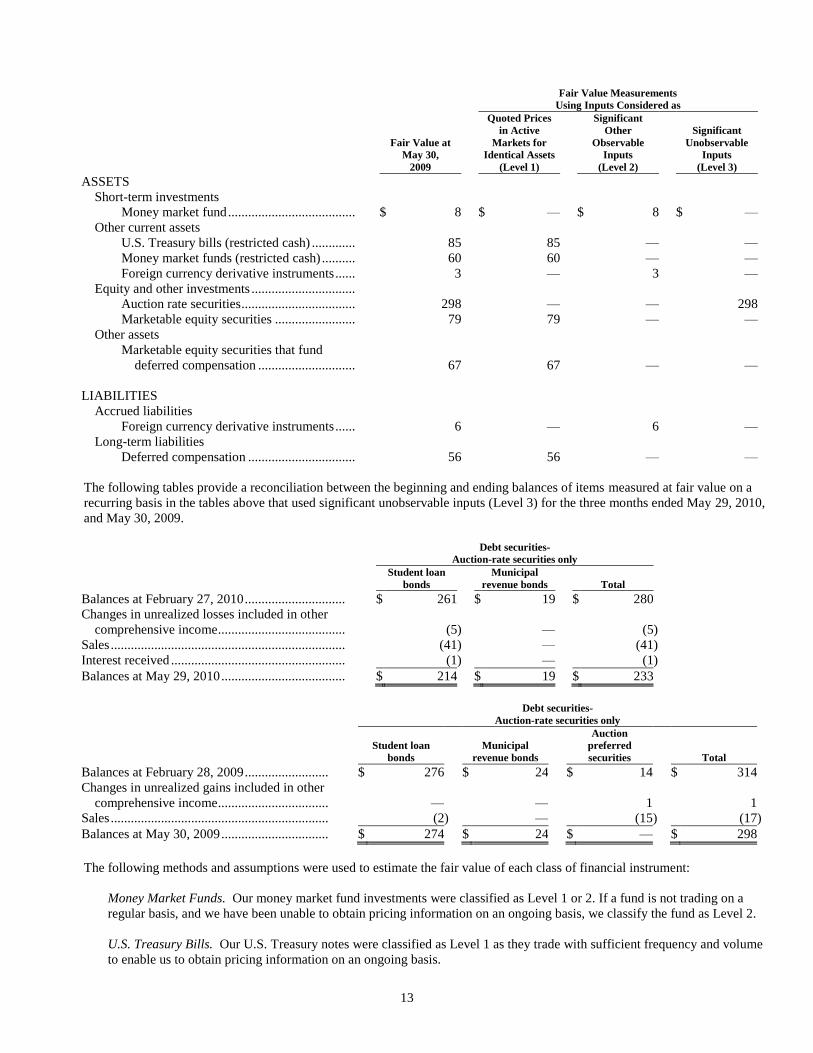
The following tables provide a reconciliation between the beginning and ending balances of items measured at fair value on a
recurring basis in the tables above that used significant unobservable inputs (Level 3) for the three months ended May 29, 2010,
and May 30, 2009.
Debt securities-
Auction-rate securities only
Student loan
bonds
Municipal
revenue bonds Total
Balances at February 27, 2010 .............................. $ 261 $ 19 $ 280
Changes in unrealized losses included in other
comprehensive income ...................................... (5 ) — (5 )
Sales ...................................................................... (41 ) — (41 )
Interest received .................................................... (1 ) — (1 )
Balances at May 29, 2010 ..................................... $ 214 $ 19 $ 233
Debt securities-
Auction-rate securities only
Student loan
bonds
Municipal
revenue bonds
Auction
preferred
securities Total
Balances at February 28, 2009 ......................... $ 276 $ 24 $ 14 $ 314
Changes in unrealized gains included in other
comprehensive income ................................. — — 1 1
Sales ................................................................. (2 ) — (15 ) (17 )
Balances at May 30, 2009 ................................ $ 274 $ 24 $ — $ 298
The following methods and assumptions were used to estimate the fair value of each class of financial instrument:
Money Market Funds. Our money market fund investments were classified as Level 1 or 2. If a fund is not trading on a
regular basis, and we have been unable to obtain pricing information on an ongoing basis, we classify the fund as Level 2.
U.S. Treasury Bills. Our U.S. Treasury notes were classified as Level 1 as they trade with sufficient frequency and volume
to enable us to obtain pricing information on an ongoing basis.
Page 14
14
Foreign Currency Derivative Instruments. Comprised primarily of foreign currency forward contracts and foreign
currency swap contracts, our derivative instruments were measured at fair value using readily observable market inputs,
such as quotations on forward foreign exchange points and foreign interest rates. Our derivative instruments were classified
as Level 2 as these instruments are custom, over-the-counter contracts with various bank counterparties that are not traded
in an active market.
Auction-Rate Securities. Our investments in ARS were classified as Level 3 as quoted prices were unavailable due to
events described in Note 2, Investments. Due to limited market information, we utilized a discounted cash flow (―DCF‖)
model to derive an estimate of fair value. The assumptions used in preparing the DCF model included estimates with
respect to the amount and timing of future interest and principal payments, forward projections of the interest rate
benchmarks, the probability of full repayment of the principal considering the credit quality and guarantees in place, and
the rate of return required by investors to own such securities given the current liquidity risk associated with ARS.
Marketable Equity Securities. Our marketable equity securities were measured at fair value using quoted market prices.
They were classified as Level 1 as they trade in an active market for which closing stock prices are readily available.
Deferred Compensation. Our deferred compensation liabilities and the assets that fund our deferred compensation consist
of investments in mutual funds. These investments were classified as Level 1 as the shares of these mutual funds trade with
sufficient frequency and volume to enable us to obtain pricing information on an ongoing basis.
Assets and Liabilities that are Measured at Fair Value on a Nonrecurring Basis
Measurements to fair value on a nonrecurring basis relate primarily to our tangible fixed assets, goodwill and other intangible
assets and occur when the derived fair value is below carrying value on our condensed consolidated balance sheet. During the
three months ended May 29, 2010, and May 30, 2009, we had no significant remeasurements of such assets or liabilities to fair
value.
Fair Value of Financial Instruments
Our financial instruments, other than those presented in the disclosures above, include cash, receivables, other investments,
accounts payable, accrued liabilities and short- and long-term debt. The fair values of cash, receivables, accounts payable,
accrued liabilities and short-term debt approximated carrying values because of the short-term nature of these instruments. Fair
values for other investments held at cost are not readily available, but we estimate the carrying values for these investments
approximate fair value. See Note 6, Debt, for information about the fair value of our long-term debt.
4. Goodwill and Intangible Assets
The changes in the carrying values of goodwill and indefinite-lived tradenames by segment were as follows in the three months
ended May 29, 2010, and May 30, 2009:
Goodwill Indefinite-lived Tradenames
Domestic International Total Domestic International Total
Balances at February 27, 2010 .... $ 434 $ 2,018 $ 2,452 $ 32 $ 80 $ 112
Changes in foreign currency
exchange rates ......................... — (66 ) (66 ) — — —
Balances at May 29, 2010 ........... $ 434 $ 1,952 $ 2,386 $ 32 $ 80 $ 112
Goodwill Indefinite-lived Tradenames
Domestic International Total Domestic International Total
Balances at February 28, 2009 ...... $ 434 $ 1,769 $ 2,203 $ 32 $ 72 $ 104
Adjustments to purchase price
allocation ................................... — 10 10 — — —
Changes in foreign currency
exchange rates ........................... — 83 83 — 7 7
Balances at May 30, 2009 ............. $ 434 $ 1,862 $ 2,296 $ 32 $ 79 $ 111
Page 15
15
The following table provides the gross carrying values and related accumulated amortization of definite-lived intangible assets:
May 29, 2010 February 27, 2010 May 30, 2009
Gross
Carrying
Amount
Accumulated
Amortization
Gross
Carrying
Amount
Accumulated
Amortization
Gross
Carrying
Amount
Accumulated
Amortization
Tradenames ........................ $ 71 $ (30 ) $ 75 $ (28 ) $ 69 $ (13 )
Customer relationships....... 380 (133 ) 401 (122 ) 369 (64 )
Total ................................... $ 451 $ (163 ) $ 476 $ (150 ) $ 438 $ (77 )
Total amortization expense for the three months ended May 29, 2010, and May 30, 2009, was $22 and $21, respectively. The
estimated future amortization expense for identifiable intangible assets is as follows:
Fiscal Year
Remainder of fiscal 2011 ........................................ $ 62
2012 ........................................................................ 63
2013 ........................................................................ 43
2014 ........................................................................ 39
2015 ........................................................................ 34
Thereafter ................................................................ 47
5. Restructuring Charges
In the fourth quarter of fiscal 2009, we implemented a restructuring plan for our domestic and international businesses to
support our long-term growth plans and accordingly, we recorded charges of $78 related primarily to voluntary and involuntary
separation plans at our corporate headquarters. In addition, in the first quarter of fiscal 2010, we incurred restructuring charges
of $52 related to employee termination benefits and business reorganization costs at our U.S. Best Buy stores and Best Buy
Europe. No restructuring charges were recorded in the remainder of fiscal 2010 or in the first quarter of fiscal 2011.
All charges related to our restructuring plan were presented as restructuring charges in our consolidated statements of earnings.
The composition of our restructuring charges incurred in the three months ended May 29, 2010, and May 30, 2009, as well as
the cumulative amount incurred through May 29, 2010, for both the Domestic and International segments, were as follows:
Domestic International Total
Three months ended
Cumulative
Amount Three months ended
Cumulative
Amount Three months ended
Cumulative
Amount
May 29,
2010
May 30,
2009
through May
29, 2010
May 29,
2010
May 30,
2009
through May
29, 2010
May 29,
2010
May 30,
2009
through May
29, 2010
Termination benefits .................. $ — $ 25 $ 94 $ — $ 26 $ 32 $ — $ 51 $ 126
Facility closure costs .................. — — 1 — 1 1 — 1 2
Property and equipment write-
downs ........................................ — — 2 — — — — — 2
Total .......................................... $ — $ 25 $ 97 $ — $ 27 $ 33 $ — $ 52 $ 130
The following table summarizes our restructuring activity in the three months ended May 29, 2010, and May 30, 2009, related
to termination benefits and facility closure costs:
Termination
Benefits
Facility
Closure Costs Total
Balances at February 27, 2010 ........................................... $ 8 $ 1 $ 9
Charges .......................................................................... — — —
Cash payments ............................................................... (4 ) (1 ) (5 )
Balances at May 29, 2010 .................................................. $ 4 $ — $ 4
Termination
Benefits
Facility
Closure Costs Total
Balances at February 28, 2009 ........................................... $ 73 $ 1 $ 74
Charges .......................................................................... 51 1 52
Cash payments ............................................................... (67 ) — (67 )
Balances at May 30, 2009 .................................................. $ 57 $ 2 $ 59
Page 16
16
6. Debt
Short-Term Debt
Short-term debt consisted of the following:
May 29,
2010
February 27,
2010
May 30,
2009
JPMorgan revolving credit facility ............................................... $ — $ — $ 550
ARS revolving credit line ............................................................. — — —
Europe receivables financing facility(1) ............................................................. 178 442 —
Europe revolving credit facility .................................................... — 206 432
Canada revolving demand facility ................................................ — — —
China revolving demand facilities ................................................ 19 15 35
Total short-term debt..................................................................... $ 197 $ 663 $ 1,017
(1)
This facility is secured by certain network carrier receivables of Best Buy Europe, which are included within receivables in
our condensed consolidated balance sheet. Availability on this facility is based on a percentage of the available acceptable
receivables, as defined in the agreement for the facility, and was £296 (or $453) at May 29, 2010.
Long-Term Debt
Long-term debt consisted of the following:
May 29, 2010
February 27,
2010
May 30, 2009
6.75% notes .................................................................................... $ 500 $ 500 $ 500
Convertible debentures .................................................................. 402 402 402
Financing lease obligations ............................................................ 178 186 199
Capital lease obligations ................................................................ 45 49 61
Other debt ...................................................................................... 2 2 13
Total long-term debt ...................................................................... 1,127 1,139 1,175
Less: current portion ...................................................................... (34 ) (35 ) (54 )
Total long-term debt, less current portion ...................................... $ 1,093 $ 1,104 $ 1,121
The fair value of long-term debt approximated $1,217, $1,210 and $1,180 at May 29, 2010, February 27, 2010, and May 30,
2009, respectively, based primarily on the ask prices quoted from external sources, compared with carrying values of $1,127,
$1,139 and $1,175, respectively.
Other than as referred to above, see Note 6, Debt, in the Notes to Consolidated Financial Statements included in our Annual
Report on Form 10-K for the fiscal year ended February 27, 2010, for additional information regarding the terms of our debt
facilities and obligations.
7. Derivative Instruments
We manage our economic and transaction exposure to certain market-based risks through the use of derivative instruments. Our
primary objective in holding derivatives is to reduce the volatility of net earnings and cash flows associated with changes in
foreign currency exchange rates. We do not hold or issue derivative financial instruments for trading or speculative purposes.
We record all derivatives on our condensed consolidated balance sheets at fair value and evaluate hedge effectiveness
prospectively and retrospectively when electing to apply hedge accounting treatment. We formally document all hedging
relationships at inception for all derivative hedges and the underlying hedged items, as well as the risk management objectives
and strategies for undertaking the hedge transactions. In addition, we have derivatives which are not designated as hedging
instruments. We have no derivatives that have credit risk-related contingent features, and we mitigate our credit risk by
engaging with major financial institutions as our counterparties.
Page 17
17
Cash Flow Hedges
We enter into foreign exchange forward contracts to hedge against the effect of exchange rate fluctuations on certain revenue
streams denominated in non-functional currencies. The contracts have terms of up to three years. We report the effective portion
of the gain or loss on a cash flow hedge as a component of other comprehensive income, and it is subsequently reclassified into
net earnings in the period in which the hedged transaction affects net earnings or the forecasted transaction is no longer
probable of occurring. We report the ineffective portion, if any, of the gain or loss in net earnings.
Net Investment Hedges
Previously, we entered into foreign exchange swap contracts to hedge against the effect of euro and swiss franc exchange rate
fluctuations on net investments of certain foreign operations. For a net investment hedge, we recognize changes in the fair value
of the derivative as a component of foreign currency translation within other comprehensive income to offset a portion of the
change in the translated value of the net investment being hedged, until the investment is sold or liquidated. Subsequent to
February 27, 2010, we discontinued this hedging strategy and no longer have contracts that hedge net investments of foreign
operations.
Derivatives Not Designated as Hedging Instruments
Derivatives not designated as hedging instruments include foreign exchange forward contracts used to manage the impact of
fluctuations in foreign currency exchange rates relative to recognized receivable and payable balances denominated in non-
functional currencies and on certain forecasted inventory purchases and revenue streams denominated in non-functional
currencies. The contracts have terms of up to 12 months. These derivative instruments are not designated in hedging
relationships; therefore, we record gains and losses on these contracts directly in net earnings.
Summary of Derivative Balances
The following table presents the gross fair values for derivative instruments and the corresponding classification at May 29,
2010, February 27, 2010, and May 30, 2009:
May 29, 2010 February 27, 2010 May 30, 2009
Contract Type Assets Liabilities Assets Liabilities Assets Liabilities
Cash flow hedges (foreign exchange forward
contracts) ........................................................ $ 2 $ (1 ) $ 2 $ (1 ) $ 3 $ (1 )
Net investment hedges (foreign exchange swap
contracts) ........................................................ — — 4 — — (3 )
Total derivatives designated as hedging
instruments ..................................................... $ 2 $ (1 ) $ 6 $ (1 ) $ 3 $ (4 )
No hedge designation (foreign exchange forward
contracts) ........................................................ 2 (1 ) 1 (2 ) — (2 )
Total ................................................................... $ 4 $ (2 ) $ 7 $ (3 ) $ 3 $ (6 )
The following table presents the effects of derivative instruments on other comprehensive income (―OCI‖) and on our
consolidated statements of earnings for the three months ended May 30, 2010 and May 29, 2009:
May 29, 2010 May 30, 2009
Contract Type
Pre-tax
Gain(Loss)
Recognized in
OCI (1)
Gain(Loss)
Reclassified
from
Accumulated
OCI to Earnings
(Effective
Portion) (2)
Pre-tax
Gain(Loss)
Recognized in
OCI (1)
Gain(Loss)
Reclassified
from
Accumulated
OCI to Earnings
(Effective
Portion) (2)
Cash flow hedges (foreign exchange forward
contracts) ...................................................... $ — $ 1 $ (2 ) $ —
Net investment hedges (foreign exchange swap
contracts) ...................................................... 8 — 18 —
Total ................................................................. $ 8 $ 1 $ 16 $ —
Page 18
18
(1)
Reflects the amount recognized in OCI prior to the reclassification of 50% to noncontrolling interests for the cash flow and
net investment hedges, respectively.
(2)
Gain reclassified from accumulated OCI is included within selling, general and administrative expenses (―SG&A‖) in our
consolidated statements of earnings.
The following table presents the effects of derivatives not designated as hedging instruments on our consolidated statements of
earnings for the three months ended May 30, 2010 and May 29, 2009:
Gain (Loss) Recognized within SG&A
Contract Type
Three months ended
May 29, 2010
Three months ended
May 30, 2009
No hedge designation (foreign exchange forward contracts) ............... $ 5 $ (4 )
The following table presents the notional amounts of our foreign currency exchange contracts at May 29, 2010, February 27,
2010, and May 30, 2009:
Notional Amount
Contract Type May 29, 2010 February 27, 2010 May 30, 2009
Derivatives designated as cash flow hedging instruments ............ $ 297 $ 203 $ 213
Derivatives designated as net investment hedging instruments .... — 608 638
Derivatives not designated as hedging instruments ...................... 194 240 31
Total .............................................................................................. $ 491 $ 1,051 $ 882
8. Earnings per Share
We compute our basic earnings per share based on the weighted average number of common shares outstanding and our diluted
earnings per share based on the weighted average number of common shares outstanding adjusted by the number of additional
shares that would have been outstanding had the potentially dilutive common shares been issued. Potentially dilutive shares of
common stock include stock options, nonvested share awards, shares issuable under our employee stock purchase plan and
common shares that would have resulted from the assumed conversion of our convertible debentures. Since the potentially
dilutive shares related to the convertible debentures are included in the computation, the related interest expense, net of tax, is
added back to net earnings, as the interest would not have been paid if the convertible debentures had been converted to
common stock. Nonvested market based share awards and nonvested performance based share awards are included in the
average diluted shares outstanding each period if established market or performance criteria have been met at the end of the
respective periods.
The following table presents a reconciliation of the numerators and denominators of basic and diluted earnings per share
attributable to Best Buy Co., Inc. (shares in millions):
Three Months Ended
May 29,
2010
May 30,
2009
Numerator
Net earnings attributable to Best Buy Co., Inc., basic............................................ $ 155 $ 153
Adjustment for assumed dilution:
Interest on convertible debentures, net of tax .................................................... 1 1
Net earnings attributable to Best Buy Co., Inc., diluted ......................................... $ 156 $ 154
Denominator
Weighted-average common shares outstanding ..................................................... 420.3 415.2
Effect of potentially dilutive securities:
Shares from assumed conversion of convertible debentures .............................. 8.8 8.8
Stock options and other ...................................................................................... 2.6 1.7
Weighted-average common shares outstanding, assuming dilution ....................... 431.7 425.7
Earnings per share attributable to Best Buy Co., Inc.
Basic ...................................................................................................................... $ 0.37 $ 0.37
Diluted ................................................................................................................... $ 0.36 $ 0.36
Page 19
19
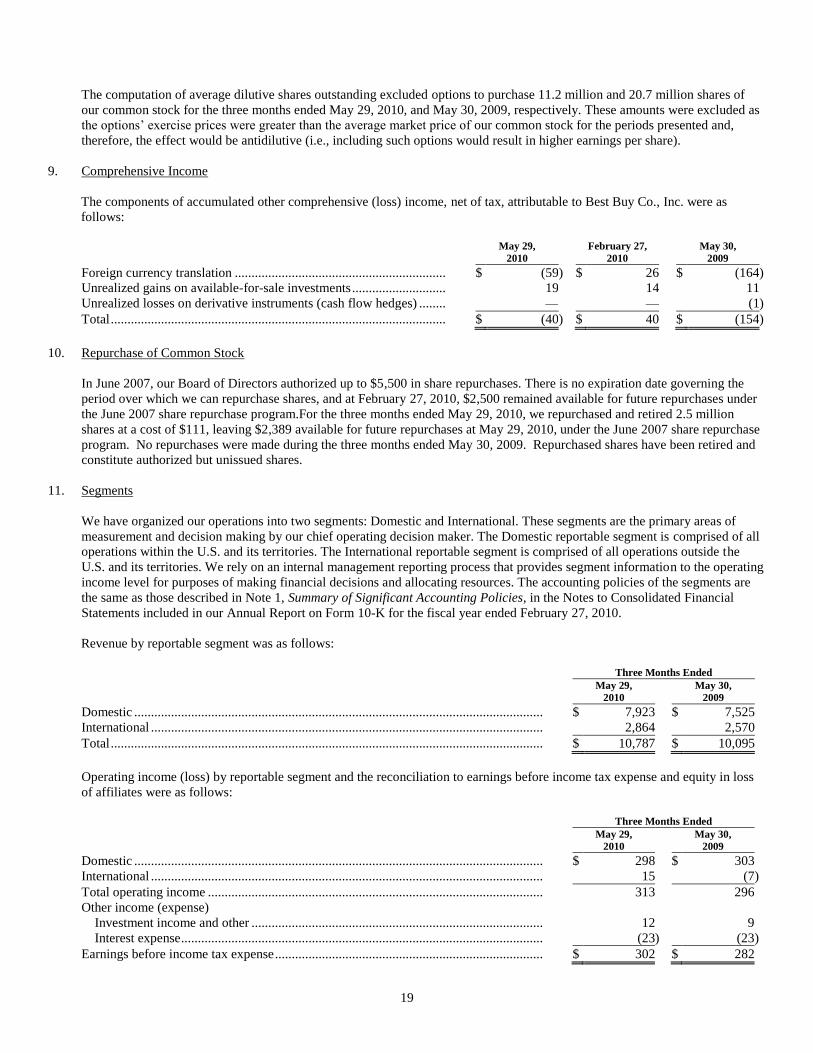
The computation of average dilutive shares outstanding excluded options to purchase 11.2 million and 20.7 million shares of
our common stock for the three months ended May 29, 2010, and May 30, 2009, respectively. These amounts were excluded as
the options’ exercise prices were greater than the average market price of our common stock for the periods presented and,
therefore, the effect would be antidilutive (i.e., including such options would result in higher earnings per share).
9. Comprehensive Income
The components of accumulated other comprehensive (loss) income, net of tax, attributable to Best Buy Co., Inc. were as
follows:
May 29,
2010
February 27,
2010
May 30,
2009
Foreign currency translation ............................................................... $ (59 ) $ 26 $ (164 )
Unrealized gains on available-for-sale investments ............................ 19 14 11
Unrealized losses on derivative instruments (cash flow hedges) ........ — — (1 )
Total .................................................................................................... $ (40 ) $ 40 $ (154 )
10. Repurchase of Common Stock
In June 2007, our Board of Directors authorized up to $5,500 in share repurchases. There is no expiration date governing the
period over which we can repurchase shares, and at February 27, 2010, $2,500 remained available for future repurchases under
the June 2007 share repurchase program.For the three months ended May 29, 2010, we repurchased and retired 2.5 million
shares at a cost of $111, leaving $2,389 available for future repurchases at May 29, 2010, under the June 2007 share repurchase
program. No repurchases were made during the three months ended May 30, 2009. Repurchased shares have been retired and
constitute authorized but unissued shares.
11. Segments
We have organized our operations into two segments: Domestic and International. These segments are the primary areas of
measurement and decision making by our chief operating decision maker. The Domestic reportable segment is comprised of all
operations within the U.S. and its territories. The International reportable segment is comprised of all operations outside the
U.S. and its territories. We rely on an internal management reporting process that provides segment information to the operating
income level for purposes of making financial decisions and allocating resources. The accounting policies of the segments are
the same as those described in Note 1, Summary of Significant Accounting Policies, in the Notes to Consolidated Financial
Statements included in our Annual Report on Form 10-K for the fiscal year ended February 27, 2010.
Revenue by reportable segment was as follows:
Three Months Ended
May 29,
2010
May 30,
2009
Domestic .......................................................................................................................... $ 7,923 $ 7,525
International ..................................................................................................................... 2,864 2,570
Total ................................................................................................................................. $ 10,787 $ 10,095
Operating income (loss) by reportable segment and the reconciliation to earnings before income tax expense and equity in loss
of affiliates were as follows:
Three Months Ended
May 29,
2010
May 30,
2009
Domestic .......................................................................................................................... $ 298 $ 303
International ..................................................................................................................... 15 (7 )
Total operating income .................................................................................................... 313 296
Other income (expense)
Investment income and other ....................................................................................... 12 9
Interest expense ............................................................................................................ (23 ) (23 )
Earnings before income tax expense ................................................................................ $ 302 $ 282
Page 20
20
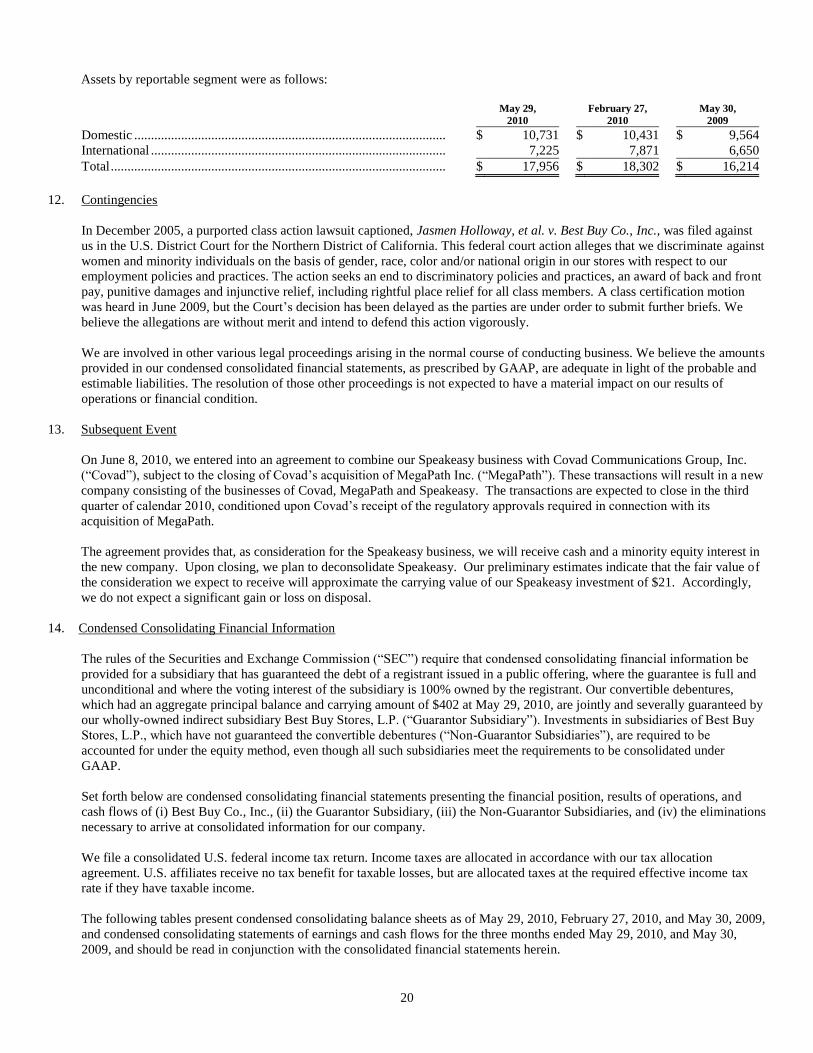
Assets by reportable segment were as follows:
May 29,
2010
February 27,
2010
May 30,
2009
Domestic ............................................................................................. $ 10,731 $ 10,431 $ 9,564
International ........................................................................................ 7,225 7,871 6,650
Total .................................................................................................... $ 17,956 $ 18,302 $ 16,214
12. Contingencies
In December 2005, a purported class action lawsuit captioned, Jasmen Holloway, et al. v. Best Buy Co., Inc., was filed against
us in the U.S. District Court for the Northern District of California. This federal court action alleges that we discriminate against
women and minority individuals on the basis of gender, race, color and/or national origin in our stores with respect to our
employment policies and practices. The action seeks an end to discriminatory policies and practices, an award of back and front
pay, punitive damages and injunctive relief, including rightful place relief for all class members. A class certification motion
was heard in June 2009, but the Court’s decision has been delayed as the parties are under order to submit further briefs. We
believe the allegations are without merit and intend to defend this action vigorously.
We are involved in other various legal proceedings arising in the normal course of conducting business. We believe the amounts
provided in our condensed consolidated financial statements, as prescribed by GAAP, are adequate in light of the probable and
estimable liabilities. The resolution of those other proceedings is not expected to have a material impact on our results of
operations or financial condition.
13. Subsequent Event
On June 8, 2010, we entered into an agreement to combine our Speakeasy business with Covad Communications Group, Inc.
(―Covad‖), subject to the closing of Covad’s acquisition of MegaPath Inc. (―MegaPath‖). These transactions will result in a new
company consisting of the businesses of Covad, MegaPath and Speakeasy. The transactions are expected to close in the third
quarter of calendar 2010, conditioned upon Covad’s receipt of the regulatory approvals required in connection with its
acquisition of MegaPath.
The agreement provides that, as consideration for the Speakeasy business, we will receive cash and a minority equity interest in
the new company. Upon closing, we plan to deconsolidate Speakeasy. Our preliminary estimates indicate that the fair value of
the consideration we expect to receive will approximate the carrying value of our Speakeasy investment of $21. Accordingly,
we do not expect a significant gain or loss on disposal.
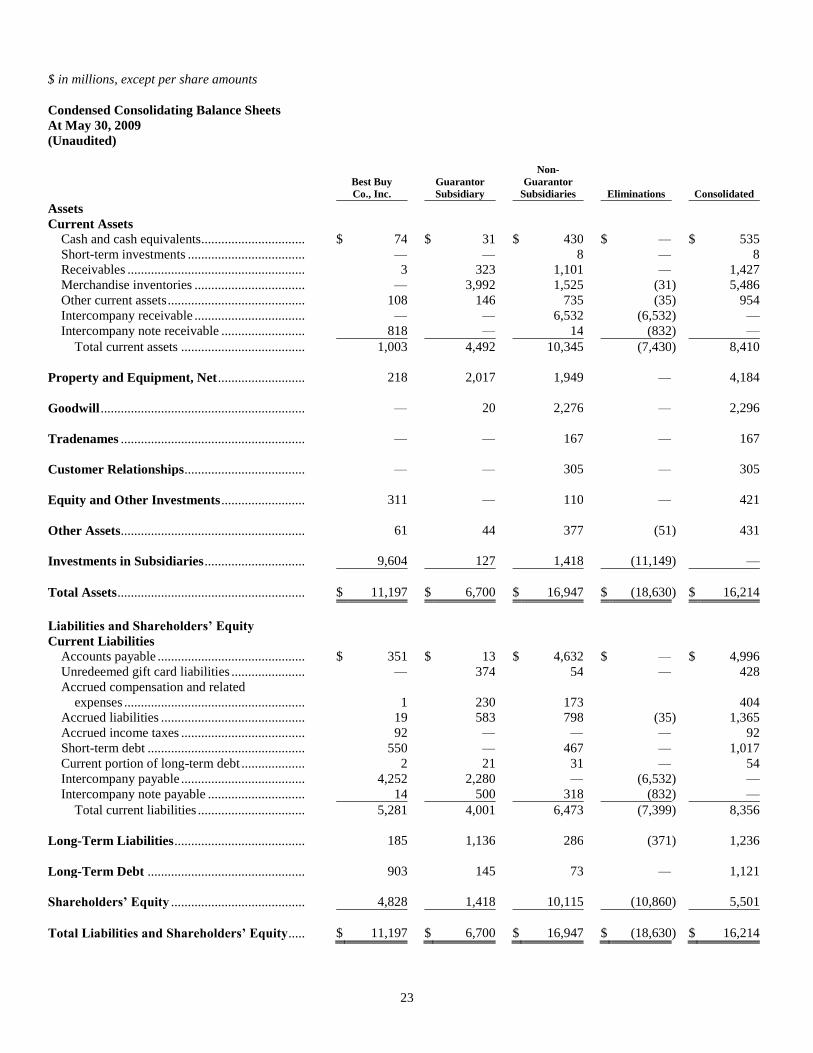
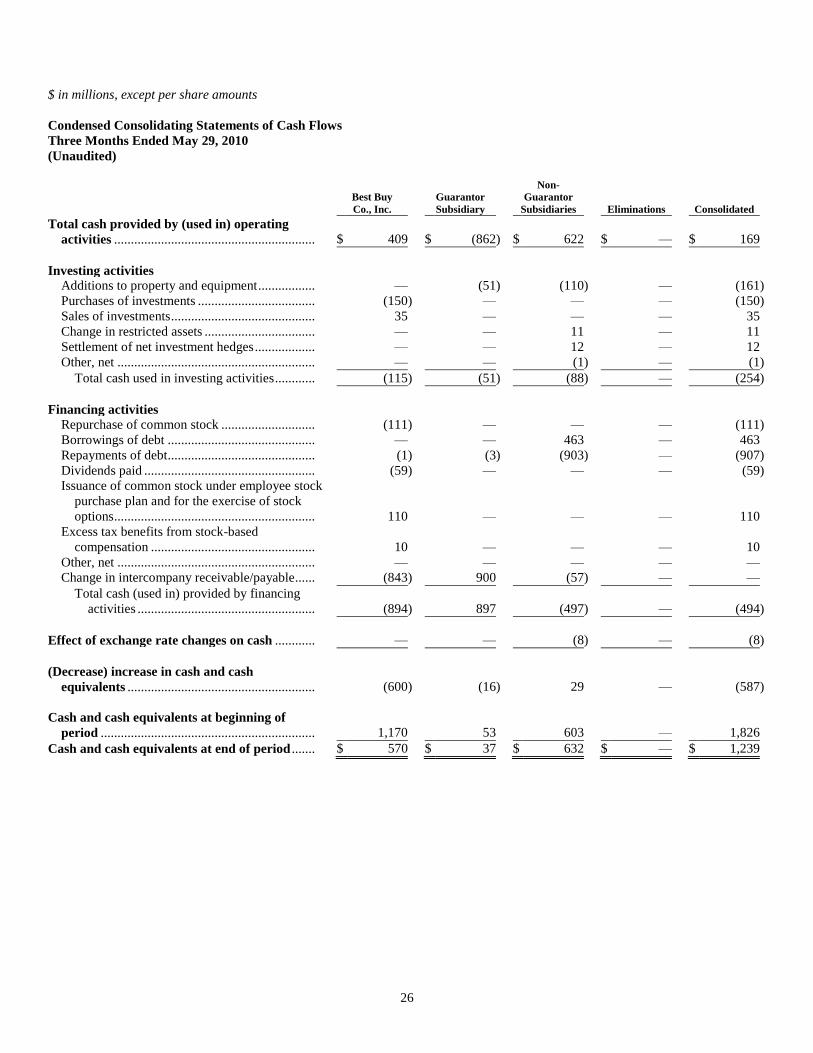
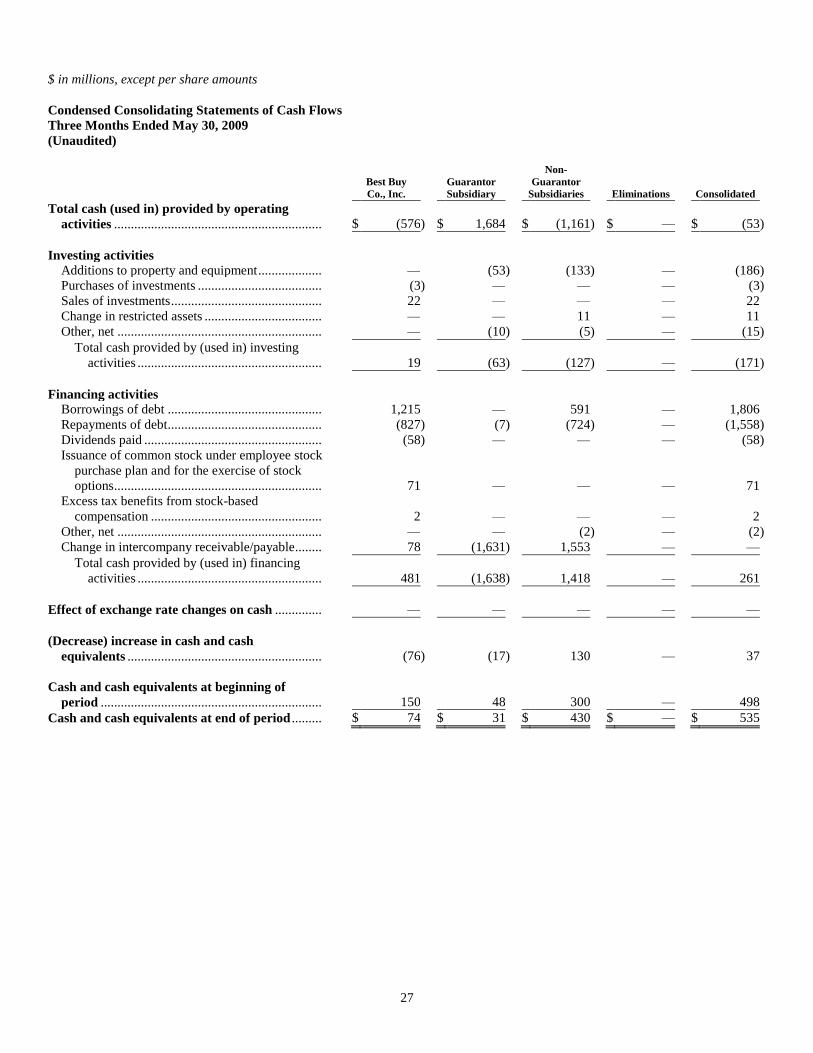
14. Condensed Consolidating Financial Information
The rules of the Securities and Exchange Commission (―SEC‖) require that condensed consolidating financial information be
provided for a subsidiary that has guaranteed the debt of a registrant issued in a public offering, where the guarantee is full and
unconditional and where the voting interest of the subsidiary is 100% owned by the registrant. Our convertible debentures,
which had an aggregate principal balance and carrying amount of $402 at May 29, 2010, are jointly and severally guaranteed by
our wholly-owned indirect subsidiary Best Buy Stores, L.P. (―Guarantor Subsidiary‖). Investments in subsidiaries of Best Buy
Stores, L.P., which have not guaranteed the convertible debentures (―Non-Guarantor Subsidiaries‖), are required to be
accounted for under the equity method, even though all such subsidiaries meet the requirements to be consolidated under
GAAP.
Set forth below are condensed consolidating financial statements presenting the financial position, results of operations, and
cash flows of (i) Best Buy Co., Inc., (ii) the Guarantor Subsidiary, (iii) the Non-Guarantor Subsidiaries, and (iv) the eliminations
necessary to arrive at consolidated information for our company.
We file a consolidated U.S. federal income tax return. Income taxes are allocated in accordance with our tax allocation
agreement. U.S. affiliates receive no tax benefit for taxable losses, but are allocated taxes at the required effective income tax
rate if they have taxable income.
The following tables present condensed consolidating balance sheets as of May 29, 2010, February 27, 2010, and May 30, 2009,
and condensed consolidating statements of earnings and cash flows for the three months ended May 29, 2010, and May 30,
2009, and should be read in conjunction with the consolidated financial statements herein.
Page 21
21
$ in millions, except per share amounts
Condensed Consolidating Balance Sheets
At May 29, 2010
(Unaudited)
Best Buy
Co., Inc.
Guarantor
Subsidiary
Non-
Guarantor
Subsidiaries Eliminations Consolidated
Assets
Current Assets
Cash and cash equivalents............................... $ 570 $ 37 $ 632 $ — $ 1,239
Short-term investments ................................... 203 — 2 — 205
Receivables ..................................................... 7 437 1,135 — 1,579
Merchandise inventories ................................. — 4,594 1,796 (55 ) 6,335
Other current assets ......................................... 221 66 744 (1 ) 1,030
Intercompany receivable ................................. — — 8,757 (8,757 ) —
Intercompany note receivable ......................... 1,552 — — (1,552 ) —
Total current assets ..................................... 2,553 5,134 13,066 (10,365 ) 10,388
Property and Equipment, Net .......................... 213 1,815 1,954 — 3,982
Goodwill ............................................................. — 6 2,380 — 2,386
Tradenames ....................................................... — — 153 — 153
Customer Relationships .................................... — — 247 — 247
Equity and Other Investments ......................... 207 — 116 — 323
Other Assets....................................................... 93 33 383 (32 ) 477
Investments in Subsidiaries .............................. 11,684 289 2,275 (14,248 ) —
Total Assets ........................................................ $ 14,750 $ 7,277 $ 20,574 $ (24,645 ) $ 17,956
Liabilities and Shareholders’ Equity
Current Liabilities
Accounts payable ............................................ $ 374 $ 34 $ 5,452 $ — $ 5,860
Unredeemed gift card liabilities ...................... — 367 57 — 424
Accrued compensation and related expenses .. — 169 267 — 436
Accrued liabilities ........................................... 26 642 933 — 1,601
Accrued income taxes ..................................... 51 — — — 51
Short-term debt ............................................... — — 197 — 197
Current portion of long-term debt ................... 1 21 12 — 34
Intercompany payable ..................................... 6,703 2,054 — (8,757 ) —
Intercompany note payable ............................. 10 500 1,042 (1,552 ) —
Total current liabilities ................................ 7,165 3,787 7,960 (10,309 ) 8,603
Long-Term Liabilities ....................................... 263 1,087 228 (325 ) 1,253
Long-Term Debt ............................................... 902 128 63 — 1,093
Shareholders’ Equity ........................................ 6,420 2,275 12,323 (14,011 ) 7,007
Total Liabilities and Shareholders’ Equity ..... $ 14,750 $ 7,277 $ 20,574 $ (24,645 ) $ 17,956
Page 22
22
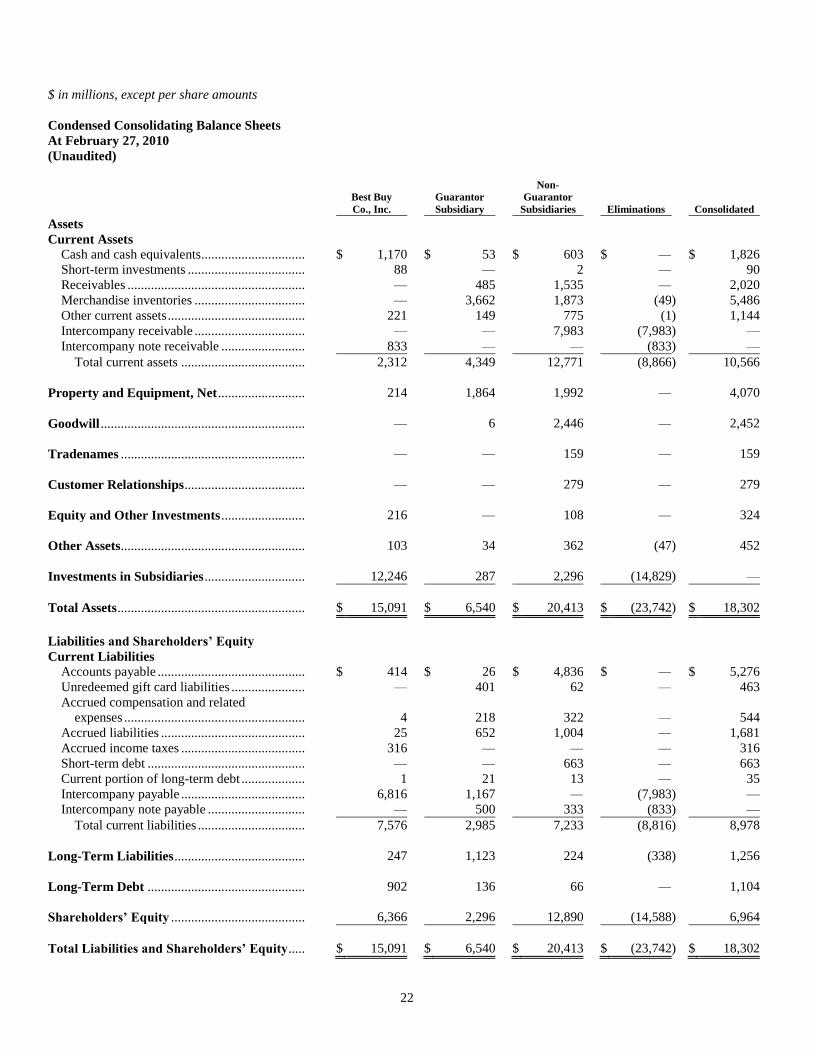
$ in millions, except per share amounts
Condensed Consolidating Balance Sheets
At February 27, 2010
(Unaudited)
Best Buy
Co., Inc.
Guarantor
Subsidiary
Non-
Guarantor
Subsidiaries Eliminations Consolidated
Assets
Current Assets
Cash and cash equivalents............................... $ 1,170 $ 53 $ 603 $ — $ 1,826
Short-term investments ................................... 88 — 2 — 90
Receivables ..................................................... — 485 1,535 — 2,020
Merchandise inventories ................................. — 3,662 1,873 (49 ) 5,486
Other current assets ......................................... 221 149 775 (1 ) 1,144
Intercompany receivable ................................. — — 7,983 (7,983 ) —
Intercompany note receivable ......................... 833 — — (833 ) —
Total current assets ..................................... 2,312 4,349 12,771 (8,866 ) 10,566
Property and Equipment, Net .......................... 214 1,864 1,992 — 4,070
Goodwill ............................................................. — 6 2,446 — 2,452
Tradenames ....................................................... — — 159 — 159
Customer Relationships .................................... — — 279 — 279
Equity and Other Investments ......................... 216 — 108 — 324
Other Assets....................................................... 103 34 362 (47 ) 452
Investments in Subsidiaries .............................. 12,246 287 2,296 (14,829 ) —
Total Assets ........................................................ $ 15,091 $ 6,540 $ 20,413 $ (23,742 ) $ 18,302
Liabilities and Shareholders’ Equity
Current Liabilities
Accounts payable ............................................ $ 414 $ 26 $ 4,836 $ — $ 5,276
Unredeemed gift card liabilities ...................... — 401 62 — 463
Accrued compensation and related
expenses ...................................................... 4
218
322
—
544
Accrued liabilities ........................................... 25 652 1,004 — 1,681
Accrued income taxes ..................................... 316 — — — 316
Short-term debt ............................................... — — 663 — 663
Current portion of long-term debt ................... 1 21 13 — 35
Intercompany payable ..................................... 6,816 1,167 — (7,983 ) —
Intercompany note payable ............................. — 500 333 (833 ) —
Total current liabilities ................................ 7,576 2,985 7,233 (8,816 ) 8,978
Long-Term Liabilities ....................................... 247 1,123 224 (338 ) 1,256
Long-Term Debt ............................................... 902 136 66 — 1,104
Shareholders’ Equity ........................................ 6,366 2,296 12,890 (14,588 ) 6,964
Total Liabilities and Shareholders’ Equity ..... $ 15,091 $ 6,540 $ 20,413 $ (23,742 ) $ 18,302
Page 23
23
$ in millions, except per share amounts
Condensed Consolidating Balance Sheets
At May 30, 2009
(Unaudited)
Best Buy
Co., Inc.
Guarantor
Subsidiary
Non-
Guarantor
Subsidiaries Eliminations Consolidated
Assets
Current Assets
Cash and cash equivalents............................... $ 74 $ 31 $ 430 $ — $ 535
Short-term investments ................................... — — 8 — 8
Receivables ..................................................... 3 323 1,101 — 1,427
Merchandise inventories ................................. — 3,992 1,525 (31 ) 5,486
Other current assets ......................................... 108 146 735 (35 ) 954
Intercompany receivable ................................. — — 6,532 (6,532 ) —
Intercompany note receivable ......................... 818 — 14 (832 ) —
Total current assets ..................................... 1,003 4,492 10,345 (7,430 ) 8,410
Property and Equipment, Net .......................... 218 2,017 1,949 — 4,184
Goodwill ............................................................. — 20 2,276 — 2,296
Tradenames ....................................................... — — 167 — 167
Customer Relationships .................................... — — 305 — 305
Equity and Other Investments ......................... 311 — 110 — 421
Other Assets....................................................... 61 44 377 (51 ) 431
Investments in Subsidiaries .............................. 9,604 127 1,418 (11,149 ) —
Total Assets ........................................................ $ 11,197 $ 6,700 $ 16,947 $ (18,630 ) $ 16,214
Liabilities and Shareholders’ Equity
Current Liabilities
Accounts payable ............................................ $ 351 $ 13 $ 4,632 $ — $ 4,996
Unredeemed gift card liabilities ...................... — 374 54 — 428
Accrued compensation and related
expenses ...................................................... 1 230 173 404
Accrued liabilities ........................................... 19 583 798 (35 ) 1,365
Accrued income taxes ..................................... 92 — — — 92
Short-term debt ............................................... 550 — 467 — 1,017
Current portion of long-term debt ................... 2 21 31 — 54
Intercompany payable ..................................... 4,252 2,280 — (6,532 ) —
Intercompany note payable ............................. 14 500 318 (832 ) —
Total current liabilities ................................ 5,281 4,001 6,473 (7,399 ) 8,356
Long-Term Liabilities ....................................... 185 1,136 286 (371 ) 1,236
Long-Term Debt ............................................... 903 145 73 — 1,121
Shareholders’ Equity ........................................ 4,828 1,418 10,115 (10,860 ) 5,501
Total Liabilities and Shareholders’ Equity ..... $ 11,197 $ 6,700 $ 16,947 $ (18,630 ) $ 16,214
Page 24
24
$ in millions, except per share amounts
Condensed Consolidating Statements of Earnings
Three Months Ended May 29, 2010
(Unaudited)
Best Buy
Co., Inc.
Guarantor
Subsidiary
Non-
Guarantor
Subsidiaries Eliminations Consolidated
Revenue .............................................................. $ 4 $ 7,295 $ 10,535 $ (7,047 ) $ 10,787
Cost of goods sold ............................................... — 5,380 9,082 (6,468 ) 7,994
Gross profit (loss) ............................................... 4 1,915 1,453 (579 ) 2,793
Selling, general and administrative expenses ...... 37 1,836 1,226 (619 ) 2,480
Restructuring charges.......................................... — — — — —
Operating (loss) income ...................................... (33 ) 79 227 40 313
Other income (expense) ......................................
Investment income and other .......................... 8 — 11 (7 ) 12
Interest expense ............................................... (12 ) (3 ) (15 ) 7 (23 )
(Loss) earnings before equity in earnings (loss)
of subsidiaries ................................................. (37 ) 76 223 40 302
Equity in earnings (loss) of subsidiaries ............. 134 (4 ) (18 ) (112 ) —
Earnings (loss) before income tax expense ......... 97 72 205 (72 ) 302
Income tax (benefit) expense .............................. (18 ) 94 45 — 121
Net earnings (loss) including noncontrolling
interests ........................................................... 115 (22 ) 160 (72 ) 181
Net (earnings) attributable to noncontrolling
interests ........................................................... — — (26 ) — (26 )
Net earnings (loss) attributable to Best Buy
Co., Inc. ........................................................... $ 115 $ (22 ) $ 134 $ (72 ) $ 155
Page 25
25
$ in millions, except per share amounts
Condensed Consolidating Statements of Earnings
Three Months Ended May 30, 2009
(Unaudited)
Best Buy
Co., Inc.
Guarantor
Subsidiary
Non-
Guarantor
Subsidiaries Eliminations Consolidated
Revenue ............................................................ $ 4 $ 6,987 $ 5,825 $ (2,721 ) $ 10,095
Cost of goods sold ............................................. — 5,212 6,818 (4,492 ) 7,538
Gross profit (loss) ............................................. 4 1,775 (993 ) 1,771 2,557
Selling, general and administrative expenses .... 35 1,561 1,043 (430 ) 2,209
Restructuring charges........................................ — 25 27 — 52
Operating (loss) income .................................... (31 ) 189 (2,063 ) 2,201 296
Other income (expense) ....................................
Investment income and other ........................ 6 — 8 (5 ) 9
Interest expense ............................................. (12 ) (3 ) (13 ) 5 (23 )
(Loss) earnings before equity in (loss) earnings
of subsidiaries ............................................... (37 ) 186 (2,068 ) 2,201 282
Equity in (loss) earnings of subsidiaries ........... (1,156 ) (10 ) 121 1,045 —
(Loss) earnings before income tax expense ...... (1,193 ) 176 (1,947 ) 3,246 282
Income tax expense (benefit) ............................ 855 65 (794 ) — 126
Net (loss) earnings including noncontrolling
interests ......................................................... (2,048 ) 111 (1,153 ) 3,246 156
Net (earnings) attributable to noncontrolling
interests ......................................................... — — (3 ) — (3 )
Net (loss) earnings attributable to Best Buy
Co., Inc. ......................................................... $ (2,048 ) $ 111 $ (1,156 ) $ 3,246 $ 153
Page 26
26
$ in millions, except per share amounts
Condensed Consolidating Statements of Cash Flows
Three Months Ended May 29, 2010
(Unaudited)
Best Buy
Co., Inc.
Guarantor
Subsidiary
Non-
Guarantor
Subsidiaries Eliminations Consolidated
Total cash provided by (used in) operating
activities ............................................................ $ 409 $ (862 ) $ 622 $ — $ 169
Investing activities
Additions to property and equipment ................. — (51 ) (110 ) — (161 )
Purchases of investments ................................... (150 ) — — — (150 )
Sales of investments ........................................... 35 — — — 35
Change in restricted assets ................................. — — 11 — 11
Settlement of net investment hedges .................. — — 12 — 12
Other, net ........................................................... — — (1 ) — (1 )
Total cash used in investing activities ............ (115 ) (51 ) (88 ) — (254 )
Financing activities
Repurchase of common stock ............................ (111 ) — — — (111 )
Borrowings of debt ............................................ — — 463 — 463
Repayments of debt............................................ (1 ) (3 ) (903 ) — (907 )
Dividends paid ................................................... (59 ) — — — (59 )
Issuance of common stock under employee stock
purchase plan and for the exercise of stock
options ............................................................ 110 — — — 110
Excess tax benefits from stock-based
compensation ................................................. 10 — — — 10
Other, net ........................................................... — — — — —
Change in intercompany receivable/payable...... (843 ) 900 (57 ) — —
Total cash (used in) provided by financing
activities ..................................................... (894 ) 897 (497 ) — (494 )
Effect of exchange rate changes on cash ............ — — (8 ) — (8 )
(Decrease) increase in cash and cash
equivalents ........................................................ (600 ) (16 ) 29 — (587 )
Cash and cash equivalents at beginning of
period ................................................................ 1,170 53 603 — 1,826
Cash and cash equivalents at end of period ....... $ 570 $ 37 $ 632 $ — $ 1,239
Page 27
27
$ in millions, except per share amounts
Condensed Consolidating Statements of Cash Flows
Three Months Ended May 30, 2009
(Unaudited)
Best Buy
Co., Inc.
Guarantor
Subsidiary
Non-
Guarantor
Subsidiaries Eliminations Consolidated
Total cash (used in) provided by operating
activities .............................................................. $ (576 ) $ 1,684 $ (1,161 ) $ — $ (53 )
Investing activities
Additions to property and equipment ................... — (53 ) (133 ) — (186 )
Purchases of investments ..................................... (3 ) — — — (3 )
Sales of investments ............................................. 22 — — — 22
Change in restricted assets ................................... — — 11 — 11
Other, net ............................................................. — (10 ) (5 ) — (15 )
Total cash provided by (used in) investing
activities ....................................................... 19 (63 ) (127 ) — (171 )
Financing activities
Borrowings of debt .............................................. 1,215 — 591 — 1,806
Repayments of debt.............................................. (827 ) (7 ) (724 ) — (1,558 )
Dividends paid ..................................................... (58 ) — — — (58 )
Issuance of common stock under employee stock
purchase plan and for the exercise of stock
options .............................................................. 71 — — — 71
Excess tax benefits from stock-based
compensation ................................................... 2 — — — 2
Other, net ............................................................. — — (2 ) — (2 )
Change in intercompany receivable/payable........ 78 (1,631 ) 1,553 — —
Total cash provided by (used in) financing
activities ....................................................... 481 (1,638 ) 1,418 — 261
Effect of exchange rate changes on cash .............. — — — — —
(Decrease) increase in cash and cash
equivalents .......................................................... (76 ) (17 ) 130 — 37
Cash and cash equivalents at beginning of
period .................................................................. 150 48 300 — 498
Cash and cash equivalents at end of period ......... $ 74 $ 31 $ 430 $ — $ 535
Page 28
28
ITEM 2. MANAGEMENT’S DISCUSSION AND ANALYSIS OF FINANCIAL CONDITION AND RESULTS OF OPERATIONS
Unless the context otherwise requires, the use of the terms ―Best Buy,‖ ―we,‖ ―us‖ and ―our‖ in the following refers to Best Buy
Co., Inc. and its consolidated subsidiaries.
Management’s Discussion and Analysis of Financial Condition and Results of Operations (―MD&A‖) is intended to provide a reader
of our financial statements with a narrative from the perspective of our management on our financial condition, results of operations,
liquidity and certain other factors that may affect our future results. Unless otherwise noted, transactions, trends and other factors
significantly impacting our financial condition, results of operations and liquidity are discussed in order of magnitude. Our MD&A is
presented in six sections:
Overview
Results of Operations
Liquidity and Capital Resources
Off-Balance-Sheet Arrangements and Contractual Obligations
Significant Accounting Policies and Estimates
New Accounting Standards
In order to align our fiscal reporting periods and comply with statutory filing requirements in certain foreign jurisdictions, we
consolidate the financial results of our Europe, China, Mexico and Turkey operations on a two-month lag. Consistent with such
consolidation, the financial and non-financial information presented in our MD&A relative to these operations is also presented on a
two-month lag. There were no significant intervening events which would have materially affected our financial condition, results of
operations, liquidity or other factors had they been recorded during the three months ended May 29, 2010.
Our MD&A should be read in conjunction with our Annual Report on Form 10-K for the fiscal year ended February 27, 2010, as well
as our reports on Forms 10-Q and 8-K and other publicly available information. All amounts herein are unaudited.
Overview
We are a multinational retailer of consumer electronics, home office products, entertainment software, appliances and related services.
We operate two reportable segments: Domestic and International. The Domestic segment is comprised of all operations within the
U.S. and its territories. The International segment is comprised of all operations outside the U.S. and its territories.
Our business, like that of many retailers, is seasonal. Historically, we have realized more of our revenue and earnings in the fiscal
fourth quarter, which includes the majority of the holiday shopping season in the U.S., Europe and Canada, than in any other fiscal
quarter.
Throughout this MD&A, we refer to comparable store sales. Comparable store sales is a measure commonly used in the retail
industry, which indicates store performance by measuring the growth in sales for certain stores for a particular period over the
corresponding period in the prior year. Our comparable store sales is comprised of revenue from stores operating for at least 14 full
months as well as revenue related to call centers, Web sites and our other comparable sales channels. Revenue we earn from sales of
merchandise to wholesalers or dealers is not included within our comparable store sales calculation. Relocated, remodeled and
expanded stores are excluded from the comparable store sales calculation until at least 14 full months after reopening. Acquired stores
are included in the comparable store sales calculation beginning with the first full quarter following the first anniversary of the date of
the acquisition. The portion of our calculation of the comparable store sales percentage change attributable to our International
segment excludes the effect of fluctuations in foreign currency exchange rates. The method of calculating comparable store sales
varies across the retail industry. As a result, our method of calculating comparable store sales may not be the same as other retailers’
methods.
Executive Summary
Our financial results for the first quarter of fiscal 2011 reflect revenue growth of 6.9% to $10.8 billion, due primarily to net new
stores, a comparable store sales gain of 2.8% and the favorable effect of fluctuations in foreign currency exchange rates. In addition,
we experienced gross margin rate improvements, offset by unfavorable changes in our selling, general and administrative expenses
(―SG&A‖) rate in both our Domestic and International segments. At 2.9% of revenue, our operating income in the first quarter of
fiscal 2011 remained flat compared to the prior-year period.
Cash provided by operations was $169 million for the first quarter of fiscal 2011, compared to $53 million used in operations in the
prior-year period. Furthermore, cash and cash equivalents at May 29, 2010, increased to $1.2 billion from $535 million at May 30,
2009.
Page 29
29
Results of Operations
Consolidated Performance Summary
The following table presents selected consolidated financial data ($ in millions, except per share amounts):
Three Months Ended
May 29, 2010 May 30, 2009
Revenue .................................................................................................................................. $ 10,787 $ 10,095
Revenue % growth .................................................................................................................. 6.9 % 12.3 %
Comparable store sales % gain (decline) ................................................................................ 2.8 % (6.2 )%
Gross profit as % of revenue(1) ............................................................................................................................................... 25.9 % 25.3 %
SG&A as % of revenue(1) ........................................................................................................................................................... 23.0 % 21.9 %
Operating income(2) ......................................................................................................................................................................... $ 313 $ 296
Operating income as % of revenue ......................................................................................... 2.9 % 2.9 %
Net earnings attributable to Best Buy Co., Inc.(2) ..................................................................................................... $ 155 $ 153
Diluted earnings per share ...................................................................................................... $ 0.36 $ 0.36
(1) Because retailers vary in how they record certain costs between cost of goods sold and SG&A, our gross profit rate and SG&A rate
may not be comparable to other retailers’ corresponding rates. For additional information regarding costs classified in cost of
goods sold and SG&A, refer to Note 1, Summary of Significant Accounting Policies, in the Notes to Consolidated Financial
Statements included in our Annual Report on Form 10-K for the fiscal year ended February 27, 2010.
(2) Included within our operating income and net earnings for the three months ended May 30, 2009, is $52 million ($25 million net of
taxes and noncontrolling interests) of restructuring charges recorded in the fiscal first quarter related primarily to updating our U.S.
Best Buy store operating model, which included eliminating certain positions, as well as employee termination benefits and
business reorganization costs in Best Buy Europe. These charges resulted in a decrease in our operating income of 0.5% of revenue
for the first quarter of fiscal 2010. No restructuring charges were recorded in the first quarter of fiscal 2011.
The 6.9% revenue increase resulted from the net addition of 75 new stores in the past 12 months, a comparable store sales gain of
2.8% and the favorable impact of foreign currency exchange rates. The components of the net revenue increase for the first quarter of
fiscal 2011 were as follows:
Net new stores .................................................................... 3.1 %
2.8% comparable store sales gain ...................................... 2.7 %
Favorable impact of foreign currency exchange rates........ 2.6 %
Non-comparable sales channels(1) ......................................................... (0.8 )%
One less week of revenue(2) ....................................................................... (0.7 )%
Total revenue increase ....................................................... 6.9 %
(1) Non-comparable sales channels primarily reflects the impact from revenue we earn from sales of merchandise to wholesalers and
dealers as well as other non-comparable sales channels not included within our comparable store sales calculation.
(2) One less week of revenue reflects the incremental revenue associated with Best Buy Europe in the first quarter of fiscal 2010,
which had 14 weeks of activity, compared to 13 weeks in the first quarter of fiscal 2011.
The gross profit rate increased by 0.6% of revenue for the first quarter of fiscal 2011. Gross profit rate improvements in our Domestic
and International segments accounted for increases of 0.5% of revenue and 0.1% of revenue, respectively. For further discussion of
each segment’s gross profit rate changes, see Segment Performance Summary, below.
The SG&A rate increased by 1.1% of revenue for the first quarter of fiscal 2011. Our Domestic segment and our International
segment each contributed to the rate increase, with increases of 0.9% of revenue and 0.2% of revenue, respectively. For further
discussion of each segment’s SG&A rate changes, see Segment Performance Summary, below.
Operating income increased 5.7% to $313 million, and remained flat as a percentage of revenue at 2.9%, in the first quarter of fiscal
2011 compared to the prior-year period. The flat operating income rate was driven by an increase in our gross profit rate and no
restructuring charges compared to the prior-year period, offset by an increase in our SG&A rate.
Page 30
30
Other Income (Expense)
Our investment income and other in the first quarter of fiscal 2011 increased to $12 million, compared with $9 million in the prior-
year period. The increase was primarily due to higher average cash and cash equivalent balances in the first quarter of fiscal 2011, as
well as the timing of dividends from certain equity investments. Partially offsetting the increase was the impact of lower interest rates
earned on our cash and investment balances in the first quarter of fiscal 2011.
Interest expense in the first quarter of fiscal 2011 remained flat at $23 million, compared with the same period one year ago. Lower
average short-term borrowings in the first quarter of fiscal 2011 were fully offset by higher average interest rates on outstanding short-
term borrowings.
Income Tax Expense
Our effective income tax rate in the first quarter of fiscal 2011 was 40.3%, compared with a rate of 45.0% in same period one year
ago. The decrease was due primarily to the timing impact of losses in certain foreign jurisdictions for which we have no current tax
benefit.
Segment Performance Summary
Domestic
The following table presents selected financial data for the Domestic segment ($ in millions):
Three Months Ended
May 29, 2010 May 30, 2009
Revenue ................................................................................................................................... $ 7,923 $ 7,525
Revenue % growth ................................................................................................................... 5.3 % 1.0 %
Comparable store sales % gain (decline) ................................................................................. 1.9 % (4.9 )%
Gross profit as % of revenue .................................................................................................... 25.7 % 25.1 %
SG&A as % of revenue ............................................................................................................ 22.0 % 20.7 %
Operating income(1) ............................................................................................................................................................................ $ 298 $ 303
Operating income as % of revenue .......................................................................................... 3.8 % 4.0 %
(1) Included within our Domestic segment’s operating income for the first quarter of fiscal 2010 is $25 million of restructuring charges
related to measures we took to update our U.S. Best Buy store operating model, which resulted in the elimination of certain
positions for which we incurred employee termination costs. These charges resulted in a decrease in our Domestic segment’s
operating income of 0.4% of revenue for the first quarter of fiscal 2010. No restructuring charges were recorded in the first quarter
of fiscal 2011.
The decrease in our Domestic segment’s operating income for the first quarter of fiscal 2011 was due primarily to higher SG&A
spending, partially offset by an increase in revenue and gross profit dollars, as well as no restructuring charges compared to the prior-
year period.
The 5.3% revenue increase in the first quarter of fiscal 2011 resulted primarily from the net addition of 90 new stores in the past 12
months and a comparable store sales gain of 1.9%. The components of our Domestic segment’s net revenue increase for the first
quarter of fiscal 2011 were as follows:
Net new stores ......................................................... 3.5 %
1.9% comparable store sales gain ........................... 1.8 %
Total revenue increase ............................................ 5.3 %
Page 31
31
The following table reconciles the number of Domestic stores open at the beginning and end of the first quarters of fiscal 2011 and
2010:
Fiscal 2011 Fiscal 2010
Total Stores at
Beginning of
First Quarter
Stores
Opened
Stores
Closed
Total Stores
at End of
First Quarter
Total Stores at
Beginning of
First Quarter
Stores
Opened
Stores
Closed
Total Stores
at End of
First Quarter
Best Buy ....................................... 1,069 13 (1 ) 1,081 1,023 9 — 1,032
Best Buy Mobile ........................... 74 6 — 80 38 1 — 39
Pacific Sales .................................. 35 — — 35 34 — — 34 Magnolia Audio Video.................. 6 — — 6 6 — — 6
Geek Squad ................................... 6 — (1 ) 5 6 — — 6
Total Domestic segment stores ..... 1,190 19 (2 ) 1,207 1,107 10 — 1,117
The following table presents the Domestic segment’s revenue mix percentages and comparable store sales percentage changes by
revenue category in the first quarters of fiscal 2011 and 2010:
Revenue Mix Comparable Store Sales
Three Months Ended Three Months Ended
May 29, 2010 May 30, 2009 May 29, 2010 May 30, 2009
Consumer electronics .............................................. 37 % 37 % 0.0 % (7.6 )%
Home office ............................................................ 37 % 35 % 9.7 % 9.5 %
Entertainment software ........................................... 13 % 15 % (12.8 )% (20.6 )%
Appliances .............................................................. 6 % 5 % 14.4 % (20.1 )%
Services ................................................................... 6 % 7 % (4.2 )% 1.7 %
Other ....................................................................... 1 % 1 % n/a n/a
Total ........................................................................ 100 % 100 % 1.9 % (4.9 )%
The comparable store sales gain in the first quarter of fiscal 2011 was due primarily to an increase in average ticket value. The product
categories having the largest effect on our comparable store sales gain were mobile computing (primarily notebook computers,
netbooks and tablets), mobile phones and appliances. Strength in these product categories was partially offset by declines in
entertainment software revenue, which includes video gaming hardware and software, CDs and DVDs. Revenue from our Domestic
segment’s online operations increased 21% in fiscal first quarter of 2011 and is incorporated in the table above.
The flat comparable store sales in the consumer electronics revenue category was driven primarily by increases in the sales of digital
cameras, offset by a decline in the sales of televisions, as price declines more than offset increases in unit sales. The 9.7% comparable
store sales gain in the home office revenue category was primarily due to increased sales in mobile computing and mobile phones,
partially offset by declines in the sales of computer monitors. The 12.8% comparable store sales decline in the entertainment software
revenue category was mainly the result of declining sales in video gaming hardware and software, partially caused by industry-wide
softness and a maturing product platform, as well as the continued decline in the sales of CDs and DVDs. The 14.4% comparable
store sales gain in the appliances revenue category was led by growth in major appliances, which was assisted by government
sponsored rebates and heavier promotions. The 4.2% comparable store sales decline in the services revenue category was due
primarily to a decline in home installation and repair services, partially offset by an increase in the sales of service contracts.
Our Domestic segment experienced gross profit growth of $152 million, or 8.1%, in the first quarter of fiscal 2011compared to the
first quarter of fiscal 2010, due to increased revenue volumes and gross profit rate growth. The 0.6% of revenue increase in the gross
profit rate results from a favorable rate impact of 0.6%, which resulted primarily from the following factors:
improved promotional effectiveness across several revenue categories due to lower incentive spending and other initiatives;
finalization with a vendor of an annual fee, resulting in a rebate to us for a program which ended in our first fiscal quarter;
and
a change in the form of vendor funding for fiscal 2011, shifting more dollars to gross profit than SG&A.
Of the 0.6% of revenue increase in gross profit rate, we estimate that an increase of approximately 0.4% of revenue was driven by
nonrecurring items.
Our Domestic segment’s mix of revenue had no net effect on the segment’s gross profit rate, as growth in sales of product categories
such as higher-margin mobile phones and lower-margin mobile computing had offsetting impacts on the margin rate.
Page 32
32
Our Domestic segment’s SG&A grew $182 million, or 11.7%. The increase in SG&A dollars was principally driven by the opening of
new stores, as well as the following factors, which collectively impacted our SG&A rate by 1.3% of revenue:
the net impact of spend in categories such as advertising and outsourced and outside services (e.g., IT projects), related to
investments in several key growth initiatives, the timing of discretionary expenditures and the impact of other non-recurring
items;
the change in the form of vendor funding as discussed above;
deleverage due to higher costs in certain categories such as payroll, benefits and depreciation, despite the comparable store
sales increase; and
our Best Buy Mobile profit share-based management fee to Best Buy Europe (which is offset in the International segment
SG&A results and therefore has no net impact on our consolidated operating income).
International
The following table presents selected financial data for the International segment ($ in millions):
Three Months Ended
May 29, 2010 May 30, 2009
Revenue ............................................................................................................................... $ 2,864 $ 2,570
Revenue % growth ............................................................................................................... 11.4 % 67.3 %
Comparable store sales % gain (decline) ............................................................................. 6.3 % (13.9 )%
Gross profit as % of revenue ................................................................................................ 26.3 % 26.0 %
SG&A as % of revenue ........................................................................................................ 25.8 % 25.3 %
Operating income (loss)(1) ...................................................................................................................................................... $ 15 $ (7 )
Operating income (loss) as % of revenue ............................................................................ 0.5 % (0.3 )%
(1) Included within our International segment’s operating loss for the first quarter of fiscal 2010 is $27 million of restructuring charges
primarily related to employee termination benefits and business reorganization costs in Best Buy Europe. These charges resulted in
a decrease in our International segment’s operating income of 1.1% of revenue for the first quarter of fiscal 2010. No restructuring
charges were recorded in the first quarter of fiscal 2011.
The increase in our International segment’s operating income resulted primarily from higher operating income in Europe and Canada,
partially offset by declines in other international operations due to costs associated with the preparation for and operation of new
stores in Turkey and Mexico. In addition, the first quarter of fiscal 2010 included $27 million of restructuring charges compared to no
restructuring charges in the first quarter of fiscal 2011.
The 11.4% increase in revenue for the first quarter of fiscal 2011 was due to the favorable impact of foreign currency fluctuations, a
comparable store sales gain of 6.3% and the impact of net new stores opened during the past 12 months. The increase in comparable
store sales was the result of gains in Europe and China, partially offset by declines in Canada. The components of our International
segment’s net revenue increase for the first quarter of fiscal 2011 were as follows:
Favorable impact of foreign currency exchange rates........ 10.0 %
6.3% comparable store sales gain ...................................... 5.1 %
Net new stores .................................................................... 2.0 %
Non-comparable sales channels(1) ......................................................... (3.1 )%
One less week of revenue(2) ....................................................................... (2.6 )%
Total revenue increase ....................................................... 11.4 %
(1) Non-comparable sales channels primarily reflects the impact from revenue we earn from sales of merchandise to wholesalers and
dealers as well as other non-comparable sales channels not included within our comparable store sales calculation.
(2) One less week of revenue reflects the incremental revenue associated with Best Buy Europe in the first quarter of fiscal 2010,
which had 14 weeks of activity, compared to 13 weeks in the first quarter of fiscal 2011.
Page 33
33
The following table reconciles the number of International stores open at the beginning and end of the first quarters of fiscal 2011 and
2010:
Fiscal 2011 Fiscal 2010
Total Stores at
Beginning of
First Quarter
Stores
Opened
Stores
Closed
Total Stores
at End of
First Quarter
Total Stores at
Beginning of
First Quarter
Stores
Opened
Stores
Closed
Total Stores
at End of
First Quarter
Best Buy Europe .................. 2,453 10 (33 ) 2,430 2,465 26 (32 ) 2,459
Canada
Future Shop ..................... 144 — — 144 139 1 — 140 Best Buy.......................... 64 2 — 66 58 — — 58
Best Buy Mobile ............. 4 — — 4 3 — — 3
China Five Star .......................... 158 — — 158 164 4 (4 ) 164
Best Buy.......................... 6 1 — 7 5 — — 5
Mexico ................................. Best Buy.......................... 5 — — 5 1 — — 1
Turkey..................................
Best Buy.......................... 1 — — 1 — — — —
Total International segment
stores ............................... 2,835 13 (33 ) 2,815 2,835 31 (36 ) 2,830
The following table presents revenue mix percentages and comparable store sales percentage changes for the International segment by
revenue category in the first quarters of fiscal 2011 and 2010:
Revenue Mix Comparable Store Sales
Three Months Ended Three Months Ended(1)
May 29, 2010 May 30, 2009 May 29, 2010 May 30, 2009
Consumer electronics ........................................... 19 % 18 % 2.7 % (15.8 )%
Home office ......................................................... 56 % 54 % 6.2 % (9.2 )%
Entertainment software ........................................ 5 % 5 % (6.2 )% (24.0 )%
Appliances ........................................................... 9 % 8 % 28.0 % (16.3 )%
Services ................................................................ 11 % 15 % 2.8 % 6.7 %
Other .................................................................... <1 % <1 % n/a n/a
Total ..................................................................... 100 % 100 % 6.3 % (13.9 )%
(1) The comparable store sales figures for the first quarter of fiscal 2011 include three months of Best Buy Europe’s comparable store
sales. However, comparable store sales for the first quarter of fiscal 2010 does not include Best Buy Europe as the third quarter of
fiscal 2010 was the first period in which Best Buy Europe was included in our comparable store sales calculation.
The product categories having the largest impact on our International segment’s comparable store sales gain in the first quarter of
fiscal 2011 were appliances, mobile phones and televisions. Increased sales in these product categories were partially offset by
declines in the sales of MP3 players and accessories as well as video gaming hardware and software.
The 2.7% comparable store sales gain in the consumer electronics revenue category resulted primarily from increases in the sales of
televisions, partially offset by declines in the sales of MP3 players and accessories and digital camcorders. The 6.2% comparable store
sales gain in the home office revenue category mainly resulted from comparable store sales gains in mobile phones and mobile
computing. The 6.2% comparable store sales decline in the entertainment software revenue category reflected a decrease in the sales
of video gaming hardware and software and continued decreases in the sales of CDs and DVDs. The 28.0% comparable store sales
gain in the appliances revenue category resulted primarily from increases in the sales of appliances within our China operations, where
promotions and government stimulus programs helped to fuel stronger sales. The 2.8% comparable store sales gain in the services
revenue category was due primarily to continued investment in and the expanded customer base for our mobile virtual network
operator business in Europe, partially offset by a decline in revenue from service contracts throughout the segment.
Our International segment experienced gross profit growth of $84 million, or 12.6%, in the first quarter of fiscal 2011, which was
driven by the impact of foreign currency exchange rates, increased revenue and gross profit rate growth. The 0.3% of revenue
improvement in gross profit rate reflects a favorable rate impact of 0.9% of revenue, partially offset by an unfavorable mix impact of
0.6% of revenue. The rate favorability was largely a result of improved promotional effectiveness across several revenue categories in
Canada and an increase in the sales of higher-margin post-pay mobile phone contracts in Europe. The unfavorable mix impact resulted
primarily from growth in our lower-margin China business, as well as decreased mix from our higher-margin Europe business, which
had one less week of operations in the first quarter of fiscal 2011.
Page 34
34
Our International segment’s SG&A grew $89 million, or 13.7%, driven mainly by the impact of foreign currency exchange rates,
increased spending associated with new store openings across the segment and increased payroll and overhead costs. Excluding the
impact of foreign currency fluctuations, SG&A spend grew only 2.8%. The 0.5% of revenue increase in the SG&A rate was driven
primarily by increased payroll in Canada to support the expansion of its services business and the deleveraging impact of its
comparable store sales decline, as well as start-up costs incurred in Turkey.
Liquidity and Capital Resources
Summary
The following table summarizes our cash and cash equivalents and short-term investments balances at May 29, 2010; February 27,
2010; and May 30, 2009 ($ in millions):
May 29,
2010
February 27,
2010
May 30,
2009
Cash and cash equivalents ..................................................................... $ 1,239 $ 1,826 $ 535
Short-term investments .......................................................................... 205 90 8
Total cash and cash equivalents and short-term investments ................. $ 1,444 $ 1,916 $ 543
The increase in the balance of our cash and cash equivalents and short-term investments compared with the end of the first quarter of
fiscal 2010 was due primarily to increased cash generated from operations, partially offset by cash used to reduce short-term debt as
we were able to pay down outstanding balances on our revolving credit facilities.
Our current ratio, calculated as current assets divided by current liabilities, was 1.2 at the end of the first quarter of fiscal 2011,
compared with 1.2 at the end of fiscal 2010 and 1.0 at the end of the first quarter of fiscal 2010.
Our debt-to-capitalization ratio, which represents the ratio of total debt, including the current portion of long-term debt, to total
capitalization (total debt plus total shareholders’ equity), decreased to 17% at the end of the first quarter of fiscal 2011, compared with
22% at the end of fiscal 2010 and 31% at the end of the first quarter of fiscal 2010. The decreases were due primarily to lower short-
term borrowings, as well as a higher shareholders’ equity balance, largely caused by accumulated retained earnings. We view our
debt-to-capitalization ratio as an important indicator of our creditworthiness. Our adjusted debt-to-capitalization ratio, which includes
capitalized operating lease obligations in its calculation, was 62% at the end of the first quarter of fiscal 2011, compared with 63% at
the end of fiscal 2010 and 68% at the end of the first quarter of fiscal 2010.
Our adjusted debt-to-capitalization ratio, which includes capitalized operating lease obligations, is considered a non-GAAP financial
measure and is not in accordance with, or preferable to, the ratio determined in accordance with GAAP. However, we have included
this information as we believe that our adjusted debt-to-capitalization ratio is important for understanding our operations and provides
meaningful additional information about our ability to service our long-term debt and other fixed obligations, and to fund our future
growth. In addition, we believe our adjusted debt-to-capitalization ratio is relevant because it enables investors to compare our
indebtedness to that of retailers who own, rather than lease, their stores. Our decision to own or lease real estate is based on an
assessment of our financial liquidity, our capital structure, our desire to own or to lease the location, the owner’s desire to own or to
lease the location, and the alternative that results in the highest return to our shareholders.
The most directly comparable GAAP financial measure to our adjusted debt-to-capitalization ratio is our debt-to-capitalization ratio.
Our debt-to-capitalization ratio excludes capitalized operating lease obligations in both the numerator and denominator of the
calculation.
The following table presents a reconciliation of the numerator and denominator used in the calculation of our adjusted debt-to-
capitalization ratio, including capitalized operating lease obligations ($ in millions):
Page 35
35
May 29,
2010
February 27,
2010
May 30,
2009
Debt (including current portion) ............................................................. $ 1,324 $ 1,802 $ 2,192
Capitalized operating lease obligations (8 times rental expense) (1) ............ 9,136 9,013 8,349
Adjusted debt (including capitalized operating lease obligations) .......... $ 10,460 $ 10,815 $ 10,541
Debt (including current portion) ............................................................. $ 1,324 $ 1,802 $ 2,192
Capitalized operating lease obligations (8 times rental expense) (1) ............ 9,136 9,013 8,349
Total Best Buy Co., Inc. shareholders’ equity ........................................ 6,368 6,320 4,990
Adjusted capitalization............................................................................ $ 16,828 $ 17,135 $ 15,531
Debt-to-capitalization ratio ..................................................................... 17 % 22 % 31 %
Adjusted debt-to-capitalization ratio ....................................................... 62 % 63 % 68 %
(1)
The multiple of eight times annual rental expense in the calculation of our capitalized operating lease obligations is the multiple
used for the retail sector by one of the nationally recognized credit rating agencies that rate our creditworthiness, and we consider
it to be an appropriate multiple for our lease portfolio.
Cash Flows
The following table summarizes our cash flows for the first three months of the current and prior fiscal years ($ in millions):
Three Months Ended
May 29, 2010 May 30, 2009
Total cash (used in) provided by:
Operating activities .......................................................................................................... $ 169 $ (53 )
Investing activities ........................................................................................................... (254 ) (171 )
Financing activities .......................................................................................................... (494 ) 261
Effect of exchange rate changes on cash .......................................................................... (8 ) —
(Decrease) increase in cash and cash equivalents ................................................................ $ (587 ) $ 37
Cash provided by operating activities in the first three months of fiscal 2011 was $169 million, compared with cash used in operating
activities of $53 million in the first three months of fiscal 2010. The change was due primarily to a decrease in cash used for accounts
payable, partially offset by increases in cash used for merchandise inventories and income taxes. The changes in cash flows relating to
accounts payables and merchandise inventories, when compared to the prior-year period, are primarily due to differences in timing of
customer sales and vendor purchases within the periods. The increase in cash used for income taxes was due primarily to the timing
and magnitude of tax payments as a result of higher taxable earnings.
Cash used in investing activities in the first three months of fiscal 2011 was $254 million, compared with $171 million in the first
three months of fiscal 2010. The increase was due primarily to the purchase of U.S. Treasury bills in the first three months of fiscal
2011, partially offset by the sale of auction-rate securities during the same period.
Cash used in financing activities in the first three months of fiscal 2011 was $494 million, compared with cash provided of $261
million for the first three months of fiscal 2010. The change was primarily the result of a $692 million decrease in borrowings, net of
repayments, in the first three months of fiscal 2011 compared to the same period one year ago and our repurchase of $111 million of
our common stock.
Share Repurchases and Dividends
For the three months ended May 29, 2010, we repurchased and retired 2.5 million shares of our common stock at a cost of $111
million under our June 2007 share repurchase program. No share repurchases were made during the three months ended May 30,
2009.
During the first quarter of fiscal 2011, we paid our regular quarterly cash dividend of $0.14 per common share, or $59 million in the
aggregate. During the same period one year ago, we paid a regular quarterly cash dividend of $0.14 per common share, or $58 million
in the aggregate. As announced on June 16, 2010, our Board authorized payment of our next regular quarterly cash dividend of $0.14
per common share, payable on July 27, 2010, to shareholders of record as of the close of business on July 6, 2010.
Page 36
36
On June 24, 2010, our Board announced an increase in our quarterly cash dividend to $0.15 per common share, a 7% increase
compared with the existing quarterly dividend of $0.14 per common share. The change will be effective with the quarterly dividend
which, if authorized, would be payable on October 26, 2010, to shareholders of record as of October 5, 2010.
Sources of Liquidity
Funds generated by operating activities, available cash and cash equivalents, and our credit facilities continue to be our most
significant sources of liquidity. We believe our sources of liquidity will be sufficient to sustain operations and to finance anticipated
expansion plans and strategic initiatives for the remainder of fiscal 2011. However, in the event our liquidity is insufficient, we may be
required to limit our future expansion plans or we may not be able to pursue business opportunities. There can be no assurance that we
will continue to generate cash flows at or above current levels or that we will be able to maintain our ability to borrow under our
existing credit facilities or obtain additional financing, if necessary, on favorable terms.
We have a $2.3 billion five-year unsecured revolving credit facility, as amended (the ―Credit Facility‖), with a syndicate of banks,
with no borrowings outstanding at May 29, 2010. The Credit Facility expires in September 2012. At July 6, 2010, we had no
borrowings outstanding under the Credit Facility.
We have $820 million available under secured and unsecured revolving credit and demand facilities related to our International
segment operations, of which $197 million was outstanding at May 29, 2010.
Our ability to access our facilities is subject to our compliance with the terms and conditions of our facilities, including financial
covenants. The financial covenants require us to maintain certain financial ratios. At May 29, 2010, we were in compliance with all
such financial covenants. If an event of default were to occur with respect to any of our other debt, it would likely constitute an event
of default under our facilities as well.
Our credit ratings and outlooks at July 6, 2010, are summarized below. In June 2010, Fitch Ratings Ltd. (―Fitch‖) reaffirmed our
BBB+ rating, and raised the outlook from negative to stable, citing our improvement in comparable store sales in the third and fourth
quarters of fiscal 2010 and our ability to maintain steady operating margins and credit metrics in fiscal 2010. The ratings issued by
Moody’s Investors Service, Inc. (―Moody’s‖) and Standard & Poor’s Rating Services (―Standard & Poor’s‖) are consistent with the
ratings and outlooks reported in our Annual Report on Form 10-K for the fiscal year ended February 27, 2010.
Rating Agency Rating Outlook
Fitch .................................................................................................................................... BBB+ Stable
Moody’s .............................................................................................................................. Baa2 Stable
Standard & Poor’s ............................................................................................................... BBB– Stable
Factors that can affect our credit ratings include changes in our operating performance, the economic environment, conditions in the
retail and consumer electronics industries, our financial position, and changes in our business strategy. We are not aware of any
reasonable circumstances under which our credit ratings would be significantly downgraded. If a downgrade were to occur, it could
adversely impact, among other things, our future borrowing costs, access to capital markets, vendor financing terms and future new-
store leasing costs. In addition, the conversion rights of the holders of our convertible debentures could be accelerated if our credit
ratings were to be downgraded.
Auction-Rate Securities and Restricted Cash
At May 29, 2010, and May 30, 2009, we had $233 million and $298 million, respectively, invested in auction-rate securities (―ARS‖)
recorded at fair value within short-term investments and equity and other investments (long-term) in our consolidated balance sheet.
Subsequent to May 29, 2010, and through July 6, 2010, we sold an additional $93 million of ARS at par value. The majority of our
ARS portfolio is AAA/Aaa-rated and collateralized by student loans, which are guaranteed 95% to 100% by the U.S. government.
Due to the auction failures that began in February 2008, we have been unable to liquidate many of our ARS. The investment principal
associated with our ARS subject to failed auctions will not be accessible until successful auctions occur, a buyer is found outside of
the auction process, the issuers establish a different form of financing to replace these securities or final payments are due according to
the contractual maturities of the debt issues, which range from six to 38 years. We intend to hold our ARS until we can recover the full
principal amount through one of the means described above, and have the ability to do so based on our other sources of liquidity.
Our liquidity also is affected by restricted cash balances that are pledged as collateral or restricted to use for vendor payables, general
liability insurance, workers’ compensation insurance and customer warranty and insurance programs. Restricted cash and cash
equivalents, which is included in other current assets, has remained relatively flat at $465 million, $482 million and $477 million at
May 29, 2010, February 27, 2010, and May 30, 2009, respectively.
Page 37
37
Debt and Capital
At May 29, 2010, we had short-term debt outstanding under our various credit and demand facilities of $197 million, a decrease from
$663 million at February 27, 2010, and $1.0 billion at May 30, 2009. Increases in cash generated from operating activities contributed
to the decrease in short-term debt as we were able to pay down outstanding balances on our revolving credit and demand facilities.
See Note 6, Debt, of the Notes to Consolidated Financial Statements included in our Annual Report on Form 10-K for the fiscal year
ended February 27, 2010, for additional information regarding our debt.
Off-Balance-Sheet Arrangements and Contractual Obligations
Our liquidity is not dependent on the use of off-balance sheet financing arrangements other than in connection with our operating
leases.
There has been no material change in our contractual obligations other than in the ordinary course of business since the end of fiscal
2010. See our Annual Report on Form 10-K for the fiscal year ended February 27, 2010, for additional information regarding our off-
balance-sheet arrangements and contractual obligations.
Significant Accounting Policies and Estimates
We describe our significant accounting policies in Note 1, Summary of Significant Accounting Policies, of the Notes to Consolidated
Financial Statements included in our Annual Report on Form 10-K for the fiscal year ended February 27, 2010. We discuss our critical
accounting estimates in Item 7, Management’s Discussion and Analysis of Financial Condition and Results of Operations, in our
Annual Report on Form 10-K for the fiscal year ended February 27, 2010. There has been no significant change in our significant
accounting policies or critical accounting estimates since the end of fiscal 2010.
New Accounting Standards
See Note 1, Basis of Presentation, of Notes to Condensed Consolidated Financial Statements included in this Quarterly Report on
Form 10-Q for a description of recently issued and adopted accounting pronouncements, including the dates of adoption and impacts
on our results of operations, financial position, and cash flows.
Safe Harbor Statement Under the Private Securities Litigation Reform Act
Section 27A of the Securities Act of 1933, as amended (―Securities Act‖), and Section 21E of the Securities Exchange Act of 1934, as
amended (―Exchange Act‖), provide a ―safe harbor‖ for forward looking statements to encourage companies to provide prospective
information about their companies. With the exception of historical information, the matters discussed in this Quarterly Report on
Form 10-Q are forward looking statements and may be identified by the use of words such as ―anticipate,‖ ―believe,‖ ―estimate,‖
―expect,‖ ―intend,‖ ―foresee,‖ ―plan,‖ ―project,‖ ―outlook,‖ and other words and terms of similar meaning. Such statements reflect our
current view with respect to future events and are subject to certain risks, uncertainties and assumptions. A variety of factors could
cause our future results to differ materially from the anticipated results expressed in such forward looking statements. Readers should
review Item 1A, Risk Factors, of our Annual Report on Form 10-K for the fiscal year ended February 27, 2010, for a description of
important factors that could cause future results to differ materially from those contemplated by the forward looking statements made
in this Quarterly Report on Form 10-Q. Among the factors that could cause actual results and outcomes to differ materially from those
contained in such forward looking statements are the following: general economic conditions, changes in consumer preferences, credit
market constraints, acquisitions and development of new businesses, divestitures, product availability, sales volumes, pricing actions
and promotional activities of competitors, profit margins, weather, changes in law or regulations, foreign currency fluctuation,
availability of suitable real estate locations, the company’s ability to react to a disaster recovery situation, the impact of labor markets
and new product introductions on overall profitability, failure to achieve anticipated benefits of announced transactions and integration
challenges relating to new ventures.
ITEM 3. QUANTITATIVE AND QUALITATIVE DISCLOSURES ABOUT MARKET RISK
In addition to the risks inherent in our operations, we are exposed to certain market risks, including adverse changes in foreign
currency exchange rates and interest rates.
Foreign Currency Exchange Rate Risk
We have market risk arising from changes in foreign currency exchange rates related to our International segment operations. On a
limited basis, we utilize foreign exchange forward contracts to manage foreign currency exposure to certain forecasted inventory
Page 38
38
purchases, revenue streams and recognized receivable and payable balances. Our primary objective in holding derivatives is to reduce
the volatility of net earnings and cash flows associated with changes in foreign currency exchange rates. Our foreign currency risk
management strategy includes cash flow hedges as well as derivatives that are not designated as hedging instruments. The contracts
have terms of up to three years. The aggregate notional amount and fair value recorded on our condensed consolidated balance sheet
related to our foreign exchange forward and swap contracts outstanding was $491 million and $2 million, respectively, at May 29,
2010. The amount recorded in our consolidated statement of net earnings related to all contracts settled and outstanding was a gain of
$6 million in the first quarter of fiscal 2011. See Note 7, Derivative Instruments, of Notes to Condensed Consolidated Financial
Statements included in this Quarterly Report on Form 10-Q for additional information regarding our derivative instruments.
The overall weakness of the U.S. dollar since the end of the first quarter of fiscal 2010 has had a positive overall impact on our
revenue as the foreign denominations translated into more U.S. dollars. It is not possible to determine the exact impact of foreign
currency exchange rate changes; however, the effect on reported revenue and net earnings can be estimated. We estimate that the
overall weakness of the U.S. dollar had a favorable impact on our revenue in the first quarter of fiscal 2011 of approximately $258
million and had no impact on our net earnings.
Interest Rate Risk
Short- and long-term debt
At May 29, 2010, our short- and long-term debt was comprised primarily of credit facilities, our convertible debentures and our 6.75%
notes. We do not manage the interest rate risk on our debt through the use of derivative instruments.
Our credit facilities’ interest rates may be reset due to fluctuations in a market-based index, such as the federal funds rate, the London
Interbank Offered Rate (LIBOR), or the base rate or prime rate of our lenders. A hypothetical 100-basis-point change in the interest
rates of our credit facilities would change our annual pre-tax earnings by $2 million.
There is no interest rate risk associated with our convertible debentures or 6.75% notes, as the interest rates are fixed at 2.25% and
6.75%, respectively, per annum.
Short- and long-term investments in debt securities
At May 29, 2010, our short- and long-term investments in debt securities were comprised of ARS. These investments are not subject
to material interest rate risk. A hypothetical 100-basis point change in the interest rate would change our annual pre-tax earnings by $2
million. We do not manage interest rate risk on our investments in debt securities through the use of derivative instruments.
Other Market Risks
Investments in auction-rate securities
At May 29, 2010, we held $233 million in investments in ARS, which includes a $10 million pre-tax temporary impairment. Given
current conditions in the ARS market, we may incur additional temporary unrealized losses or other-than-temporary realized losses in
the future if market conditions were to persist and we were unable to recover the cost of our ARS investments. A hypothetical 100-
basis point loss from the par value of these investments would result in a $2 million impairment.
ITEM 4. CONTROLS AND PROCEDURES
We maintain disclosure controls and procedures that are designed to ensure that information required to be disclosed by us in the
reports we file or submit under the Exchange Act is recorded, processed, summarized and reported within the time periods specified in
the SEC’s rules and forms, and that such information is accumulated and communicated to our management, including our Chief
Executive Officer (principal executive officer) and Chief Financial Officer (principal financial officer), to allow timely decisions
regarding required disclosure. We have established a Disclosure Committee, consisting of certain members of management, to assist
in this evaluation. The Disclosure Committee meets on a regular quarterly basis, and as needed.
Our management, including our Chief Executive Officer and Chief Financial Officer, evaluated the effectiveness of our disclosure
controls and procedures (as defined in Rules 13a-15(e) and 15d-15(e) promulgated under the Exchange Act), at May 29, 2010. Based
on that evaluation, our Chief Executive Officer and Chief Financial Officer concluded that, at May 29, 2010, our disclosure controls
and procedures were effective.
There was no change in internal control over financial reporting during the fiscal quarter ended May 29, 2010, that has materially
affected or is reasonably likely to materially affect our internal control over financial reporting.
Page 39
39
PART II — OTHER INFORMATION
ITEM 2. UNREGISTERED SALES OF EQUITY SECURITIES AND USE OF PROCEEDS
(c) Stock Repurchases
The following table presents the total number of shares of our common stock that we purchased during the first quarter of fiscal 2011,
the average price paid per share, the number of shares that we purchased as part of our publicly announced repurchase program, and
the approximate dollar value of shares that still could have been purchased at the end of the applicable fiscal period, pursuant to our
June 2007 $5.5 billion share repurchase program:
Fiscal Period
Total Number
of Shares
Purchased
Average
Price Paid
per Share
Total Number of Shares
Purchased as Part of
Publicly Announced
Plans or Programs (1)
Approximate Dollar
Value of Shares that
May Yet Be
Purchased Under the
Plans or Programs (1)
February 28, 2010, through April 3, 2010 ...... — $ — — $ 2,500,000,000
April 4, 2010, through May 1, 2010 ............... 803,700 46.21 803,700 2,463,000,000
May 2, 2010, through May 29, 2010 ............... 1,734,100 42.40 1,734,100 2,389,000,000
Total Fiscal 2011 First Quarter ....................... 2,537,800 43.61 2,537,800 2,389,000,000
(1)
―Approximate Dollar Value of Shares that May Yet Be Purchased Under the Plans or Programs‖ reflects our $5.5 billion share
repurchase program announced on June 27, 2007, less the $3.0 billion we purchased in fiscal 2008 under our accelerated share
repurchase program and the $111 million we purchased in the first quarter of fiscal 2011. There is no stated expiration for the
June 2007 share repurchase program.
ITEM 4. RESERVED
Not applicable.
ITEM 6. EXHIBITS
31.1
Certification of the Chief Executive Officer pursuant to Rules 13a-14(a) and 15d-14(a) under the Securities Exchange
Act of 1934, as adopted pursuant to Section 302 of the Sarbanes-Oxley Act of 2002
31.2
Certification of the Chief Financial Officer pursuant to Rules 13a-14(a) and 15d-14(a) under the Securities Exchange
Act of 1934, as adopted pursuant to Section 302 of the Sarbanes-Oxley Act of 2002
32.1
Certification of the Chief Executive Officer pursuant to 18 U.S.C. Section 1350, as adopted pursuant to Section 906 of
the Sarbanes-Oxley Act of 2002
32.2
Certification of the Chief Financial Officer pursuant to 18 U.S.C. Section 1350, as adopted pursuant to Section 906 of
the Sarbanes-Oxley Act of 2002
101
The following financial information from our Quarterly Report on Form 10-Q for the first quarter of fiscal 2011, filed
with the SEC on July 8, 2010, formatted in Extensible Business Reporting Language (XBRL): (i) the condensed
consolidated balance sheets at May 29, 2010; February 27, 2010; and May 30, 2009, (ii) the consolidated statements of
earnings for the three months ended May 29, 2010, and May 30, 2009, (iii) the consolidated statements of cash flows for
the three months ended May 29, 2010, and May 30, 2009, (iv) the consolidated statements of changes in shareholders’
equity for the three months ended May 29, 2010, and May 30, 2009, and (v) the Notes to Condensed Consolidated
Financial Statements (tagged as blocks of text).(1)
(1) The XBRL related information in Exhibit 101 to this Quarterly Report on Form 10-Q shall not be deemed ―filed‖ for purposes of
Section 18 of the Securities Exchange Act of 1934, as amended, or otherwise subject to liability of that section and shall not be
incorporated by reference into any filing or other document pursuant to the Securities Act of 1933, as amended, except as shall be
expressly set forth by specific reference in such filing or document.
Page 40
40
SIGNATURES
Pursuant to the requirements of the Securities Exchange Act of 1934, the registrant has duly caused this report to be signed on its
behalf by the undersigned thereunto duly authorized.
BEST BUY CO., INC.
(Registrant)
Date: July 8, 2010 By: /s/ BRIAN J. DUNN
Brian J. Dunn
Chief Executive Officer
(duly authorized and principal executive officer)
Date: July 8, 2010 By: /s/ JAMES L. MUEHLBAUER
James L. Muehlbauer
Executive Vice President — Finance
and Chief Financial Officer
(duly authorized and principal financial officer)
Date: July 8, 2010 By: /s/ SUSAN S. GRAFTON
Susan S. Grafton
Vice President, Controller
and Chief Accounting Officer
(duly authorized and principal accounting officer)
Page 41
Exhibit 31.1
CERTIFICATION PURSUANT TO
RULES 13a-14(a) AND 15d-14(a) UNDER THE SECURITIES
EXCHANGE ACT OF 1934, AS ADOPTED PURSUANT TO
SECTION 302 OF THE SARBANES-OXLEY ACT OF 2002
I, Brian J. Dunn, certify that:
1. I have reviewed this quarterly report on Form 10-Q of Best Buy Co., Inc.;
2. Based on my knowledge, this report does not contain any untrue statement of a material fact or omit to state a material fact
necessary to make the statements made, in light of the circumstances under which such statements were made, not misleading
with respect to the period covered by this report;
3. Based on my knowledge, the financial statements, and other financial information included in this report, fairly present in all
material respects the financial condition, results of operations and cash flows of the registrant as of, and for, the periods presented
in this report;
4. The registrant’s other certifying officer and I are responsible for establishing and maintaining disclosure controls and procedures
(as defined in Exchange Act Rules 13a-15(e) and 15d-15(e)) and internal control over financial reporting (as defined in Exchange
Act Rules 13a-15(f) and 15d-15(f)) for the registrant and have:
a) Designed such disclosure controls and procedures, or caused such disclosure controls and procedures to be designed under
our supervision, to ensure that material information relating to the registrant, including its consolidated subsidiaries, is made
known to us by others within those entities, particularly during the period in which this report is being prepared;
b) Designed such internal control over financial reporting, or caused such internal control over financial reporting to be
designed under our supervision, to provide reasonable assurance regarding the reliability of financial reporting and the
preparation of financial statements for external purposes in accordance with generally accepted accounting principles;
c) Evaluated the effectiveness of the registrant’s disclosure controls and procedures and presented in this report our conclusions
about the effectiveness of the disclosure controls and procedures, as of the end of the period covered by this report based on
such evaluation; and
d) Disclosed in this report any change in the registrant’s internal control over financial reporting that occurred during the
registrant’s most recent fiscal quarter that has materially affected, or is reasonably likely to materially affect, the registrant’s
internal control over financial reporting; and
5. The registrant’s other certifying officer and I have disclosed, based on our most recent evaluation of internal control over
financial reporting, to the registrant’s auditors and the audit committee of the registrant’s board of directors (or persons
performing equivalent functions):
a) All significant deficiencies and material weaknesses in the design or operation of internal control over financial reporting
which are reasonably likely to adversely affect the registrant’s ability to record, process, summarize and report financial
information; and
b) Any fraud, whether or not material, that involves management or other employees who have a significant role in the
registrant’s internal control over financial reporting.
Date: July 8, 2010 /s/ BRIAN J. DUNN
Brian J. Dunn
Chief Executive Officer
Page 42
Exhibit 31.2
CERTIFICATION PURSUANT TO
RULES 13a-14(a) AND 15d-14(a) UNDER THE SECURITIES
EXCHANGE ACT OF 1934, AS ADOPTED PURSUANT TO
SECTION 302 OF THE SARBANES-OXLEY ACT OF 2002
I, James L. Muehlbauer, certify that:
1. I have reviewed this quarterly report on Form 10-Q of Best Buy Co., Inc.;
2. Based on my knowledge, this report does not contain any untrue statement of a material fact or omit to state a material fact
necessary to make the statements made, in light of the circumstances under which such statements were made, not misleading
with respect to the period covered by this report;
3. Based on my knowledge, the financial statements, and other financial information included in this report, fairly present in all
material respects the financial condition, results of operations and cash flows of the registrant as of, and for, the periods presented
in this report;
4. The registrant’s other certifying officer and I are responsible for establishing and maintaining disclosure controls and procedures
(as defined in Exchange Act Rules 13a-15(e) and 15d-15(e)) and internal control over financial reporting (as defined in Exchange
Act Rules 13a-15(f) and 15d-15(f)) for the registrant and have:
a) Designed such disclosure controls and procedures, or caused such disclosure controls and procedures to be designed under
our supervision, to ensure that material information relating to the registrant, including its consolidated subsidiaries, is made
known to us by others within those entities, particularly during the period in which this report is being prepared;
b) Designed such internal control over financial reporting, or caused such internal control over financial reporting to be
designed under our supervision, to provide reasonable assurance regarding the reliability of financial reporting and the
preparation of financial statements for external purposes in accordance with generally accepted accounting principles;
c) Evaluated the effectiveness of the registrant’s disclosure controls and procedures and presented in this report our conclusions
about the effectiveness of the disclosure controls and procedures, as of the end of the period covered by this report based on
such evaluation; and
d) Disclosed in this report any change in the registrant’s internal control over financial reporting that occurred during the
registrant’s most recent fiscal quarter that has materially affected, or is reasonably likely to materially affect, the registrant’s
internal control over financial reporting; and
5. The registrant’s other certifying officer and I have disclosed, based on our most recent evaluation of internal control over
financial reporting, to the registrant’s auditors and the audit committee of the registrant’s board of directors (or persons
performing equivalent functions):
a) All significant deficiencies and material weaknesses in the design or operation of internal control over financial reporting
which are reasonably likely to adversely affect the registrant’s ability to record, process, summarize and report financial
information; and
b) Any fraud, whether or not material, that involves management or other employees who have a significant role in the
registrant’s internal control over financial reporting.
Date: July 8, 2010 /s/ JAMES L. MUEHLBAUER
James L. Muehlbauer
Executive Vice President — Finance
and Chief Financial Officer
Page 43
Exhibit 32.1
CERTIFICATION PURSUANT TO
18 U.S.C. SECTION 1350,
AS ADOPTED PURSUANT TO
SECTION 906 OF THE SARBANES-OXLEY ACT OF 2002
Pursuant to 18 U.S.C. §1350 (adopted pursuant to §906 of the Sarbanes-Oxley Act of 2002), I, the undersigned Chief Executive
Officer of Best Buy Co., Inc. (the ―Company‖), hereby certify that the Quarterly Report on Form 10-Q of the Company for the
quarterly period ended May 29, 2010 (the ―Report‖), fully complies with the requirements of section 13(a) or 15 (d) of the Securities
Exchange Act of 1934, as amended, and that information contained in the Report fairly presents, in all material respects, the financial
condition and results of operations of the Company.
A signed original of this written statement required by Section 906 has been provided to the Company and will be retained by the
Company and furnished to the Securities and Exchange Commission or its staff upon request.
Date: July 8, 2010 /s/ BRIAN J. DUNN
Brian J. Dunn
Chief Executive Officer
Page 44
Exhibit 32.2
CERTIFICATION PURSUANT TO
18 U.S.C. SECTION 1350,
AS ADOPTED PURSUANT TO
SECTION 906 OF THE SARBANES-OXLEY ACT OF 2002
Pursuant to 18 U.S.C. §1350 (adopted pursuant to §906 of the Sarbanes-Oxley Act of 2002), I, the undersigned Executive Vice
President — Finance and Chief Financial Officer of Best Buy Co., Inc. (the ―Company‖), hereby certify that the Quarterly Report on
Form 10-Q of the Company for the quarterly period ended May 29, 2010 (the ―Report‖), fully complies with the requirements of
section 13(a) or 15(d) of the Securities Exchange Act of 1934, as amended, and that information contained in the Report fairly
presents, in all material respects, the financial condition and results of operations of the Company.
A signed original of this written statement required by Section 906 has been provided to the Company and will be retained by the
Company and furnished to the Securities and Exchange Commission or its staff upon request.
Date: July 8, 2010 /s/ JAMES L. MUEHLBAUER
James L. Muehlbauer
Executive Vice President — Finance
and Chief Financial Officer