UNITED STATES SECURITIES AND EXCHANGE COMMISSION Washington, D.C. 20549 FORM 10-Q (Mark One) ☑ QUARTERLY REPORT PURSUANT TO SECTION 13 OR 15(d) OF THE SECURITIES EXCHANGE ACT OF 1934 For the quarterly period ended March 31, 2021 OR ☐ TRANSITION REPORT PURSUANT TO SECTION 13 OR 15(d) OF THE SECURITIES EXCHANGE ACT OF 1934 For the transition period from __________ to __________ Commission file number 001-2979 WELLS FARGO & COMPANY (Exact name of registrant as specified in its charter) Delaware No. 41-0449260 (State of incorporation) (I.R.S. Employer Identification No.) 420 Montgomery Street, San Francisco, California 94104 (Address of principal executive offices) (Zip code) Registrant’s telephone number, including area code: 1-866-249-3302 Securities registered pursuant to Section 12(b) of the Act: Trading Name of Each Exchange Title of Each Class Symbol on Which Registered Common Stock, par value $1-2/3 WFC NYSE 7.5% Non-Cumulative Perpetual Convertible Class A Preferred Stock, Series L WFC.PRL NYSE Depositary Shares, each representing a 1/1000th interest in a share of Non-Cumulative Perpetual Class A Preferred Stock, Series N WFC.PRN NYSE Depositary Shares, each representing a 1/1000th interest in a share of Non-Cumulative Perpetual Class A Preferred Stock, Series O WFC.PRO NYSE Depositary Shares, each representing a 1/1000th interest in a share of 5.85% Fixed-to-Floating Rate Non-Cumulative Perpetual Class A Preferred Stock, Series Q WFC.PRQ NYSE Depositary Shares, each representing a 1/1000th interest in a share of 6.625% Fixed-to-Floating Rate Non-Cumulative Perpetual Class A Preferred Stock, Series R WFC.PRR NYSE Depositary Shares, each representing a 1/1000th interest in a share of Non-Cumulative Perpetual Class A Preferred Stock, Series X WFC.PRX NYSE Depositary Shares, each representing a 1/1000th interest in a share of Non-Cumulative Perpetual Class A Preferred Stock, Series Y WFC.PRY NYSE Depositary Shares, each representing a 1/1000th interest in a share of Non-Cumulative Perpetual Class A Preferred Stock, Series Z WFC.PRZ NYSE Depositary Shares, each representing a 1/1000th interest in a share of Non-Cumulative Perpetual Class A Preferred Stock, Series AA WFC.PRA NYSE Depositary Shares, each representing a 1/1000th interest in a share of Non-Cumulative Perpetual Class A Preferred Stock, Series CC WFC.PRC NYSE Guarantee of Medium-Term Notes, Series A, due October 30, 2028 of Wells Fargo Finance LLC WFC/28A NYSE Indicate by check mark whether the registrant (1) has filed all reports required to be filed by Section 13 or 15(d) of the Securities Exchange Act of 1934 during the preceding 12 months (or for such shorter period that the registrant was required to file such reports), and (2) has been subject to such filing requirements for the past 90 days. Yes þ No ¨ Indicate by check mark whether the registrant has submitted electronically every Interactive Data File required to be submitted pursuant to Rule 405 of Regulation S-T (§ 232.405 of this chapter) during the preceding 12 months (or for such shorter period that the registrant was required to submit such files). Yes þ No ¨ Indicate by check mark whether the registrant is a large accelerated filer, an accelerated filer, a non-accelerated filer, a smaller reporting company, or an emerging growth company. See the definitions of “large accelerated filer,” “accelerated filer,” “smaller reporting company,” and “emerging growth company” in Rule 12b-2 of the Exchange Act. Large accelerated filer þ Accelerated filer ¨ Non-accelerated filer ¨ Smaller reporting company ☐ Emerging growth company ☐ If an emerging growth company, indicate by check mark if the registrant has elected not to use the extended transition period for complying with any new or revised financial accounting standards provided pursuant to Section 13(a) of the Exchange Act. ¨ Indicate by check mark whether the registrant is a shell company (as defined in Rule 12b-2 of the Exchange Act). Yes ☐ No þ Indicate the number of shares outstanding of each of the issuer’s classes of common stock, as of the latest practicable date. Shares Outstanding April 22, 2021 Common stock, $1-2/3 par value 4,133,571,501
Transcript
UNITED STATES SECURITIES AND EXCHANGE COMMISSION
Washington, D.C. 20549 FORM 10-Q
(Mark One)
☑ QUARTERLY REPORT PURSUANT TO SECTION 13 OR 15(d) OF THE SECURITIES EXCHANGE ACT OF 1934 For the quarterly period ended March 31, 2021
OR
☐ TRANSITION REPORT PURSUANT TO SECTION 13 OR 15(d) OF THE SECURITIES EXCHANGE ACT OF 1934 For the transition period from __________ to __________
Commission file number 001-2979 WELLS FARGO & COMPANY
(Exact name of registrant as specified in its charter)
Delaware No. 41-0449260 (State of incorporation) (I.R.S. Employer Identification No.)
420 Montgomery Street, San Francisco, California 94104 (Address of principal executive offices) (Zip code)
Registrant’s telephone number, including area code: 1-866-249-3302
Securities registered pursuant to Section 12(b) of the Act:
Trading Name of Each Exchange Title of Each Class Symbol on Which Registered Common Stock, par value $1-2/3 WFC NYSE 7.5% Non-Cumulative Perpetual Convertible Class A Preferred Stock, Series L WFC.PRL NYSE Depositary Shares, each representing a 1/1000th interest in a share of Non-Cumulative Perpetual Class A Preferred Stock, Series N WFC.PRN NYSE Depositary Shares, each representing a 1/1000th interest in a share of Non-Cumulative Perpetual Class A Preferred Stock, Series O WFC.PRO NYSE
Depositary Shares, each representing a 1/1000th interest in a share of 5.85% Fixed-to-Floating Rate Non-Cumulative Perpetual ClassA Preferred Stock, Series Q WFC.PRQ NYSE
Depositary Shares, each representing a 1/1000th interest in a share of 6.625% Fixed-to-Floating Rate Non-Cumulative Perpetual ClassA Preferred Stock, Series R WFC.PRR NYSE Depositary Shares, each representing a 1/1000th interest in a share of Non-Cumulative Perpetual Class A Preferred Stock, Series X WFC.PRX NYSE Depositary Shares, each representing a 1/1000th interest in a share of Non-Cumulative Perpetual Class A Preferred Stock, Series Y WFC.PRY NYSE Depositary Shares, each representing a 1/1000th interest in a share of Non-Cumulative Perpetual Class A Preferred Stock, Series Z WFC.PRZ NYSE Depositary Shares, each representing a 1/1000th interest in a share of Non-Cumulative Perpetual Class A Preferred Stock, Series AA WFC.PRA NYSE Depositary Shares, each representing a 1/1000th interest in a share of Non-Cumulative Perpetual Class A Preferred Stock, Series CC WFC.PRC NYSE Guarantee of Medium-Term Notes, Series A, due October 30, 2028 of Wells Fargo Finance LLC WFC/28A NYSE
Indicate by check mark whether the registrant (1) has filed all reports required to be filed by Section 13 or 15(d) of the Securities Exchange Act of 1934during the preceding 12 months (or for such shorter period that the registrant was required to file such reports), and (2) has been subject to such filing requirements for the past 90 days. Yes þ No ¨
Indicate by check mark whether the registrant has submitted electronically every Interactive Data File required to be submitted pursuant to Rule 405 of Regulation S-T (§ 232.405 of this chapter) during the preceding 12 months (or for such shorter period that the registrant was required to submit such files). Yes þ No ¨
Indicate by check mark whether the registrant is a large accelerated filer, an accelerated filer, a non-accelerated filer, a smaller reporting company, or an emerging growth company. See the definitions of “large accelerated filer,” “accelerated filer,” “smaller reporting company,” and “emerging growth company” in Rule 12b-2 of the Exchange Act.
Large accelerated filer þ Accelerated filer ¨Non-accelerated filer ¨ Smaller reporting company ☐
Emerging growth company ☐
If an emerging growth company, indicate by check mark if the registrant has elected not to use the extended transition period for complying with any new or revised financial accounting standards provided pursuant to Section 13(a) of the Exchange Act. ¨
Indicate by check mark whether the registrant is a shell company (as defined in Rule 12b-2 of the Exchange Act). Yes ☐ No þ
Indicate the number of shares outstanding of each of the issuer’s classes of common stock, as of the latest practicable date.
Shares Outstanding April 22, 2021
Common stock, $1-2/3 par value 4,133,571,501
FORM 10-Q CROSS-REFERENCE INDEX
PART I Financial Information Item 1. Financial Statements Page
Consolidated Statement of Income 59 Consolidated Statement of Comprehensive Income 60 Consolidated Balance Sheet 61 Consolidated Statement of Changes in Equity 62 Consolidated Statement of Cash Flows 63 Notes to Financial Statements
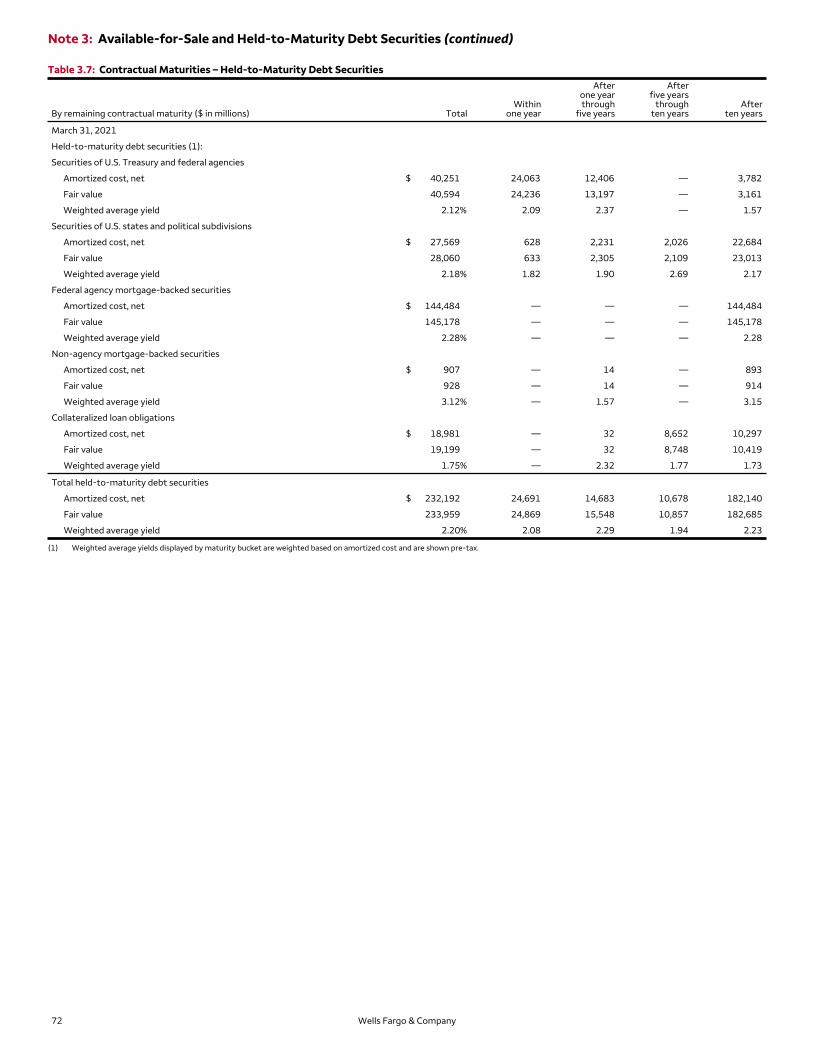
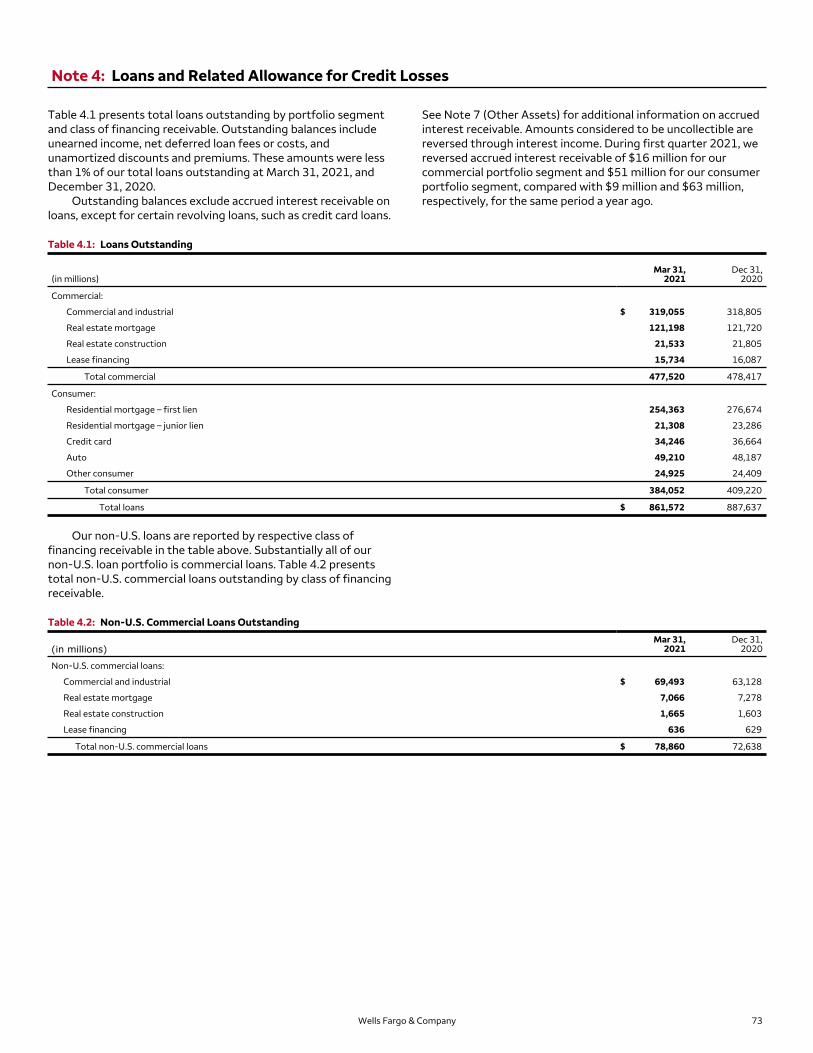
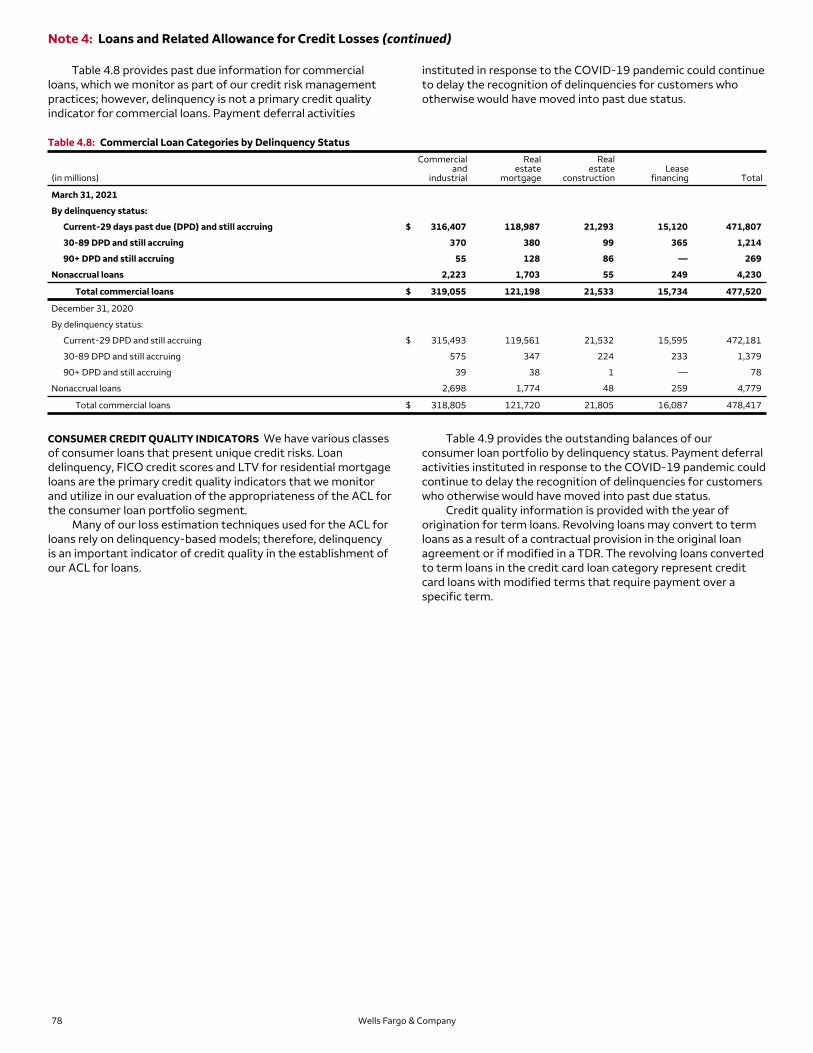
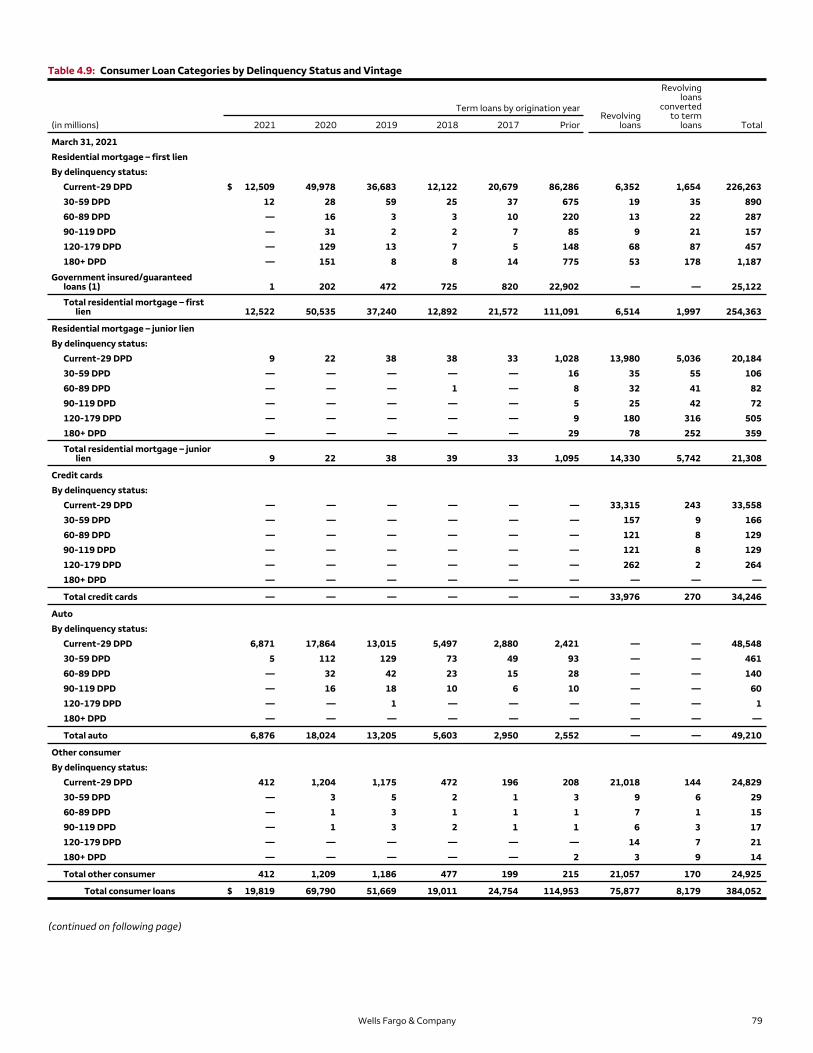
1 — Summary of Significant Accounting Policies 64 2 — Trading Activities 66 3 — Available-for-Sale and Held-to-Maturity Debt Securities 67 4 — Loans and Related Allowance for Credit Losses 73 5 — Leasing Activity 88 6 — Equity Securities 89 7 — Other Assets 91 8 — Securitizations and Variable Interest Entities 92 9 — Mortgage Banking Activities 97
10 — Intangible Assets 99 11 — Guarantees and Other Commitments 100 12 — Pledged Assets and Collateral 102 13 — Legal Actions 105 14 — Derivatives 109 15 — Fair Values of Assets and Liabilities 115 16 — Preferred Stock 122 17 — Revenue from Contracts with Customers 125 18 — Employee Benefits and Other Expenses 126 19 — Restructuring Charges 127 20 — Earnings and Dividends Per Common Share 128 21 — Other Comprehensive Income 129 22 — Operating Segments 131 23 — Regulatory Capital Requirements and Other Restrictions 133
Item 2. Management’s Discussion and Analysis of Financial Condition and Results of Operations (Financial Review) Summary Financial Data 1 Overview 3 Earnings Performance 6 Balance Sheet Analysis 23 Off-Balance Sheet Arrangements 25 Risk Management 26 Capital Management 47 Regulatory Matters 53 Critical Accounting Policies 54 Current Accounting Developments 54 Forward-Looking Statements 55 Risk Factors 57 Glossary of Acronyms 135
Item 3. Quantitative and Qualitative Disclosures About Market Risk 41 Item 4. Controls and Procedures 58
PART II Other Information Item 1. Legal Proceedings 136 Item 1A. Risk Factors 136 Item 2. Unregistered Sales of Equity Securities and Use of Proceeds 136 Item 6. Exhibits 137
Signature 138
Wells Fargo & Company 1
FINANCIAL REVIEW
Summary Financial Data
Quarter ended Mar 31, 2021
% Change from
($ in millions, except per share amounts) Mar 31,
2021 Dec 31,
2020 Mar 31,
2020 Dec 31, Mar 31,
2020 2020
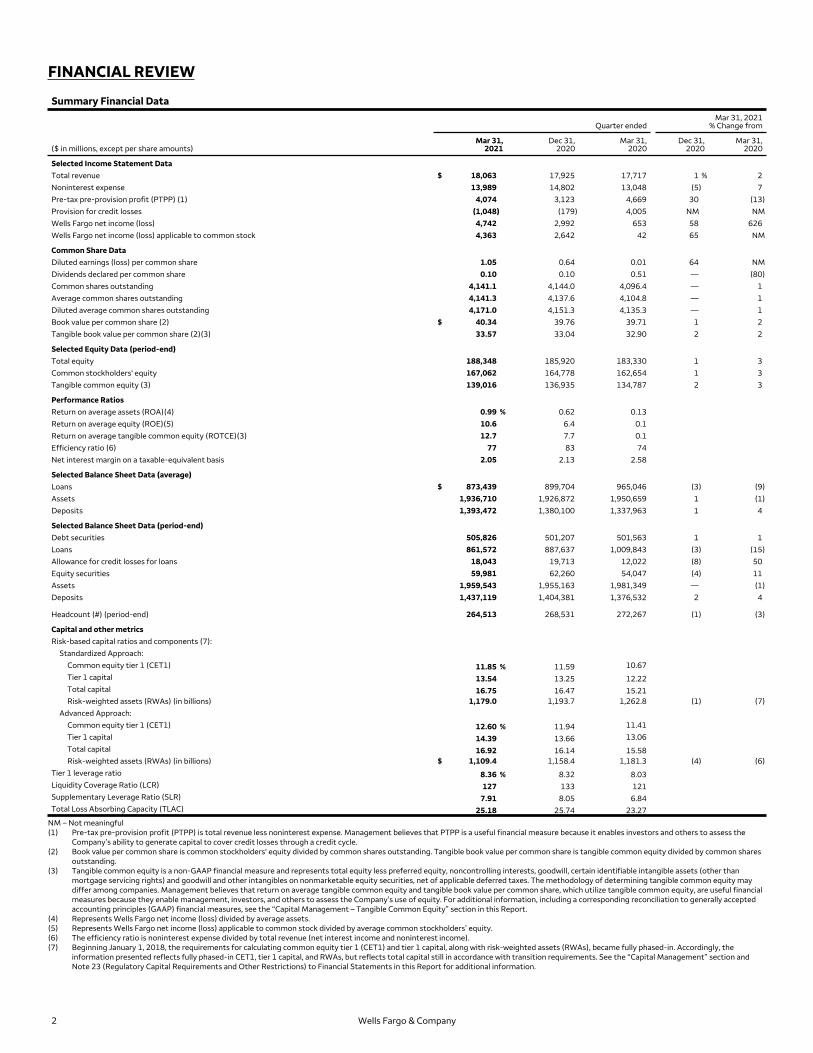
Selected Income Statement Data Total revenue $ 18,063 17,925 17,717 1 % 2 Noninterest expense 13,989 14,802 13,048 (5) 7 Pre-tax pre-provision profit (PTPP) (1) 4,074 3,123 4,669 30 (13) Provision for credit losses (1,048) (179) 4,005 NM NM Wells Fargo net income (loss) 4,742 2,992 653 58 626 Wells Fargo net income (loss) applicable to common stock 4,363 2,642 42 65 NM
Common Share Data Diluted earnings (loss) per common share 1.05 0.64 0.01 64 NM Dividends declared per common share 0.10 0.10 0.51 — (80) Common shares outstanding 4,141.1 4,144.0 4,096.4 — 1 Average common shares outstanding 4,141.3 4,137.6 4,104.8 — 1 Diluted average common shares outstanding 4,171.0 4,151.3 4,135.3 — 1 Book value per common share (2) $ 40.34 39.76 39.71 1 2 Tangible book value per common share (2)(3) 33.57 33.04 32.90 2 2
Selected Equity Data (period-end) Total equity 188,348 185,920 183,330 1 3 Common stockholders' equity 167,062 164,778 162,654 1 3 Tangible common equity (3) 139,016 136,935 134,787 2 3
Performance Ratios Return on average assets (ROA)(4) 0.99 % 0.62 0.13 Return on average equity (ROE)(5) 10.6 6.4 0.1 Return on average tangible common equity (ROTCE)(3) 12.7 7.7 0.1 Efficiency ratio (6) 77 83 74 Net interest margin on a taxable-equivalent basis 2.05 2.13 2.58
Capital and other metrics Risk-based capital ratios and components (7):
Standardized Approach: Common equity tier 1 (CET1) 11.85 % 11.59 10.67 Tier 1 capital 13.54 13.25 12.22 Total capital 16.75 16.47 15.21 Risk-weighted assets (RWAs) (in billions) 1,179.0 1,193.7 1,262.8 (1) (7)
Advanced Approach: Common equity tier 1 (CET1) 12.60 % 11.94 11.41 Tier 1 capital 14.39 13.66 13.06 Total capital 16.92 16.14 15.58 Risk-weighted assets (RWAs) (in billions) $ 1,109.4 1,158.4 1,181.3 (4) (6)
Tier 1 leverage ratio 8.36 % 8.32 8.03 Liquidity Coverage Ratio (LCR) 127 133 121 Supplementary Leverage Ratio (SLR) 7.91 8.05 6.84 Total Loss Absorbing Capacity (TLAC) 25.18 25.74 23.27
NM – Not meaningful (1) Pre-tax pre-provision profit (PTPP) is total revenue less noninterest expense. Management believes that PTPP is a useful financial measure because it enables investors and others to assess the
Company’s ability to generate capital to cover credit losses through a credit cycle. (2) Book value per common share is common stockholders' equity divided by common shares outstanding. Tangible book value per common share is tangible common equity divided by common shares
outstanding. (3) Tangible common equity is a non-GAAP financial measure and represents total equity less preferred equity, noncontrolling interests, goodwill, certain identifiable intangible assets (other than
mortgage servicing rights) and goodwill and other intangibles on nonmarketable equity securities, net of applicable deferred taxes. The methodology of determining tangible common equity may differ among companies. Management believes that return on average tangible common equity and tangible book value per common share, which utilize tangible common equity, are useful financial measures because they enable management, investors, and others to assess the Company’s use of equity. For additional information, including a corresponding reconciliation to generally accepted accounting principles (GAAP) financial measures, see the “Capital Management – Tangible Common Equity” section in this Report.
(4) Represents Wells Fargo net income (loss) divided by average assets. (5) Represents Wells Fargo net income (loss) applicable to common stock divided by average common stockholders’ equity. (6) The efficiency ratio is noninterest expense divided by total revenue (net interest income and noninterest income). (7) Beginning January 1, 2018, the requirements for calculating common equity tier 1 (CET1) and tier 1 capital, along with risk-weighted assets (RWAs), became fully phased-in. Accordingly, the
information presented reflects fully phased-in CET1, tier 1 capital, and RWAs, but reflects total capital still in accordance with transition requirements. See the “Capital Management” section and Note 23 (Regulatory Capital Requirements and Other Restrictions) to Financial Statements in this Report for additional information.
Wells Fargo & Company 2
This Quarterly Report, including the Financial Review and the Financial Statements and related Notes, contains forward-looking statements, which may include forecasts of our financial results and condition, expectations for our operations and business, and our assumptions for those forecasts and expectations. Do not unduly rely on forward-looking statements. Actual results may differ materially from our forward-looking statements due to several factors. Factors that could cause our actual results to differ materially from our forward-looking statements are described in this Report, including in the “Forward-Looking Statements” section, and in the “Risk Factors” and “Regulation and Supervision” sections of our Annual Report on Form 10-K for the year ended December 31, 2020 (2020 Form 10-K).
When we refer to “Wells Fargo,” “the Company,” “we,” “our,” or “us” in this Report, we mean Wells Fargo & Company and Subsidiaries (consolidated). When we refer to the “Parent,” we mean Wells Fargo & Company. See the Glossary of Acronyms for definitions of terms used throughout this Report.
Financial Review
Overview
Wells Fargo & Company is a leading financial services company that has approximately $1.9 trillion in assets and proudly serves one in three U.S. households and more than 10% of all middle market companies and small businesses in the U.S. We provide a diversified set of banking, investment and mortgage products and services, as well as consumer and commercial finance, through our four reportable operating segments: Consumer Banking and Lending, Commercial Banking, Corporate and Investment Banking, and Wealth and Investment Management. Wells Fargo ranked No. 30 on Fortune’s 2020 rankings of America’s largest corporations. We ranked fourth in assets and third in the market value of our common stock among all U.S. banks at March 31, 2021.
Wells Fargo’s top priority remains meeting its regulatory requirements to build the right foundation for all that lies ahead. The Company is subject to a number of consent orders and other regulatory actions, which may require the Company, among other things, to undertake certain changes to its business, operations, products and services, and risk management practices. Addressing these regulatory actions is expected to take multiple years, and we may experience issues or delays along the way in satisfying their requirements. Issues or delays with one regulatory action could affect our progress on others, and failure to satisfy the requirements of a regulatory action on a timely basis could result in additional penalties, enforcement actions, and other negative consequences. While we still have significant work to do, the Company is committed to devoting the resources necessary to operate with strong business practices and controls, maintain the highest level of integrity, and have an appropriate culture in place.
Federal Reserve Board Consent Order Regarding Governance Oversight and Compliance and Operational Risk Management On February 2, 2018, the Company entered into a consent order with the Board of Governors of the Federal Reserve System (FRB). As required by the consent order, the Company’s Board of Directors (Board) submitted to the FRB a plan to further enhance the Board’s governance and oversight of the Company, and the Company submitted to the FRB a plan to further improve the Company’s compliance and operational risk management program. The Company continues to engage with the FRB as the Company works to address the consent order provisions. The consent order also requires the Company, following the FRB’s acceptance and approval of the plans and the Company’s adoption and implementation of the plans, to complete an initial third-party review of the enhancements and improvements provided for in the plans. Until this third-party review is complete
and the plans are approved and implemented to the satisfaction of the FRB, the Company’s total consolidated assets as defined under the consent order will be limited to the level as of December 31, 2017. Compliance with this asset cap is measured on a two-quarter daily average basis to allow for management of temporary fluctuations. Due to the COVID-19 pandemic, on April 8, 2020, the FRB amended the consent order to allow the Company to exclude from the asset cap any on-balance sheet exposure resulting from loans made by the Company in connection with the Small Business Administration’s Paycheck Protection Program and the FRB’s Main Street Lending Program. As required under the amendment to the consent order, to the extent the Company chooses to exclude these exposures from the asset cap, certain fees and other economic benefits received by the Company from loans made in connection with these programs shall be transferred to the U.S. Treasury or to non-profit organizations approved by the FRB that support small businesses. As of March 31, 2021, the Company had not excluded these exposures from the asset cap. After removal of the asset cap, a second third-party review must also be conducted to assess the efficacy and sustainability of the enhancements and improvements.
Consent Orders with the Consumer Financial Protection Bureau and Office of the Comptroller of the Currency Regarding Compliance Risk Management Program, Automobile Collateral Protection Insurance Policies, and Mortgage Interest Rate Lock Extensions On April 20, 2018, the Company entered into consent orders with the Consumer Financial Protection Bureau (CFPB) and the Office of the Comptroller of the Currency (OCC) to pay an aggregate of $1 billion in civil money penalties to resolve matters regarding the Company’s compliance risk management program and past practices involving certain automobile collateral protection insurance (CPI) policies and certain mortgage interest rate lock extensions. As required by the consent orders, the Company submitted to the CFPB and OCC an enterprise-wide compliance risk management plan and a plan to enhance the Company’s internal audit program with respect to federal consumer financial law and the terms of the consent orders. In addition, as required by the consent orders, the Company submitted for non-objection plans to remediate customers affected by the automobile collateral protection insurance and mortgage interest rate lock matters, as well as a plan for the management of remediation activities conducted by the Company. The Company continues to work to address the provisions of the consent orders. The Company has not yet satisfied certain aspects of the consent orders, and as a result, we
Wells Fargo & Company 3
Overview (continued)
believe regulators may impose additional penalties or take other enforcement actions.
Retail Sales Practices Matters In September 2016, we announced settlements with the CFPB, the OCC, and the Office of the Los Angeles City Attorney, and entered into related consent orders with the CFPB and the OCC, in connection with allegations that some of our retail customers received products and services they did not request. As a result, it remains a top priority to rebuild trust through a comprehensive action plan that includes making things right for our customers, employees, and other stakeholders, and building a better Company for the future. Our priority of rebuilding trust has included numerous actions focused on identifying potential financial harm to customers resulting from these matters and providing remediation.
For additional information regarding retail sales practices matters, including related legal matters, see the “Risk Factors” section in our 2020 Form 10-K and Note 13 (Legal Actions) to Financial Statements in this Report.
Other Customer Remediation Activities Our priority of rebuilding trust has also included an effort to identify other areas or instances where customers may have experienced financial harm, provide remediation as appropriate, and implement additional operational and control procedures. We are working with our regulatory agencies in this effort. We have previously disclosed key areas of focus as part of our rebuilding trust efforts and are in the process of providing remediation for those matters. We have accrued for the probable and estimable remediation costs related to our rebuilding trust efforts, which amounts may change based on additional facts and information, as well as ongoing reviews and communications with our regulators.
As our ongoing reviews continue, it is possible that in the future we may identify additional items or areas of potential concern. To the extent issues are identified, we will continue to assess any customer harm and provide remediation as appropriate. For additional information, including related legal and regulatory risk, see the “Risk Factors” section in our 2020 Form 10-K and Note 13 (Legal Actions) to Financial Statements in this Report.
Recent Developments Efficiency Initiatives We are pursuing various initiatives to reduce expenses and create a more efficient and streamlined organization. Actions from these initiatives may include (i) reorganizing and simplifying business processes and structures to improve internal operations and the customer experience, (ii) reducing headcount, (iii) optimizing third-party spending, including for our technology infrastructure, and (iv) rationalizing our branch and administrative locations, which may include consolidations and closures. In first quarter 2021, we recognized a limited amount of restructuring charges within noninterest expense in our consolidated statement of income as a result of these initiatives. For additional information, see Note 19 (Restructuring Charges) to Financial Statements in this Report.
COVID-19 Pandemic In response to the COVID-19 pandemic, we have been working diligently to protect employee safety while continuing to carry out Wells Fargo’s role as a provider of essential services to the public. We have taken comprehensive steps to help customers, employees and communities.
We have strong levels of capital and liquidity, and we remain focused on delivering for our customers and communities to get through these unprecedented times.
PAYCHECK PROTECTION PROGRAM The Coronavirus Aid, Relief, and Economic Security Act (CARES Act) created funding for the Small Business Administration’s (SBA) loan program providing forgiveness of up to the full principal amount of qualifying loans guaranteed under a program called the Paycheck Protection Program (PPP). Since its inception, we have funded approximately 264,000 loans under the PPP totaling $13.2 billion, and more than $1.0 billion of principal forgiveness has been provided on qualifying PPP loans. We deferred approximately $420 million of SBA processing fees in 2020 that will be recognized as interest income over the terms of the loans. We voluntarily committed to donate all of the gross processing fees received from PPP loans funded in 2020. Through March 31, 2021, we donated approximately $125 million of these processing fees to non-profit organizations that support small businesses. We funded $2.8 billion of PPP loans in first quarter 2021. For this latest round in first quarter 2021, we deferred approximately $200 million of SBA processing fees that will be recognized as interest income over the terms of the loans. We have committed to donate any net profits related to PPP loans funded in 2021. For additional information on the CARES Act and the PPP, see the “Overview – Recent Developments – COVID-19 Pandemic” section in our 2020 Form 10-K.
LIBOR Transition The London Interbank Offered Rate (LIBOR) is a widely-referenced benchmark rate, which is published in five currencies and a range of tenors, and seeks to estimate the cost at which banks can borrow on an unsecured basis from other banks. On March 5, 2021, the Financial Conduct Authority and the administrator of LIBOR announced that LIBOR will no longer be published on a representative basis after December 31, 2021, with the exception of the most commonly used tenors of U.S. dollar (USD) LIBOR which will no longer be published on a representative basis after June 30, 2023. Federal banking agencies have issued guidance strongly encouraging banking organizations to cease using USD LIBOR as a reference rate in new contracts as soon as practicable and in any event by December 31, 2021.
For information on the amount of our LIBOR-linked assets and liabilities, as well as initiatives created by our LIBOR Transition Office in an effort to mitigate the risks associated with a transition away from LIBOR, see the “Overview – Recent Developments – LIBOR Transition” section in our 2020 Form 10-K. For information regarding the risks and potential impact of LIBOR or any other referenced financial metric being significantly changed, replaced or discontinued, see the “Risk Factors” section in our 2020 Form 10-K.
Capital Actions and Restrictions On March 25, 2021, the FRB announced that it was extending measures it previously announced limiting capital distributions by large bank holding companies (BHCs), including Wells Fargo, subject to certain exceptions. The FRB has generally authorized, among other things, BHCs to pay common stock dividends and make share repurchases that, in the aggregate, do not exceed an amount equal to the average of the BHC’s net income for the four preceding calendar quarters, so long as the BHC does not increase the amount of its common stock dividend from the level paid in second quarter 2020. The FRB also announced that if a BHC remains above all of its minimum risk-based capital
Wells Fargo & Company 4
requirements in this year's supervisory stress test, these additional limitations on capital distributions will end for that BHC after June 30, 2021. For additional information about capital planning, including the FRB’s recent announcement on capital distributions, see the “Capital Management – Capital Planning and Stress Testing” section in this Report.
Business and Portfolio Divestitures On February 23, 2021, we announced an agreement to sell Wells Fargo Asset Management for a purchase price of $2.1 billion. As part of the transaction, we will own a 9.9% equity interest and continue to serve as a client and distribution partner.
On March 23, 2021, we announced an agreement to sell our Corporate Trust Services business for a purchase price of $750 million. Both transactions are expected to close in the second half of 2021, subject to customary closing conditions.
In first quarter 2021, we completed the first phase of the previously announced sale of our student loan portfolio, which resulted in a $208 million gain included in other noninterest income and a $104 million goodwill write-down included in other noninterest expense. In April 2021, we completed the sale of substantially all of the remaining portfolio, which will result in a $147 million gain and a $79 million write-down of the remaining goodwill in second quarter 2021.
Quarter ended Mar 31,
($ in millions) 2021 2020 $ Change % Change
Selected income statement data
Net interest income $ 8,798 11,312 (2,514) (22)%
Noninterest income 9,265 6,405 2,860 45
Total revenue 18,063 17,717 346 2
Net charge-offs 523 941 (418) (44)
Change in the allowance for credit losses (1,571) 3,064 (4,635) NM
Provision for credit losses (1,048) 4,005 (5,053) NM
Wells Fargo net income applicable to common stock 4,363 42 4,321 NM NM – Not meaningful
In first quarter 2021, we generated $4.7 billion of net income and diluted earnings per common share (EPS) of $1.05, compared with $653 million of net income and EPS of $0.01 in the same period a year ago. Financial performance for first quarter 2021, compared with the same period a year ago, included the following: • total revenue increased due to higher net gains from equity
securities and mortgage banking income, partially offset by lower net interest income;
• provision for credit losses decreased reflecting lower net charge-offs and improvements in the economic environment;
• noninterest expense increased due to higher personnel expense, partially offset by lower operating losses and lower professional and outside services expense;
• average loans decreased due to paydowns exceeding originations in the residential mortgage and credit card portfolios, weak demand for commercial loans, and the reclassification of student loans, included in other consumer loans, to loans held for sale after the announced sale of the portfolio in fourth quarter 2020; and
• average deposits increased driven by growth in consumer deposits in the Consumer Banking and Lending and Wealth and Investment Management (WIM) operating segments due to customers' preferences for liquidity given the economic uncertainty associated with the COVID-19 pandemic, government stimulus programs, and lower consumer spending, partially offset by actions taken to manage under the asset cap which reduced deposits in the Corporate and Investment Banking operating segment and Corporate.
Capital and Liquidity We maintained a strong capital position in first quarter 2021, with total equity of $188.3 billion at March 31, 2021, compared with $185.9 billion at December 31, 2020. Our liquidity and regulatory capital ratios remained strong at March 31, 2021, including: • our liquidity coverage ratio (LCR) was 127%, which
continued to exceed the regulatory minimum of 100%; • our Common Equity Tier 1 (CET1) ratio was 11.85%, which
continued to exceed both the regulatory requirement of 9% and our current internal target of 10%; and
• our eligible external total loss absorbing capacity (TLAC) as a percentage of total risk-weighted assets was 25.18%, compared with the regulatory requirement of 21.50%. See the “Capital Management” and the “Risk Management –
Asset/Liability Management – Liquidity Risk and Funding” sections in this Report for additional information regarding our capital and liquidity, including the calculation of our regulatory capital and liquidity amounts.
Credit Quality Credit quality was impacted by the improving economic environment. • The allowance for credit losses (ACL) for loans of
$18.0 billion at March 31, 2021, decreased $1.7 billion from December 31, 2020.
• Our provision for credit losses for loans was $(1.1) billion in first quarter 2021, down from $3.8 billion in the same period a year ago. The decrease in the ACL for loans and the provision for credit losses in first quarter 2021, compared with the same period a year ago, reflected improvements in the economic environment.
Wells Fargo & Company 5
Overview (continued)
• The allowance coverage for total loans was 2.09% at 2021, compared with net loan charge-offs of $585 million, March 31, 2021, compared with 2.22% at December 31, or 53 basis points, in the same period a year ago, driven by 2020. lower losses in all consumer loan portfolios as a result of
• Commercial portfolio net loan charge-offs were payment deferral activities and government stimulus $149 million, or 13 basis points of average commercial loans, programs instituted in response to the COVID-19 pandemic. in first quarter 2021, compared with net loan charge-offs of • Nonperforming assets (NPAs) of $8.2 billion at March 31, $324 million, or 25 basis points, in the same period a year 2021, decreased $692 million, or 8%, from December 31, ago, predominantly driven by lower losses in our commercial 2020, predominantly driven by decreases in our commercial and industrial portfolio primarily within the oil, gas and and industrial portfolio, primarily within the oil, gas and pipelines industry, partially offset by increased losses in the pipelines industry, commercial real estate mortgage, and real estate mortgage and construction portfolios. residential mortgage portfolios reflecting improvements in
• Consumer portfolio net loan charge-offs were $364 million, the economic environment. NPAs represented 0.95% of or 37 basis points of average consumer loans, in first quarter total loans at March 31, 2021.
Earnings Performance
Wells Fargo net income for first quarter 2021 was $4.7 billion ($1.05 diluted EPS), compared with $653 million ($0.01 diluted EPS) for first quarter 2020. Net income increased in first quarter 2021, compared with the same period a year ago, predominantly due to a $5.1 billion decrease in provision for credit losses and a $2.9 billion increase in noninterest income, partially offset by a $2.5 billion decrease in net interest income and a $941 million increase in noninterest expense.
Net Interest Income Net interest income and net interest margin decreased in first quarter 2021, compared with the same period a year ago, driven by a repricing of the balance sheet, lower loan balances primarily due to soft demand and elevated prepayments, as well as unfavorable hedge ineffectiveness accounting results, and higher mortgage-backed securities premium amortization.
Table 1 presents the individual components of net interest income and the net interest margin. Net interest income and the net interest margin are presented on a taxable-equivalent basis in Table 1 to consistently reflect income from taxable and tax-exempt loans and debt and equity securities based on a 21% federal statutory tax rate for the periods ended March 31, 2021 and 2020.
For additional information about net interest income and net interest margin, see the “Earnings Performance – Net Interest Income” section in our 2020 Form 10-K.
Wells Fargo & Company 6
Table 1: Average Balances, Yields and Rates Paid (Taxable-Equivalent Basis) (1) Quarter ended March 31,
2021 2020
Interest Interest Average income/ Interest Average income/ Interest
(in millions) balance expense rates balance expense rates
Other noninterest-bearing liabilities 67,609 — 62,348 —
Total noninterest-bearing liabilities $ 529,965 — 409,675 —
Total liabilities $ 1,747,378 1,238 1,762,489 3,416
Total equity 189,332 — 188,170 —
Total liabilities and equity $ 1,936,710 1,238 1,950,659 3,416
Interest rate spread on a taxable-equivalent basis (3) 1.92 % 2.34 %
Net interest income and net interest margin on a taxable-equivalent basis (3) $ 8,903 2.05 % $ 11,452 2.58 %
(1) The average balance amounts represent amortized costs. The interest rates are based on interest income or expense amounts for the period and are annualized. Interest rates and amounts include the effects of hedge and risk management activities associated with the respective asset and liability categories.
(2) Nonaccrual loans and any related income are included in their respective loan categories. (3) Includes taxable-equivalent adjustments of $105 million and $140 million for the quarters ended March 31, 2021 and 2020, respectively, predominantly related to tax-exempt income on certain
loans and securities.
Wells Fargo & Company 7
Earnings Performance (continued)
Noninterest Income
Table 2: Noninterest Income Quarter ended March 31,
(in millions) 2021 2020 $ Change % Change
Deposit-related fees $ 1,255 1,447 (192) (13)%
Lending-related fees 361 350 11 3
Investment advisory and other asset-based fees (1) 2,756 2,506 250 10
Commissions and brokerage services fees (1) 636 677 (41) (6)
Investment banking fees 568 391 177 45
Card fees 949 892 57 6
Servicing income, net (99) 271 (370) NM
Net gains on mortgage loan originations/sales 1,425 108 1,317 NM
Mortgage banking 1,326 379 947 250
Net gains from trading activities 348 64 284 444
Net gains on debt securities 151 237 (86) (36)
Net gains (losses) from equity securities 392 (1,401) 1,793 128
Lease income 315 353 (38) (11)
Other 208 510 (302) (59)
Total $ 9,265 6,405 2,860 45
NM – Not meaningful (1) In first quarter 2021, trust and investment management fees and asset-based brokerage fees were combined into a single line item for investment advisory and other asset-based fees, and
brokerage commissions and other brokerage services fees were combined into a single line item for commissions and brokerage services fees. Prior period balances have been revised to conform with the current period presentation.
First quarter 2021 vs. first quarter 2020
Deposit-related fees decreased driven by: • higher average consumer deposit account balances due to
the economic slowdown and government stimulus programs associated with the COVID-19 pandemic; and
• higher fee waivers and reversals as part of our actions to support customers during the COVID-19 pandemic;
driven by a lower earnings credit rate due to the lower interest rate environment.
Investment advisory and other asset-based fees increased reflecting higher market valuations on client investment assets.
For additional information on certain client investment assets, see the “Earnings Performance – Operating Segment Results – Wealth and Investment Management – WIM Advisory Assets” and “Earnings Performance – Operating Segment Results – Corporate – Wells Fargo Asset Management (WFAM) Assets Under Management” sections in this Report.
Commissions and brokerage services fees decreased driven by lower transactional revenue due to higher customer activity in first quarter 2020 reflecting the economic uncertainty associated with the onset of the COVID-19 pandemic.
Investment banking fees increased driven by higher advisory fees and equity and debt origination fees.
Card fees increased reflecting lower credit card rewards costs, partially offset by lower late fees due to higher payment rates.
Servicing income, net decreased reflecting: • lower servicing fees due to a lower balance of loans serviced
for others resulting from continued prepayments; and • lower income from mortgage servicing right (MSR) valuation
changes and related hedges, which reflected a favorable
impact from changes in interest rates, more than offset by less favorable hedge results.
Net gains on mortgage loan originations/sales increased driven by: • higher margins in our retail production channel; • higher residential real estate held for sale (HFS) origination
volumes in our retail production channel; • higher gains related to the re-securitization of loans we
purchased from Government National Mortgage Association (GNMA) loan securitization pools in 2020; and
• higher gains due to losses in first quarter 2020 driven by the impact of interest rate volatility on hedging activities associated with our residential mortgage loans held for sale portfolio and pipeline, as well as valuation losses on certain residential and commercial loans held for sale due to market conditions.
For additional information on servicing income and net gains on mortgage loan originations/sales, see Note 9 (Mortgage Banking Activities) to Financial Statements in this Report.
Net gains from trading activities increased reflecting: • higher client demand for asset-backed finance products,
other credit products, and municipal bonds; partially offset by: • lower client demand for interest rate products and lower
revenue in equities and commodities.
Net gains on debt securities decreased due to lower gains from the sales of agency mortgage-backed securities (MBS) and municipal bonds as a result of decreased sales volumes.
Net gains (losses) from equity securities increased driven by: • lower impairment of $920 million on equity securities due to
the market impact of the COVID-19 pandemic in first quarter 2020;
• losses in first quarter 2020 on deferred compensation plan investments (largely offset in personnel expense). Refer to
Wells Fargo & Company 8
Table 3a for the results for our deferred compensation plan and related hedges; and
• higher realized gains on marketable equity securities.
Lease income decreased due to a reduction in the size of the operating lease asset portfolio.
Other income decreased due to: • lower gains on the sales of residential mortgage loans which
were reclassified to held for sale in 2019; and • higher valuation losses related to the retained litigation risk,
including the timing and amount of final settlement,
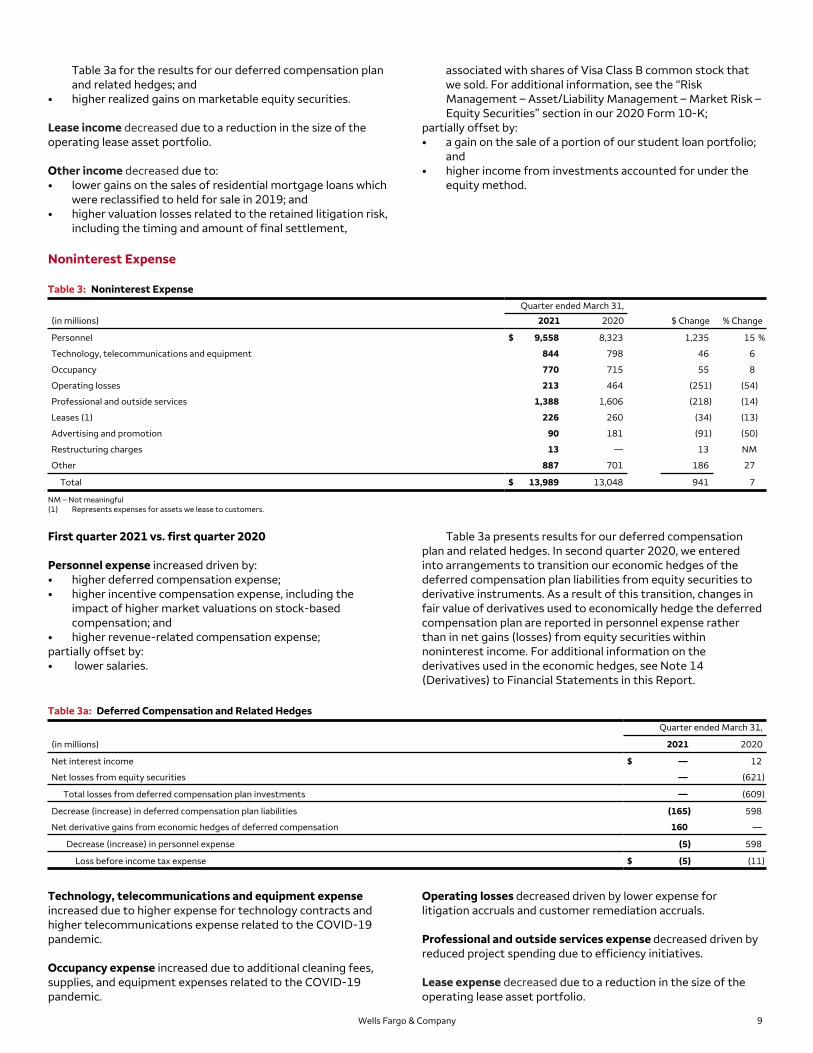
Noninterest Expense
Table 3: Noninterest Expense
associated with shares of Visa Class B common stock that we sold. For additional information, see the “Risk Management – Asset/Liability Management – Market Risk – Equity Securities” section in our 2020 Form 10-K;
partially offset by: • a gain on the sale of a portion of our student loan portfolio;
and • higher income from investments accounted for under the
equity method.
Quarter ended March 31, (in millions) 2021 2020 $ Change % Change
Personnel $ 9,558 8,323 1,235 15 %
Technology, telecommunications and equipment 844 798 46 6
Occupancy 770 715 55 8
Operating losses 213 464 (251) (54)
Professional and outside services 1,388 1,606 (218) (14)
Leases (1) 226 260 (34) (13)
Advertising and promotion 90 181 (91) (50)
Restructuring charges 13 — 13 NM
Other 887 701 186 27
Total $ 13,989 13,048 941 7
NM – Not meaningful (1) Represents expenses for assets we lease to customers.
First quarter 2021 vs. first quarter 2020
Personnel expense increased driven by: • higher deferred compensation expense; • higher incentive compensation expense, including the
impact of higher market valuations on stock-based compensation; and
Table 3a: Deferred Compensation and Related Hedges
Table 3a presents results for our deferred compensation plan and related hedges. In second quarter 2020, we entered into arrangements to transition our economic hedges of the deferred compensation plan liabilities from equity securities to derivative instruments. As a result of this transition, changes in fair value of derivatives used to economically hedge the deferred compensation plan are reported in personnel expense rather than in net gains (losses) from equity securities within noninterest income. For additional information on the derivatives used in the economic hedges, see Note 14 (Derivatives) to Financial Statements in this Report.
Quarter ended March 31,
(in millions) 2021 2020
Net interest income $ — 12
Net losses from equity securities — (621)
Total losses from deferred compensation plan investments — (609)
Decrease (increase) in deferred compensation plan liabilities (165) 598
Net derivative gains from economic hedges of deferred compensation 160 —
Decrease (increase) in personnel expense (5) 598
Loss before income tax expense $ (5) (11)
Technology, telecommunications and equipment expense increased due to higher expense for technology contracts and higher telecommunications expense related to the COVID-19 pandemic.
Occupancy expense increased due to additional cleaning fees, supplies, and equipment expenses related to the COVID-19 pandemic.
Operating losses decreased driven by lower expense for litigation accruals and customer remediation accruals.
Professional and outside services expense decreased driven by reduced project spending due to efficiency initiatives.
Lease expense decreased due to a reduction in the size of the operating lease asset portfolio.
Wells Fargo & Company 9
Earnings Performance (continued)
Advertising and promotion expense decreased driven by reduced marketing and brand campaign volumes due to the impact of the COVID-19 pandemic.
Restructuring charges increased related to our efficiency initiatives that began in third quarter 2020. For additional information on restructuring charges, see Note 19 (Restructuring Charges) to Financial Statements in this Report.
Other expenses increased driven by: • a write-down of goodwill in first quarter 2021 related to the
sale of a portion of our student loan portfolio; • higher charitable donations expense driven by the donation
of PPP processing fees; and • higher Federal Deposit Insurance Corporation (FDIC)
deposit assessment expense driven by a higher assessment rate;
partially offset by: • a reduction in business travel and company events due to
the impact of the COVID-19 pandemic.
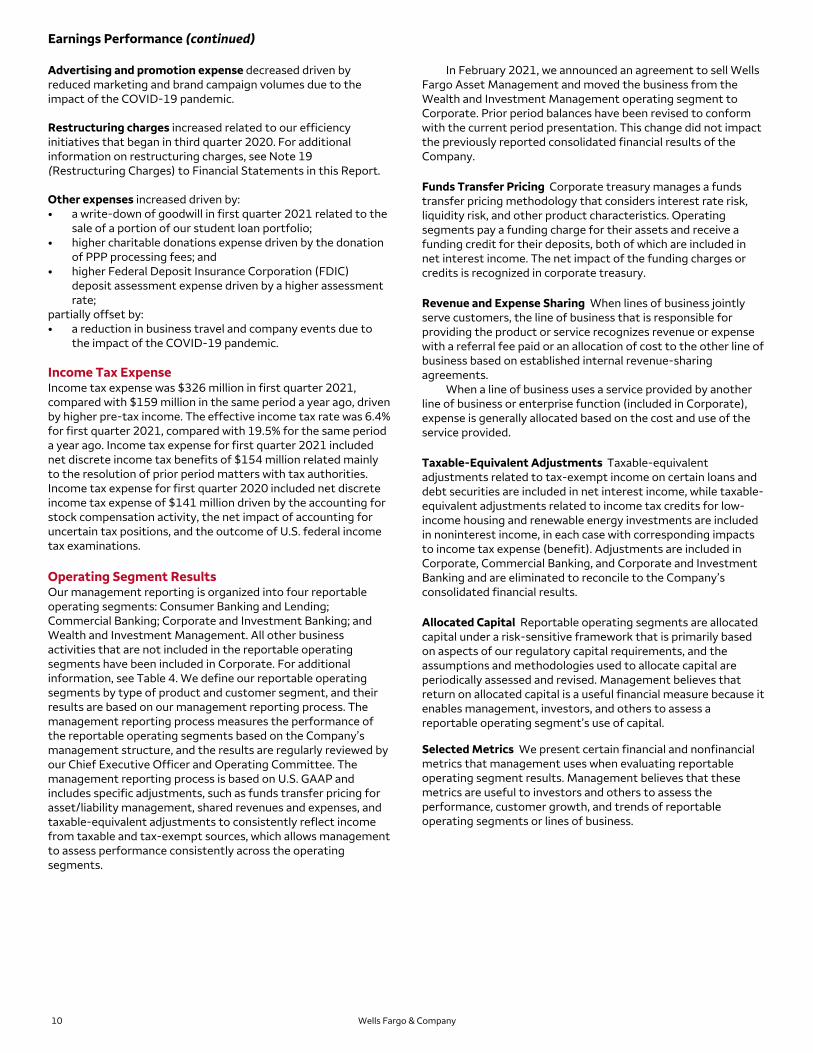
Income Tax Expense Income tax expense was $326 million in first quarter 2021, compared with $159 million in the same period a year ago, driven by higher pre-tax income. The effective income tax rate was 6.4% for first quarter 2021, compared with 19.5% for the same period a year ago. Income tax expense for first quarter 2021 included net discrete income tax benefits of $154 million related mainly to the resolution of prior period matters with tax authorities. Income tax expense for first quarter 2020 included net discrete income tax expense of $141 million driven by the accounting for stock compensation activity, the net impact of accounting for uncertain tax positions, and the outcome of U.S. federal income tax examinations.
Operating Segment Results Our management reporting is organized into four reportable operating segments: Consumer Banking and Lending; Commercial Banking; Corporate and Investment Banking; and Wealth and Investment Management. All other business activities that are not included in the reportable operating segments have been included in Corporate. For additional information, see Table 4. We define our reportable operating segments by type of product and customer segment, and their results are based on our management reporting process. The management reporting process measures the performance of the reportable operating segments based on the Company’s management structure, and the results are regularly reviewed by our Chief Executive Officer and Operating Committee. The management reporting process is based on U.S. GAAP and includes specific adjustments, such as funds transfer pricing for asset/liability management, shared revenues and expenses, and taxable-equivalent adjustments to consistently reflect income from taxable and tax-exempt sources, which allows management to assess performance consistently across the operating segments.
In February 2021, we announced an agreement to sell Wells Fargo Asset Management and moved the business from the Wealth and Investment Management operating segment to Corporate. Prior period balances have been revised to conform with the current period presentation. This change did not impact the previously reported consolidated financial results of the Company.
Funds Transfer Pricing Corporate treasury manages a funds transfer pricing methodology that considers interest rate risk, liquidity risk, and other product characteristics. Operating segments pay a funding charge for their assets and receive a funding credit for their deposits, both of which are included in net interest income. The net impact of the funding charges or credits is recognized in corporate treasury.
Revenue and Expense Sharing When lines of business jointly serve customers, the line of business that is responsible for providing the product or service recognizes revenue or expense with a referral fee paid or an allocation of cost to the other line of business based on established internal revenue-sharing agreements.
When a line of business uses a service provided by another line of business or enterprise function (included in Corporate), expense is generally allocated based on the cost and use of the service provided.
Taxable-Equivalent Adjustments Taxable-equivalent adjustments related to tax-exempt income on certain loans and debt securities are included in net interest income, while taxable-equivalent adjustments related to income tax credits for low-income housing and renewable energy investments are included in noninterest income, in each case with corresponding impacts to income tax expense (benefit). Adjustments are included in Corporate, Commercial Banking, and Corporate and Investment Banking and are eliminated to reconcile to the Company’s consolidated financial results.
Allocated Capital Reportable operating segments are allocated capital under a risk-sensitive framework that is primarily based on aspects of our regulatory capital requirements, and the assumptions and methodologies used to allocate capital are periodically assessed and revised. Management believes that return on allocated capital is a useful financial measure because it enables management, investors, and others to assess a reportable operating segment’s use of capital.
Selected Metrics We present certain financial and nonfinancial metrics that management uses when evaluating reportable operating segment results. Management believes that these metrics are useful to investors and others to assess the performance, customer growth, and trends of reportable operating segments or lines of business.
Wells Fargo & Company 10
Table 4: Management Reporting Structure
Wells Fargo & Company
Consumer Banking and
Lending
• Consumer and Small Business
Banking
• Home Lending
• Credit Card
• Auto
• Personal Lending
Commercial Banking
• Middle Market Banking
• Asset-Based Lending and Leasing
Corporate andInvestment
Banking
• Banking
• Commercial Real Estate
• Markets
Wealth and Investment
Management
• Wells Fargo Advisors
• The Private Bank
Corporate
• Corporate Treasury
• Enterprise Functions
• Investment Portfolio
• Affiliated venture capital and private
equity partnerships
• Non-strategic businesses
Table 5 and the following discussion present our results by reportable operating segment. For additional information, see Note 22 (Operating Segments) to Financial Statements in this Report.
Table 5: Operating Segment Results – Highlights
Quarter ended March 31,
(in millions)
Consumer Banking and
Lending Commercial
Banking
Corporate andInvestment
Banking
Wealth and Investment
Management Corporate (1) Reconciling
Items (2) Consolidated
Company
2021
Net interest income $ 5,615 1,283 1,778 657 (430) (105) 8,798
Noninterest income 3,039 925 1,845 2,887 1,319 (750) 9,265
Total revenue 8,654 2,208 3,623 3,544 889 (855) 18,063
Net income (loss) before noncontrolling interests 618 (175) 292 453 (683) — 505
Less: Net income (loss) from noncontrollinginterests — 1 — — (149) — (148)
Net income (loss) $ 618 (176) 292 453 (534) — 653
(1) All other business activities that are not included in the reportable operating segments have been included in Corporate. For additional information, see the "Corporate" section below. In February 2021, we announced an agreement to sell Wells Fargo Asset Management and moved the business from the Wealth and Investment Management operating segment to Corporate. Prior period balances have been revised to conform with the current period presentation.
(2) Taxable-equivalent adjustments related to tax-exempt income on certain loans and debt securities are included in net interest income, while taxable-equivalent adjustments related to income tax credits for low-income housing and renewable energy investments are included in noninterest income, in each case with corresponding impacts to income tax expense (benefit). Adjustments are included in Corporate, Commercial Banking, and Corporate and Investment Banking and are eliminated to reconcile to the Company’s consolidated financial results.
Wells Fargo & Company 11
Earnings Performance (continued)
Consumer Banking and Lending offers diversified financial debit cards, as well as home, auto, personal, and small business products and services for consumers and small businesses with lending. Table 5a and Table 5b provide additional information for annual sales generally up to $5 million. These financial products Consumer Banking and Lending. and services include checking and savings accounts, credit and
Table 5a: Consumer Banking and Lending – Income Statement and Selected Metrics Quarter ended March 31,
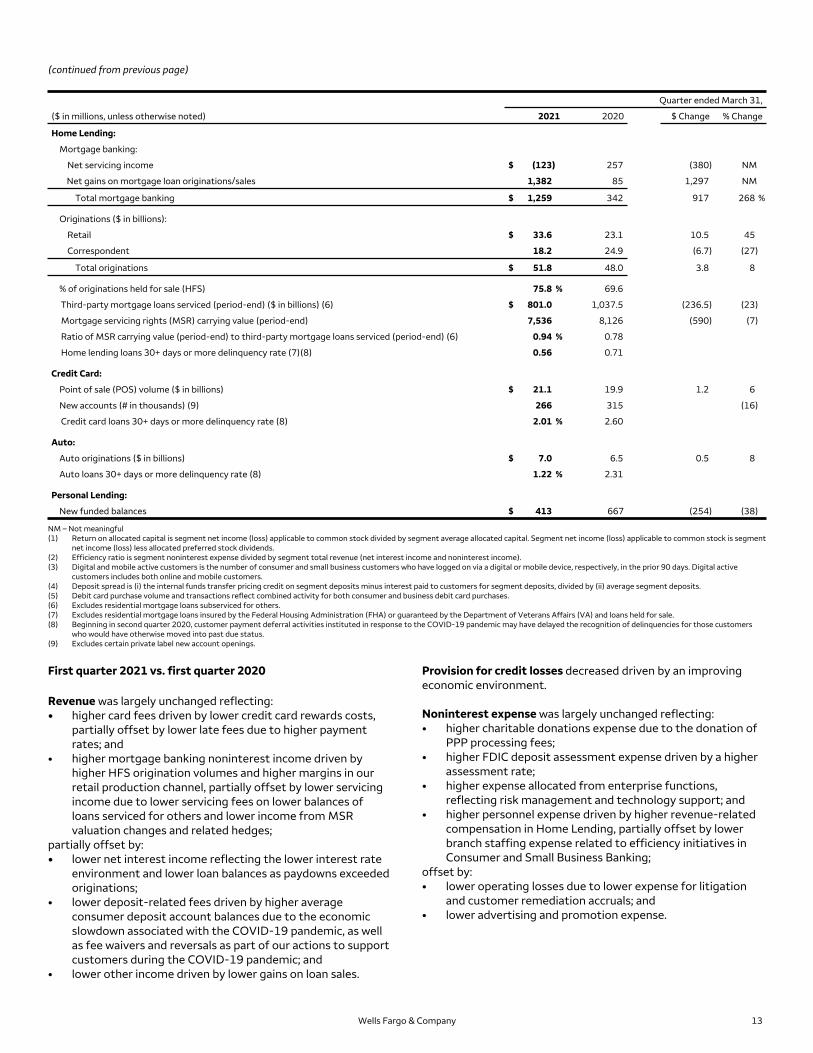
Third-party mortgage loans serviced (period-end) ($ in billions) (6)
Mortgage servicing rights (MSR) carrying value (period-end)
Ratio of MSR carrying value (period-end) to third-party mortgage loans serviced (period-end) (6)
Home lending loans 30+ days or more delinquency rate (7)(8)
$
75.8 %
801.0
7,536
0.94 %
0.56
69.6
1,037.5
8,126
0.78
0.71
(236.5)
(590)
(23)
(7)
Credit Card:
Point of sale (POS) volume ($ in billions)
New accounts (# in thousands) (9)
Credit card loans 30+ days or more delinquency rate (8)
$ 21.1
266
2.01 %
19.9
315
2.60
1.2 6
(16)
Auto:
Auto originations ($ in billions)
Auto loans 30+ days or more delinquency rate (8)
$ 7.0
1.22 %
6.5
2.31
0.5 8
Personal Lending:
New funded balances $ 413 667 (254) (38)
NM – Not meaningful (1) Return on allocated capital is segment net income (loss) applicable to common stock divided by segment average allocated capital. Segment net income (loss) applicable to common stock is segment
net income (loss) less allocated preferred stock dividends. (2) Efficiency ratio is segment noninterest expense divided by segment total revenue (net interest income and noninterest income). (3) Digital and mobile active customers is the number of consumer and small business customers who have logged on via a digital or mobile device, respectively, in the prior 90 days. Digital active
customers includes both online and mobile customers. (4) Deposit spread is (i) the internal funds transfer pricing credit on segment deposits minus interest paid to customers for segment deposits, divided by (ii) average segment deposits. (5) Debit card purchase volume and transactions reflect combined activity for both consumer and business debit card purchases. (6) Excludes residential mortgage loans subserviced for others. (7) Excludes residential mortgage loans insured by the Federal Housing Administration (FHA) or guaranteed by the Department of Veterans Affairs (VA) and loans held for sale. (8) Beginning in second quarter 2020, customer payment deferral activities instituted in response to the COVID-19 pandemic may have delayed the recognition of delinquencies for those customers
who would have otherwise moved into past due status. (9) Excludes certain private label new account openings.
First quarter 2021 vs. first quarter 2020
Revenue was largely unchanged reflecting: • higher card fees driven by lower credit card rewards costs,
partially offset by lower late fees due to higher payment rates; and
• higher mortgage banking noninterest income driven by higher HFS origination volumes and higher margins in our retail production channel, partially offset by lower servicing income due to lower servicing fees on lower balances of loans serviced for others and lower income from MSR valuation changes and related hedges;
partially offset by: • lower net interest income reflecting the lower interest rate
environment and lower loan balances as paydowns exceeded originations;
• lower deposit-related fees driven by higher average consumer deposit account balances due to the economic slowdown associated with the COVID-19 pandemic, as well as fee waivers and reversals as part of our actions to support customers during the COVID-19 pandemic; and
• lower other income driven by lower gains on loan sales.
Provision for credit losses decreased driven by an improving economic environment.
Noninterest expense was largely unchanged reflecting: • higher charitable donations expense due to the donation of
PPP processing fees; • higher FDIC deposit assessment expense driven by a higher
assessment rate; • higher expense allocated from enterprise functions,
reflecting risk management and technology support; and • higher personnel expense driven by higher revenue-related
compensation in Home Lending, partially offset by lower branch staffing expense related to efficiency initiatives in Consumer and Small Business Banking;
offset by: • lower operating losses due to lower expense for litigation
and customer remediation accruals; and • lower advertising and promotion expense.
Wells Fargo & Company 13
Earnings Performance (continued)
Table 5b: Consumer Banking and Lending – Balance Sheet Quarter ended March 31,
(in millions) 2021 2020 $ Change % Change
Selected Balance Sheet Data (average)
Loans by Line of Business:
Home Lending $ 243,036 276,827 (33,791) (12)%
Auto 49,518 49,493 25 —
Credit Card 35,205 39,756 (4,551) (11)
Small Business 20,137 9,715 10,422 107
Personal Lending 5,185 6,771 (1,586) (23)
Total loans $ 353,081 382,562 (29,481) (8)
Total deposits 789,439 652,706 136,733 21
Allocated capital 48,000 48,000 — —
Selected Balance Sheet Data (period-end)
Loans by Line of Business:
Home Lending $ 230,478 275,395 (44,917) (16)
Auto 50,007 49,779 228 —
Credit Card 34,246 38,582 (4,336) (11)
Small Business 20,820 9,753 11,067 113
Personal Lending 4,998 6,692 (1,694) (25)
Total loans $ 340,549 380,201 (39,652) (10)
Total deposits 837,765 672,603 165,162 25
First quarter 2021 vs. first quarter 2020
Total loans (average and period-end) decreased as growth in small business loans driven by loans funded under the PPP was more than offset by paydowns exceeding originations in the home lending, credit card, and personal lending portfolios. Home lending loan balances were also impacted by actions taken in 2020 to suspend certain non-conforming residential mortgage and home equity originations.
Total deposits (average and period-end) increased driven by government stimulus programs and lower consumer spending due to the COVID-19 pandemic.
Wells Fargo & Company 14
Commercial Banking provides financial solutions to private, family owned and certain public companies. Products and services include banking and credit products across multiple industry sectors and municipalities, secured lending and lease products, and treasury management. In March 2021, we
Table 5c: Commercial Banking – Income Statement and Selected Metrics
announced an agreement to sell our Corporate Trust Services business and expect to move the business from the Commercial Banking operating segment to Corporate in second quarter 2021. Table 5c and Table 5d provide additional information for Commercial Banking.
Quarter ended March 31, ($ in millions) 2021 2020 $ Change % Change
Income Statement
Net interest income $ 1,283 1,774 (491) (28)%
Noninterest income:
Deposit-related fees 317 302 15 5
Lending-related fees 136 128 8 6
Lease income 174 198 (24) (12)
Other 298 100 198 198
Total noninterest income 925 728 197 27
Total revenue 2,208 2,502 (294) (12)
Net charge-offs 39 170 (131) (77)
Change in the allowance for credit losses (438) 871 (1,309) NM
Provision for credit losses (399) 1,041 (1,440) NM
Noninterest expense 1,766 1,697 69
Income (loss) before income tax expense (benefit) 841 (236) 1,077 456
Income tax expense (benefit) 203 (61) 264 433
Less: Net income from noncontrolling interests 1 1 — —
Net income (loss) $ 637 (176) 813 462
Revenue by Line of Business
Middle Market Banking $ 1,159 1,455 (296) (20)
Asset-Based Lending and Leasing 898 843 55 7
Other 151 204 (53) (26)
Total revenue $ 2,208 2,502 (294) (12)
Revenue by Product
Lending and leasing $ 1,193 1,411 (218) (15)
Treasury management and payments 749 982 (233) (24)
Other 266 109 157 144
Total revenue $ 2,208 2,502 (294) (12)
Selected Metrics
Return on allocated capital 12.3 % (4.7)
Efficiency ratio 80 68
Headcount (#) (period-end) 22,657 24,036 (6)
NM – Not meaningful
First quarter 2021 vs. first quarter 2020
Revenue decreased driven by: • lower net interest income reflecting the lower interest rate
environment and lower average loan balances; and • lower lease income reflecting a reduction in the size of the
operating lease asset portfolio; partially offset by: • higher other noninterest income due to impairments on
equity securities in first quarter 2020; and • higher treasury management fees on commercial accounts,
included in deposit-related fees, driven by a lower earnings credit rate due to the lower interest rate environment.
Provision for credit losses decreased driven by an improving economic environment.
including higher technology expenses; partially offset by: • lower spending related to efficiency initiatives, including
lower personnel expense from reduced headcount; • lower professional and outside services expense reflecting
decreased project-related expense; and • lower lease expense reflecting a reduction in the size of the
operating lease asset portfolio.
Wells Fargo & Company
4
15
Earnings Performance (continued)
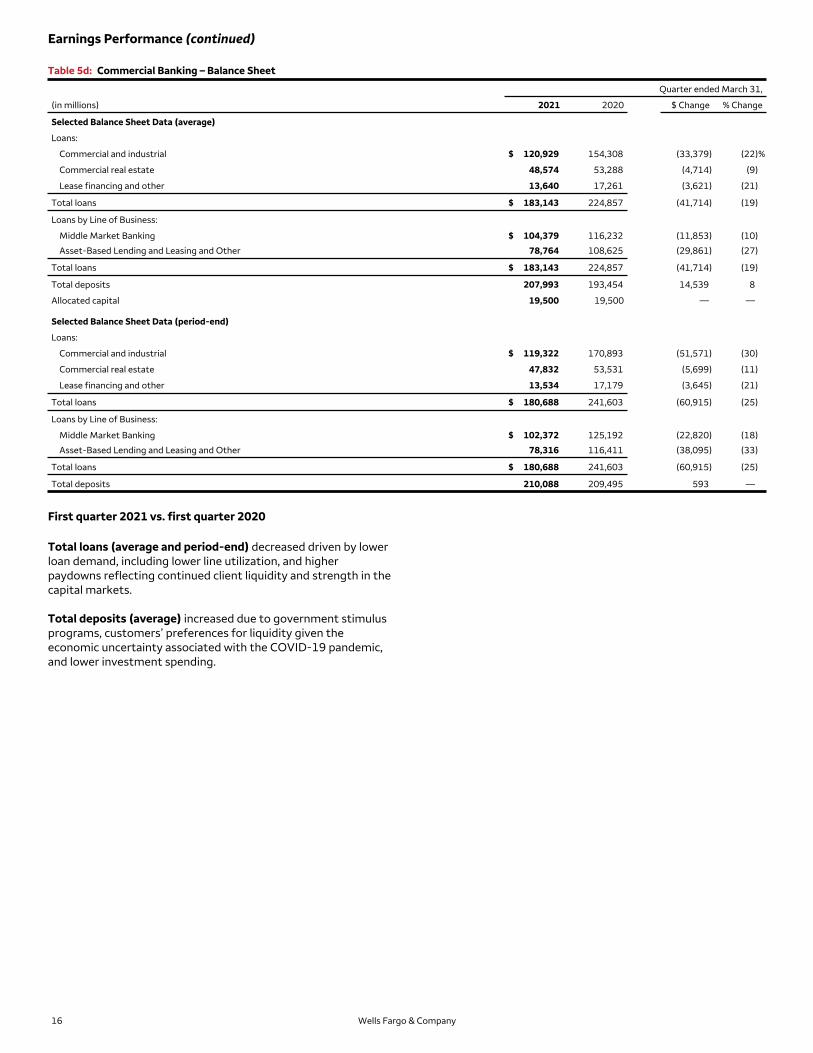
Table 5d: Commercial Banking – Balance Sheet
Quarter ended March 31,
(in millions) 2021 2020 $ Change % Change
Selected Balance Sheet Data (average)
Loans:
Commercial and industrial $ 120,929 154,308 (33,379) (22)%
Commercial real estate 48,574 53,288 (4,714) (9)
Lease financing and other 13,640 17,261 (3,621) (21)
Total loans $ 183,143 224,857 (41,714) (19)
Loans by Line of Business:
Middle Market Banking $ 104,379 116,232 (11,853) (10) Asset-Based Lending and Leasing and Other 78,764 108,625 (29,861) (27)
Total loans $ 183,143 224,857 (41,714) (19)
Total deposits 207,993 193,454 14,539 8
Allocated capital 19,500 19,500 — —
Selected Balance Sheet Data (period-end)
Loans:
Commercial and industrial $ 119,322 170,893 (51,571) (30)
Commercial real estate 47,832 53,531 (5,699) (11)
Lease financing and other 13,534 17,179 (3,645) (21)
Total loans $ 180,688 241,603 (60,915) (25)
Loans by Line of Business:
Middle Market Banking $ 102,372 125,192 (22,820) (18) Asset-Based Lending and Leasing and Other 78,316 116,411 (38,095) (33)
Total loans $ 180,688 241,603 (60,915) (25)
Total deposits 210,088 209,495 593 —
First quarter 2021 vs. first quarter 2020
Total loans (average and period-end) decreased driven by lower loan demand, including lower line utilization, and higher paydowns reflecting continued client liquidity and strength in the capital markets.
Total deposits (average) increased due to government stimulus programs, customers’ preferences for liquidity given the economic uncertainty associated with the COVID-19 pandemic, and lower investment spending.
Wells Fargo & Company 16
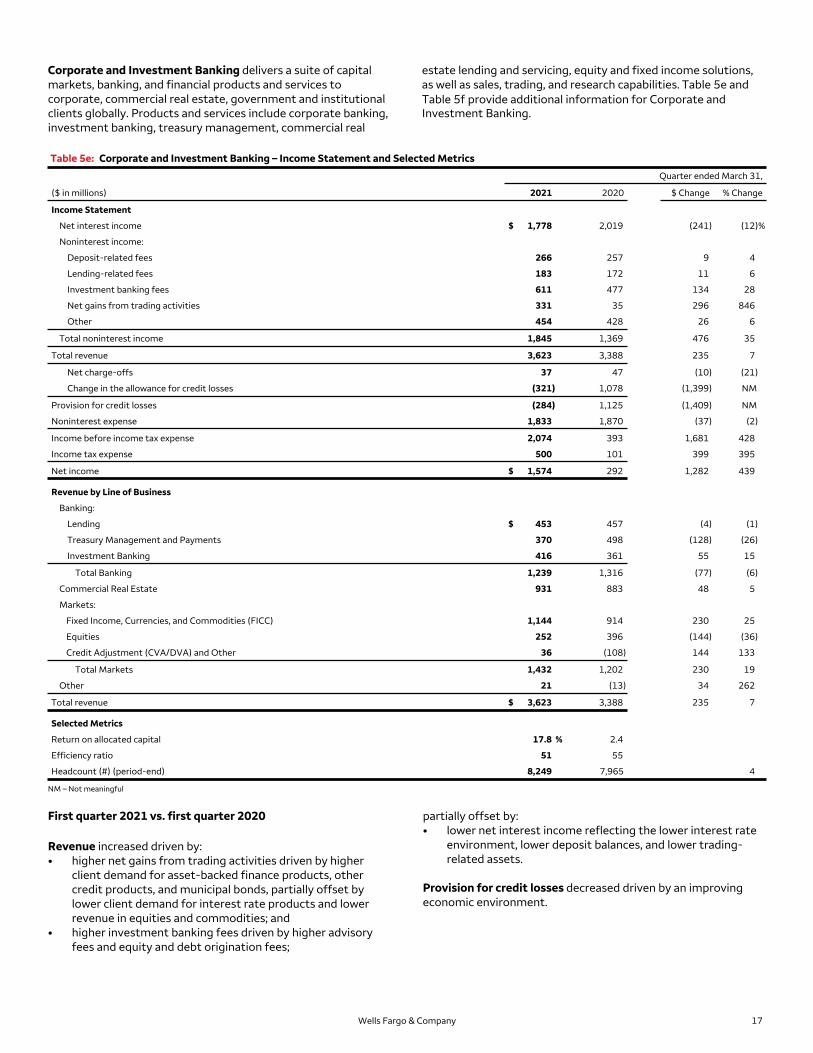
Corporate and Investment Banking delivers a suite of capital estate lending and servicing, equity and fixed income solutions, markets, banking, and financial products and services to as well as sales, trading, and research capabilities. Table 5e and corporate, commercial real estate, government and institutional Table 5f provide additional information for Corporate and clients globally. Products and services include corporate banking, Investment Banking. investment banking, treasury management, commercial real
Table 5e: Corporate and Investment Banking – Income Statement and Selected Metrics Quarter ended March 31,
($ in millions) 2021 2020 $ Change % Change
Income Statement
Net interest income $ 1,778 2,019 (241) (12)%
Noninterest income:
Deposit-related fees 266 257 9 4
Lending-related fees 183 172 11 6
Investment banking fees 611 477 134 28
Net gains from trading activities 331 35 296 846
Other 454 428 26 6
Total noninterest income 1,845 1,369 476 35
Total revenue 3,623 3,388 235 7
Net charge-offs 37 47 (10) (21)
Change in the allowance for credit losses (321) 1,078 (1,399) NM
Provision for credit losses (284) 1,125 (1,409) NM
Noninterest expense 1,833 1,870 (37) (2)
Income before income tax expense 2,074 393 1,681 428
Income tax expense 500 101 399 395
Net income $ 1,574 292 1,282 439
Revenue by Line of Business
Banking:
Lending $ 453 457 (4) (1)
Treasury Management and Payments 370 498 (128) (26)
Investment Banking 416 361 55 15
Total Banking 1,239 1,316 (77) (6)
Commercial Real Estate 931 883 48 5
Markets:
Fixed Income, Currencies, and Commodities (FICC) 1,144 914 230 25
Equities 252 396 (144) (36)
Credit Adjustment (CVA/DVA) and Other 36 (108) 144 133
Total Markets 1,432 1,202 230 19
Other 21 (13) 34 262
Total revenue $ 3,623 3,388 235 7
Selected Metrics
Return on allocated capital 17.8 % 2.4
Efficiency ratio 51 55
Headcount (#) (period-end) 8,249 7,965 4
NM – Not meaningful
First quarter 2021 vs. first quarter 2020
Revenue increased driven by: • higher net gains from trading activities driven by higher
client demand for asset-backed finance products, other credit products, and municipal bonds, partially offset by lower client demand for interest rate products and lower revenue in equities and commodities; and
• higher investment banking fees driven by higher advisory fees and equity and debt origination fees;
partially offset by: • lower net interest income reflecting the lower interest rate
environment, lower deposit balances, and lower trading-related assets.
Provision for credit losses decreased driven by an improving economic environment.
Wells Fargo & Company 17
Earnings Performance (continued)
Noninterest expense decreased driven by: partially offset by: • lower operating losses due to lower expense for litigation • higher personnel expense on revenue-related incentive
accruals and customer remediation accruals; compensation. • lower expenses allocated from enterprise functions
reflecting lower spending due to efficiency initiatives; and • a reduction in business travel and company events due to
the impact of the COVID-19 pandemic;
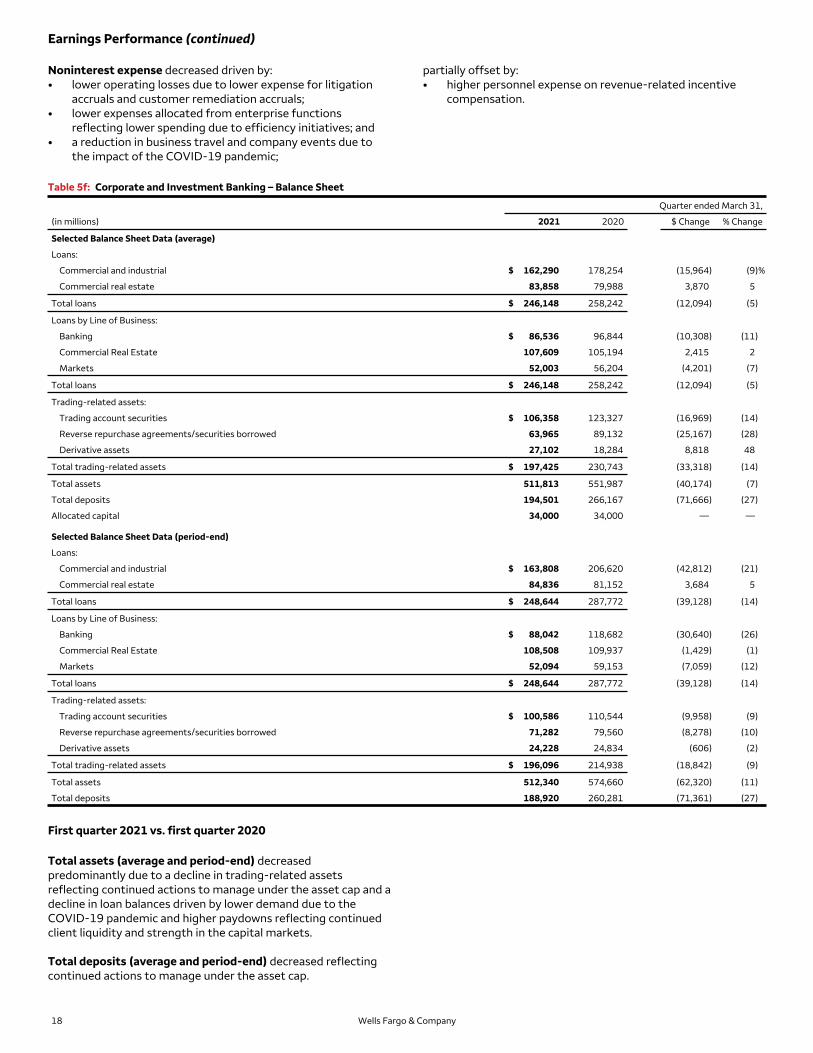
Table 5f: Corporate and Investment Banking – Balance Sheet
Quarter ended March 31,
(in millions) 2021 2020 $ Change % Change
Selected Balance Sheet Data (average)
Loans:
Commercial and industrial $ 162,290 178,254 (15,964) (9)%
Total trading-related assets $ 196,096 214,938 (18,842) (9)
Total assets 512,340 574,660 (62,320) (11)
Total deposits 188,920 260,281 (71,361) (27)
First quarter 2021 vs. first quarter 2020
Total assets (average and period-end) decreased predominantly due to a decline in trading-related assets reflecting continued actions to manage under the asset cap and a decline in loan balances driven by lower demand due to the COVID-19 pandemic and higher paydowns reflecting continued client liquidity and strength in the capital markets.
Total deposits (average and period-end) decreased reflecting continued actions to manage under the asset cap.
Wells Fargo & Company 18
Wealth and Investment Management provides personalized wealth management, investment and retirement products and services to clients across U.S.-based businesses including Wells Fargo Advisors and The Private Bank. We serve clients’ brokerage needs, and deliver financial planning, private banking, credit, and fiduciary services to high-net worth and ultra-high-net worth individuals and families. In February 2021, we
Table 5g: Wealth and Investment Management
announced an agreement to sell Wells Fargo Asset Management and moved the business from the Wealth and Investment Management operating segment to Corporate. Prior period balances have been revised to conform with the current period presentation. Table 5g and Table 5h provide additional information for Wealth and Investment Management.
Investment advisory and other asset-based fees (1) 2,306 2,073 233 11
Commissions and brokerage services fees (1) 555 593 (38) (6)
Other 26 (234) 260 111
Total noninterest income 2,887 2,432 455 19
Total revenue 3,544 3,270 274 8
Net charge-offs — 1 (1) (100)
Change in the allowance for credit losses (43) 7 (50) NM
Provision for credit losses (43) 8 (51) NM
Noninterest expense 3,028 2,657 371 14
Income before income tax expense 559 605 (46) (8)
Income tax expense 140 152 (12) (8)
Net income $ 419 453 (34) (8)
Selected Metrics
Return on allocated capital 18.9 % 20.2
Efficiency ratio 85 81
Headcount (#) (period-end) 27,993 29,266 (4)
Advisory assets ($ in billions) $ 885 661 224 34
Other brokerage assets and deposits ($ in billions) 1,177 950 227 24
Total client assets ($ in billions) $ 2,062 1,611 451 28
Annualized revenue per advisor ($ in thousands) (2) 1,058 909 149 16
Total financial and wealth advisors (#) (period-end) 13,277 14,364 (8)
Selected Balance Sheet Data (average)
Total loans $ 80,839 77,883 2,956 4
Total deposits 173,678 145,388 28,290 19
Allocated capital 8,750 8,750 — —
Selected Balance Sheet Data (period-end)
Total loans $ 81,175 78,182 2,993 4
Total deposits 175,999 162,370 13,629 8
NM – Not meaningful (1) In first quarter 2021, trust and investment management fees and asset-based brokerage fees were combined into a single line item for investment advisory and other asset-based fees, and
brokerage commissions and other brokerage services fees were combined into a single line item for commissions and brokerage services fees. Prior period balances have been revised to conform with the current period presentation.
(2) Represents annualized total revenue divided by average total financial and wealth advisors for the period.
First quarter 2021 vs. first quarter 2020
Revenue increased driven by: • higher investment advisory and other asset-based fees
driven by higher market valuations on WIM advisory assets; and
• higher deferred compensation plan investment results included in other noninterest income (largely offset by personnel expense);
partially offset by: • lower net interest income reflecting the lower interest rate
environment, partially offset by higher average deposit balances.
Provision for credit losses decreased driven by an improving economic environment.
Noninterest expense increased due to higher personnel expense driven by higher revenue-related compensation and higher deferred compensation expense (largely offset by net gains from equity securities).
Total deposits (average and period-end) increased primarily due to growth in brokerage clients’ cash balances.
Wells Fargo & Company 19
Earnings Performance (continued)
WIM Advisory Assets In addition to transactional accounts, WIM offers advisory account relationships to brokerage customers. Fees from advisory accounts are based on a percentage of the market value of the assets as of the beginning of the quarter, which vary across the account types based on the distinct services provided, and are affected by investment performance as well as asset inflows and outflows. Advisory accounts include assets that are financial advisor-directed and separately managed by third-party managers, as well as certain client-directed brokerage assets where we earn a fee for advisory and other services, but do not have investment discretion.
Table 5h: WIM Advisory Assets
WIM also manages personal trust and other assets for high net worth clients, with fee income earned based on a percentage of the market value of these assets. Table 5h presents advisory assets activity by WIM line of business for first quarter 2021 and 2020. Management believes that advisory assets is a useful metric because it allows management, investors, and others to assess how changes in asset amounts may impact the generation of certain asset-based fees.
For first quarter 2021 and 2020, the average fee rate by account type ranged from 50 to 120 basis points.
Quarter ended
Balance, beginning Balance, end of (in billions) of period Inflows (1) Outflows (2) Market impact (3) period
Separate accounts (6) 160.1 6.8 (8.5) (24.2) 134.2
Mutual fund advisory (7) 83.7 3.2 (4.5) (12.9) 69.5
Total Retail Brokerage $ 589.5 30.8 (31.2) (90.3)
Total Private Wealth (8) 188.0 8.5 (11.0) (23.7) 161.8
Total WIM advisory assets $ 777.5 39.3 (42.2) (114.0)
(1) Inflows include new advisory account assets, contributions, dividends and interest. (2) Outflows include closed advisory account assets, withdrawals and client management fees. (3) Market impact reflects gains and losses on portfolio investments. (4) Investment advice and other services are provided to client, but decisions are made by the client and the fees earned are based on a percentage of the advisory account assets, not the number and
size of transactions executed by the client. (5) Professionally managed portfolios with fees earned based on respective strategies and as a percentage of certain client assets. (6) Professional advisory portfolios managed by Wells Fargo Asset Management or third-party asset managers. Fees are earned based on a percentage of certain client assets. (7) Program with portfolios constructed of load-waived, no-load and institutional share class mutual funds. Fees are earned based on a percentage of certain client assets. (8) Discretionary and non-discretionary portfolios held in personal trusts, investment agency, or custody accounts with fees earned based on a percentage of client assets.
Wells Fargo & Company
693.9
885.4
498.8
660.6
20
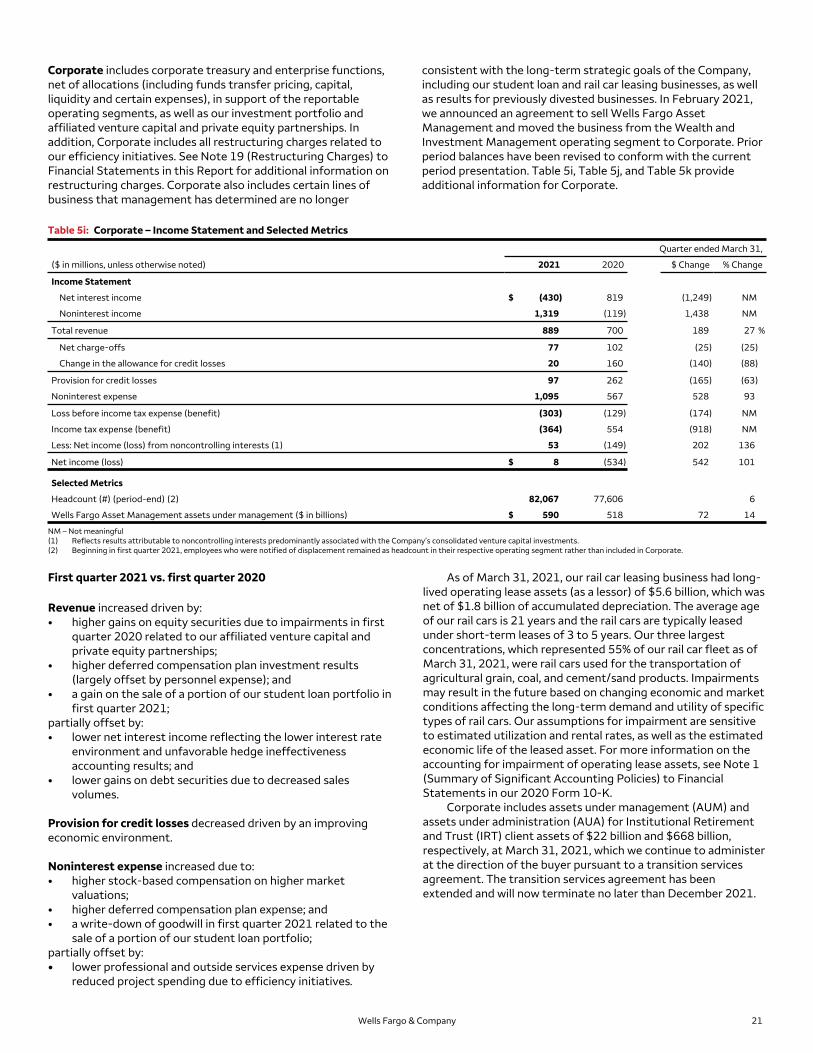
Corporate includes corporate treasury and enterprise functions, net of allocations (including funds transfer pricing, capital, liquidity and certain expenses), in support of the reportable operating segments, as well as our investment portfolio and affiliated venture capital and private equity partnerships. In addition, Corporate includes all restructuring charges related to our efficiency initiatives. See Note 19 (Restructuring Charges) to Financial Statements in this Report for additional information on restructuring charges. Corporate also includes certain lines of business that management has determined are no longer
Table 5i: Corporate – Income Statement and Selected Metrics
consistent with the long-term strategic goals of the Company, including our student loan and rail car leasing businesses, as well as results for previously divested businesses. In February 2021, we announced an agreement to sell Wells Fargo Asset Management and moved the business from the Wealth and Investment Management operating segment to Corporate. Prior period balances have been revised to conform with the current period presentation. Table 5i, Table 5j, and Table 5k provide additional information for Corporate.
($ in millions, unless otherwise noted) 2021 2020
Quarter ended March 31,
$ Change % Change
Income Statement
Net interest income
Noninterest income
$ (430)
1,319
819
(119)
(1,249)
1,438
NM
NM
Total revenue 889 700 189 27 %
Net charge-offs 77 102 (25) (25)
Change in the allowance for credit losses 20 160 (140) (88)
Provision for credit losses 97 262 (165) (63)
Noninterest expense 1,095 567 528 93
Loss before income tax expense (benefit)
Income tax expense (benefit)
Less: Net income (loss) from noncontrolling interests (1)
(303)
(364)
53
(129)
554
(149)
(174)
(918)
202
NM
NM
136
Net income (loss) $ 8 (534) 542 101
Selected Metrics
Headcount (#) (period-end) (2)
Wells Fargo Asset Management assets under management ($ in billions) $
82,067
590
77,606
518 72
6
14
NM – Not meaningful (1) Reflects results attributable to noncontrolling interests predominantly associated with the Company’s consolidated venture capital investments. (2) Beginning in first quarter 2021, employees who were notified of displacement remained as headcount in their respective operating segment rather than included in Corporate.
First quarter 2021 vs. first quarter 2020
Revenue increased driven by: • higher gains on equity securities due to impairments in first
quarter 2020 related to our affiliated venture capital and private equity partnerships;
• higher deferred compensation plan investment results (largely offset by personnel expense); and
• a gain on the sale of a portion of our student loan portfolio in first quarter 2021;
partially offset by: • lower net interest income reflecting the lower interest rate
environment and unfavorable hedge ineffectiveness accounting results; and
• lower gains on debt securities due to decreased sales volumes.
Provision for credit losses decreased driven by an improving economic environment.
Noninterest expense increased due to: • higher stock-based compensation on higher market
valuations; • higher deferred compensation plan expense; and • a write-down of goodwill in first quarter 2021 related to the
sale of a portion of our student loan portfolio; partially offset by: • lower professional and outside services expense driven by
reduced project spending due to efficiency initiatives.
As of March 31, 2021, our rail car leasing business had long-lived operating lease assets (as a lessor) of $5.6 billion, which was net of $1.8 billion of accumulated depreciation. The average age of our rail cars is 21 years and the rail cars are typically leased under short-term leases of 3 to 5 years. Our three largest concentrations, which represented 55% of our rail car fleet as of March 31, 2021, were rail cars used for the transportation of agricultural grain, coal, and cement/sand products. Impairments may result in the future based on changing economic and market conditions affecting the long-term demand and utility of specific types of rail cars. Our assumptions for impairment are sensitive to estimated utilization and rental rates, as well as the estimated economic life of the leased asset. For more information on the accounting for impairment of operating lease assets, see Note 1 (Summary of Significant Accounting Policies) to Financial Statements in our 2020 Form 10-K.
Corporate includes assets under management (AUM) and assets under administration (AUA) for Institutional Retirement and Trust (IRT) client assets of $22 billion and $668 billion, respectively, at March 31, 2021, which we continue to administer at the direction of the buyer pursuant to a transition services agreement. The transition services agreement has been extended and will now terminate no later than December 2021.
Wells Fargo & Company 21
Earnings Performance (continued)
Table 5j: Corporate – Balance Sheet Quarter ended March 31,
Total assets (average and period-end) increased due to: • an increase in cash, cash equivalents, and restricted cash
managed by corporate treasury as a result of an increase in deposits from the reportable operating segments; and
• an increase in held-to-maturity debt securities related to portfolio rebalancing to manage liquidity and interest rate risk;
partially offset by: • a decline in available-for-sale debt securities related to
portfolio rebalancing to manage liquidity and interest rate risk;
• a decline in equity securities due to the transition from equity securities to derivative instruments for economic hedges of the deferred compensation plan liabilities in second quarter 2020 and a reduction in Federal Home Loan Bank stock; and
• a decline in loans due to the sale of a portion of our student loan portfolio in first quarter 2021.
Table 5k: WFAM Assets Under Management
Total deposits (average and period-end) decreased reflecting actions taken to manage under the asset cap.
Wells Fargo Asset Management (WFAM) Assets Under Management We earn investment advisory and other asset-based fees from managing and administering assets through WFAM, which offers Wells Fargo proprietary mutual funds and manages institutional separate accounts. Generally, we earn fees from AUM where we have discretionary management authority over the investments and generate fees as a percentage of the market value of the AUM. WFAM assets under management consist of equity, alternative, balanced, fixed income, money market, and stable value, and include client assets that are managed or sub-advised on behalf of other Wells Fargo lines of business. Table 5k presents WFAM AUM activity for first quarter 2021 and 2020. Management believes that AUM is a useful metric because it allows management, investors, and others to assess how changes in asset amounts may impact the generation of certain asset-based fees.
Quarter ended
Balance, beginning Balance, end (in billions) of period Inflows (1) Outflows (2) Market impact (3) of period
March 31, 2021
Money market funds (4) $ 197.4 — (6.2) — 191.2
Other assets managed 405.6 23.8 (30.3) 0.1 399.2
Total WFAM assets under management $ 603.0 23.8 (36.5) 0.1
March 31, 2020
Money market funds (4) $ 130.6 35.6 — — 166.2
Other assets managed 378.2 26.2 (28.6) (24.2) 351.6
Total WFAM assets under management $ 508.8 61.8 (28.6) (24.2)
(1) Inflows include new managed account assets, contributions, dividends and interest. (2) Outflows include closed managed account assets, withdrawals and client management fees. (3) Market impact reflects gains and losses on portfolio investments. (4) Money Market funds activity is presented on a net inflow or net outflow basis, because the gross flows are not meaningful nor used by management as an indicator of performance.
Wells Fargo & Company
590.4
517.8
22
Balance Sheet Analysis
At March 31, 2021, our assets totaled $1.96 trillion, up See the “Capital Management” section in this Report for $4.4 billion from December 31, 2020. information on changes in our equity.
The following discussion provides additional information about the major components of our consolidated balance sheet.
Available-for-Sale and Held-to-Maturity Debt Securities
Table 6: Available-for-Sale and Held-to-Maturity Debt Securities
March 31, 2021 December 31, 2020 Weighted Weighted
average average Amortized Net expected Amortized Net expected
($ in millions) cost, net (1) unrealized gains Fair value maturity (yrs) cost, net (1) unrealized gains Fair value maturity (yrs)
Total $ 429,997 4,812 434,809 n/a 421,253 11,446 432,699 n/a
(1) Represents amortized cost of the securities, net of the allowance for credit losses of $41 million and $28 million related to available-for-sale debt securities and $89 million and $41 million related to held-to-maturity debt securities at March 31, 2021, and December 31, 2020.
(2) Available-for-sale debt securities are carried on the consolidated balance sheet at fair value. (3) Held-to-maturity debt securities are carried on the consolidated balance sheet at amortized cost, net of the allowance for credit losses.
Table 6 presents a summary of our portfolio of investments in available-for-sale (AFS) and held-to-maturity (HTM) debt securities. See the “Balance Sheet Analysis – Available-for-Sale and Held-to-Maturity Debt Securities” section in our 2020 Form 10-K for information on our investment management objectives and practices and the “Risk Management – Asset/Liability Management” section in this Report for information on liquidity and interest rate risk.
The fair value of AFS debt securities decreased from December 31, 2020, as purchases were more than offset by runoff, sales and transfers to HTM debt securities due to actions taken to reposition the overall portfolio for capital management purposes.
The net amortized cost of HTM debt securities increased from December 31, 2020, as purchases and transfers from AFS debt securities were partially offset by runoff.
At March 31, 2021, 93% of the combined AFS and HTM debt securities portfolio was rated AA- or above. Ratings are based on external ratings where available and, where not available, based on internal credit grades.
Table 7: Loan Portfolios
The total net unrealized gains on AFS and HTM debt securities decreased from December 31, 2020, driven by higher interest rates, partially offset by tighter credit spreads. See Note 3 (Available-for-Sale and Held-to-Maturity Debt Securities) to Financial Statements in this Report for additional information on AFS and HTM debt securities, including a summary of debt securities by security type.
Loan Portfolios Table 7 provides a summary of total outstanding loans by portfolio segment. Commercial loans were relatively flat compared with December 31, 2020. Consumer loans decreased from December 31, 2020, due to: • paydowns exceeding originations in residential mortgage
loans; and • seasonally lower credit card balances.
(in millions) March 31, 2021 December 31, 2020
Commercial $ 477,520 478,417
Consumer 384,052 409,220
Total loans $ 861,572 887,637
Change from prior year-end $ (26,065) (74,628)
Average loan balances and a comparative detail of average loan balances is included in Table 1 under “Earnings Performance – Net Interest Income” earlier in this Report. Additional information on total loans outstanding by portfolio segment and class of financing receivable is included in the “Risk Management – Credit Risk Management” section in this Report. Period-end balances and other loan related information are in Note 4 (Loans and Related Allowance for Credit Losses) to Financial Statements in this Report.
See the “Balance Sheet Analysis – Loan Portfolios” section in our 2020 Form 10-K for additional information regarding contractual loan maturities and the distribution of loans to changes in interest rates.
Wells Fargo & Company 23
Balance Sheet Analysis (continued)
Deposits Deposits increased from December 31, 2020, reflecting: • consumer customers’ preferences for liquidity given the
economic uncertainty associated with the COVID-19 pandemic, government stimulus programs, and lower customer spending, as well as seasonality for items such as income tax refunds;
partially offset by: • actions taken to manage under the asset cap resulting in
declines in time deposits, such as brokered certificates of
Table 8: Deposits
deposit (CDs), and interest-bearing deposits in non-U.S. offices.
Table 8 provides additional information regarding deposits. Information regarding the impact of deposits on net interest income and a comparison of average deposit balances is provided in the “Earnings Performance – Net Interest Income” section and Table 1 earlier in this Report.
In the ordinary course of business, we engage in financial transactions that are not recorded on the consolidated balance sheet, or may be recorded on the consolidated balance sheet in amounts that are different from the full contract or notional amount of the transaction. Our off-balance sheet arrangements include commitments to lend and purchase debt and equity securities, transactions with unconsolidated entities, guarantees, derivatives, and other commitments. These transactions are designed to (1) meet the financial needs of customers, (2) manage our credit, market or liquidity risks, and/or (3) diversify our funding sources.
Commitments to Lend We enter into commitments to lend to customers, which are usually at a stated interest rate, if funded, and for specific purposes and time periods. When we enter into commitments, we are exposed to credit risk. The maximum credit risk for these commitments will generally be lower than the contractual amount because a significant portion of these commitments are not funded. For additional information, see Note 4 (Loans and Related Allowance for Credit Losses) to Financial Statements in this Report.
Transactions with Unconsolidated Entities In the normal course of business, we enter into various types of on- and off-balance sheet transactions with special purpose entities (SPEs), which are corporations, trusts, limited liability companies or partnerships that are established for a limited purpose. Generally, SPEs are formed in connection with securitization transactions and are considered variable interest entities (VIEs). For additional information, see Note 8 (Securitizations and Variable Interest Entities) to Financial Statements in this Report.
Guarantees and Other Arrangements Guarantees are contracts that contingently require us to make payments to a guaranteed party based on an event or a change in an underlying asset, liability, rate or index. Guarantees are generally in the form of standby letters of credit, direct pay letters of credit, written options, recourse obligations, exchange and clearing house guarantees, indemnifications, and other types of similar arrangements. For additional information, see Note 11 (Guarantees and Other Commitments) to Financial Statements in this Report.
Commitments to Purchase Debt and Equity Securities We enter into commitments to purchase securities under resale agreements. We also may enter into commitments to purchase debt and equity securities to provide capital for customers’ funding, liquidity or other future needs. For additional information, see Note 11 (Guarantees and Other Commitments) to Financial Statements in this Report.
Derivatives We use derivatives to manage exposure to market risk, including interest rate risk, credit risk and foreign currency risk, and to assist customers with their risk management objectives. Derivatives are recorded on the consolidated balance sheet at fair value, and volume can be measured in terms of the notional amount, which is generally not exchanged, but is used only as the basis on which interest and other payments are determined. The notional amount is not recorded on the consolidated balance sheet and is not, when viewed in isolation, a meaningful measure of the risk profile of the instruments. For additional information, see Note 14 (Derivatives) to Financial Statements in this Report.
Wells Fargo & Company 25
Risk Management
Wells Fargo manages a variety of risks that can significantly affect our financial performance and our ability to meet the expectations of our customers, shareholders, regulators and other stakeholders. For additional information about how we manage risk, see the “Risk Management” section in our 2020 Form 10-K. The discussion that follows supplements our discussion of the management of certain risks contained in the “Risk Management” section in our 2020 Form 10-K.
Credit Risk Management We define credit risk as the risk of loss associated with a borrower or counterparty default (failure to meet obligations in accordance with agreed upon terms). Credit risk exists with many of our assets and exposures such as debt security holdings, certain derivatives, and loans.
The Board’s Risk Committee has primary oversight responsibility for credit risk. A Credit Subcommittee of the Risk Committee assists the Risk Committee in providing oversight of credit risk. At the management level, Credit Risk, which is part of IRM, has oversight responsibility for credit risk. Credit Risk reports to the CRO and supports periodic reports related to credit risk provided to the Board’s Risk Committee or its Credit Subcommittee.
Loan Portfolio Our loan portfolios represent the largest component of assets on our consolidated balance sheet for which we have credit risk. Table 9 presents our total loans outstanding by portfolio segment and class of financing receivable.
Table 9: Total Loans Outstanding by Portfolio Segment and Class of Financing Receivable (in millions) Mar 31, 2021 Dec 31, 2020
Commercial:
Commercial and industrial $ 319,055 318,805
Real estate mortgage 121,198 121,720
Real estate construction 21,533 21,805
Lease financing 15,734 16,087
Total commercial 477,520 478,417
Consumer:
Residential mortgage – first lien 254,363 276,674
Residential mortgage – junior lien 21,308 23,286
Credit card 34,246 36,664
Auto 49,210 48,187
Other consumer 24,925 24,409
Total consumer 384,052 409,220
Total loans $ 861,572 887,637
We manage our credit risk by establishing what we believe are sound credit policies for underwriting new business, while monitoring and reviewing the performance of our existing loan portfolios. We employ various credit risk management and monitoring activities to mitigate risks associated with multiple risk factors affecting loans we hold including:
• Loan concentrations and related credit quality; • Counterparty credit risk; • Economic and market conditions; • Legislative or regulatory mandates; • Changes in interest rates; • Merger and acquisition activities; and • Reputation risk.
Our credit risk management oversight process is governed centrally, but provides for direct management and accountability by our lines of business. Our overall credit process includes comprehensive credit policies, disciplined credit underwriting, frequent and detailed risk measurement and modeling, extensive credit training programs, and a continual loan review and audit process.
A key to our credit risk management is adherence to a well-controlled underwriting process, which we believe is appropriate for the needs of our customers as well as investors who purchase the loans or securities collateralized by the loans.
Credit Quality Overview Credit quality in first quarter 2021 reflected continued improvement in the economic environment. In particular: • Nonaccrual loans were $8.1 billion at March 31, 2021, down
from $8.7 billion at December 31, 2020. Commercial nonaccrual loans decreased to $4.2 billion at March 31, 2021, compared with $4.8 billion at December 31, 2020, and consumer nonaccrual loans declined to $3.8 billion at March 31, 2021, compared with $3.9 billion at December 31, 2020. Nonaccrual loans represented 0.93% of total loans at March 31, 2021, compared with 0.98% at December 31, 2020.
• Net loan charge-offs as a percentage of our average commercial and consumer loan portfolios were 0.13% and 0.37%, respectively, in first quarter 2021, compared with 0.25% and 0.53% in first quarter 2020.
• Loans that are not government insured/guaranteed and 90 days or more past due and still accruing were $269 million and $598 million in our commercial and consumer portfolios, respectively, at March 31, 2021, compared with $78 million and $612 million at December 31, 2020.
• Our provision for credit losses for loans was $(1.1) billion in first quarter 2021, compared with $3.8 billion for the same period a year ago.
• The ACL for loans decreased to $18.0 billion, or 2.09% of total loans, at March 31, 2021, compared with $19.7 billion, or 2.22%, at December 31, 2020.
Additional information on our loan portfolios and our credit quality trends follows.
Wells Fargo & Company 26
COVID-Related Lending Accommodations During 2020, we provided accommodations to customers in response to the COVID-19 pandemic, including payment deferrals, and other expanded assistance for mortgage, credit card, auto, small business, personal and commercial lending customers. With the exception of residential mortgage-related accommodation programs, the COVID-related lending accommodations instituted during 2020 were no longer offered as of December 31, 2020. Residential mortgage accommodation programs, which continued during first quarter 2021, offered payment deferrals for up to a total of 18 months. Table 10 summarizes the unpaid principal balance (UPB) of consumer loans that received accommodations under loan modification programs established to assist customers with the economic impact of the COVID-19 pandemic (COVID-related modifications) and that remained in a deferral period as of March 31, 2021.
Based on guidance in the CARES Act and the Interagency Statement on Loan Modifications and Reporting for Financial Institutions Working with Customers Affected by the Coronavirus (Revised) issued by federal banking regulators in April 2020 (the Interagency Statement), both of which we elected to apply, loan modifications related to COVID-19 and that meet certain other criteria are exempt from troubled debt restructuring (TDR) classification. Additionally, our election to apply the TDR relief provided by the CARES Act and the Interagency Statement impacts our regulatory capital ratios as these loan modifications
related to COVID-19 are not adjusted to a higher risk-weighting normally required with TDR classification. At March 31, 2021, substantially all residential mortgage loans that were in a deferral period, excluding those that were government insured/ guaranteed, met the criteria for TDR relief and were therefore not classified as TDRs. For additional information regarding the TDR relief provided by the CARES Act and the clarifying TDR accounting guidance from the Interagency Statement, see Note 1 (Summary of Significant Accounting Policies) to Financial Statements in our 2020 Form 10-K.
Customer payment deferral activities instituted in response to the COVID-19 pandemic could continue to delay the recognition of net charge-offs, delinquencies, and nonaccrual status for those customers who would have otherwise moved into past due or nonaccrual status. Customer loans that are not further modified upon exit from the deferral period may be placed on nonaccrual status or charged-off in accordance with our policies if customers are unable to resume making payments in accordance with the contractual terms of their agreement. As of March 31, 2021, substantially all of our consumer loans were current after exiting the deferral period. For additional information about our COVID-related modifications, see the “Risk Management – Credit Risk Management – COVID-Related Lending Accommodations” section and Note 1 (Summary of Significant Accounting Policies) to Financial Statements in our 2020 Form 10-K.
Table 10: Consumer Loan Modifications Related to COVID-19 Unpaid principal % current at
balance of modified Mar 31, 2021 loans still in deferral % of loan after exit from
($ in millions) period at Mar 31, 2021 class (1) deferral period (2)
Consumer: Residential mortgage – first lien (3) $ 9,210 4 % 97 Residential mortgage – junior lien (3) 1,274 6 93 All other consumer (4) 221 * 92
* Less than 1%. (1) Based on total loans outstanding at March 31, 2021. (2) Represents the UPB of loans that exited the deferral period and had a balance that was less than 30 days past due as of March 31, 2021. (3) For residential mortgage loans still in active COVID-related accommodation programs as of March 31, 2021, 95% of first lien and 84% of junior lien mortgage loans had a loan-to-value ratio that was
80% or lower. (4) Includes credit card, auto, and other consumer loans (including personal lines/loans). (5) Represents residential mortgage – first lien loans insured by the Federal Housing Administration (FHA) or guaranteed by the Department of Veterans Affairs (VA) that were primarily repurchased
from GNMA loan securitization pools. For additional information on GNMA loan securitization pools, see the “Risk Management – Credit Risk Management – Risks Relating to Servicing Activities” section in this Report. FHA/VA loans are entitled to payment deferrals of scheduled principal and interest up to a total of 18 months.
Significant Loan Portfolio Reviews Measuring and monitoring our credit risk is an ongoing process that tracks delinquencies, collateral values, Fair Isaac Corporation (FICO) scores, economic trends by geographic areas, loan-level risk grading for certain portfolios (typically commercial) and other indications of credit risk. Our credit risk monitoring process is designed to enable early identification of developing risk and to support our determination of an appropriate allowance for credit losses. The following discussion provides additional characteristics and analysis of our significant portfolios. See Note 4 (Loans and Related Allowance for Credit Losses) to Financial Statements in this Report for more analysis and credit metric information for each of the following portfolios.
COMMERCIAL AND INDUSTRIAL LOANS AND LEASE FINANCING For purposes of portfolio risk management, we aggregate commercial and industrial loans and lease financing according to market segmentation and standard industry codes. We generally subject commercial and industrial loans and lease
financing to individual risk assessment using our internal borrower and collateral quality ratings. Our ratings are aligned to regulatory definitions of pass and criticized categories with criticized segmented among special mention, substandard, doubtful and loss categories.
We had $18.0 billion of the commercial and industrial loan and lease financing portfolio internally classified as criticized in accordance with regulatory guidance at March 31, 2021, compared with $19.3 billion at December 31, 2020. The change was driven by decreases in the oil, gas and pipelines, technology, telecom and media, and financials except banks industries reflecting improvement in the economic environment.
The majority of our commercial and industrial loans and lease financing portfolio is secured by short-term assets, such as accounts receivable, inventory and debt securities, as well as long-lived assets, such as equipment and other business assets. Generally, the primary source of repayment for this portfolio is the operating cash flows of customers, with the collateral
securing this portfolio representing a secondary source of by paydowns. Table 11 provides our commercial and industrial repayment. loans and lease financing by industry. The industry categories are
The portfolio remained flat at March 31, 2021, compared based on the North American Industry Classification System. with December 31, 2020, as a result of limited loan draws offset
Table 11: Commercial and Industrial Loans and Lease Financing by Industry
March 31, 2021 December 31, 2020 % of % of
Nonaccrual Total total Total Nonaccrual Total total Total ($ in millions) loans portfolio loans commitments (1) loans portfolio loans commitments (1)
* Less than 1%. (1) Total commitments consist of loans outstanding plus unfunded credit commitments, excluding issued letters of credit. (2) No other single industry had total loans in excess of $3.8 billion at both March 31, 2021, and December 31, 2020.
Loans to financials except banks, our largest industry concentration, is predominantly comprised of loans to investment firms, financial vehicles, and nonbank creditors. We had $84.5 billion and $80.0 billion of loans originated by our Asset Backed Finance (ABF) and Financial Institution Group (FIG) lines of business at March 31, 2021, and December 31, 2020, respectively. These loans include: (i) loans to customers related to their subscription or capital calls, (ii) loans to nonbank lenders collateralized by commercial loans, and (iii) loans to originators or servicers of financial assets collateralized by residential real estate or other consumer loans such as credit cards, auto loans and leases, student loans and other financial assets eligible for the securitization market. These ABF and FIG loans are limited to a percentage of the value of the underlying financial assets considering underlying credit risk, asset duration, and ongoing performance. These ABF and FIG loans may also have other features to manage credit risk such as cross-collateralization, credit enhancements, and contractual re-margining of collateral supporting the loans. In addition, loans to financials except banks included collateralized loan obligations (CLOs) in loan form, all of which were rated AA or above, of $8.1 billion and $7.9 billion at March 31, 2021, and December 31, 2020, respectively. We had a prime brokerage relationship with Archegos Capital Management, which was closed out as of March 31, 2021. We did not experience losses related to closing out our exposure.
Oil, gas and pipelines loans included $6.8 billion and $7.5 billion of senior secured loans outstanding at March 31, 2021, and December 31, 2020, respectively. Oil, gas and
pipelines nonaccrual loans decreased at March 31, 2021, compared with December 31, 2020, driven by loan payoffs.
We continue to perform escalated credit monitoring for certain industries that we consider to be directly and most adversely affected by the COVID-19 pandemic.
Our commercial and industrial loans and lease financing portfolio also includes non-U.S. loans of $70.1 billion and $63.8 billion at March 31, 2021, and December 31, 2020, respectively. Significant industry concentrations of non-U.S. loans at March 31, 2021, and December 31, 2020, respectively, included: • $42.5 billion and $36.2 billion in the financials except banks
category; • $13.0 billion and $12.8 billion in the banks category; and • $1.7 billion and $1.6 billion in the oil, gas and pipelines
category.
COMMERCIAL REAL ESTATE (CRE) We generally subject CRE loans to individual risk assessment using our internal borrower and collateral quality ratings. Our ratings are aligned to regulatory definitions of pass and criticized categories with criticized segmented among special mention, substandard, doubtful and loss categories. We had $12.0 billion of CRE mortgage loans classified as criticized at both March 31, 2021, and December 31, 2020, and $1.9 billion of CRE construction loans classified as criticized at March 31, 2021, compared with $1.6 billion at December 31, 2020. The increase in criticized CRE construction loans was driven by the apartment, institutional, and shopping
Wells Fargo & Company 28
center property types and reflected the economic impact of the COVID-19 pandemic. Due to the significant uncertainty related to the duration and severity of the economic impact of the COVID-19 pandemic, the credit quality of certain property types within our CRE loan portfolio, such as retail, hotel/motel, office buildings, and shopping centers, could continue to be adversely affected.
The total CRE loan portfolio decreased $794 million from December 31, 2020, driven by a decrease in CRE mortgage loans predominantly related to the office, retail (excluding shopping
Table 12: CRE Loans by State and Property Type
center), and shopping center property types. The CRE loan portfolio included $8.7 billion of non-U.S. CRE loans at March 31, 2021. The portfolio is diversified both geographically and by property type. The largest geographic concentrations of CRE loans are in California, New York, Florida and Texas, which combined represented 48% of the total CRE portfolio. The largest property type concentrations are office buildings at 26% and apartments at 20% of the portfolio.
Table 12 summarizes CRE loans by state and property type with the related nonaccrual totals at March 31, 2021.
March 31, 2021
Real estate mortgage Real estate construction Total % of
Nonaccrual Total Nonaccrual Total Nonaccrual Total total ($ in millions) loans portfolio loans portfolio loans portfolio loans
By state:
California $ 238 30,892 2 4,219 240 35,111 4 %
New York 76 12,771 2 1,951 78 14,722 2
Florida 41 8,033 1 1,581 42 9,614 1
Texas 315 7,800 5 1,264 320 9,064 1
Washington 141 4,058 6 913 147 4,971 *
North Carolina 13 3,794 — 794 13 4,588 *
Georgia 48 4,129 — 365 48 4,494 *
Arizona 57 3,851 1 319 58 4,170 *
New Jersey 87 2,851 — 860 87 3,711 *
Colorado 83 3,216 — 481 83 3,697 *
Other (1) 604 39,803 38 8,786 642 48,589 6
Total $ 1,703 121,198 55 21,533 1,758 142,731 17 %
NON-U.S. LOANS Our classification of non-U.S. loans is based on whether the borrower’s primary address is outside of the United States. At March 31, 2021, non-U.S. loans totaled $79.1 billion, representing approximately 9% of our total consolidated loans outstanding, compared with $72.9 billion, or approximately 8% of our total consolidated loans outstanding, at December 31, 2020. Non-U.S. loans were approximately 4% of our total consolidated assets at both March 31, 2021, and December 31, 2020.
COUNTRY RISK EXPOSURE Our country risk monitoring process incorporates centralized monitoring of economic, political, social, legal, and transfer risks in countries where we do or plan to do business, along with frequent dialogue with our customers, counterparties and regulatory agencies. We establish exposure limits for each country through a centralized oversight process based on customer needs, and through consideration of the relevant and distinct risk of each country. We monitor exposures closely and adjust our country limits in response to changing conditions. We evaluate our individual country risk exposure based on our assessment of the borrower’s ability to repay, which gives consideration for allowable transfers of risk, such as guarantees and collateral, and may be different from the reporting based on the borrower’s primary address.
Table 13: Select Country Exposures
Our largest single country exposure outside the U.S. at March 31, 2021, was the United Kingdom, which totaled $36.1 billion, or approximately 2% of our total assets, and included $8.8 billion of sovereign claims. Our United Kingdom sovereign claims arise predominantly from deposits we have placed with the Bank of England pursuant to regulatory requirements in support of our London branch.
Table 13 provides information regarding our top 20 exposures by country (excluding the U.S.), based on our assessment of risk, which gives consideration to the country of any guarantors and/or underlying collateral. With respect to Table 13: • Lending and deposits exposure includes outstanding loans,
unfunded credit commitments, and deposits with non-U.S. banks. These balances are presented prior to the deduction of allowance for credit losses or collateral received under the terms of the credit agreements, if any.
• Securities exposure represents debt and equity securities of non-U.S. issuers. Long and short positions are netted, and net short positions are reflected as negative exposure.
• Derivatives and other exposure represents foreign exchange contracts, derivative contracts, securities resale agreements, and securities lending agreements.
March 31, 2021
Lending and deposits Securities Derivatives and other Total exposure
Non- Non- Non- Non-(in millions) Sovereign sovereign Sovereign sovereign Sovereign sovereign Sovereign sovereign (1) Total
Total top 20 country exposures $ 10,137 83,787 14,424 2,889 483 3,578 25,044 90,254 115,298
(1) Total non-sovereign exposure comprised $46.8 billion exposure to financial institutions and $43.5 billion to non-financial corporations at March 31, 2021.
RESIDENTIAL MORTGAGE LOANS Our residential mortgage loan portfolio is comprised of 1-4 family first and junior lien mortgage loans. Residential mortgage – first lien loans comprised 92% of the total residential mortgage loan portfolio at both March 31, 2021, and December 31, 2020.
The residential mortgage loan portfolio includes some loans with adjustable-rate features and some with an interest-only feature as part of the loan terms. Interest-only loans were approximately 3% of total loans at both March 31, 2021, and December 31, 2020. We believe our origination process appropriately addresses our adjustable-rate mortgage (ARM) reset risk across our residential mortgage loan portfolios and our ACL for loans considers this risk. We do not offer option ARM products, nor do we offer variable-rate mortgage products with
fixed payment amounts, commonly referred to within the financial services industry as negative amortizing mortgage loans.
We continue to modify residential mortgage loans to assist homeowners and other borrowers experiencing financial difficulties. For additional information on our modification programs, see the “Risk Management – Credit Risk Management – Residential Mortgage Loans” section in our 2020 Form 10-K. For additional information on customer accommodations, including loan modifications, in response to the COVID-19 pandemic, see the “Risk Management – Credit Risk Management – COVID-Related Lending Accommodations” section in this Report.
Wells Fargo & Company 30
We monitor changes in real estate values and underlying economic or market conditions for all geographic areas of our residential mortgage portfolios as part of our credit risk management process. Our underwriting and periodic review of loans and lines secured by residential real estate collateral includes original appraisals adjusted for the change in Home Price Index (HPI) or estimates from automated valuation models (AVMs) to support property values. Additional information about appraisals, AVMs, and our policy for their use can be found in Note 4 (Loans and Related Allowance for Credit Losses) to Financial Statements in this Report and the “Risk Management – Credit Risk Management – Residential Mortgage Loans” section in our 2020 Form 10-K.
Part of our credit monitoring includes tracking delinquency, current FICO scores and loan/combined loan to collateral values (LTV/CLTV) on the entire residential mortgage loan portfolio. Excluding government insured/guaranteed loans, these credit risk indicators on the residential mortgage portfolio were:
Table 14: Residential Mortgage Loans by State
• Loans 30 days or more delinquent at March 31, 2021, totaled $4.1 billion, or 1% of total mortgages, compared with $4.7 billion, or 2%, at December 31, 2020. Customer payment deferral activities instituted in response to the COVID-19 pandemic could continue to delay the recognition of delinquencies;
• Loans with FICO scores lower than 640 totaled $4.9 billion, or 2% of total mortgages at March 31, 2021, compared with $5.6 billion, or 2%, at December 31, 2020; and
• Mortgages with a LTV/CLTV greater than 100% totaled $1.3 billion at March 31, 2021, or less than 1% of total mortgages, compared with $1.6 billion, or 1%, at December 31, 2020.
Information regarding credit quality indicators can be found in Note 4 (Loans and Related Allowance for Credit Losses) to Financial Statements in this Report. Residential mortgage loans by state are presented in Table 14.
March 31, 2021 Residential Residential Total % of
mortgage – mortgage – residential total ($ in millions) first lien junior lien mortgage loans
Residential mortgage loans:
California (1) $ 97,322 5,646 102,968 12 %
New York 30,132 1,185 31,317 4
New Jersey 10,980 2,104 13,084 1
Florida 10,088 1,965 12,053 1
Washington 8,219 457 8,676 1
Texas 7,217 423 7,640 1
Virginia 5,990 1,244 7,234 1
North Carolina 4,589 1,006 5,595 1
Pennsylvania 4,039 1,278 5,317 1
Other (2) 50,665 6,000 56,665 6
Government insured/guaranteed loans (3) 25,122 — 25,122 3
Total $ 254,363 21,308 275,671 32 %
(1) Our residential mortgage loans to borrowers in California are located predominantly within the larger metropolitan areas, with no single California metropolitan area consisting of more than 4% of total loans.
(2) Consists of 41 states; no state in Other had loans in excess of $5.3 billion. (3) Represents loans whose repayments are predominantly insured by the Federal Housing Administration (FHA) or guaranteed by the Department of Veterans Affairs (VA).
Residential Mortgage – First Lien Portfolio Our total residential Table 15 shows certain delinquency and loss information for mortgage – first lien portfolio decreased $22.3 billion from the residential mortgage – first lien portfolio and lists the top December 31, 2020, driven by loan paydowns as a result of the five states by outstanding balance. low interest rate environment and the transfer of $5.9 billion of first lien mortgage loans to loans held for sale (LHFS), partially offset by originations of $12.5 billion.
Table 15: Residential Mortgage – First Lien Portfolio Performance % of loans 30 days
Outstanding balance or more past due Loss (recovery) rate (annualized) quarter ended
Mar 31, Dec 31, Mar 31, Dec 31, Mar 31, Dec 31, Sep 30, Jun 30, Mar 31, ($ in millions) 2021 2020 2021 2020 2021 2020 2020 2020 2020
Washington 8,219 9,094 0.62 0.66 0.02 (0.01) 0.01 (0.01) (0.02)
Other 72,500 79,356 1.60 1.60 (0.09) 0.02 (0.01) 0.01 0.01
Total 229,241 246,434 1.30 1.34 (0.04) — — — —
Government insured/guaranteed loans 25,122 30,240
Total first mortgage portfolio $ 254,363 276,674
Residential Mortgage – Junior Lien Portfolio The residential mortgage – junior lien portfolio consists of residential mortgage lines and loans that are subordinate in rights to an existing lien on the same property. It is not unusual for these lines and loans to have draw periods, interest-only payments, balloon payments, adjustable rates and similar features. Junior lien loan products are primarily amortizing payment loans with fixed interest rates and repayment periods between five to 30 years. We continuously monitor the credit performance of our residential mortgage – junior lien portfolio for trends and factors that influence the
frequency and severity of losses, such as residential mortgage – junior lien performance when the residential mortgage – first lien loan is delinquent.
The decrease in the residential mortgage – junior lien portfolio at March 31, 2021, compared with December 31, 2020, reflected loan paydowns. Beginning in second quarter 2020, we suspended the origination of residential mortgage – junior lien loans. Table 16 shows certain delinquency and loss information for the residential mortgage – junior lien portfolio and lists the top five states by outstanding balance.
Outstanding balance % of loans 30 days
or more past due Loss (recovery) rate (annualized) quarter ended
As of March 31, 2021, with respect to loans in the residential mortgage – junior lien portfolio that had a CLTV ratio in excess of 100%: • such loans totaled 3% of the outstanding balance of the
residential mortgage – junior lien portfolio; • 2% were 30 days or more past due. Customer payment
deferral activities instituted in response to the COVID-19 pandemic could continue to delay the recognition of delinquencies; and
• the unsecured portion (the outstanding amount that was in excess of the most recent property collateral value) of the outstanding balances of these loans totaled 1% of the residential mortgage – junior lien portfolio.
CLTV represents the ratio of the total loan balance of first and junior lien mortgages (including unused line amounts for credit line products) to property collateral value. For additional information on consumer loans by LTV/CLTV, see Table 4.11 in Note 4 (Loans and Related Allowance for Credit Losses) to Financial Statements in this Report.
Wells Fargo & Company 32
Residential Mortgage – Junior Lien Line and Loan and Residential Mortgage – First Lien Line Our junior lien, as well as first lien, lines of credit portfolios generally have draw periods of 10, 15 or 20 years with variable interest rate and payment options available during the draw period of (1) interest-only or (2) 1.5% of outstanding principal balance plus accrued interest. As of March 31, 2021, lines of credit in a draw period primarily used the interest-only option.
During the draw period, the borrower has the option of converting all or a portion of the line from a variable interest rate to a fixed rate with terms including interest-only payments for a fixed period between three to seven years or a fully amortizing payment with a fixed period between five to 30 years. At the end of the draw period, a line of credit generally converts to an amortizing payment schedule with repayment terms of up to 30 years based on the balance at time of conversion. Certain lines and loans have been structured with a balloon payment, which requires full repayment of the outstanding balance at the end of the term period. The conversion of lines or loans to fully amortizing or balloon payoff may result in a significant payment
increase, which can affect some borrowers’ ability to repay the outstanding balance.
The lines that enter their amortization period may experience higher delinquencies and higher loss rates than the ones in their draw or term period. We have considered this increased risk in our ACL for loans estimate.
In anticipation of our borrowers reaching the end of their contractual commitment, we have created a program to inform, educate and help these borrowers transition from interest-only to fully-amortizing payments or full repayment. We monitor the performance of the borrowers moving through the program in an effort to refine our ongoing program strategy.
Table 17 reflects the outstanding balance of our portfolio of residential mortgage – junior liens, including lines and loans, and residential mortgage – first lien lines segregated into scheduled end of draw or end-of-term periods and products that are currently amortizing, or in balloon repayment status. The unfunded credit commitments for residential mortgage – junior and first lien lines totaled $51.9 billion at March 31, 2021.
Table 17: Residential Mortgage – Junior Lien Line and Loan and Residential Mortgage – First Lien Line Portfolios Payment Schedule
Scheduled end of draw/term
Outstanding balance 2026 and Remainder of
($ in millions) March 31, 2021 2021 2022 2023 2024 2025 thereafter (1) Amortizing (2)
Total $ 29,709 764 3,757 2,644 2,086 3,248 9,180 8,030
% of portfolios 100 % 3 13 9 7 11 31
(1) Substantially all lines and loans are scheduled to convert to amortizing loans by the end of 2030, with annual scheduled amounts through 2030 ranging from $1.0 billion to $3.5 billion and averaging $1.8 billion per year.
(2) Includes $69 million of end-of-term balloon payments which were past due.
At March 31, 2021, $344 million, or 2%, of lines in their draw period were 30 days or more past due, compared with $351 million, or 5%, of amortizing lines of credit. Customer payment deferral activities instituted in response to the COVID-19 pandemic could continue to delay the recognition of delinquencies. On a monthly basis, we monitor the payment characteristics of borrowers in our residential mortgage – first and junior lien lines of credit portfolios. In March 2021, excluding borrowers with COVID-related loan modification payment deferrals: • Approximately 42% of these borrowers paid only the
minimum amount due and approximately 53% paid more than the minimum amount due. The rest were either delinquent or paid less than the minimum amount due.
• For the borrowers with an interest-only payment feature, approximately 27% paid only the minimum amount due and approximately 69% paid more than the minimum amount due.
Table 18: Credit Card, Auto, and Other Consumer Loans March 31, 2021 December 31, 2020
% of % of Outstanding total Outstanding total
($ in millions) balance loans balance loans
Credit card $ 34,246 3.97% $ 36,664 4.13%
Auto 49,210 5.71 48,187 5.43
Other consumer (1) 24,925 2.89 24,409 2.75
Total $ 108,381 12.58% $ 109,260 12.31%
(1) Other consumer loans primarily include securities-based loans.
CREDIT CARD Our credit card portfolio totaled $34.2 billion at March 31, 2021, compared with $36.7 billion at December 31, 2020. The decrease in the outstanding balance at March 31, 2021, compared with December 31, 2020, was driven by seasonal paydowns.
AUTO Our auto portfolio totaled $49.2 billion at March 31, 2021, compared with $48.2 billion at December 31, 2020. The outstanding balance at March 31, 2021, compared with December 31, 2020, increased slightly as originations exceeded paydowns.
OTHER CONSUMER Other consumer loans, which include revolving credit and installment loans, totaled $24.9 billion at March 31, 2021, compared with $24.4 billion at December 31, 2020.
NONPERFORMING ASSETS (NONACCRUAL LOANS AND FORECLOSED ASSETS) For information about when we generally place loans on nonaccrual status, see Note 1 (Summary of Significant Accounting Policies) to Financial Statements in our 2020 Form 10-K. Customer payment deferral activities instituted in response to the COVID-19 pandemic could continue to delay the recognition of nonaccrual loans for those customers who would have otherwise moved into nonaccrual status. For additional
Table 19: Nonperforming Assets (Nonaccrual Loans and Foreclosed Assets)
information on customer accommodations, including loan modifications, in response to the COVID-19 pandemic, see the “Risk Management – Credit Risk Management – COVID-Related Lending Accommodations” section in this Report.
Table 19 summarizes nonperforming assets (NPAs) for each of the last four quarters.
March 31, 2021 December 31, 2020 September 30, 2020 June 30, 2020
Change in NPAs from prior quarter $ (692) $ 709 $ 378 $ 1,392
(1) Residential mortgage loans predominantly insured by the FHA or guaranteed by the VA are not placed on nonaccrual status because they are insured or guaranteed. (2) Consistent with regulatory reporting requirements, foreclosed real estate resulting from government insured/guaranteed loans are classified as nonperforming. Both principal and interest related to
these foreclosed real estate assets are collectible because the loans were predominantly insured by the FHA or guaranteed by the VA. Receivables related to the foreclosure of certain government guaranteed real estate mortgage loans are excluded from this table and included in Accounts Receivable in Other Assets. For additional information on foreclosed assets, see Note 1 (Summary of Significant Accounting Policies) to Financial Statements in our 2020 Form 10-K.
Commercial nonaccrual loans decreased $549 million from December 31, 2020, driven by a decline in commercial and industrial nonaccrual loans in the oil, gas and pipelines industry reflecting improvement in the economic environment. For additional information on commercial and industrial nonaccrual loans, see the “Risk Management – Credit Risk Management – Commercial and Industrial Loans and Lease Financing” section in this Report.
Consumer nonaccrual loans decreased $124 million from December 31, 2020, driven by a decline in residential mortgage nonaccrual loans.
Wells Fargo & Company 34
Table 20 provides an analysis of the changes in nonaccrual classified as nonaccrual as a result of continued performance and loans. Typically, changes to nonaccrual loans period-over-period an improvement in the borrower’s financial condition and loan represent inflows for loans that are placed on nonaccrual status repayment capabilities. in accordance with our policies, offset by reductions for loans that are paid down, charged off, sold, foreclosed, or are no longer
Table 20: Analysis of Changes in Nonaccrual Loans Quarter ended
($ in millions) Mar 31,
2021 Dec 31,
2020 Sep 30,
2020 Jun 30,
2020 Mar 31,
2020
Commercial nonaccrual loans Balance, beginning of period $ 4,779 4,398 4,285 2,875 2,254
Inflows 773 1,696 1,316 2,741 1,479 Outflows:
Returned to accruing (177) (99) (166) (64) (56) Foreclosures (6) (37) — — — Charge-offs (202) (367) (382) (560) (360) Payments, sales and other (937) (812) (655) (707) (442)
Total outflows (1,322) (1,315) (1,203) (1,331) (858)
Balance, end of period 4,230 4,779 4,398 4,285 2,875
Consumer nonaccrual loans Balance, beginning of period 3,949 3,624 3,320 3,281 3,092
Inflows 454 792 696 379 749 Outflows:
Returned to accruing (152) (208) (160) (135) (254) Foreclosures (19) (5) (4) (6) (21) Charge-offs (26) (36) (36) (39) (48) Payments, sales and other (381) (218) (192) (160) (237)
Total outflows (578) (467) (392) (340) (560)
Balance, end of period 3,825 3,949 3,624 3,320 3,281
Total nonaccrual loans $ 8,055 8,728 8,022 7,605 6,156
We believe exposure to loss on nonaccrual loans is mitigated by the following factors at March 31, 2021: • 94% of total commercial nonaccrual loans and 99% of total
consumer nonaccrual loans are secured. Of the consumer nonaccrual loans, 94% are secured by real estate and 91% have a combined LTV (CLTV) ratio of 80% or less.
• losses of $661 million and $1.0 billion have already been recognized on 16% of commercial nonaccrual loans and 30% of consumer nonaccrual loans, respectively, in accordance with our charge-off policies. Once we write down loans to the net realizable value (fair value of collateral less estimated costs to sell), we re-evaluate each loan regularly and record additional write-downs if needed.
• 75% of commercial nonaccrual loans were current on interest and 66% of commercial nonaccrual loans were current on both principal and interest, but were on nonaccrual status because the full or timely collection of interest or principal had become uncertain.
• of the $1.1 billion of consumer loans in bankruptcy or discharged in bankruptcy, and classified as nonaccrual, $723 million were current.
• the remaining risk of loss of all nonaccrual loans has been considered in developing our allowance for loan losses.
We continue to work with our customers experiencing financial difficulty to determine if they can qualify for a loan modification. Under our proprietary modification programs, customers may be required to provide updated documentation, and some programs require completion of payment during trial periods to demonstrate sustained performance before the loan can be removed from nonaccrual status.
Table 21 provides a summary of foreclosed assets and an analysis of changes in foreclosed assets.
Table 21: Foreclosed Assets Quarter ended
($ in millions) Mar 31,
2021 Dec 31,
2020 Sep 30,
2020 Jun 30,
2020 Mar 31,
2020
Summary by loan segment
Government insured/guaranteed $ 16 18 22 31 43
Commercial 64 70 39 45 49
Consumer 60 71 95 119 160
Total foreclosed assets $ 140 159 156 195 252
Analysis of changes in foreclosed assets
Balance, beginning of period $ 159 156 195 252 303
Net change in government insured/guaranteed (1) (2) (4) (9) (12) (7)
Additions to foreclosed assets (2) 88 114 60 51 107
Reductions:
Sales (107) (104) (88) (98) (154)
Write-downs and gains (losses) on sales 2 (3) (2) 2 3
Total reductions (105) (107) (90) (96) (151)
Balance, end of period $ 140 159 156 195 252
(1) Foreclosed government insured/guaranteed loans are temporarily transferred to and held by us as servicer, until reimbursement is received from FHA or VA. (2) Includes loans moved into foreclosed assets from nonaccrual status and repossessed autos.
Foreclosed assets at March 31, 2021, included $59 million of foreclosed residential real estate, of which 28% is predominantly FHA insured or VA guaranteed and expected to have minimal or no loss content. The remaining amount of foreclosed assets has been written down to estimated net realizable value. Of the $140 million in foreclosed assets at March 31, 2021, 56% have been in the foreclosed assets portfolio for one year or less.
As part of our actions to support customers during the COVID-19 pandemic, we have temporarily suspended certain mortgage foreclosure activities, which has affected the amount of our foreclosed assets. For additional information on loans in process of foreclosure, see Note 4 (Loans and Related Allowance for Credit Losses) to Financial Statements in this Report.
Table 22: TDR Balances
TROUBLED DEBT RESTRUCTURINGS (TDRs) Table 22 provides information regarding the recorded investment of loans modified in TDRs. TDRs at March 31, 2021, decreased, compared with December 31, 2020, due to paydowns primarily in the commercial and industrial portfolio. The amount of our TDRs at March 31, 2021, would have otherwise been higher without the TDR relief provided by the CARES Act and Interagency Statement.
($ in millions) Mar 31,
2021 Dec 31,
2020 Sep 30,
2020 Jun 30,
2020 Mar 31,
2020
Commercial:
Commercial and industrial $ 1,331 1,933 2,082 1,882 1,302
Real estate mortgage 652 774 805 717 697
Real estate construction 21 15 21 20 33
Lease financing 9 9 9 10 10
Total commercial TDRs 2,013 2,731 2,917 2,629 2,042
Consumer:
Residential mortgage – first lien 9,446 9,764 9,420 7,176 7,284
In those situations where principal is forgiven, the entire amount of such forgiveness is immediately charged off. When we delay the timing on the repayment of a portion of principal (principal forbearance), we charge off the amount of forbearance if that amount is not considered fully collectible. The allowance for loan losses for TDRs was $509 million and $565 million at March 31, 2021, and December 31, 2020, respectively. As part of our actions to support customers during the COVID-19 pandemic, we have provided borrowers relief in the form of loan modifications. Under the CARES Act and the Interagency Statement, loan modifications related to the COVID-19 pandemic will not be classified as TDRs if they meet certain eligibility criteria. For additional information on the CARES Act
Table 23: Analysis of Changes in TDRs
and the Interagency Statement, see the “Risk Management – Credit Risk Management – Credit Quality Overview – COVID-Related Lending Accommodations” section in this Report.
For information on our nonaccrual policies when a restructuring is involved, see the “Risk Management – Credit Risk Management – Troubled Debt Restructurings (TDRs)” section in our 2020 Form 10-K.
Table 23 provides an analysis of the changes in TDRs. Loans modified more than once as a TDR are reported as inflows only in the period they are first modified. In addition to foreclosures, sales and transfers to held for sale, we may remove loans from TDR classification, but only if they have been refinanced or restructured at market terms and qualify as a new loan.
Quarter ended
Mar 31, Dec 31, Sep 30, Jun 30, Mar 31, ($ in millions) 2021 2020 2020 2020 2020
Commercial TDRs
Balance, beginning of period $ 2,731 2,917 2,629 2,042 1,901
Inflows (1) 155 486 866 971 452
Outflows
Charge-offs (49) (72) (77) (60) (56)
Foreclosure (5) — — — —
Payments, sales and other (2) (819) (600) (501) (324) (255)
Balance, end of period 2,013 2,731 2,917 2,629 2,042
Consumer TDRs
Balance, beginning of period 11,792 11,649 9,367 9,523 9,882
Inflows (1) 633 1,226 2,805 425 312
Outflows
Charge-offs (43) (57) (58) (46) (63)
Foreclosure (14) (5) (7) (8) (57)
Payments, sales and other (2) (1,024) (1,020) (458) (510) (544)
Net change in trial modifications (3) (9) (1) — (17) (7)
Balance, end of period 11,335 11,792 11,649 9,367 9,523
Total TDRs $ 13,348 14,523 14,566 11,996 11,565
(1) Inflows include loans that modify, even if they resolve within the period, as well as gross advances on term loans that modified in a prior period and net advances on revolving TDRs that modified in a prior period.
(2) Other outflows include normal amortization/accretion of loan basis adjustments and loans transferred to held for sale. Occasionally, loans that have been refinanced or restructured at market terms qualify as new loans, which are also included as other outflows.
(3) Net change in trial modifications includes: inflows of new TDRs entering the trial payment period, net of outflows for modifications that either (i) successfully perform and enter into a permanent modification, or (ii) did not successfully perform according to the terms of the trial period plan and are subsequently charged-off, foreclosed upon or otherwise resolved.
LOANS 90 DAYS OR MORE PAST DUE AND STILL ACCRUING Loans Table 24 reflects loans 90 days or more past due and still 90 days or more past due are still accruing if they are (1) well- accruing by class for loans not government insured/guaranteed. secured and in the process of collection or (2) residential For additional information on delinquencies by loan class, see mortgage loans or consumer loans exempt under regulatory Note 4 (Loans and Related Allowance for Credit Losses) to rules from being classified as nonaccrual until later delinquency, Financial Statements in this Report. usually 120 days past due.
Table 24: Loans 90 Days or More Past Due and Still Accruing Mar 31, Dec 31, Sep 30, Jun 30, Mar 31,
Total, not government insured/guaranteed $ 867 690 657 817
By segment and class, not government insured/guaranteed:Commercial:
Commercial and industrial $ 55 39 61 101 24
Real estate mortgage 128 38 47 44 28
Real estate construction 86 1 — — 1
Total commercial 269 78 108 145 53
Consumer:
Residential mortgage – first lien 85 135 97 93 128
Residential mortgage – junior lien 15 19 28 19 25
Credit card 394 365 297 418 528
Auto 46 65 50 54 69
Other consumer 58 28 77 88 78
Total consumer 598 612 549 672 828
Total, not government insured/guaranteed $ 867 690 657 817
(1) Represents loans whose repayments are predominantly insured by the FHA or guaranteed by the VA.
Loans 90 days or more past due and still accruing, excluding government insured/guaranteed loans, at March 31, 2021, were up from December 31, 2020, due to an increase in delinquent commercial real estate mortgage and construction loans. Customer payment deferral activities instituted in response to the COVID-19 pandemic could continue to delay the recognition of delinquencies for customers who would have otherwise moved into past due status.
Loans 90 days or more past due and still accruing whose repayments are largely insured by the FHA or guaranteed by the VA for mortgages at March 31, 2021, were down from December 31, 2020, consistent with the overall decrease in residential mortgage loans.
Wells Fargo & Company
881
38
NET CHARGE-OFFS Table 25 presents net loan charge-offs for first quarter 2021 and the previous four quarters.
Table 25: Net Loan Charge-offs Quarter ended
Mar 31, 2021 Dec 31, 2020 Sep 30, 2020 Jun 30, 2020 Mar 31, 2020 Net loan % of Net loan % of Net loan % of Net loan % of Net loan % of
(1) Quarterly net charge-offs as a percentage of average respective loans are annualized.
The decrease in commercial net loan charge-offs in first quarter 2021, compared with the prior quarter, was driven by: • lower commercial and industrial loan losses primarily in the
oil, gas and pipelines industry; and • lower commercial real estate mortgage loan losses primarily
in the shopping center property type.
The increase in consumer net loan charge-offs in first quarter 2021, compared with the prior quarter, was driven by: • credit card customers who exited deferral programs; and • additional losses in other consumer loans due to the sale of a
portion of our student loan portfolio.
The COVID-19 pandemic may continue to impact the credit quality of our loan portfolio. Although the potential impacts were considered in our allowance for credit losses for loans, payment deferral activities instituted in response to the COVID-19 pandemic could continue to delay the recognition of net loan charge-offs. For additional information on customer accommodations in response to the COVID-19 pandemic, see the “Risk Management – Credit Risk Management – COVID-Related Lending Accommodations” section in this Report.
ALLOWANCE FOR CREDIT LOSSES We maintain an allowance for credit losses (ACL) for loans, which is management’s estimate of the expected credit losses in the loan portfolio and unfunded credit commitments, at the balance sheet date, excluding loans and unfunded credit commitments carried at fair value or held for sale. Additionally, we maintain an ACL for debt securities classified as either AFS or HTM, other financial assets measured at amortized cost, net investments in leases, and other off-balance sheet credit exposures.
We apply a disciplined process and methodology to establish our ACL each quarter. The process for establishing the ACL for loans takes into consideration many factors, including historical and forecasted loss trends, loan-level credit quality ratings and loan grade-specific characteristics. The process involves subjective and complex judgments. In addition, we review a variety of credit metrics and trends. These credit metrics and trends, however, do not solely determine the amount of the allowance as we use several analytical tools. For additional information on our ACL, see the “Critical Accounting Policies – Allowance for Credit Losses” section and Note 1 (Summary of Significant Accounting Policies) to Financial Statements in our 2020 Form 10-K. For additional information on our ACL for loans, see Note 4 (Loans and Related Allowance for Credit Losses) to Financial Statements in this Report, and for additional information on our ACL for debt securities, see the “Balance Sheet Analysis – Available-For-Sale and Held-To-Maturity Debt Securities” section and Note 3 (Available-for-Sale and Held-to-Maturity Debt Securities) to Financial Statements in this Report.
Allowance for credit losses $ 18,043 19,713 10,456 10,707 11,960
Ratio of allowance for loan losses to total net loan charge-offs (2) 8.13x 5.63 3.46 3.56 3.76
Allowance for loan losses as a percentage of totalloans 1.96% 2.09 0.99 1.03 1.15
Allowance for credit losses for loans as a percentage of total loans 2.09 2.22 1.09 1.12 1.25
Allowance for credit losses for loans as a percentage of total nonaccrual loans 224 226 196 165 156
(1) Disclosure is not comparative due to our adoption of Accounting Standards Update (ASU) 2016-13, Financial Instruments - Credit Losses (Topic 326): Measurement of Credit Losses on Financial Instruments (CECL) on January 1, 2020. For additional information, see Note 1 (Summary of Significant Accounting Policies) to Financial Statements in our 2020 Form 10-K.
(2) Total net loan charge-offs are annualized for the quarter ended March 31, 2021.
The ratios for the allowance for loan losses and the ACL for loans presented in Table 26 may fluctuate from period to period due to such factors as the mix of loan types in the portfolio, borrower credit strength, and the value and marketability of collateral.
The ACL for loans decreased $1.7 billion, or 8%, from December 31, 2020, reflecting continued improvement in the economic environment. Total provision for credit losses for loans was $(1.1) billion in first quarter 2021, compared with $3.8 billion in the same period a year ago, reflecting lower net charge-offs and improvement in the economic environment. The detail of the changes in the ACL for loans by portfolio segment (including charge-offs and recoveries by loan class) is included in Note 4 (Loans and Related Allowance for Credit Losses) to Financial Statements in this Report.
We consider multiple economic scenarios to develop our estimate of the ACL for loans. The scenarios generally include a base scenario, along with an optimistic (upside) and one or more pessimistic (downside) scenarios. Our estimate of the ACL for loans at March 31, 2021, was based on a weighting of the base and a downside economic scenario of 50% and 50%, respectively, with no weighting applied to an upside scenario. The base scenario assumed economic improvements in the near term with a return to normalized levels near the end of 2022. The downside scenario assumed more sustained adverse economic impacts resulting from the COVID-19 pandemic, compared with the base scenario. The downside scenario assumed U.S. real GDP growth
rates increasing in the near term followed by a decline with a return to normalized levels after 2023 and a sustained elevation in the U.S. unemployment rate until late 2022. We considered within each scenario our expectations for the impact of customer accommodation activity, as well as the estimated impact on certain industries that we consider to be directly and most adversely affected by the COVID-19 pandemic.
In addition to quantitative estimates, we consider qualitative factors that represent risks inherent in our processes and assumptions such as economic environmental factors, modeling assumptions and performance, and other subjective factors, including industry trends and emerging risk assessments. We also considered the significant uncertainty related to the duration and severity of the economic impacts from the COVID-19 pandemic and the incremental risks to our loan portfolio.
The forecasted key economic variables used in our estimate of the ACL for loans at March 31, 2021, and December 31, 2020, are presented in Table 27.
Wells Fargo & Company
53
47
40
Table 27: Forecasted Key Economic Variables
Blend of economic scenarios (1):
2Q 4Q 2Q 2021 2021 2022
U.S. unemployment rate (2):
Dec 31, 2020 8.1 7.1 6.2
Mar 31, 2021 6.2 6.5 7.0
U.S. real GDP (3):
Dec 31, 2020 5.5 4.5 4.0
Mar 31, 2021 3.0 (1.1) (0.6)
Home price index (4):
Dec 31, 2020 1.7 (0.2) 2.5
Mar 31, 2021 9.2 1.0 (5.2)
Commercial real estate asset prices (4):
Dec 31, 2020 (9.2) (9.8) (5.3)
Mar 31, 2021 2.3 (10.0) (11.5)
(1) Represents a weighting of the forecasted economic variable inputs based on a weighting of 50% for the base and 50% for a downside scenario at both March 31, 2021, and December 31, 2020.
(2) Quarterly average. (3) Percent change from the preceding period, seasonally adjusted annualized rate. (4) Percent change year over year of national average; outlook differs by geography and
property type.
Future amounts of the ACL for loans will be based on a variety of factors, including loan balance changes, portfolio credit quality and mix changes, and changes in general economic conditions and expectations (including for unemployment and GDP), among other factors. We observed economic improvements in first quarter 2021; however, there remained significant uncertainty related to the length and severity of the economic impact of the COVID-19 pandemic and the impact of other factors that may influence the level of eventual losses and corresponding requirements for future amounts of the ACL, including the impact of economic stimulus programs and customer accommodation activity. The COVID-19 pandemic could continue to impact the recognition of credit losses in our loan portfolios and may result in increases in our ACL, particularly if the impact on the economy worsens.
We believe the ACL for loans of $18.0 billion at March 31, 2021, was appropriate to cover expected credit losses, including unfunded credit commitments, at that date. The entire allowance is available to absorb credit losses from the total loan portfolio. The ACL for loans is subject to change and reflects existing factors as of the date of determination, including economic or market conditions and ongoing internal and external examination processes. Due to the sensitivity of the ACL for loans to changes in the economic and business environment, it is possible that we will incur incremental credit losses not anticipated as of the balance sheet date. Our process for determining the ACL is discussed in the “Critical Accounting Policies – Allowance for Credit Losses” section and Note 1 (Summary of Significant Accounting Policies) to Financial Statements in our 2020 Form 10-K.
LIABILITY FOR MORTGAGE LOAN REPURCHASE LOSSES For information on our repurchase liability, see the “Risk Management – Credit Risk Management – Liability For Mortgage Loan Repurchase Losses” section in our 2020 Form 10-K.
RISKS RELATING TO SERVICING ACTIVITIES In addition to servicing loans in our portfolio, we act as servicer and/or master servicer of residential mortgage loans included in GSE-guaranteed mortgage securitizations, GNMA-guaranteed mortgage securitizations of FHA-insured/VA-guaranteed mortgages and
private label mortgage securitizations, as well as for unsecuritized loans owned by institutional investors.
As a servicer, we are required to advance certain delinquent payments of principal and interest on mortgage loans we service. The amount and timing of reimbursement of advances of delinquent payments vary by investor and the applicable servicing agreements. Due to continued customer requests for payment deferrals as a result of the COVID-19 pandemic, the amount of our servicing advances of principal and interest remained elevated. The amount of these advances may continue to increase if additional payment deferrals are provided. Payment deferrals also delay the collection of contractually specified servicing fees, resulting in lower net servicing income.
Upon transfer as servicer, we retain the option to repurchase loans from GNMA loan securitization pools, which becomes exercisable when three scheduled loan payments remain unpaid by the borrower. We generally repurchase these loans for cash and as a result, our total consolidated assets do not change. As a result of the COVID-19 pandemic, our repurchases of these loans were elevated in 2020 but returned to more normalized levels in first quarter 2021.
Repurchased loans that regain current status or are otherwise modified in accordance with applicable servicing guidelines may be included in future GNMA loan securitization pools. However, in accordance with guidance issued by GNMA, certain loans repurchased after June 30, 2020, are ineligible for inclusion in future GNMA loan securitization pools until the borrower has timely made six consecutive payments. This requirement may delay our ability to resell loans into the securitization market.
For additional information about the risks related to our servicing activities, see the “Risk Management – Credit Risk Management – Risks Relating to Servicing Activities” section in our 2020 Form 10-K. For additional information on mortgage banking activities, see Note 9 (Mortgage Banking Activities) to Financial Statements in this Report.
Asset/Liability Management Asset/liability management involves evaluating, monitoring and managing interest rate risk, market risk, liquidity and funding. For information on our oversight of asset/liability risks, see the “Risk Management – Asset/Liability Management” section in our 2020 Form 10-K.
INTEREST RATE RISK Interest rate risk is created in our role as a financial intermediary for customers based on investments such as loans and other extensions of credit and debt securities. Interest rate risk can have a significant impact to our earnings. We are subject to interest rate risk because: • assets and liabilities may mature or reprice at different
times. If assets reprice faster than liabilities and interest rates are generally rising, earnings will initially increase;
• assets and liabilities may reprice at the same time but by different amounts;
• short-term and long-term market interest rates may change by different amounts. For example, the shape of the yield curve may affect yield for new loans and funding costs differently;
• the remaining maturity for various assets or liabilities may shorten or lengthen as interest rates change. For example, if long-term mortgage interest rates increase sharply, MBS held in the debt securities portfolio may pay down at a slower rate than anticipated, which could impact portfolio income; or
• interest rates may have a direct or indirect effect on loan demand, collateral values, credit losses, mortgage origination volume, and the fair value of MSRs and other financial instruments.
Currently, our profile is such that we project net interest income will benefit from higher interest rates as our assets would reprice faster and to a greater degree than our liabilities, while in the case of lower interest rates, our assets would reprice downward and to a greater degree than our liabilities resulting in lower net interest income.
We assess interest rate risk by comparing outcomes under various net interest income simulations using many interest rate scenarios that differ in the direction of interest rate changes, the degree of change over time, the speed of change and the projected shape of the yield curve. These simulations require assumptions regarding drivers of earnings and balance sheet composition such as loan originations, prepayment speeds on loans and debt securities, deposit flows and mix, as well as pricing strategies.
Our most recent simulations, as presented in Table 28, estimate net interest income sensitivity over the next 12 months using instantaneous movements across the yield curve with both lower and higher interest rates relative to our base scenario. Steeper and flatter scenarios measure non-parallel changes in the yield curve, with long-term interest rates defined as all tenors three years and longer (e.g., 10-year U.S. Treasury securities) and short-term interest rates defined as all tenors less than three years. Where applicable, U.S. dollar interest rates are floored at 0.00%. The following describes the simulation assumptions for the scenarios presented in Table 28: • Simulations are dynamic and reflect anticipated changes to
our assets and liabilities. • Other macroeconomic variables that could be correlated
with the changes in interest rates are held constant. • Mortgage prepayment and origination assumptions vary
across scenarios and reflect only the impact of the higher or lower interest rates.
• Our base scenario deposit forecast incorporates mix changes consistent with the base interest rate trajectory. Deposit mix is modeled to be the same as in the base scenario across the alternative scenarios. In higher interest rate scenarios, customer activity that shifts balances into higher-yielding products could reduce expected net interest income.
• We hold the size of the projected debt and equity securities portfolios constant across scenarios.
Table 28: Net Interest Income Sensitivity
($ in billions) Mar 31, 2021 Dec 31, 2020
Parallel Shift:
+100 bps shift in interest rates $ 6.8 6.7
-100 bps shift in interest rates (3.0) (2.7)
Steeper yield curve:
+50 bps shift in long-term interest rates 1.2 1.3
Flatter yield curve:
+50 bps shift in short-term interest rates 2.4 2.2
-50 bps shift in long-term interest rates (1.3) (1.4)
The sensitivity results above do not capture noninterest income or expense impacts. Our interest rate sensitive noninterest income and expense are predominantly driven by mortgage banking activities, and may move in the opposite direction of our net interest income. See the “Risk Management
– Asset/Liability Management – Mortgage Banking Interest Rate and Market Risk” section in our 2020 Form 10-K for additional information. For additional information on our trading assets and liabilities, see Note 2 (Trading Activities) to Financial Statements in this Report.
We use the debt securities portfolio and exchange-traded and over-the-counter (OTC) interest rate derivatives to manage our interest rate exposures. See Note 1 (Summary of Significant Accounting Policies), Note 3 (Available-for-Sale and Held-to-Maturity Debt Securities) and Note 14 (Derivatives) to Financial Statements in our 2020 Form 10-K for additional information.
MORTGAGE BANKING INTEREST RATE AND MARKET RISK We originate, fund and service mortgage loans, which subjects us to various risks, including credit, liquidity and interest rate risks. For additional information on mortgage banking interest rate and market risk, see Note 9 (Mortgage Banking Activities) to Financial Statements in this Report and the “Risk Management – Asset/Liability Management – Mortgage Banking Interest Rate and Market Risk” section in our 2020 Form 10-K.
Hedging the various sources of interest rate risk in mortgage banking is a complex process that requires sophisticated modeling and constant monitoring. There are several potential risks to earnings from mortgage banking related to origination volumes and mix, valuation of MSRs and associated hedging results, the relationship and degree of volatility between short-term and long-term interest rates, and changes in servicing and foreclosures costs. While we attempt to balance our mortgage banking interest rate and market risks, the financial instruments we use may not perfectly correlate with the values and income being hedged.
MARKET RISK Market risk is the risk of possible economic loss from adverse changes in market risk factors such as interest rates, credit spreads, foreign exchange rates, equity and commodity prices, and the risk of possible loss due to counterparty exposure. This applies to implied volatility risk, basis risk, and market liquidity risk. It also includes price risk in the trading book, mortgage servicing rights and the hedge effectiveness risk associated with the mortgage book, and impairment on private equity investments. For information on our oversight of market risk, see the “Risk Management – Asset/ Liability Management – Market Risk” section in our 2020 Form 10-K.
MARKET RISK – TRADING ACTIVITIES We engage in trading activities to accommodate the investment and risk management activities of our customers and to execute economic hedging to manage certain balance sheet risks. These trading activities predominantly occur within our CIB businesses and to a lesser extent other businesses of the Company. Debt securities held for trading, equity securities held for trading, trading loans and trading derivatives are financial instruments used in our trading activities, and all are carried at fair value. Income earned on the financial instruments used in our trading activities include net interest income, changes in fair value and realized gains and losses. Net interest income earned from our trading activities is reflected in the interest income and interest expense components of our consolidated statement of income. Changes in fair value of the financial instruments used in our trading activities are reflected in net gains from trading activities. For additional information on the financial instruments used in our trading activities and the income from these trading activities, see Note 2 (Trading Activities) to Financial Statements in this Report.
Wells Fargo & Company 42
Value-at-risk (VaR) is a statistical risk measure used to estimate the potential loss from adverse moves in the financial markets. The Company uses VaR metrics complemented with sensitivity analysis and stress testing in measuring and monitoring market risk. For additional information on our monitoring activities, sensitivity analysis and stress testing, see the “Risk Management – Asset/Liability Management – Market Risk – Trading Activities” section in our 2020 Form 10-K.
Trading VaR is the measure used to provide insight into the market risk exhibited by the Company’s trading positions. The Company calculates Trading VaR for risk management purposes to establish line of business and Company-wide risk limits.
Table 29: Trading 1-Day 99% General VaR by Risk Category
Trading VaR is calculated based on all trading positions on our consolidated balance sheet.
Table 29 shows the Company’s Trading General VaR by risk category. The increase in average Company Trading General VaR for the quarter ended March 31, 2021, compared with the same period a year ago, was driven by a greater presence of market volatility in the 12-month historical lookback window used to calculate average Company Trading General VaR for the quarter ended March 31, 2021. Market volatility was driven by the COVID-19 pandemic, in particular, changes in interest rate curves and a significant widening of credit spreads.
Quarter ended
March 31, 2021 December 31, 2020 March 31, 2020
Period Period Period (in millions) end Average Low High end Average Low High end Average Low High
(1) The period-end VaR was less than the sum of the VaR components described above, which is due to portfolio diversification. The diversification effect arises because the risks are not perfectly correlated causing a portfolio of positions to usually be less risky than the sum of the risks of the positions alone. The diversification benefit is not meaningful for low and high metrics since they may occur on different days.
MARKET RISK – EQUITY SECURITIES We are directly and indirectly affected by changes in the equity markets. We make and manage direct investments in start-up businesses, emerging growth companies, management buy-outs, acquisitions and corporate recapitalizations. We also invest in non-affiliated funds that make similar private equity investments. For additional information, see the “Risk Management – Asset/Liability Management – Market Risk – Equity Securities” section in our 2020 Form 10-K.
We also have marketable equity securities that include investments relating to our venture capital activities. The fair value changes in these marketable equity securities are recognized in net income. For additional information, see Note 6 (Equity Securities) to Financial Statements in this Report.
Changes in equity market prices may also indirectly affect our net income by (1) the value of third-party assets under management and, hence, fee income, (2) borrowers whose ability to repay principal and/or interest may be affected by the stock market, or (3) brokerage activity, related commission income and other business activities. Each business line monitors and manages these indirect risks.
LIQUIDITY RISK AND FUNDING In the ordinary course of business, we enter into contractual obligations that may require future cash payments, including funding for customer loan requests, customer deposit maturities and withdrawals, debt service, leases for premises and equipment, and other cash commitments. The objective of effective liquidity management is to ensure that we can meet our contractual obligations and other cash commitments efficiently under both normal operating conditions and under periods of Wells Fargo-specific and/or market stress. To help achieve this objective, we monitor both the consolidated company and the Parent on a stand-alone basis to ensure that the Parent is a source of strength for its regulated,
deposit-taking banking subsidiaries. The Parent acts as a source of funding for the Company through the issuance of long-term debt and equity, and WFC Holdings, LLC, an intermediate holding company and subsidiary of the Parent (the “IHC”), provides funding support for the ongoing operational requirements of the Parent and certain of its direct and indirect subsidiaries. For additional information on liquidity risk and funding management, see the “Risk Management – Liquidity Risk and Funding” section in our 2020 Form 10-K. For additional information on the IHC, see the “Regulatory Matters – ‘Living Will’ Requirements and Related Matters” section in our 2020 Form 10-K.
Liquidity Standards We are subject to a rule, issued by the FRB, OCC and FDIC, that establishes a quantitative minimum liquidity requirement consistent with the liquidity coverage ratio (LCR) established by the Basel Committee on Banking Supervision (BCBS). The rule requires a covered banking organization, such as Wells Fargo, to hold high-quality liquid assets (HQLA), predominantly consisting of central bank deposits, government debt securities, and mortgage-backed securities of federal agencies that can be converted easily and quickly into cash, in an amount equal to or greater than its projected net cash outflows during a 30-day stress period. The LCR applies to the Company on a consolidated basis and to our insured depository institutions (IDIs) with total assets of $10 billion or more. In addition, rules issued by the FRB impose enhanced liquidity risk management standards on large BHCs, such as Wells Fargo.
The FRB, OCC and FDIC have also issued a rule implementing a stable funding requirement, known as the net stable funding ratio (NSFR), which requires a covered banking organization, such as Wells Fargo, to maintain a minimum amount of stable funding, including common equity, long-term debt and most types of deposits, in relation to its assets, derivative exposures and commitments over a one-year horizon period. The NSFR will
become effective on July 1, 2021, and applies to the Company on a consolidated basis and to our IDIs with total assets of $10 billion or more. Based on our liquidity profile at March 31, 2021, we expect to be compliant with the NSFR requirement.
Liquidity Coverage Ratio As of March 31, 2021, the consolidated Company, Wells Fargo Bank, N.A., and Wells Fargo
Table 30: Liquidity Coverage Ratio
National Bank West exceeded the minimum LCR requirement of 100%, which is calculated as HQLA divided by projected net cash outflows, as each is defined under the LCR rule. Table 30 presents the Company’s quarterly average values for the daily-calculated LCR and its components calculated pursuant to the LCR rule requirements.
Average for Quarter ended
(in millions, except ratio) Mar 31, 2021 Dec 31, 2020 Mar 31, 2020
HQLA (1):
Eligible cash $ 216,403 213,937 118,758
Eligible securities (2) 186,270 201,060 263,192
Total HQLA 402,673 414,997 381,950
Projected net cash outflows 316,116 312,697 315,980
LCR 127% 133 121 (1) Excludes excess HQLA at certain subsidiaries that is not transferable to other Wells Fargo entities. (2) Net of applicable haircuts required under the LCR rule.
Liquidity Sources We maintain liquidity in the form of cash, cash equivalents and unencumbered high-quality, liquid debt securities. These assets make up our primary sources of liquidity. Our primary sources of liquidity are substantially the same in composition as HQLA under the LCR rule; however, our primary sources of liquidity will generally exceed HQLA calculated under the LCR rule due to the applicable haircuts to HQLA and the exclusion of excess HQLA at our subsidiary IDIs required under the LCR rule. Our primary sources of liquidity are presented in Table 31, which also includes encumbered securities that are not included as available HQLA in the calculation of the LCR.
Table 31: Primary Sources of Liquidity
Our cash is predominantly on deposit with the Federal Reserve. Debt securities included as part of our primary sources of liquidity are comprised of U.S. Treasury and federal agency debt, and MBS issued by federal agencies within our debt securities portfolio. We believe these debt securities provide quick sources of liquidity through sales or by pledging to obtain financing, regardless of market conditions. Some of these debt securities are within our HTM portfolio and, as such, are not intended for sale but may be pledged to obtain financing.
March 31, 2021 December 31, 2020
(in millions) Total Encumbered Unencumbered Total Encumbered Unencumbered
Debt securities of U.S. Treasury and federal agencies 65,811 3,576 62,235 70,756 5,370 65,386
Mortgage-backed securities of federal agencies (1) 262,835 46,145 216,690 258,668 49,156 209,512
Total $ 587,040 49,721 537,319 565,800 54,526 511,274 (1) Included in encumbered securities at March 31, 2021, were securities with a fair value of $422 million, which were purchased in March 2021, but settled in April 2021.
Wells Fargo & Company 44
In addition to our primary sources of liquidity shown in Table 31, liquidity is also available through the sale or financing of other debt securities including trading and/or AFS debt securities, as well as through the sale, securitization or financing of loans, to the extent such debt securities and loans are not encumbered. As of March 31, 2021, we also maintained approximately $227.3 billion of available borrowing capacity at various Federal Home Loan Banks and the Federal Reserve Discount Window.
Table 32: Short-Term Borrowings
Deposits have historically provided a sizable source of relatively low-cost funds. Deposits were 167% and 158% of total loans at March 31, 2021, and December 31, 2020, respectively. Additional funding is provided by long-term debt and short-term borrowings. Table 32 shows selected information for short-term borrowings, which generally mature in less than 30 days. We pledge certain financial instruments that we own to collateralize repurchase agreements and other securities financings. For additional information, see the “Pledged Assets” section of Note 12 (Pledged Assets and Collateral) to Financial Statements in this Report.
Quarter ended
(in millions) Mar 31,
2021 Dec 31,
2020 Sep 30,
2020 Jun 30,
2020 Mar 31,
2020
Balance, period end
Federal funds purchased and securities sold under agreements to repurchase $ 46,871 46,362 44,055 49,659 79,036
Other short-term borrowings 12,049 12,637 11,169 10,826 13,253
Total $ 58,920 58,999 55,224 60,485 92,289
Average daily balance for period
Federal funds purchased and securities sold under agreements to repurchase $ 47,358 46,069 46,504 52,868 90,722
Other short-term borrowings 11,724 11,235 10,788 10,667 12,255
Total $ 59,082 57,304 57,292 63,535 102,977
Maximum month-end balance for period
Federal funds purchased and securities sold under agreements to repurchase (1) $ 47,050 46,879 49,148 50,397 91,121 Other short-term borrowings (2) 12,049 12,637 11,169 11,220 13,253
(1) Highest month-end balance in each of the last five quarters was in February 2021, and November, July, April and February 2020. (2) Highest month-end balance in each of the last five quarters was in March 2021, and December, September, April and March 2020.
Long-Term Debt We access domestic and international capital markets for long-term funding (generally greater than one year) through issuances of registered debt securities, private placements and asset-backed secured funding. We issue long-term debt in a variety of maturities and currencies to achieve cost-efficient funding and to maintain an appropriate maturity profile. Proceeds from securities issued were used for general corporate purposes, and, unless otherwise specified in the applicable prospectus or prospectus supplement, we expect the
Table 33: Maturity of Long-Term Debt
proceeds from securities issued in the future will be used for the same purposes. Depending on market conditions, we may purchase our outstanding debt securities from time to time in privately negotiated or open market transactions, by tender offer, or otherwise. We issued $110 million of long-term debt in first quarter 2021. Table 33 provides the aggregate carrying value of long-term debt maturities (based on contractual payment dates) for the remainder of 2021 and the following years thereafter, as of March 31, 2021.
Credit Ratings Investors in the long-term capital markets, as well as other market participants, generally will consider, among other factors, a company’s debt rating in making investment decisions. Rating agencies base their ratings on many quantitative and qualitative factors, including capital adequacy, liquidity, asset quality, business mix, the level and quality of earnings, and rating agency assumptions regarding the probability and extent of federal financial assistance or support for certain large financial institutions. Adverse changes in these factors could result in a reduction of our credit rating; however, our debt securities do not contain credit rating covenants.
There were no actions undertaken by the rating agencies with regard to our credit ratings during first quarter 2021.
Table 34: Credit Ratings as of March 31, 2021
See the “Risk Factors” section in our 2020 Form 10-K for additional information regarding our credit ratings and the potential impact a credit rating downgrade would have on our liquidity and operations, as well as Note 14 (Derivatives) to Financial Statements in this Report for information regarding additional collateral and funding obligations required for certain derivative instruments in the event our credit ratings were to fall below investment grade.
The credit ratings of the Parent and Wells Fargo Bank, N.A., as of March 31, 2021, are presented in Table 34.
DBRS Morningstar AA (low) R-1 (middle) AA R-1 (high)
FEDERAL HOME LOAN BANK MEMBERSHIP The Federal Home increase the minimum investment requirements in the event it Loan Banks (the FHLBs) are a group of cooperatives that lending has concluded that additional capital is required to allow it to institutions use to finance housing and economic development in meet its own regulatory capital requirements. Any increase in the local communities. We are a member of the FHLBs based in minimum investment requirements outside of specified ranges Dallas, Des Moines and San Francisco. FHLB members are requires the approval of the Federal Housing Finance Agency. required to maintain a minimum investment in capital stock of Because the extent of any obligation to increase our investment the applicable FHLB. The board of directors of each FHLB can in any of the FHLBs depends entirely upon the occurrence of a
Wells Fargo & Company 46
future event, the amount of any future investment in the capital stock of the FHLBs is not determinable.
Capital Management
We have an active program for managing capital through a comprehensive process for assessing the Company’s overall capital adequacy. Our objective is to maintain capital at an amount commensurate with our risk profile and risk tolerance objectives, and to meet both regulatory and market expectations. We primarily fund our capital needs through the retention of earnings net of both dividends and share repurchases, as well as through the issuance of preferred stock and long- and short-term debt. Retained earnings at March 31, 2021, increased $3.9 billion from December 31, 2020, predominantly as a result of $4.7 billion of Wells Fargo net income, partially offset by $755 million of common and preferred stock dividends. During first quarter 2021, we issued $724 million of common stock, substantially all of which was issued in connection with employee compensation and benefits, excluding conversions of preferred shares. During first quarter 2021, we repurchased 17 million shares of common stock at a cost of $596 million. For additional information about capital planning, including the FRB’s recent announcement on capital distributions, see the “Capital Planning and Stress Testing” section below.
In first quarter 2021, we issued $4.6 billion of preferred stock and redeemed $4.5 billion of preferred stock. For additional information, see Note 16 (Preferred Stock) to Financial Statements in this Report.
Regulatory Capital Requirements The Company and each of our IDIs are subject to various regulatory capital adequacy requirements administered by the FRB and the OCC. Risk-based capital rules establish risk-adjusted ratios relating regulatory capital to different categories of assets and off-balance sheet exposures as discussed below.
RISK-BASED CAPITAL AND RISK-WEIGHTED ASSETS The Company is subject to rules issued by federal banking regulators to implement Basel III capital requirements for U.S. banking organizations. The rules contain two frameworks for calculating capital requirements, a Standardized Approach and an Advanced Approach applicable to certain institutions, including Wells Fargo. Our capital adequacy is assessed based on the lower of our risk-based capital ratios calculated under the two approaches. The Company is required to satisfy the risk-based capital ratio requirements to avoid restrictions on capital distributions and discretionary bonus payments. Table 35 and Table 36 present the risk-based capital requirements applicable to the Company on a fully phased-in basis under the Standardized Approach and Advanced Approach, respectively, as of March 31, 2021.
Table 35: Risk-Based Capital Requirements – Standardized Approach Standardized Approach
9.00%9.00%
10.50%10.50%
12.50%12.50%
4.50%
6.00%
8.00%
2.50%
2.50%
2.50%
2.00%
2.00%
2.00%
Minimum requirement Stress capital bufferG-SIB capital surcharge
Common Equity Tier 1(CET1) ratio
Tier 1 capital ratio
Total capital ratio
Table 36: Risk-Based Capital Requirements – Advanced Approach Advanced Approach
9.00%9.00%
10.50%10.50%
12.50%12.50%
4.50%
6.00%
8.00%
2.50%
2.50%
2.50%
2.00%
2.00%
2.00%
Minimum requirement Capital conservation bufferG-SIB capital surcharge
Common Equity Tier 1(CET1) ratio
Tier 1 capital ratio
Total capital ratio
In addition to the risk-based capital requirements described in Table 35 and Table 36, if the FRB determines that a period of excessive credit growth is contributing to an increase in systemic risk, a countercyclical buffer of up to 2.50% could be added to the risk-based capital ratio requirements under federal banking regulations.
The capital conservation buffer is applicable to certain institutions, including Wells Fargo, under the Advanced Approach and is intended to absorb losses during times of economic or financial stress.
The stress capital buffer is calculated based on the decrease in a BHC’s risk-based capital ratios under the severely adverse scenario in the FRB’s annual supervisory stress test and related Comprehensive Capital Analysis and Review (CCAR), plus four quarters of planned common stock dividends. Because the stress capital buffer is calculated annually based on data that can differ over time, our stress capital buffer, and thus our risk-based capital ratio requirements under the Standardized Approach, are subject to change in future periods. The Company’s stress capital buffer for the period October 1, 2020, through September 30, 2021, is 2.50%.
Wells Fargo & Company 47
Capital Management (continued)
As a global systemically important bank (G-SIB), we are also subject to the FRB’s rule implementing an additional capital surcharge of between 1.00-4.50% on the risk-based capital ratio requirements of G-SIBs. Under the rule, we must annually calculate our surcharge under two methods and use the higher of the two surcharges. The first method (method one) considers our size, interconnectedness, cross-jurisdictional activity, substitutability, and complexity, consistent with the methodology developed by the BCBS and the Financial Stability Board (FSB). The second method (method two) uses similar inputs, but replaces substitutability with use of short-term wholesale funding and will generally result in higher surcharges than under method one. Because the G-SIB capital surcharge is calculated annually based on data that can differ over time, the amount of the surcharge is subject to change in future years.
The Basel III capital requirements for calculating CET1 and tier 1 capital, along with risk-weighted assets (RWAs), are fully phased-in. However, the requirements for determining tier 2 and total capital are still in accordance with transition requirements and are scheduled to be fully phased-in by the end of 2021.
Under the risk-based capital rules, on-balance sheet assets and credit equivalent amounts of derivatives and off-balance sheet items are assigned to one of several broad risk categories according to the obligor, or, if relevant, the guarantor or the
Table 37: Capital Components and Ratios (Fully Phased-In)
nature of any collateral. The aggregate dollar amount in each risk category is then multiplied by the risk weight associated with that category. The resulting weighted values from each of the risk categories are aggregated for determining total RWAs.
The tables that follow provide information about our risk-based capital and related ratios as calculated under Basel III capital rules. Although we report certain capital amounts and ratios in accordance with transition requirements for bank regulatory reporting purposes, we manage our capital on a fully phased-in basis. For information about our capital requirements calculated in accordance with transition requirements, see Note 23 (Regulatory Capital Requirements and Other Restrictions) to Financial Statements in this Report.
Table 37 summarizes our CET1, tier 1 capital, total capital, RWAs and capital ratios on a fully phased-in basis at March 31, 2021, and December 31, 2020. Fully phased-in total capital amounts and ratios are considered non-GAAP financial measures that are used by management, bank regulatory agencies, investors and analysts to assess and monitor the Company’s capital position. See Table 38 for information regarding the calculation and components of our CET1, tier 1 capital, total capital and RWAs, as well as a corresponding reconciliation to GAAP financial measures for our fully phased-in total capital amounts.
March 31, 2021 December 31, 2020
(in millions, except ratios)
RequiredCapital
Ratios (1) Advanced Approach
Standardized Approach
Advanced Approach
Standardized Approach
Common Equity Tier 1 (A) $ 139,724 139,724 138,297 138,297
Tier 1 Capital (B) 159,675 159,675 158,196 158,196
Common Equity Tier 1 Capital Ratio (A)/(D) 9.00 % 12.60 11.85 * 11.94 11.59 *
Tier 1 Capital Ratio (B)/(D) 10.50 14.39 13.54 * 13.66 13.25 *
Total Capital Ratio (C)/(D) 12.50 16.91 16.75 * 16.13 * 16.46
* Denotes the binding ratio based on the lower calculation under the Advanced and Standardized Approaches. (1) Represents the minimum ratios required to avoid restrictions on capital distributions and discretionary bonus payments. The required ratios were the same under both the Standardized and
Advanced Approaches at March 31, 2021.
Wells Fargo & Company 48
Table 38 provides information regarding the calculation and composition of our risk-based capital under the Advanced and Standardized Approaches at March 31, 2021, and December 31, 2020.
Table 38: Risk-Based Capital Calculation and Components
March 31, 2021 December 31, 2020
Advanced Standardized Advanced Standardized (in millions) Approach Approach Approach Approach
Total RWAs $ 1,109,354 1,178,996 1,158,355 1,193,744
(1) Determined by applying the combined federal statutory rate and composite state income tax rates to the difference between book and tax basis of the respective goodwill and intangible assets at period end.
(2) At March 31, 2021, the impact of the CECL transition provision issued by federal banking regulators on our regulatory capital was an increase in capital of $1.3 billion, reflecting a $991 million (post-tax) increase in capital recognized upon our initial adoption of CECL, offset by 25% of the $9.2 billion increase in our ACL under CECL from January 1, 2020, through March 31, 2021.
(3) Under the Advanced Approach the allowance for credit losses that exceeds expected credit losses is eligible for inclusion in tier 2 capital, to the extent the excess allowance does not exceed 0.60% of Advanced credit RWAs, and under the Standardized Approach, the allowance for credit losses is includable in tier 2 capital up to 1.25% of Standardized credit RWAs, in each case with any excess allowance for credit losses being deducted from the respective total RWAs.
(4) RWAs calculated under the Advanced Approach utilize a risk-sensitive methodology, which relies upon the use of internal credit models based upon our experience with internal rating grades. Advanced Approach also includes an operational risk component, which reflects the risk of loss resulting from inadequate or failed internal processes, people and systems, or from external events.
(5) Includes an increase of $1.0 billion under the Standardized Approach and a decrease of $1.4 billion under the Advanced Approach related to the impact of the CECL transition provision on our excess allowance for credit losses as of March 31, 2021. See footnote (3) to this table.
Wells Fargo & Company 49
Capital Management (continued)
Table 39 presents the changes in CET1 under the Advanced Approach for the three months ended March 31, 2021.
Table 39: Analysis of Changes in Common Equity Tier 1 (Advanced Approach)
(in millions)
Common Equity Tier 1 at December 31, 2020 $ 138,297
Net income applicable to common stock 4,363
Common stock dividends (414)
Common stock issued, repurchased, and stock compensation-related items (222)
Changes in cumulative other comprehensive income (1,444)
Goodwill 102
Certain identifiable intangible assets (other than MSRs) 20
Goodwill and other intangibles on nonmarketable equity securities (included in other assets) (335)
Applicable deferred taxes related to goodwill and other intangible assets (1) 10
CECL transition provision (2) (422)
Other (231)
Change in Common Equity Tier 1 1,427
Common Equity Tier 1 at March 31, 2021 $ 139,724 (1) Determined by applying the combined federal statutory rate and composite state income tax rates to the difference between book and tax basis of the respective goodwill and intangible assets at
period end. (2) At March 31, 2021, the impact of the CECL transition provision issued by federal banking regulators on our regulatory capital was an increase in capital of $1.3 billion, reflecting a $991 million (post-
tax) increase in capital recognized upon our initial adoption of CECL, offset by 25% of the $9.2 billion increase in our ACL under CECL from January 1, 2020, through March 31, 2021.
Table 40 presents net changes in the components of RWAs under the Advanced and Standardized Approaches for the three months ended March 31, 2021.
Table 40: Analysis of Changes in RWAs
(in millions) Advanced Approach Standardized Approach
RWAs at December 31, 2020 $ 1,158,355 1,193,744
Net change in credit risk RWAs (1) (35,255)
Net change in market risk RWAs (15,471) (15,471)
Net change in operational risk RWAs 1,725 —
Total change in RWAs (49,001) (14,748)
RWAs at March 31, 2021 $ 1,109,354 1,178,996 (1) Includes an increase of $1.0 billion under the Standardized Approach and a decrease of $1.4 billion under the Advanced Approach related to the impact of the CECL transition provision on our excess
allowance for credit losses. See Table 38 for additional information.
Wells Fargo & Company
723
50
TANGIBLE COMMON EQUITY We also evaluate our business based on certain ratios that utilize tangible common equity. Tangible common equity is a non-GAAP financial measure and represents total equity less preferred equity, noncontrolling interests, goodwill, certain identifiable intangible assets (other than MSRs) and goodwill and other intangibles on nonmarketable equity securities, net of applicable deferred taxes. The ratios are (i) tangible book value per common share, which represents tangible common equity divided by common shares outstanding; and (ii) return on average tangible common equity (ROTCE),
Table 41: Tangible Common Equity
which represents our annualized earnings as a percentage of tangible common equity. The methodology of determining tangible common equity may differ among companies. Management believes that tangible book value per common share and return on average tangible common equity, which utilize tangible common equity, are useful financial measures because they enable management, investors, and others to assess the Company’s use of equity.
Table 41 provides a reconciliation of these non-GAAP financial measures to GAAP financial measures.
Balance at period end Average balance Quarter ended Quarter ended
Mar 31, Dec 31, Mar 31, Mar 31, Dec 31, Mar 31, (in millions, except ratios) 2021 2020 2020 2021 2020 2020
Total equity $ 188,348 185,920 183,330 189,332 185,748 188,170
Common shares outstanding (C) 4,141.1 4,144.0 4,096.4 N/A N/A N/A
Net income applicable to common stock (D) N/A N/A N/A $ 4,363 2,642 42
Book value per common share (A)/(C) $ 40.34 39.76 39.71 N/A N/A N/A
Tangible book value per common share (B)/(C) 33.57 33.04 32.90 N/A N/A N/A
Return on average common stockholders’ equity (ROE) (annualized) (D)/(A) N/A N/A N/A 10.57 % 6.38 0.10
Return on average tangible common equity (ROTCE) (annualized) (D)/(B) N/A N/A N/A 12.70 7.68 0.12
(1) Determined by applying the combined federal statutory rate and composite state income tax rates to the difference between book and tax basis of the respective goodwill and intangible assets at period end.
LEVERAGE REQUIREMENTS As a BHC, we are required to maintain a supplementary leverage ratio (SLR) to avoid restrictions on capital distributions and discretionary bonus payments and maintain a minimum tier 1 leverage ratio. Table 42 presents the leverage requirements applicable to the Company as of March 31, 2021.
Table 42: Leverage Requirements Applicable to the Company
5.00%5.00%
4.00%4.00%
3.00%
4.00%
2.00%
Minimum requirementSupplementary leverage buffer
Supplementaryleverage ratio
Tier 1 leverageratio
In addition, our IDIs are required to maintain an SLR of at least 6.00% to be considered well capitalized under applicable regulatory capital adequacy rules and maintain a minimum tier 1 leverage ratio of 4.00%.
The FRB and OCC have proposed amendments to the SLR rules. For information regarding the proposed amendments to the SLR rules, see the “Capital Management – Leverage Requirements” section in our 2020 Form 10-K.
In April 2020, the FRB issued an interim final rule that temporarily allowed a BHC to exclude on-balance sheet amounts of U.S. Treasury securities and deposits at Federal Reserve Banks from the calculation of its total leverage exposure in the denominator of the SLR. This interim final rule became effective on April 1, 2020, and expired on April 1, 2021.
At March 31, 2021, the Company’s SLR was 7.91%, and each of our IDIs exceeded their applicable SLR requirements. In addition, the Company’s SLR at March 31, 2021, would have been 6.97% without relying on the FRB’s April 2020 interim final rule that temporarily allowed for the exclusion of specific on-balance sheet amounts. Table 43 presents information regarding the calculation and components of the Company’s SLR and tier 1 leverage ratio.
Wells Fargo & Company
818
51
Capital Management (continued)
Table 43: Leverage Ratios for the Company
(in millions, except ratio)
Tier 1 capital
Total average assets
Less: Goodwill and other permitted Tier 1 capitaldeductions (net of deferred tax liabilities)
Less: Other SLR exclusions
Total adjusted average assets
Plus adjustments for off-balance sheet exposures:
Derivatives (1)
Repo-style transactions (2)
Other (3)
Total off-balance sheet exposures
Total leverage exposure
Supplementary leverage ratio
(A)
(B)
(A)/(B)
$
$
Quarter ended March 31, 2021
159,675
1,938,008
28,744
272,860
1,636,404
66,520
3,650
312,815
382,985
2,019,389
7.91%
Tier 1 leverage ratio (4) 8.36%
(1) Adjustment represents derivatives and collateral netting exposures as defined for supplementary leverage ratio determination purposes.
(2) Adjustment represents counterparty credit risk for repo-style transactions where Wells Fargo & Company is the principal counterparty facing the client.
(3) Adjustment represents credit equivalent amounts of other off-balance sheet exposures not already included as derivatives and repo-style transactions exposures.
(4) The tier 1 leverage ratio consists of tier 1 capital divided by total average assets, excluding goodwill and certain other items as determined under the rule.
TOTAL LOSS ABSORBING CAPACITY As a G-SIB, we are required to have a minimum amount of equity and unsecured long-term debt for purposes of resolvability and resiliency, often referred to as Total Loss Absorbing Capacity (TLAC). U.S. G-SIBs are required to have a minimum amount of TLAC (consisting of CET1 capital and additional tier 1 capital issued directly by the top-tier or covered BHC plus eligible external long-term debt) to avoid restrictions on capital distributions and discretionary bonus payments, as well as a minimum amount of eligible unsecured long-term debt. Our minimum TLAC and eligible unsecured long-term debt requirements as of March 31, 2021, are presented in Table 44.
18.00% of RWAs (the denominator of the SLRcalculation)
+ + External TLAC leverage buffer TLAC buffer (equal to 2.50% of RWAs
(equal to 2.00% of total leverage + method one G-SIB capital surcharge exposure) + any countercyclical buffer)
Minimum amount of eligible unsecured long-term debt
Greater of: 6.00% of RWAs
+ 4.50% of total leverage exposure Method two G-SIB capital surcharge
The FRB and OCC have proposed amendments to the TLAC and eligible unsecured long-term debt requirements. For information regarding these proposed amendments, see the “Capital Management – Total Loss Absorbing Capacity” section in our 2020 Form 10-K.
As of March 31, 2021, our eligible external TLAC as a percentage of total RWAs was 25.18%, compared with a required minimum of 21.50%. Similar to the risk-based capital
requirements, our minimum TLAC requirement is assessed based on the greater of RWAs determined under the Standardized and Advanced Approaches.
OTHER REGULATORY CAPITAL AND LIQUIDITY MATTERS For information regarding the U.S. implementation of the Basel III LCR and NSFR, see the “Risk Management – Asset/ Liability Management – Liquidity Risk and Funding – Liquidity Standards” section in this Report.
Capital Planning and Stress Testing Our planned long-term capital structure is designed to meet regulatory and market expectations. We believe that our long-term targeted capital structure enables us to invest in and grow our business, satisfy our customers’ financial needs in varying environments, access markets, and maintain flexibility to return capital to our shareholders. Our long-term targeted capital structure also considers capital levels sufficient to exceed capital requirements including the G-SIB capital surcharge. Accordingly, we currently target a long-term CET1 capital ratio at or in excess of 10.00%. Our capital targets are subject to change based on various factors, including changes to the regulatory capital framework and expectations for large banks promulgated by bank regulatory agencies, changes to the regulatory requirements for our capital ratios, planned capital actions, changes in our risk profile and other factors.
The FRB capital plan rule establishes capital planning and other requirements that govern capital distributions, including dividends and share repurchases, by certain BHCs, including Wells Fargo. The FRB assesses, among other things, the overall financial condition, risk profile, and capital adequacy of BHCs when evaluating their capital plans.
We submitted our 2021 capital plan to the FRB on April 5, 2021. As part of the 2021 CCAR, the FRB also generated a supervisory stress test. The FRB is expected to review the supervisory stress test results as required under the Dodd-Frank Act using a common set of capital actions for all large BHCs and is also expected to review the Company’s proposed capital actions. The FRB has indicated it will publish its supervisory stress test results by July 1, 2021.
On March 25, 2021, the FRB announced that it was extending measures it previously announced limiting large BHCs, including Wells Fargo, from making any capital distribution (excluding any capital distribution arising from the issuance of a capital instrument eligible for inclusion in the numerator of a regulatory capital ratio), unless otherwise approved by the FRB. The FRB has generally authorized BHCs to (i) provided that the BHC does not increase the amount of its common stock dividends to be larger than the level paid in second quarter 2020, pay common stock dividends and make share repurchases that, in the aggregate, do not exceed an amount equal to the average of the BHC’s net income for the four preceding calendar quarters; (ii) make share repurchases that equal the amount of share issuances related to expensed employee compensation; and (iii) redeem and make scheduled payments on additional tier 1 and tier 2 capital instruments. The FRB has also announced that if a BHC remains above all of its minimum risk-based capital requirements in this year's supervisory stress test, these additional limitations on capital distributions will end for that BHC after June 30, 2021. However, a BHC that falls below any of its minimum risk-based capital requirements in this year's supervisory stress test will remain subject to the additional limitations on capital distributions through September 30, 2021, and if the BHC remains below the capital required by the supervisory stress test at that time, the existing stress capital
Wells Fargo & Company 52
buffer framework will impose even stricter capital distribution limitations.
Concurrently with CCAR, federal banking regulators also require large BHCs and banks to conduct their own stress tests to evaluate whether the institution has sufficient capital to continue to operate during periods of adverse economic and financial conditions.
Securities Repurchases From time to time the Board authorizes the Company to repurchase shares of our common stock. Although we announce when the Board authorizes share repurchases, we typically do not give any public notice before we repurchase our shares. Various factors determine the amount of our share repurchases, including our capital requirements, the number of shares we
Regulatory Matters
expect to issue for employee benefit plans and acquisitions, market conditions (including the trading price of our stock), and regulatory and legal considerations, including under the FRB’s capital plan rule. Due to the various factors that may impact the amount of our share repurchases and the fact that we tend to be in the market regularly to satisfy repurchase considerations under our capital plan, our share repurchases occur at various price levels. We may suspend share repurchase activity at any time.
At March 31, 2021, we had remaining Board authority to repurchase approximately 650 million shares, subject to regulatory and legal conditions. For additional information about share repurchases during first quarter 2021, see Part II, Item 2 in this Report.
The U.S. financial services industry is subject to significant regulation and regulatory oversight initiatives. This regulation and oversight may continue to impact how U.S. financial services companies conduct business and may continue to result in increased regulatory compliance costs.
For a discussion of certain consent orders applicable to the Company, see the “Overview” section in this Report. For a discussion of other significant regulations and regulatory oversight initiatives that have affected or may affect our business, see the “Regulatory Matters” and “Risk Factors” sections in our 2020 Form 10-K.
Wells Fargo & Company 53
Critical Accounting Policies
Our significant accounting policies (see Note 1 (Summary of Significant Accounting Policies) to Financial Statements in our 2020 Form 10-K) are fundamental to understanding our results of operations and financial condition because they require that we use estimates and assumptions that may affect the value of our assets or liabilities and financial results. Six of these policies are critical because they require management to make difficult, subjective and complex judgments about matters that are inherently uncertain and because it is likely that materially different amounts would be reported under different conditions or using different assumptions. These policies govern:
Current Accounting Developments
• the allowance for credit losses; • the valuation of residential MSRs; • the fair value of financial instruments; • income taxes; • liability for contingent litigation losses; and • goodwill impairment.
Management has discussed these critical accounting policies and the related estimates and judgments with the Board’s Audit Committee. For additional information on these policies, see the “Critical Accounting Policies” section and Note 1 (Summary of Significant Accounting Policies) to Financial Statements in our 2020 Form 10-K.
The following significant accounting update has been issued by the Financial Accounting Standards Board (FASB) and is applicable to us, but is not yet effective: • ASU 2018-12 – Financial Services – Insurance (Topic 944):
Targeted Improvements to the Accounting for Long-Duration Contracts and subsequent related updates
ASU 2018-12 See the “Current Accounting Developments” section in our 2020 Form 10-K for information on the effective date and our assessment of the expected financial statement impact upon adoption.
Other Accounting Developments The following Update is applicable to us but is not expected to have a material impact on our consolidated financial statements: • ASU 2020-06 – Debt – Debt with Conversion and Other
Options (Subtopic 470-20) and Derivatives and Hedging – Contracts in Entity’s Own Equity (Subtopic 815-40): Accounting for Convertible Instruments and Contracts in an Entity’s Own Equity
Wells Fargo & Company 54
Forward-Looking Statements
This document contains forward-looking statements. In addition, we may make forward-looking statements in our other documents filed or furnished with the Securities and Exchange Commission, and our management may make forward-looking statements orally to analysts, investors, representatives of the media and others. Forward-looking statements can be identified by words such as “anticipates,” “intends,” “plans,” “seeks,” “believes,” “estimates,” “expects,” “target,” “projects,” “outlook,” “forecast,” “will,” “may,” “could,” “should,” “can” and similar references to future periods. In particular, forward-looking statements include, but are not limited to, statements we make about: (i) the future operating or financial performance of the Company, including our outlook for future growth; (ii) our noninterest expense and efficiency ratio; (iii) future credit quality and performance, including our expectations regarding future loan losses, our allowance for credit losses, and the economic scenarios considered to develop the allowance; (iv) our expectations regarding net interest income and net interest margin; (v) loan growth or the reduction or mitigation of risk in our loan portfolios; (vi) future capital or liquidity levels, ratios or targets; (vii) the performance of our mortgage business and any related exposures; (viii) the expected outcome and impact of legal, regulatory and legislative developments, as well as our expectations regarding compliance therewith; (ix) future common stock dividends, common share repurchases and other uses of capital; (x) our targeted range for return on assets, return on equity, and return on tangible common equity; (xi) expectations regarding our effective income tax rate; (xii) the outcome of contingencies, such as legal proceedings; (xiii) environmental, social and governance related goals or commitments; and (xiv) the Company’s plans, objectives and strategies.
Forward-looking statements are not based on historical facts but instead represent our current expectations and assumptions regarding our business, the economy and other future conditions. Because forward-looking statements relate to the future, they are subject to inherent uncertainties, risks and changes in circumstances that are difficult to predict. Our actual results may differ materially from those contemplated by the forward-looking statements. We caution you, therefore, against relying on any of these forward-looking statements. They are neither statements of historical fact nor guarantees or assurances of future performance. While there is no assurance that any list of risks and uncertainties or risk factors is complete, important factors that could cause actual results to differ materially from those in the forward-looking statements include the following, without limitation: • current and future economic and market conditions,
including the effects of declines in housing prices, high unemployment rates, U.S. fiscal debt, budget and tax matters, geopolitical matters, and any slowdown in global economic growth;
• the effect of the COVID-19 pandemic, including on our credit quality and business operations, as well as its impact on general economic and financial market conditions;
• our capital and liquidity requirements (including under regulatory capital standards, such as the Basel III capital standards) and our ability to generate capital internally or raise capital on favorable terms;
• current, pending or future legislation or regulation that could have a negative effect on our revenue and businesses,
including rules and regulations relating to bank products and financial services;
• developments in our mortgage banking business, including the extent of the success of our mortgage loan modification efforts, the amount of mortgage loan repurchase demands that we receive, any negative effects relating to our mortgage servicing, loan modification or foreclosure practices, and the effects of regulatory or judicial requirements or guidance impacting our mortgage banking business and any changes in industry standards;
• our ability to realize any efficiency ratio or expense target as part of our expense management initiatives, including as a result of business and economic cyclicality, seasonality, changes in our business composition and operating environment, growth in our businesses and/or acquisitions, and unexpected expenses relating to, among other things, litigation and regulatory matters;
• the effect of the current interest rate environment or changes in interest rates or in the level or composition of our assets or liabilities on our net interest income, net interest margin and our mortgage originations, mortgage servicing rights and mortgage loans held for sale;
• significant turbulence or a disruption in the capital or financial markets, which could result in, among other things, reduced investor demand for mortgage loans, a reduction in the availability of funding or increased funding costs, and declines in asset values and/or recognition of impairments of securities held in our debt securities and equity securities portfolios;
• the effect of a fall in stock market prices on our investment banking business and our fee income from our brokerage and wealth management businesses;
• negative effects from the retail banking sales practices matter and from other instances where customers may have experienced financial harm, including on our legal, operational and compliance costs, our ability to engage in certain business activities or offer certain products or services, our ability to keep and attract customers, our ability to attract and retain qualified employees, and our reputation;
• resolution of regulatory matters, litigation, or other legal actions, which may result in, among other things, additional costs, fines, penalties, restrictions on our business activities, reputational harm, or other adverse consequences;
• a failure in or breach of our operational or security systems or infrastructure, or those of our third-party vendors or other service providers, including as a result of cyber attacks;
• the effect of changes in the level of checking or savings account deposits on our funding costs and net interest margin;
• fiscal and monetary policies of the Federal Reserve Board; • changes to U.S. tax guidance and regulations, as well as the
effect of discrete items on our effective income tax rate; • our ability to develop and execute effective business plans
and strategies; and • the other risk factors and uncertainties described under
“Risk Factors” in our Annual Report on Form 10-K for the year ended December 31, 2020.
In addition to the above factors, we also caution that the amount and timing of any future common stock dividends or repurchases will depend on the earnings, cash requirements and
Wells Fargo & Company 55
financial condition of the Company, market conditions, capital requirements (including under Basel capital standards), common stock issuance requirements, applicable law and regulations (including federal securities laws and federal banking regulations), and other factors deemed relevant by the Company’s Board of Directors, and may be subject to regulatory approval or conditions.
For additional information about factors that could cause actual results to differ materially from our expectations, refer to our reports filed with the Securities and Exchange Commission, including the discussion under “Risk Factors” in our Annual Report on Form 10-K for the year ended December 31, 2020, as filed with the Securities and Exchange Commission and available on its website at www.sec.gov.1
Any forward-looking statement made by us speaks only as of the date on which it is made. Factors or events that could cause our actual results to differ may emerge from time to time, and it is not possible for us to predict all of them. We undertake no obligation to publicly update any forward-looking statement, whether as a result of new information, future developments or otherwise, except as may be required by law.
Forward-looking Non-GAAP Financial Measures. From time to time management may discuss forward-looking non-GAAP financial measures, such as forward-looking estimates or targets for return on average tangible common equity. We are unable to provide a reconciliation of forward-looking non-GAAP financial measures to their most directly comparable GAAP financial measures because we are unable to provide, without unreasonable effort, a meaningful or accurate calculation or estimation of amounts that would be necessary for the reconciliation due to the complexity and inherent difficulty in forecasting and quantifying future amounts or when they may occur. Such unavailable information could be significant to future results.
1 We do not control this website. Wells Fargo has provided this link for your convenience, but does not endorse and is not responsible for the content, links, privacy policy, or security policy of this website.
An investment in the Company involves risk, including the possibility that the value of the investment could fall substantially and that dividends or other distributions on the investment could be reduced or eliminated. For a discussion of risk factors that could adversely affect our financial results and condition, and the value of, and return on, an investment in the Company, we refer you to the “Risk Factors” section in our 2020 Form 10-K.
Wells Fargo & Company 57
Controls and Procedures
Disclosure Controls and Procedures
The Company’s management evaluated the effectiveness, as of March 31, 2021, of the Company’s disclosure controls and procedures. The Company’s chief executive officer and chief financial officer participated in the evaluation. Based on this evaluation, the Company’s chief executive officer and chief financial officer concluded that the Company’s disclosure controls and procedures were effective as of March 31, 2021.
Internal Control Over Financial Reporting
Internal control over financial reporting is defined in Rule 13a-15(f) promulgated under the Securities Exchange Act of 1934 as a process designed by, or under the supervision of, the Company’s principal executive and principal financial officers and effected by the Company’s Board, management and other personnel, to provide reasonable assurance regarding the reliability of financial reporting and the preparation of financial statements for external purposes in accordance with U.S. generally accepted accounting principles (GAAP) and includes those policies and procedures that: • pertain to the maintenance of records that in reasonable detail accurately and fairly reflect the transactions and dispositions of
assets of the Company; • provide reasonable assurance that transactions are recorded as necessary to permit preparation of financial statements in
accordance with GAAP, and that receipts and expenditures of the Company are being made only in accordance with authorizations of management and directors of the Company; and
• provide reasonable assurance regarding prevention or timely detection of unauthorized acquisition, use or disposition of the Company’s assets that could have a material effect on the financial statements.
Because of its inherent limitations, internal control over financial reporting may not prevent or detect misstatements. Projections of any evaluation of effectiveness to future periods are subject to the risk that controls may become inadequate because of changes in conditions, or that the degree of compliance with the policies or procedures may deteriorate. No change occurred during first quarter 2021 that has materially affected, or is reasonably likely to materially affect, the Company’s internal control over financial reporting.
Wells Fargo & Company 58
Financial Statements
Wells Fargo & Company and Subsidiaries Consolidated Statement of Income (Unaudited)
Quarter ended March 31,
(in millions, except per share amounts) 2021 2020
Interest income Debt securities $ 2,312 3,472 Loans held for sale 331 209 Loans 7,191 10,065 Equity securities 137 206 Other interest income 65 775
Noninterest income Deposit and lending-related fees 1,616 1,797 Investment advisory and other asset-based fees (1) 2,756 2,506 Commissions and brokerage services fees (1) 636 677 Investment banking fees 568 391 Card fees 949 892 Mortgage banking 1,326 379 Net gains (losses) on trading and securities 891 (1,100) Other 523 863
Total noninterest income 9,265 6,405
Total revenue 18,063 17,717
Provision for credit losses (1,048) 4,005
Noninterest expense Personnel 9,558 8,323 Technology, telecommunications and equipment 844 798 Occupancy 770 715 Operating losses 213 464 Professional and outside services 1,388 1,606 Advertising and promotion 90 181 Restructuring charges 13 — Other 1,113 961
Total noninterest expense 13,989 13,048
Income before income tax expense 5,122 664 Income tax expense 326 159
Net income before noncontrolling interests 4,796 505 Less: Net income (loss) from noncontrolling interests 54 (148)
Wells Fargo net income $ 4,742 653
Less: Preferred stock dividends and other 379 611
Wells Fargo net income applicable to common stock $ 4,363 42 Per share information
Earnings per common share $ 1.05 0.01 Diluted earnings per common share 1.05 0.01
Average common shares outstanding 4,141.3 4,104.8 Diluted average common shares outstanding 4,171.0 4,135.3
(1) In first quarter 2021, trust and investment management fees and asset-based brokerage fees were combined into a single line item for investment advisory and other asset-based fees, and brokerage commissions and other brokerage services fees were combined into a single line item for commissions and brokerage services fees. Prior period balances have been revised to conform with the current period presentation.
The accompanying notes are an integral part of these statements.
Wells Fargo & Company 59
Wells Fargo & Company and Subsidiaries Consolidated Statement of Comprehensive Income (Unaudited)
Quarter ended March 31,
(in millions) 2021 2020
Net income before noncontrolling interests $ 4,796 505
Other comprehensive income (loss), after tax:
Net change in debt securities (1,525) (228)
Net change in derivatives and hedging activities 36 137
Defined benefit plans adjustments 35 30
Net change in foreign currency translation adjustments 11 (193)
Other comprehensive loss, after tax (1,443) (254)
Total comprehensive income before noncontrolling interests 3,353 251
Less: Other comprehensive income (loss) from noncontrolling interests 1 (1)
Less: Net income (loss) from noncontrolling interests 54 (148)
Wells Fargo comprehensive income $ 3,298 400
The accompanying notes are an integral part of these statements.
Wells Fargo & Company 60
Wells Fargo & Company and Subsidiaries Consolidated Balance Sheet
(in millions, except shares) Mar 31,
2021 Dec 31,
2020
Assets (Unaudited) Cash and due from banks $ 28,339 28,236 Interest-earning deposits with banks 258,394 236,376
Total cash, cash equivalents, and restricted cash 286,733 264,612
Federal funds sold and securities purchased under resale agreements 79,502 65,672 Debt securities:
Trading, at fair value 72,784 75,095 Available-for-sale, at fair value (includes amortized cost of $197,805 and $215,533, net of allowance for credit losses) 200,850 220,392 Held-to-maturity, at amortized cost, net of allowance for credit losses (fair value $233,959 and $212,307) 232,192 205,720
Loans held for sale (includes $23,538 and $18,806 carried at fair value) 35,434 36,384 Loans 861,572 887,637 Allowance for loan losses (16,928) (18,516)
Net loans 844,644 869,121
Mortgage servicing rights (includes $7,536 and $6,125 carried at fair value) 8,832 7,437 Premises and equipment, net 8,760 8,895 Goodwill 26,290 26,392 Derivative assets 25,429 25,846 Equity securities (includes $31,401 and $34,009 carried at fair value) 59,981 62,260 Other assets 78,112 87,337
Total liabilities and equity $ 1,959,543 1,955,163
(1) Our consolidated assets at March 31, 2021, and December 31, 2020, included the following assets of certain variable interest entities (VIEs) that can only be used to settle the liabilities of those VIEs: Debt securities, $965 million and $967 million; Loans, $5.5 billion and $10.9 billion; All other assets, $267 million and $310 million; and Total assets, $6.7 billion and $12.1 billion, respectively.
(2) Our consolidated liabilities at March 31, 2021, and December 31, 2020, include the following VIE liabilities for which the VIE creditors do not have recourse to Wells Fargo: Long-term debt, $192 million and $203 million; All other liabilities, $890 million and $900 million; and Total liabilities, $1.1 billion and $1.1 billion, respectively.
The accompanying notes are an integral part of these statements.
Wells Fargo & Company 61
Wells Fargo & Company and Subsidiaries Consolidated Statement of Changes in Equity
Wells Fargo stockholders’ equity
Preferred stock Common stock
Cumulative Additional other Unearned
paid-in Retained comprehensive Treasury ESOP Noncontrolling Total ($ and shares in millions) Shares Amount Shares Amount capital earnings income (loss) stock shares interests equity
(1) Represents the impact of the redemption of Preferred Stock, Series I, Series P and Series W, and partial redemption of Preferred Stock, Series N, in first quarter 2021. (2) We adopted Accounting Standards Update (ASU) 2016-13 – Financial Instruments – Credit Losses (Topic 326): Measurement of Credit Losses on Financial Instruments (CECL) effective January 1,
2020. For additional information, see Note 1 (Summary of Significant Accounting Policies) in our Annual Report on Form 10-K for the year ended December 31, 2020. (3) Represents the impact of the redemption of the remaining Preferred Stock, Series K, in first quarter 2020.
The accompanying notes are an integral part of these statements.
Wells Fargo & Company
498
991
181
62
Wells Fargo & Company and Subsidiaries Consolidated Statement of Cash Flows (Unaudited)
Quarter ended March 31, (in millions) 2021 2020 Cash flows from operating activities: Net income before noncontrolling interests $ 4,796 505 Adjustments to reconcile net income to net cash provided by operating activities:
Provision for credit losses (1,048) 4,005 Changes in fair value of MSRs and LHFS carried at fair value (1,368) 3,486 Depreciation, amortization and accretion 2,237 1,868 Other net (gains) losses (1) (6,264) 7,643 Stock-based compensation 929 582
Originations and purchases of loans held for sale (1) (45,179) (38,001) Proceeds from sales of and paydowns on loans originally classified as held for sale (1) 24,757 31,971 Net change in:
Debt and equity securities, held for trading 11,122 20,413 Deferred income taxes 299 (1,448) Derivative assets and liabilities (922) (4,293) Other assets 8,481 (10,391) Other accrued expenses and liabilities (1,310) 933
Net cash provided (used) by operating activities (3,470) 17,273 Cash flows from investing activities: Net change in:
Federal funds sold and securities purchased under resale agreements (13,830) 15,675 Available-for-sale debt securities:
Proceeds from sales 13,367 11,843 Prepayments and maturities 21,840 14,135 Purchases (36,203) (18,658)
Equity securities, not held for trading: Proceeds from sales and capital returns 545 1,115 Purchases (1,626) (3,338)
Loans: Loans originated by banking subsidiaries, net of principal collected 17,447 (53,400) Proceeds from sales of loans originally classified as held for investment 11,358 1,959 Purchases of loans (50) (342) Principal collected on nonbank entities’ loans 5,265 3,837 Loans originated by nonbank entities (3,469) (2,348)
Proceeds from sales of foreclosed assets and short sales 180 500 Other, net (40) 91
Net cash provided (used) by investing activities 15,528 (44,303)
Cash flows from financing activities: Net change in:
Common stock: Proceeds from issuance 66 209 Stock tendered for payment of withholding taxes (222) (306) Repurchased (596) (3,407) Cash dividends paid (383) (2,032)
Net change in noncontrolling interests (31) (29) Other, net (76) (76)
Net cash provided by financing activities 10,063 36,589
Net change in cash, cash equivalents, and restricted cash 22,121 9,559 Cash, cash equivalents, and restricted cash at beginning of period 264,612 141,250
Cash, cash equivalents, and restricted cash at end of period $ 286,733 150,809
Supplemental cash flow disclosures: Cash paid for interest $ 1,091 3,479 Cash paid for income taxes, net (1) 358
(1) Prior periods have been revised to conform to the current period presentation.
The accompanying notes are an integral part of these statements. See Note 1 (Summary of Significant Accounting Policies) for noncash activities.
Wells Fargo & Company
23
63
Notes to Financial Statements -See the Glossary of Acronyms at the end of this Report for terms used throughout the Financial Statements and related Notes.
Note 1: Summary of Significant Accounting Policies
Wells Fargo & Company is a diversified financial services company. We provide banking, investment and mortgage products and services, as well as consumer and commercial finance, through banking locations and offices, the internet and other distribution channels to individuals, businesses and institutions in all 50 states, the District of Columbia, and in countries outside the U.S. When we refer to “Wells Fargo,” “the Company,” “we,” “our” or “us,” we mean Wells Fargo & Company and Subsidiaries (consolidated). Wells Fargo & Company (the Parent) is a financial holding company and a bank holding company. We also hold a majority interest in a real estate investment trust, which has publicly traded preferred stock outstanding.
Our accounting and reporting policies conform with U.S. generally accepted accounting principles (GAAP) and practices in the financial services industry. For discussion of our significant accounting policies, see Note 1 (Summary of Significant Accounting Policies) in our Annual Report on Form 10-K for the year ended December 31, 2020 (2020 Form 10-K). There were no material changes to these policies in first quarter 2021.
To prepare the financial statements in conformity with GAAP, management must make estimates based on assumptions about future economic and market conditions (for example, unemployment, market liquidity, real estate prices, etc.) that affect the reported amounts of assets and liabilities at the date of the financial statements, income and expenses during the reporting period and the related disclosures. Although our estimates contemplate current conditions and how we expect them to change in the future, it is reasonably possible that actual conditions could be worse than anticipated in those estimates, which could materially affect our results of operations and financial condition. Management has made significant estimates in several areas, including: • allowance for credit losses (Note 4 (Loans and Related
Allowance for Credit Losses)); • valuations of residential mortgage servicing rights (MSRs)
(Note 8 (Securitizations and Variable Interest Entities) and Note 9 (Mortgage Banking Activities));
• valuations of financial instruments (Note 15 (Fair Values of Assets and Liabilities));
• liabilities for contingent litigation losses (Note 13 (Legal Actions));
• income taxes; and • goodwill impairment (Note 10 (Intangible Assets)).
Actual results could differ from those estimates. These unaudited interim financial statements reflect all
adjustments that are, in the opinion of management, necessary for a fair statement of the results for the periods presented. These adjustments are of a normal recurring nature, unless otherwise disclosed in this Form 10-Q. The results of operations in the interim financial statements do not necessarily indicate the results that may be expected for the full year. The interim financial information should be read in conjunction with our 2020 Form 10-K.
Accounting Standards Adopted in 2021 In first quarter 2021, we adopted the following new accounting guidance:
• ASU 2020-08 – Codification Improvements to Subtopic 310-20, Receivables – Nonrefundable Fees and Other Costs
• ASU 2020-01 – Investments – Equity Securities (Topic 321), Investments – Equity Method and Joint Ventures (Topic 323), and Derivatives and Hedging (Topic 815): Clarifying the Interactions between Topic 321, Topic 323, and Topic 815 (a consensus of the Financial Accounting Standards Board (FASB) Emerging Issues Task Force)
• ASU 2019-12 – Income Taxes (Topic 740): Simplifying the Accounting for Income Taxes
ASU 2021-01 clarifies the scope of Topic 848 to include derivatives affected by changes in interest rates for margining, discounting, or contract price alignment as part of the market-wide transition to new reference rate (commonly referred to as the “discounting transition”), even if they do not reference the London Interbank Offered Rate or another rate that is expected to be discontinued as a result of reference rate reform. The guidance also clarifies other aspects of the relief provided in Accounting Standards Codification (ASC) 848. We adopted ASU 2021-01 in first quarter 2021, and the guidance will be followed until the Update terminates on December 31, 2022. This guidance is applied on a prospective basis. The Update did not have a material impact on our consolidated financial statements.
ASU 2020-08 clarifies the accounting for purchased callable debt securities carried at a premium and was issued to correct an unintended application of ASU 2017-08 – Receivables— Nonrefundable Fees and Other Costs (Subtopic 310-20): Premium Amortization on Purchased Callable Debt Securities, which requires amortization of such premiums to the earliest call date, but was not clear for the method to be used for instruments with multiple call dates. This Update now specifies that such premiums are amortized to the next call date and requires reassessment throughout the life of the instruments with multiple call dates. The Update did not have an impact on our consolidated financial statements, as we had interpreted the provisions of ASU 2017-08 in this manner upon our adoption in first quarter 2019.
ASU 2020-01 clarifies the accounting for equity securities upon transition between the measurement alternative and equity method. The Update also clarifies for forward contracts and options to purchase equity securities an entity need not consider whether upon settlement of the forward contract or option if the equity securities would be accounted for by the equity method or the fair value option. We adopted this Update in first quarter 2021. The Update did not have an impact on our consolidated financial statements.
ASU 2019-12 provides narrow scope simplifications and improvements to the general principles in ASC Topic 740 – Income Taxes related to intraperiod tax allocation, basis differences when there are changes in ownership of foreign investments and interim periods income tax accounting for year to date losses that exceed anticipated annual losses. The Update did not have an impact on our consolidated financial statements.
Wells Fargo & Company 64
Supplemental Cash Flow Information Significant noncash activities are presented in Table 1.1.
Table 1.1: Supplemental Cash Flow Information
Quarter ended March 31,
(in millions) 2021 2020
Held-to-maturity debt securities purchased from securitization of LHFS (1) 10,252 62
Transfers from loans to LHFS (2) 6,249 1,063
Transfers from available-for-sale debt securities to held-to-maturity debt securities 16,617 —
(1) For the quarter ended March 31, 2021, predominantly represents agency mortgage-backed securities purchased upon settlement of the sale and securitization of our conforming residential mortgage loans. See Note 8 (Securitizations and Variable Interest Entities) for additional information.
(2) Prior periods have been revised to conform to the current period presentation.
Subsequent Events We have evaluated the effects of events that have occurred subsequent to March 31, 2021, and there have been no material events that would require recognition in our first quarter 2021 consolidated financial statements or disclosure in the Notes to the consolidated financial statements.
Wells Fargo & Company 65
Note 2: Trading Activities
Table 2.1 presents a summary of our trading assets and liabilities measured at fair value through earnings.
Total trading derivative liabilities 12,027 13,841
Total trading liabilities $ 34,760 36,282
(1) Represents balance sheet netting for trading derivative asset and liability balances, and trading portfolio level counterparty valuation adjustments.
Table 2.2 provides a summary of the net interest income Net interest income also includes dividend income on earned from trading securities, and net gains and losses due to trading securities and dividend expense on trading securities we the realized and unrealized gains and losses from trading have sold, but not yet purchased. activities.
Table 2.2: Net Interest Income and Net Gains (Losses) on Trading Activities
Quarter ended March 31,
(in millions) 2021 2020
Interest income:
Debt securities $ 529 766
Equity securities 103 137
Loans held for sale 12 12
Total interest income 644
Less: Interest expense 110
Net interest income 534
Net gains (losses) from trading activities (1):
Debt securities (2,106) 2,355
Equity securities 1,153 (4,401)
Loans held for sale 24 (12)
Derivatives (2) 1,277 2,122
Total net gains from trading activities 348
Total trading-related net interest and noninterest income $ 882 838
(1) Represents realized gains (losses) from our trading activities and unrealized gains (losses) due to changes in fair value of our trading positions. (2) Excludes economic hedging of mortgage banking and asset/liability management activities, for which hedge results (realized and unrealized) are reported with the respective hedged activities.
Wells Fargo & Company
915
141
774
64
66
Note 3: Available-for-Sale and Held-to-Maturity Debt Securities
Table 3.1 provides the amortized cost, net of the allowance for securities held for trading is included in Note 2 (Trading credit losses (ACL) for debt securities, and fair value by major Activities). categories of available-for-sale (AFS) debt securities, which are Outstanding balances exclude accrued interest receivable on carried at fair value, and held-to-maturity (HTM) debt securities, AFS and HTM debt securities, which are included in other assets. which are carried at amortized cost, net of the ACL. The net See Note 7 (Other Assets) for additional information on accrued unrealized gains (losses) for AFS debt securities are reported as a interest receivable. Amounts considered to be uncollectible are component of cumulative other comprehensive income (OCI), reversed through interest income. The interest income reversed net of the ACL and applicable income taxes. Information on debt in first quarter 2021 and 2020 was insignificant.
(in millions) cost, net (1) unrealized gains unrealized losses Fair value
March 31, 2021 Available-for-sale debt securities:
Securities of U.S. Treasury and federal agencies $ 25,144 136 (63) 25,217 Non-U.S. government securities 14,458 — — 14,458 Securities of U.S. states and political subdivisions (2) 19,288 417 (48) 19,657 Federal agency mortgage-backed securities 115,503 3,142 (988) 117,657 Non-agency mortgage-backed securities (3) 4,040 46 (28) 4,058 Collateralized loan obligations 9,858 7 (15) 9,850 Other debt securities 9,514 490 (51) 9,953
Total available-for-sale debt securities 197,805 4,238 (1,193) 200,850
Held-to-maturity debt securities: Securities of U.S. Treasury and federal agencies 40,251 964 (621) 40,594 Securities of U.S. states and political subdivisions 27,569 662 (171) 28,060 Federal agency mortgage-backed securities 144,484 2,986 (2,292) 145,178 Non-agency mortgage-backed securities 907 36 (15) 928 Collateralized loan obligations 18,981 218 — 19,199
Total held-to-maturity debt securities 232,192 4,866 (3,099) 233,959
Total (4) $ 429,997 9,104 (4,292) 434,809
December 31, 2020 Available-for-sale debt securities:
Securities of U.S. Treasury and federal agencies $ 21,954 205 — 22,159 Non-U.S. government securities 16,816 — (3) 16,813 Securities of U.S. states and political subdivisions (2) 19,263 224 (81) 19,406 Federal agency mortgage-backed securities 134,838 4,260 (28) 139,070 Non-agency mortgage-backed securities (3) 3,745 30 (46) 3,729 Collateralized loan obligations 9,058 4 (44) 9,018 Other debt securities 9,859 399 (61) 10,197
Total available-for-sale debt securities 215,533 5,122 (263) 220,392
Held-to-maturity debt securities: Securities of U.S. Treasury and federal agencies 47,295 1,472 (170) 48,597 Securities of U.S. states and political subdivisions 25,860 938 (5) 26,793 Federal agency mortgage-backed securities 115,437 4,182 (21) 119,598 Non-agency mortgage-backed securities 890 51 (8) 933 Collateralized loan obligations 16,238 148 — 16,386
Total held-to-maturity debt securities 205,720 6,791 (204) 212,307
Total (4) $ 421,253 11,913 (467) 432,699
(1) Represents amortized cost of the securities, net of the ACL of $41 million and $28 million related to AFS debt securities and $89 million and $41 million related to HTM debt securities at March 31, 2021, and December 31, 2020, respectively.
(2) Includes investments in tax-exempt preferred debt securities issued by investment funds or trusts that predominantly invest in tax-exempt municipal securities. The amortized cost, net of the ACL and fair value of these types of securities, was $5.2 billion at March 31, 2021, and $5.0 billion at December 31, 2020.
(3) Predominantly consists of commercial mortgage-backed securities at both March 31, 2021, and December 31, 2020. (4) We held AFS and HTM debt securities from Federal National Mortgage Association (FNMA) and Federal Home Loan Mortgage Corporation (FHLMC) that each exceeded 10% of stockholders’ equity,
with an amortized cost of $103.4 billion and $89.5 billion and a fair value of $104.5 billion and $90.5 billion at March 31, 2021, and an amortized cost of $99.8 billion and $88.7 billion and a fair value of $103.2 billion and $91.5 billion at December 31, 2020, respectively.
Wells Fargo & Company 67
Note 3: Available-for-Sale and Held-to-Maturity Debt Securities (continued)
Table 3.2 details the breakout of purchases of and transfers to HTM debt securities by major category of security.
Table 3.2: Held-to-Maturity Debt Securities Purchases and Transfers
Quarter ended March 31,
(in millions) 2021 2020
Purchases of held-to-maturity debt securities (1):
Securities of U.S. Treasury and federal agencies $ — 3,016
Securities of U.S. states and political subdivisions 1,910 866
Federal agency mortgage-backed securities 24,867 15,863
Non-agency mortgage-backed securities 29 62
Collateralized loan obligations 3,953 —
Total purchases of held-to-maturity debt securities 30,759 19,807
Transfers from available-for-sale debt securities to held-to-maturity debt securities:
Federal agency mortgage-backed securities 16,617 —
Total transfers from available-for-sale debt securities to held-to-maturity debt securities $ 16,617 — (1) Inclusive of securities purchased but not yet settled and noncash purchases from securitization of loans held for sale (LHFS).
Table 3.3 shows the composition of interest income, provision for credit losses, and gross realized gains and losses from sales and impairment write-downs included in earnings related to AFS and HTM debt securities (pre-tax).
Table 3.3: Income Statement Impacts for Available-for-Sale and Held-to-Maturity Debt Securities Quarter ended March 31,
(in millions) 2021 2020
Interest income (1):
Available-for-sale $ 811 1,726
Held-to-maturity 972
Total interest income 1,783 2,706
Provision for credit losses:
Available-for-sale 22 168
Held-to-maturity 47 4
Total provision for credit losses 69 172
Realized gains and losses (2):
Gross realized gains 151
Gross realized losses — (4)
Impairment write-downs — (15)
Net realized gains $ 151 237
(1) Excludes interest income from trading debt securities, which is disclosed in Note 2 (Trading Activities). (2) Realized gains and losses relate to AFS debt securities. There were no realized gains or losses from HTM debt securities in all periods presented.
Credit Quality We monitor credit quality of debt securities by evaluating various attributes and utilize such information in our evaluation of the appropriateness of the ACL for debt securities. The credit quality indicators that we most closely monitor include credit ratings and delinquency status and are based on information as of our financial statement date.
CREDIT RATINGS Credit ratings express opinions about the credit quality of a debt security. We determine the credit rating of a security according to the lowest credit rating made available by national recognized statistical rating organizations (NRSROs). Debt securities rated investment grade, that is those with ratings similar to BBB-/Baa3 or above, as defined by NRSROs, are generally considered by the rating agencies and market participants to be low credit risk. Conversely, debt securities rated below investment grade, labeled as “speculative grade” by the rating agencies, are considered to be distinctively higher credit risk than investment grade debt securities. For debt
securities not rated by NRSROs, we determine an internal credit grade of the debt securities (used for credit risk management purposes) equivalent to the credit ratings assigned by major credit agencies. Substantially all of our debt securities were rated by NRSROs at March 31, 2021, and December 31, 2020.
Table 3.4 shows the percentage of fair value of AFS debt securities and amortized cost of HTM debt securities determined to be rated investment grade, inclusive of securities rated based on internal credit grades.
($ in millions) Fair value % investment grade Amortized cost % investment grade
March 31, 2021
Total portfolio (1)
Breakdown by category:
Securities of U.S. Treasury and federal agencies (2)
Securities of U.S. states and political subdivisions
Collateralized loan obligations (3)
All other debt securities (4)
$
$
200,850
142,874
19,657
9,850
28,469
99%
100%
99
100
92
232,281
184,735
27,587
19,031
928
99%
100%
100
100
5
December 31, 2020
Total portfolio (1)
Breakdown by category:
Securities of U.S. Treasury and federal agencies (2)
Securities of U.S. states and political subdivisions
Collateralized loan obligations (3)
All other debt securities (4)
$
$
220,392
161,229
19,406
9,018
30,739
99%
100%
99
100
93
205,761
162,732
25,870
16,255
904
99%
100%
100
100
6
(1) 93% and 92% were rated AA- and above at March 31, 2021, and December 31, 2020, respectively. (2) Includes federal agency mortgage-backed securities. (3) 99% and 98% were rated AA- and above at March 31, 2021, and December 31, 2020, respectively. (4) Includes non-U.S. government, non-agency mortgage-backed, and all other debt securities.
DELINQUENCY STATUS AND NONACCRUAL DEBT SECURITIES Debt security issuers that are delinquent in payment of amounts due under contractual debt agreements have a higher probability of recognition of credit losses. As such, as part of our monitoring of the credit quality of the debt security portfolio, we consider whether debt securities we own are past due in payment of principal or interest payments and whether any securities have been placed into nonaccrual status.
Debt securities that are past due and still accruing were insignificant at both March 31, 2021, and December 31, 2020. The carrying value of debt securities in nonaccrual status was insignificant at both March 31, 2021, and December 31, 2020. Charge-offs on debt securities were insignificant for the quarters ended March 31, 2021 and 2020.
Purchased debt securities with credit deterioration (PCD) are not considered to be in nonaccrual status, as payments from issuers of these securities remain current. PCD securities were insignificant during the quarters ended March 31, 2021 and 2020.
Wells Fargo & Company 69
Note 3: Available-for-Sale and Held-to-Maturity Debt Securities (continued)
Unrealized Losses of Available-for-Sale Debt Securities categorized as being “less than 12 months” or “12 months or Table 3.5 shows the gross unrealized losses and fair value of AFS more” in a continuous loss position based on the point in time debt securities by length of time those individual securities in that the fair value declined to below the amortized cost basis, net each category have been in a continuous loss position. Debt of allowance for credit losses. securities on which we have recorded credit impairment are
Table 3.5: Gross Unrealized Losses and Fair Value – Available-for-Sale Debt Securities
Less than 12 months 12 months or more Total Gross Gross Gross
unrealized unrealized unrealized (in millions) losses Fair value losses Fair value losses Fair value
March 31, 2021
Available-for-sale debt securities:
Securities of U.S. Treasury and federal agencies $ (63) 10,584 — — (63) 10,584
Non-U.S. government securities — — — — — —
Securities of U.S. states and political subdivisions (37) 1,097 (11) 1,088 (48) 2,185
Federal agency mortgage-backed securities (988) 41,851 — — (988) 41,851
We have assessed each debt security with gross unrealized losses included in the previous table for credit impairment. As part of that assessment we evaluated and concluded that we do not intend to sell any of the debt securities, and that it is more likely than not that we will not be required to sell, prior to recovery of the amortized cost basis. We evaluate, where necessary, whether credit impairment exists by comparing the present value of the expected cash flows to the debt securities’ amortized cost basis. Credit impairment is recorded as an ACL for debt securities.
For descriptions of the factors we consider when analyzing debt securities for impairment as well as methodology and significant inputs used to measure credit losses, see Note 1 (Summary of Significant Accounting Policies) in our 2020 Form 10-K.
Wells Fargo & Company 70
Contractual Maturities Table 3.6 and Table 3.7 show the remaining contractual maturities, amortized cost, net of the ACL, fair value and weighted average effective yields of AFS and HTM debt securities, respectively. The remaining contractual principal
maturities for mortgage-backed securities (MBS) do not consider prepayments. Remaining expected maturities will differ from contractual maturities because borrowers may have the right to prepay obligations before the underlying mortgages mature.
After After
By remaining contractual maturity ($ in millions) Total Within
one year
one yearthrough
five years
five yearsthrough
ten years After
ten years
March 31, 2021
Available-for-sale debt securities (1):
Securities of U.S. Treasury and federal agencies
Amortized cost, net $ 25,144 296 15,550 7,460 1,838
Fair value 25,217 296 15,573 7,402 1,946
Weighted average yield 0.59% 0.15 0.33 0.95 1.44
Non-U.S. government securities
Amortized cost, net $ 14,458 14,433 25 — —
Fair value 14,458 14,433 25 — —
Weighted average yield (0.11%) (0.12) 0.42 — —
Securities of U.S. states and political subdivisions
Amortized cost, net $ 19,288 2,024 2,049 4,715 10,500
Fair value 19,657 2,028 2,094 4,712 10,823
Weighted average yield 2.02% 1.35 1.74 1.22 2.56
Federal agency mortgage-backed securities
Amortized cost, net $ 115,503 8 292 3,037 112,166
Fair value 117,657 8 303 3,133 114,213
Weighted average yield 2.70% 2.37 2.34 2.08 2.72
Non-agency mortgage-backed securities
Amortized cost, net $ 4,040 — — 162 3,878
Fair value 4,058 — — 162 3,896
Weighted average yield 2.04% — — 1.94 2.05
Collateralized loan obligations
Amortized cost, net $ 9,858 — 201 7,359 2,298
Fair value 9,850 — 201 7,353 2,296
Weighted average yield 1.60% — 2.25 1.61 1.51
Other debt securities
Amortized cost, net $ 9,514 362 2,595 3,136 3,421
Fair value 9,953 359 2,771 3,171 3,652
Weighted average yield 3.22% 3.04 4.47 3.23 2.29 Total available-for-sale debt securities
Amortized cost, net $ 197,805 17,123 20,712 25,869 134,101
Fair value $ 200,850 17,124 20,967 25,933 136,826
Weighted average yield 2.13% 0.23 1.03 1.60 2.64
(1) Weighted average yields displayed by maturity bucket are weighted based on amortized cost without effect for any related hedging derivatives and are shown pre-tax.
Wells Fargo & Company 71
Note 3: Available-for-Sale and Held-to-Maturity Debt Securities (continued)
Table 3.7: Contractual Maturities – Held-to-Maturity Debt Securities After After
By remaining contractual maturity ($ in millions) Total Within
one year
one yearthrough
five years
five yearsthrough
ten years After
ten years
March 31, 2021
Held-to-maturity debt securities (1):
Securities of U.S. Treasury and federal agencies
Amortized cost, net $ 40,251 24,063 12,406 — 3,782
Fair value 40,594 24,236 13,197 — 3,161
Weighted average yield 2.12% 2.09 2.37 — 1.57
Securities of U.S. states and political subdivisions
Amortized cost, net $ 27,569 628 2,231 2,026 22,684
Fair value 28,060 633 2,305 2,109 23,013
Weighted average yield 2.18% 1.82 1.90 2.69 2.17
Federal agency mortgage-backed securities
Amortized cost, net $ 144,484 — — — 144,484
Fair value 145,178 — — — 145,178
Weighted average yield 2.28% — — — 2.28
Non-agency mortgage-backed securities
Amortized cost, net $ 907 — 14 — 893
Fair value 928 — 14 — 914
Weighted average yield 3.12% — 1.57 — 3.15
Collateralized loan obligations
Amortized cost, net $ 18,981 — 32 8,652 10,297
Fair value 19,199 — 32 8,748 10,419
Weighted average yield 1.75% — 2.32 1.77 1.73
Total held-to-maturity debt securities
Amortized cost, net $ 232,192 24,691 14,683 10,678 182,140
Fair value 233,959 24,869 15,548 10,857 182,685
Weighted average yield 2.20% 2.08 2.29 1.94 2.23
(1) Weighted average yields displayed by maturity bucket are weighted based on amortized cost and are shown pre-tax.
Wells Fargo & Company 72
Note 4: Loans and Related Allowance for Credit Losses
Table 4.1 presents total loans outstanding by portfolio segment and class of financing receivable. Outstanding balances include unearned income, net deferred loan fees or costs, and unamortized discounts and premiums. These amounts were less than 1% of our total loans outstanding at March 31, 2021, and December 31, 2020.
Outstanding balances exclude accrued interest receivable on loans, except for certain revolving loans, such as credit card loans.
Table 4.1: Loans Outstanding
See Note 7 (Other Assets) for additional information on accrued interest receivable. Amounts considered to be uncollectible are reversed through interest income. During first quarter 2021, we reversed accrued interest receivable of $16 million for our commercial portfolio segment and $51 million for our consumer portfolio segment, compared with $9 million and $63 million, respectively, for the same period a year ago.
(in millions) Mar 31,
2021 Dec 31,
2020
Commercial:
Commercial and industrial $ 319,055 318,805
Real estate mortgage 121,198 121,720
Real estate construction 21,533 21,805
Lease financing 15,734 16,087
Total commercial 477,520 478,417
Consumer:
Residential mortgage – first lien 254,363 276,674
Residential mortgage – junior lien 21,308 23,286
Credit card 34,246 36,664
Auto 49,210 48,187
Other consumer 24,925 24,409
Total consumer 384,052 409,220
Total loans $ 861,572 887,637
Our non-U.S. loans are reported by respective class of financing receivable in the table above. Substantially all of our non-U.S. loan portfolio is commercial loans. Table 4.2 presents total non-U.S. commercial loans outstanding by class of financing receivable.
Table 4.2: Non-U.S. Commercial Loans Outstanding
(in millions) Mar 31,
2021 Dec 31,
2020
Non-U.S. commercial loans:
Commercial and industrial $ 69,493 63,128
Real estate mortgage 7,066 7,278
Real estate construction 1,665 1,603
Lease financing 636 629
Total non-U.S. commercial loans $ 78,860 72,638
Wells Fargo & Company 73
Note 4: Loans and Related Allowance for Credit Losses (continued)
Loan Purchases, Sales, and Transfers which we have elected the fair value option and government Table 4.3 presents the proceeds paid or received for purchases insured/guaranteed residential mortgage – first lien loans and sales of loans and transfers from loans held for investment because their loan activity normally does not impact the ACL. to mortgages/loans held for sale. The table excludes loans for
Table 4.3: Loan Purchases, Sales, and Transfers
2021 2020
(in millions) Commercial Consumer Total Commercial Consumer Total
Quarter ended March 31,
Purchases $ 48 1 49 341 1 342
Sales (273) (188) (461) (813) (26) (839)
Transfers (to)/from LHFS (435) 63 (372) 77 2 79
Commitments to Lend A commitment to lend is a legally binding agreement to lend to a customer, usually at a stated interest rate, if funded, and for specific purposes and time periods. We generally require a fee to extend such commitments. Certain commitments are subject to loan agreements with covenants regarding the financial performance of the customer or borrowing base formulas on an ongoing basis that must be met before we are required to fund the commitment. We may reduce or cancel consumer commitments, including home equity lines and credit card lines, in accordance with the contracts and applicable law. For unconditionally cancelable commitments at our discretion, we do not recognize an ACL.
We may, as a representative for other lenders, advance funds or provide for the issuance of letters of credit under syndicated loan or letter of credit agreements. Any advances are generally repaid in less than a week and would normally require default of both the customer and another lender to expose us to loss. The unfunded amount of these temporary advance arrangements totaled approximately $81.9 billion at March 31, 2021.
We issue commercial letters of credit to assist customers in purchasing goods or services, typically for international trade. At both March 31, 2021, and December 31, 2020, we had $1.3 billion, of outstanding issued commercial letters of credit. We also originate multipurpose lending commitments under which borrowers have the option to draw on the facility for different purposes in one of several forms, including a standby letter of credit. See Note 11 (Guarantees and Other Commitments) for additional information on standby letters of credit.
When we enter into commitments, we are exposed to credit risk. The maximum credit risk for these commitments will generally be lower than the contractual amount because a significant portion of these commitments are not funded. We manage the potential risk in commitments to lend by limiting the total amount of commitments, both by individual customer and in total, by monitoring the size and maturity structure of these commitments and by applying the same credit standards for these commitments as for all of our credit activities.
For loans and commitments to lend, we generally require collateral or a guarantee. We may require various types of collateral, including commercial and consumer real estate, autos, other short-term liquid assets such as accounts receivable or inventory and long-lived assets, such as equipment and other business assets. Collateral requirements for each loan or commitment may vary based on the loan product and our assessment of a customer’s credit risk according to the specific credit underwriting, including credit terms and structure.
The contractual amount of our unfunded credit commitments, including unissued standby and commercial letters of credit, is summarized by portfolio segment and class of financing receivable in Table 4.4. The table excludes the issued standby and commercial letters of credit and temporary advance arrangements described above.
Table 4.4: Unfunded Credit Commitments
(in millions) Mar 31,
2021 Dec 31,
2020
Commercial:
Commercial and industrial $ 385,575 378,167
Real estate mortgage 8,584 7,993
Real estate construction 15,150 15,650
Total commercial 409,309 401,810
Consumer:
Residential mortgage – first lien 37,066 31,530
Residential mortgage – junior lien 31,573 32,820
Credit card 124,077 121,096
Other consumer 51,361 49,179
Total consumer 244,077 234,625
Total unfunded credit commitments $ 653,386 636,435
Wells Fargo & Company 74
8
Allowance for Credit Losses Table 4.5 presents the allowance for credit losses (ACL) for loans, $1.7 billion from December 31, 2020, due to continued which consists of the allowance for loan losses and the allowance improvement in the economic environment. for unfunded credit commitments. The ACL for loans decreased
Table 4.5: Allowance for Credit Losses for Loans
Quarter ended March 31,
($ in millions) 2021 2020 Balance, beginning of period $ 19,713 10,456 Cumulative effect from change in accounting policies (1) — (1,337) Allowance for purchased credit-deteriorated (PCD) loans (2) — Balance, beginning of period, adjusted 19,713 9,127 Provision for credit losses (1,117) 3,833 Interest income on certain impaired loans (3) (41) (38) Loan charge-offs:
Commercial: Commercial and industrial (159) (377) Real estate mortgage (52) (3) Real estate construction — — Lease financing (21) (13)
Total commercial (232) (393)
Consumer: Residential mortgage – first lien (17) (23) Residential mortgage – junior lien (19) (30) Credit card (335) (471) Auto (129) (156) Other consumer (147) (165)
Total consumer (647) (845)
Total loan charge-offs (879) (1,238)
Loan recoveries: Commercial:
Commercial and industrial 71 44 Real estate mortgage 6 5 Real estate construction — 16 Lease financing 6 4
Total commercial 83
Consumer: Residential mortgage – first lien 41 26 Residential mortgage – junior lien 38 35 Credit card 99 94 Auto 77 74 Other consumer 28 31
Total consumer 283
Total loan recoveries 366
Net loan charge-offs (513) (909)
Other 1 Balance, end of period $ 18,043 12,022
Components: Allowance for loan losses $ 16,928 11,263 Allowance for unfunded credit commitments 1,115
Allowance for credit losses $ 18,043 12,022
Net loan charge-offs (annualized) as a percentage of average total loans 0.24 % 0.38 Allowance for loan losses as a percentage of total loans 1.96 1.12 Allowance for credit losses for loans as a percentage of total loans 2.09 1.19
(1) Represents the overall decrease in our ACL for loans as a result of our adoption of CECL on January 1, 2020. (2) Represents the allowance estimated for purchased credit-impaired (PCI) loans that automatically became PCD loans with the adoption of CECL. For additional information, see Note 1 (Summary of
Significant Accounting Policies) in our 2020 Form 10-K. (3) Loans with an allowance measured by discounting expected cash flows using the loan’s effective interest rate over the remaining life of the loan recognize changes in allowance attributable to the
passage of time as interest income.
Wells Fargo & Company
69
260
329
9
759
75
8
Note 4: Loans and Related Allowance for Credit Losses (continued)
Table 4.6 summarizes the activity in the ACL by our commercial and consumer portfolio segments.
Table 4.6: Allowance for Credit Losses for Loans Activity by Portfolio Segment
2021 2020
(in millions) Commercial Consumer Total Commercial Consumer Total Quarter ended March 31, Balance, beginning of period $ 11,516 8,197 19,713 6,245 4,211 10,456 Cumulative effect from change in accounting policies (1) — — — (2,861) 1,524 (1,337) Allowance for purchased credit-deteriorated (PCD) loans (2) — — — — 8 Balance, beginning of period, adjusted 11,516 8,197 19,713 3,384 5,743 9,127
Provision for credit losses (667) (450) (1,117) 2,240 1,593 3,833 Interest income on certain loans (3) (19) (22) (41) (14) (24) (38) Loan charge-offs (232) (647) (879) (393) (845) (1,238) Loan recoveries 83 283 366 69 260 329
Net loan charge-offs (149) (364) (513) (324) (585) (909) Other 1 — 1 (7) 16 9
Balance, end of period $ 10,682 7,361 18,043 5,279 6,743 12,022
(1) Represents the overall decrease in our ACL for loans as a result of our adoption of CECL on January 1, 2020. (2) Represents the allowance estimated for PCI loans that automatically became PCD loans with the adoption of CECL. For additional information, see Note 1 (Summary of Significant Accounting
Policies) in our 2020 Form 10-K. (3) Loans with an allowance measured by discounting expected cash flows using the loan’s effective interest rate over the remaining life of the loan recognize changes in allowance attributable to the
passage of time as interest income.
Wells Fargo & Company 76
Credit Quality We monitor credit quality by evaluating various attributes and utilize such information in our evaluation of the appropriateness of the ACL for loans. The following sections provide the credit quality indicators we most closely monitor. The credit quality indicators are generally based on information as of our financial statement date, with the exception of updated Fair Isaac Corporation (FICO) scores and updated loan-to-value (LTV)/ combined LTV (CLTV). We obtain FICO scores at loan origination and the scores are generally updated at least quarterly, except in limited circumstances, including compliance with the Fair Credit Reporting Act (FCRA). Generally, the LTV and CLTV indicators are updated in the second month of each quarter, with updates no older than December 31, 2020.
COMMERCIAL CREDIT QUALITY INDICATORS We manage a consistent process for assessing commercial loan credit quality.
Table 4.7: Commercial Loan Categories by Risk Categories and Vintage
Generally, commercial loans are subject to individual risk assessment using our internal borrower and collateral quality ratings, which is our primary credit quality indicator. Our ratings are aligned to regulatory definitions of pass and criticized categories with the criticized segmented among special mention, substandard, doubtful and loss categories.
Table 4.7 provides the outstanding balances of our commercial loan portfolio by risk category. Credit quality information is provided with the year of origination for term loans. Revolving loans may convert to term loans as a result of a contractual provision in the original loan agreement or if modified in a troubled debt restructuring (TDR). At March 31, 2021, we had $445.6 billion and $31.9 billion of pass and criticized commercial loans, respectively.
Note 4: Loans and Related Allowance for Credit Losses (continued)
Table 4.8 provides past due information for commercial instituted in response to the COVID-19 pandemic could continue loans, which we monitor as part of our credit risk management to delay the recognition of delinquencies for customers who practices; however, delinquency is not a primary credit quality otherwise would have moved into past due status. indicator for commercial loans. Payment deferral activities
Table 4.8: Commercial Loan Categories by Delinquency Status
(in millions)
Commercial and
industrial
Real estate
mortgage
Real estate
construction Lease
financing Total
March 31, 2021
By delinquency status:
Current-29 days past due (DPD) and still accruing
30-89 DPD and still accruing
90+ DPD and still accruing
Nonaccrual loans
$ 316,407
370
55
2,223
118,987
380
128
1,703
21,293
99
86
55
15,120
365
—
249
471,807
1,214
269
4,230
Total commercial loans $ 319,055 121,198 21,533 15,734 477,520
December 31, 2020
By delinquency status:
Current-29 DPD and still accruing
30-89 DPD and still accruing
90+ DPD and still accruing
Nonaccrual loans
$ 315,493
575
39
2,698
119,561
347
38
1,774
21,532
224
1
48
15,595
233
—
259
472,181
1,379
78
4,779
Total commercial loans $ 318,805 121,720 21,805 16,087 478,417
CONSUMER CREDIT QUALITY INDICATORS We have various classes of consumer loans that present unique credit risks. Loan delinquency, FICO credit scores and LTV for residential mortgage loans are the primary credit quality indicators that we monitor and utilize in our evaluation of the appropriateness of the ACL for the consumer loan portfolio segment.
Many of our loss estimation techniques used for the ACL for loans rely on delinquency-based models; therefore, delinquency is an important indicator of credit quality in the establishment of our ACL for loans.
Table 4.9 provides the outstanding balances of our consumer loan portfolio by delinquency status. Payment deferral activities instituted in response to the COVID-19 pandemic could continue to delay the recognition of delinquencies for customers who otherwise would have moved into past due status.
Credit quality information is provided with the year of origination for term loans. Revolving loans may convert to term loans as a result of a contractual provision in the original loan agreement or if modified in a TDR. The revolving loans converted to term loans in the credit card loan category represent credit card loans with modified terms that require payment over a specific term.
Wells Fargo & Company 78
Table 4.9: Consumer Loan Categories by Delinquency Status and Vintage
(in millions) 2021 2020 2019
Term loans by origination year
2018 2017 Prior Revolving
loans
Revolvingloans
converted to term
loans Total
March 31, 2021 Residential mortgage – first lien By delinquency status:
Total other consumer 1,410 1,399 587 265 61 200 20,296 191 24,409
Total consumer loans $ 75,172 60,307 22,816 29,673 35,869 97,314 79,347 8,722 409,220 (1) Represents loans whose repayments are predominantly insured by the Federal Housing Administration (FHA) or guaranteed by the Department of Veterans Affairs (VA). Loans insured/guaranteed
by the FHA/VA and 90+ DPD totaled $8.1 billion and $11.1 billion at March 31, 2021, and December 31, 2020, respectively.
Of the $3.2 billion of consumer loans not government $2.7 billion past due and $612 million accruing atDecember 31, insured/guaranteed that are 90 days or more past due at 2020. March 31, 2021, $598 million was accruing, compared with
Wells Fargo & Company 80
Table 4.10 provides the outstanding balances of our consumer loan portfolio by FICO score. Substantially all of the scored consumer portfolio has an updated FICO score of 680 and above, reflecting a strong current borrower credit profile. FICO scores are not available for certain loan types or may not be required if we deem it unnecessary due to strong collateral and
Table 4.10: Consumer Loan Categories by FICO and Vintage
other borrower attributes. Loans not requiring a FICO score totaled $14.7 billion and $13.2 billion at March 31, 2021, and December 31, 2020, respectively. Substantially all loans not requiring a FICO score are securities-based loans originated through retail brokerage.
(in millions) 2021 2020 2019 2018
Term loans by origination year
2017 Prior Revolving
loans
Revolvingloans
converted to term
loans Total
March 31, 2021 By FICO: Residential mortgage – first lien
(1) Represents loans whose repayments are predominantly insured by the FHA or guaranteed by the VA.
LTV refers to the ratio comparing the loan’s unpaid principal value is estimated using the original appraised value adjusted by balance to the property’s collateral value. CLTV refers to the the change in Home Price Index (HPI) for the property location. If combination of first lien mortgage and junior lien mortgage an HPI is not available, the original appraised value is used. The (including unused line amounts for credit line products) ratios. HPI value is normally the only method considered for high value LTVs and CLTVs are updated quarterly using a cascade approach properties, generally with an original value of $1 million or more, which first uses values provided by automated valuation models as the AVM values have proven less accurate for these (AVMs) for the property. If an AVM is not available, then the properties.
Wells Fargo & Company 82
Table 4.11 shows the most updated LTV and CLTV distribution of the residential mortgage – first lien and residential mortgage – junior lien loan portfolios. We consider the trends in residential real estate markets as we monitor credit risk and establish our ACL. In the event of a default, any loss should be
Table 4.11: Consumer Loan Categories by LTV/CLTV and Vintage
limited to the portion of the loan amount in excess of the net realizable value of the underlying real estate collateral value. Certain loans do not have an LTV or CLTV due to industry data availability and portfolios acquired from or serviced by other institutions.
Revolvingloans
Term loans by origination year converted Revolving to term
(in millions) 2021 2020 2019 2018 2017 Prior loans loans Total
(1) Reflects total loan balances with LTV/CLTV amounts in excess of 100%. In the event of default, the loss content would generally be limited to only the amount in excess of 100% LTV/CLTV. (2) Represents loans whose repayments are predominantly insured by the FHA or guaranteed by the VA.
Wells Fargo & Company 83
Note 4: Loans and Related Allowance for Credit Losses (continued)
NONACCRUAL LOANS Table 4.12 provides loans on nonaccrual deferral activities instituted in response to the COVID-19 status. In connection with our adoption of CECL, nonaccrual loans pandemic could continue to delay the recognition of may have an ACL or a negative allowance for credit losses from delinquencies for customers who otherwise would have moved expected recoveries of amounts previously written off. Payment into nonaccrual status.
Table 4.12: Nonaccrual Loans
Nonaccrual loans
Amortized cost
Nonaccrual loans without related allowance for credit losses (1)
Recognized interest income
Quarter ended March 31,
(in millions)
Commercial:
Commercial and industrial
Real estate mortgage
Real estate construction
Lease financing
Total commercial
Consumer:
Residential mortgage- first lien
Residential mortgage- junior lien
Auto
Other consumer
Total consumer
Total nonaccrual loans
$
$
Mar 31, 2021
2,223
1,703
55
249
4,230
2,859
747
181
38
3,825
8,055
Dec 31, 2020
2,698
1,774
48
259
4,779
2,957
754
202
36
3,949
8,728
Mar 31, 2021
428
78
13
44
563
1,932
453
—
—
2,385
2,948
Dec 31, 2020
382
93
15
16
506
1,908
461
—
—
2,369
2,875
2021
31
11
—
—
42
37
12
9
1
59
101
2020
16
8
4
—
28
44
16
3
1
64
92
(1) Nonaccrual loans may not have an allowance for credit losses if the loss expectations are zero given solid collateral value.
LOANS IN PROCESS OF FORECLOSURE Our recorded investment in consumer mortgage loans collateralized by residential real estate property that are in process of foreclosure was $1.3 billion and $2.1 billion at March 31, 2021, and December 31, 2020, respectively, which included $947 million and $1.7 billion, respectively, of loans that are government insured/guaranteed. Under the Consumer Financial Protection Bureau guidelines, we do not commence the foreclosure process on residential mortgage loans until after the loan is 120 days delinquent. Foreclosure procedures and timelines vary depending on whether the property address resides in a judicial or non-judicial state. Judicial states require the foreclosure to be processed through the state’s courts while non-judicial states are processed without court intervention. Foreclosure timelines vary according to state law. In connection with our actions to support customers during the COVID-19 pandemic, we have suspended certain mortgage foreclosure activities.
Wells Fargo & Company 84
LOANS 90 DAYS OR MORE PAST DUE AND STILL ACCRUING Certain loans 90 days or more past due are still accruing, because they are (1) well-secured and in the process of collection or (2) residential mortgage or consumer loans exempt under regulatory rules from being classified as nonaccrual until later delinquency, usually 120 days past due.
Table 4.13 shows loans 90 days or more past due and still accruing by class for loans not government insured/guaranteed.
Table 4.13: Loans 90 Days or More Past Due and Still Accruing Mar 31, Dec 31,
(in millions) 2021 2020
Total: $ 6,273 7,041
Less: FHA insured/VA guaranteed (1) 5,406 6,351
Total, not government insured/guaranteed $ 867 690
By segment and class, not government insured/guaranteed:
Commercial:
Commercial and industrial $ 55 39
Real estate mortgage 128 38
Real estate construction 86 1
Total commercial 269 78
Consumer:
Residential mortgage – first lien 85 135
Residential mortgage – junior lien 15 19
Credit card 394 365
Auto 46 65
Other consumer 58 28
Total consumer 598 612
Total, not government insured/guaranteed $ 867 690
(1) Represents loans whose repayments are predominantly insured by the FHA or guaranteed by the VA.
TROUBLED DEBT RESTRUCTURINGS (TDRs) When, for economic or legal reasons related to a borrower’s financial difficulties, we grant a concession for other than an insignificant period of time to a borrower that we would not otherwise consider, the related loan is classified as a TDR, the balance of which totaled $13.3 billion and $14.5 billion at March 31, 2021, and December 31, 2020, respectively. We do not consider loan resolutions such as foreclosure or short sale to be a TDR. In addition, COVID-related modifications are generally not classified as TDRs due to the relief under the CARES Act and the Interagency Statement. For additional information on the TDR relief, see Note 1 (Summary of Significant Accounting Policies) in our 2020 Form 10-K.
We may require some consumer borrowers experiencing financial difficulty to make trial payments generally for a period of three to four months, according to the terms of a planned permanent modification, to determine if they can perform according to those terms. These arrangements represent trial modifications, which we classify and account for as TDRs. While loans are in trial payment programs, their original terms are not considered modified and they continue to advance through delinquency status and accrue interest according to their original terms.
Commitments to lend additional funds on loans whose terms have been modified in a TDR amounted to $506 million and $489 million at March 31, 2021, and December 31, 2020, respectively.
Table 4.14 summarizes our TDR modifications for the periods presented by primary modification type and includes the financial effects of these modifications. For those loans that modify more than once, the table reflects each modification that occurred during the period. Loans that both modify and are paid off or written-off within the period, as well as changes in recorded investment during the period for loans modified in prior periods, are not included in the table.
Wells Fargo & Company 85
Note 4: Loans and Related Allowance for Credit Losses (continued)
Table 4.14: TDR Modifications
Primary modification type (1) Financial effects of modifications
Weighted Recorded average investment
Interest interest related to Principal rate Other Charge- rate interest rate
($ in millions) forgiveness reduction concessions (2) Total offs (3) reduction reduction (4)
(1) Amounts represent the recorded investment in loans after recognizing the effects of the TDR, if any. TDRs may have multiple types of concessions, but are presented only once in the first modification type based on the order presented in the table above. The reported amounts include loans remodified of $256 million and $263 million for first quarter 2021 and 2020, respectively.
(2) Other concessions include loans discharged in bankruptcy, loan renewals, term extensions and other interest and noninterest adjustments, but exclude modifications that also forgive principal and/or reduce the contractual interest rate.
(3) Charge-offs include write-downs of the investment in the loan in the period it is contractually modified. The amount of charge-off will differ from the modification terms if the loan has been charged down prior to the modification based on our policies. In addition, there may be cases where we have a charge-off/down with no legal principal modification. No modifications resulted in deferring or legally forgiving principal in first quarter 2021, while $29 million modifications resulted in deferring or legally forgiving principal for the same period in 2020.
(4) Recorded investment related to interest rate reduction reflects the effect of reduced interest rates on loans with an interest rate concession as one of their concession types, which includes loans reported as a principal primary modification type that also have an interest rate concession.
(5) Trial modifications are granted a delay in payments due under the original terms during the trial payment period. However, these loans continue to advance through delinquency status and accrue interest according to their original terms. Any subsequent permanent modification generally includes interest rate related concessions; however, the exact concession type and resulting financial effect are usually not known until the loan is permanently modified. Trial modifications for the period are presented net of previously reported trial modifications that became permanent in the current period.
Wells Fargo & Company 86
Table 4.15 summarizes permanent modification TDRs that TDRs based on a payment default definition of 90 days past due have defaulted in the current period within 12 months of their for the commercial portfolio segment and 60 days past due for permanent modification date. We are reporting these defaulted the consumer portfolio segment.
Table 4.15: Defaulted TDRs
Recorded investment of defaults
Quarter ended March 31,
(in millions) 2021 2020
Commercial:
Commercial and industrial $ 41 185
Real estate mortgage 16 21
Real estate construction — —
Lease financing — —
Total commercial 57 206
Consumer:
Residential mortgage – first lien 3 10
Residential mortgage – junior lien 1 2
Credit card 10 26
Auto 11 2
Other consumer 1 1
Total consumer 26 41
Total $ 83 247
Wells Fargo & Company 87
Note 5: Leasing Activity
The information below provides a summary of our leasing activities as a lessor and lessee. See Note 5 (Leasing Activity) in our 2020 Form 10-K for additional information about our leasing activities.
As a Lessor Noninterest income on leases, which is presented in Table 5.1, is included in other noninterest income on our consolidated statement of income. Lease expense, included in other noninterest expense on our consolidated statement of income, was $226 million and $260 million in first quarter 2021 and 2020, respectively.
Table 5.1: Leasing Revenue
Quarter ended March 31,
(in millions) 2021 2020
Interest income on lease financing $ 171 211
Other lease revenues:
Variable revenues on lease financing 26 27
Fixed revenues on operating leases 260 314
Variable revenues on operating leases 18 14
Other lease-related revenues (1) 11 (2)
Noninterest income on leases 315 353
Total leasing revenue $ 486 564
(1) Predominantly includes net gains (losses) on disposition of assets leased under operating leases or lease financings.
As a Lessee Substantially all of our leases are operating leases. Table 5.2 presents balances for our operating leases.
Table 5.2: Operating Lease Right of Use (ROU) Assets and Lease Liabilities
(in millions) Mar 31, 2021 Dec 31, 2020
ROU assets $ 4,137 4,306
Lease liabilities 4,769 4,962
Table 5.3 provides the composition of our lease costs, which are predominantly included in net occupancy expense.
Table 5.3: Lease Costs
Quarter ended March 31,
(in millions) 2021 2020
Fixed lease expense – operating leases $ 265 291
Variable lease expense 78 66
Other (1) (3) (14)
Total lease costs $ 340 343
(1) Predominantly includes gains recognized from sale leaseback transactions and sublease rental income.
Wells Fargo & Company 88
Note 6: Equity Securities
Table 6.1 provides a summary of our equity securities by business purpose and accounting method, including equity securities with readily determinable fair values (marketable) and those without readily determinable fair values (nonmarketable).
Table 6.1: Equity Securities Mar 31, Dec 31,
(in millions) 2021 2020
Held for trading at fair value:
Marketable equity securities $ 20,254 23,032
Not held for trading:
Fair value:
Marketable equity securities
Nonmarketable equity securities
2,102
9,045
1,564
9,413
Total equity securities at fair value 11,147 10,977
Equity method:
Low-income housing tax credit investm
Private equity
Tax-advantaged renewable energy
New market tax credit and other
ents 11,492
2,893
5,562
405
11,628
2,960
5,458
409
Total equity method 20,352 20,455
Other:
Federal Reserve Bank stock and other
Private equity (2)
at cost (1) 3,585
4,643
3,588
4,208
Total equity securities not held for trading 39,727 39,228
Total equity securities $ 59,981 62,260
(1) Substantially alll relates to investments in Federal Reserve Bank stock at both March 31, 2021, and December 31, 2020.
(2) Represents nonmarketable equity securities accounted for under the measurement alternative.
Equity Securities Held for Trading Equity securities held for trading purposes are marketable equity securities traded on organized exchanges. These securities are held as part of our customer accommodation trading activities. For additional information on these activities, see Note 2 (Trading Activities).
Equity Securities Not Held for Trading We also hold equity securities unrelated to trading activities. These securities include private equity and tax credit investments, securities held as economic hedges or to meet regulatory requirements (for example, Federal Reserve Bank and Federal Home Loan Bank stock).
FAIR VALUE Marketable equity securities held for purposes other than trading consist of holdings of publicly traded equity securities held for investment purposes and, to a lesser extent, exchange-traded equity funds held to economically hedge obligations related to our deferred compensation plans. We account for certain nonmarketable equity securities under the fair value method, and substantially all of these securities are economically hedged with equity derivatives.
EQUITY METHOD Our equity method investments consist of tax credit and private equity investments, the majority of which are our low-income housing tax credit (LIHTC) investments.
We invest in affordable housing projects that qualify for the LIHTC, which are designed to promote private development of low-income housing. These investments typically generate a return through realization of federal tax credit and other tax benefits. In first quarter 2021, we recognized pre-tax losses of $326 million related to our LIHTC investments, compared with $339 million in first quarter 2020. These losses were recognized in other noninterest income. We also recognized total tax benefits of $435 million in first quarter 2021, which included tax credits recorded to income taxes of $354 million. In first quarter 2020, total tax benefits were $398 million, which included tax credits of $314 million. We are periodically required to provide additional financial support during the investment period. A liability is recognized for unfunded commitments that are both legally binding and probable of funding. These commitments are predominantly funded within three years of initial investment. Our liability for these unfunded commitments was $4.1 billion at March 31, 2021, and $4.2 billion at December 31, 2020. This liability for unfunded commitments is included in long-term debt.
OTHER The remaining portion of our nonmarketable equity securities portfolio consists of securities accounted for using the cost or measurement alternative.
Wells Fargo & Company 89
Note 6: Equity Securities (continued)
Realized Gains and Losses Not Held for Trading losses that are recognized in other noninterest income. Gains and Table 6.2 provides a summary of the net gains and losses from losses for securities held for trading are reported in net gains on equity securities not held for trading, which excludes equity trading and securities. method adjustments for our share of the investee’s earnings or
Table 6.2: Net Gains (Losses) from Equity Securities Not Held for Trading
Quarter ended March 31, (in millions) 2021 2020
Net gains (losses) from equity securities carried at fair value:
Marketable equity securities $ 60 (803)
Nonmarketable equity securities (358) (1,104)
Total equity securities carried at fair value (298) (1,907)
Net gains (losses) from nonmarketable equity securities not carried at fair value (1):
Impairment write-downs (15) (935)
Net unrealized gains related to measurement alternative observable transactions 225 222
Net realized gains on sale 55 —
Total nonmarketable equity securities not carried at fair value 265 (713)
Net losses from economic hedge derivatives (2) 425 1,219
Total net gains from equity securities not held for trading $ 392 (1,401)
(1) Includes impairment write-downs and net realized gains on sale related to private equity and venture capital investments in consolidated portfolio companies, which are not reported in equity securities on our consolidated balance sheet.
(2) Includes net gains (losses) on derivatives not designated as hedging instruments.
Measurement Alternative nonmarketable equity securities accounted for under the Table 6.3 provides additional information about the impairment measurement alternative. Gains and losses related to these write-downs and observable price adjustments related to adjustments are also included in Table 6.2.
Table 6.3: Net Gains (Losses) from Measurement Alternative Equity Securities
Quarter ended March 31, (in millions) 2021 2020
Net gains (losses) recognized in earnings during the period:
Gross unrealized gains due to observable price changes
Impairment write-downs
Realized net gains from sale
$ 225
(12)
—
222
(354)
2
Total net gains recognized during the period $ 213 (130)
Table 6.4 presents cumulative carrying value adjustments to nonmarketable equity securities accounted for under the measurement alternative that were still held at the end of each reporting period presented.
Table 6.4: Measurement Alternative Cumulative Gains (Losses)
(in millions) Mar 31,
2020 Dec 31,
2020
Cumulative gains (losses):
Gross unrealized gains due to observable price changes $ 2,581 2,356
Gross unrealized losses due to observable price changes (25) (25)
Impairment write-downs (981) (969)
Wells Fargo & Company 90
Note 7: Other Assets
Table 7.1 presents the components of other assets.
Table 7.1: Other Assets
(in millions) Mar 31,
2021 Dec 31,
2020
Corporate/bank-owned life insurance
Accounts receivable
Interest receivable:
$ 20,446
28,065
20,380
38,116
AFS and HTM debt securities
Loans
Trading and other
Customer relationship and other amortizedintangibles
Foreclosed assets:
1,371
2,472
470
308
1,368
2,838
415
328
Residential real estate 58 73
Other 82 86
Operating lease assets (lessor)
Operating lease ROU assets (lessee)
Due from customers on acceptances
Other
7,098
4,137
227
13,378
7,391
4,306
268
11,768
Total other assets $ 78,112 87,337
Wells Fargo & Company 91
Note 8: Securitizations and Variable Interest Entities
Involvement with Variable Interest Entities (VIEs) In the normal course of business, we enter into various types of on- and off-balance sheet transactions with special purpose entities (SPEs), which are corporations, trusts, limited liability companies or partnerships that are established for a limited purpose. SPEs are often formed in connection with securitization transactions whereby financial assets are transferred to an SPE. SPEs formed in connection with securitization transactions are generally considered variable interest entities (VIEs). The VIE may alter the risk profile of the asset by entering into derivative transactions or obtaining credit support, and issues various forms of interests in those assets to investors. When we transfer financial assets from our consolidated balance sheet to a VIE in connection with a securitization, we typically receive cash and sometimes other interests in the VIE as proceeds for the assets we transfer. In certain transactions with VIEs, we may retain the right to service the transferred assets and repurchase the transferred assets if the outstanding balance of the assets falls below the level at which the cost to service the assets exceed the benefits. In addition, we may purchase the right to service loans transferred to a VIE by a third party.
In connection with our securitization or other VIE activities, we have various forms of ongoing involvement with VIEs, which may include: • underwriting securities issued by VIEs and subsequently
making markets in those securities; • providing credit enhancement on securities issued by VIEs
through the use of letters of credit or financial guarantees; • entering into other derivative contracts with VIEs; • holding senior or subordinated interests in VIEs; • acting as servicer or investment manager for VIEs; • providing administrative or trustee services to VIEs; and • providing seller financing to VIEs.
Loan Sales and Securitization Activity We periodically transfer consumer and commercial loans and other types of financial assets in securitization and whole loan sale transactions.
MORTGAGE LOANS SOLD TO U.S. GOVERNMENT SPONSORED ENTITIES AND TRANSACTIONS WITH GINNIE MAE In the normal course of business we sell originated and purchased residential and commercial mortgage loans to government-sponsored entities (GSEs). These loans are generally transferred into securitizations sponsored by the GSEs, which provide certain credit guarantees to investors and servicers. We also transfer mortgage loans into securitizations pursuant to Government National Mortgage Association (GNMA) guidelines which are insured by the Federal Housing Administration (FHA) or guaranteed by the Department of Veterans Affairs (VA). Mortgage loans eligible for securitization with the GSEs or GNMA are considered conforming loans. The GSEs or GNMA design the structure of these securitizations, sponsor the involved VIEs, and have power over the activities most significant to the VIE.
We account for loans transferred in conforming mortgage loan securitization transactions as sales and do not consolidate the VIEs as we are not the primary beneficiary. In exchange for the transfer of loans, we typically receive securities issued by the VIEs which we sell to third parties for cash or hold for investment purposes as HTM or AFS securities. We also retain servicing rights on the transferred loans. As a servicer, we retain the option
to repurchase loans from GNMA loan securitization pools, which becomes exercisable when three scheduled loan payments remain unpaid by the borrower. During the quarters ended March 31, 2021 and 2020, we repurchased loans of $1.9 billion and $1.5 billion, respectively, which predominantly represented repurchases of government insured loans. We recorded assets and related liabilities of $133 million and $176 million at March 31, 2021, and December 31, 2020, respectively, where we did not exercise our option to repurchase eligible loans.
Upon transfers of loans, we also provide indemnification for losses incurred due to material breaches of contractual representations and warranties, as well as other recourse arrangements. At March 31, 2021, and December 31, 2020, our liability associated with these provisions was $209 million and $221 million, respectively, and the maximum exposure to loss was $13.4 billion and $13.7 billion, respectively.
Off-balance sheet mortgage loans sold or securitized presented in Table 8.5 are predominantly loans securitized by the GSEs and GNMA. See Note 9 (Mortgage Banking Activities) for additional information about residential and commercial servicing rights, advances and servicing fees. Substantially all residential servicing activity is related to assets transferred to GSE and GNMA securitizations.
NONCONFORMING MORTGAGE LOAN SECURITIZATIONS In the normal course of business, we sell nonconforming residential and commercial mortgage loans in securitization transactions that we design and sponsor. Nonconforming mortgage loan securitizations do not involve a government credit guarantee, and accordingly, beneficial interest holders are subject to credit risk of the underlying assets held by the securitization VIE. We typically originate the transferred loans , account for the transfers as sales and do not consolidate the VIE. We also typically retain the right to service the loans and may hold other beneficial interests issued by the VIEs, such as debt securities held for investment purposes. Our servicing role related to nonconforming commercial mortgage loan securitizations is limited to primary or master servicer and the most significant decisions impacting the performance of the VIE are generally made by the special servicer or the controlling class security holder. For our residential nonconforming mortgage loan securitizations accounted for as sales, we either do not hold variable interests that we consider potentially significant or are not the primary servicer for a majority of the VIE assets.
WHOLE LOAN SALE TRANSACTIONS We also sell whole loans to VIEs where we have continuing involvement in the form of financing. We account for these transfers as sales, and do not consolidate the VIEs as we do not have the power to direct the most significant activities of the VIEs.
Table 8.1 presents information about transfers of assets during the period for which we recorded the transfers as sales and have continuing involvement with the transferred assets. In connection with these transfers, we received proceeds and recorded servicing assets, securities, and loans. Substantially all transfers were related to residential mortgage securitizations with the GSEs or GNMA and resulted in no gain or loss because the loans were already measured at fair value on a recurring basis. Each of these interests are initially measured at fair value. Servicing rights are classified as Level 3 measurements, and generally securities are classified as Level 2.
Wells Fargo & Company 92
Table 8.1: Transfers with Continuing Involvement
2021 2020
Residential Commercial Residential Commercial (in millions) mortgages mortgages mortgages mortgages
Quarter ended March 31, Asset balances sold $ 40,586 3,191 38,385 2,728 Proceeds from transfer (1) 40,691 3,282 38,420 2,797
(1) Represents cash proceeds and the fair value of non-cash beneficial interests recognized at securitization settlement. Prior periods have been revised to conform with the current period presentation. (2) Represents assets or liabilities recognized at securitization settlement date related to our continuing involvement in the transferred assets. (3) Represents debt securities obtained at securitization settlement held for investment purposes that are classified as available-for-sale or held-to-maturity, which predominantly relate to agency
securities. Excludes trading debt securities held temporarily for market-marking purposes, which are sold to third parties at or shortly after securitization settlement, of $6.8 billion and $7.7 billion, during the quarters ended March 31, 2021 and 2020, respectively.
In the normal course of business we purchase certain non-agency securities at initial securitization or subsequently in the secondary market. We also provide seller financing in the form of loans. During the quarters ended March 31, 2021 and 2020, we received cash flows of $75 million and $73 million, respectively, predominantly related to principal and interest payments on these securities and loans.
Table 8.2 presents the key weighted-average assumptions we used to initially measure residential MSRs recognized during the periods presented.
Table 8.2: Residential Mortgage Servicing Rights
2021 2020
Quarter ended March 31, Prepayment speed (1) 14.4 % 12.7 Discount rate 6.0 6.5 Cost to service ($ per loan) (2) $ 82 91
(1) The prepayment speed assumption for residential MSRs includes a blend of prepayment speeds and default rates. Prepayment speed assumptions are influenced by mortgage interest rate inputs as well as our estimation of drivers of borrower behavior.
(2) Includes costs to service and unreimbursed foreclosure costs, which can vary period to period due to changes in model assumptions and the mix of modified government-guaranteed loans sold to GNMA.
See Note 15 (Fair Values of Assets and Liabilities) and Note 9 (Mortgage Banking Activities) for additional information on key economic assumptions for residential MSRs.
SALE OF STUDENT LOAN PORTFOLIO In first quarter 2021, we sold $5.6 billion of student loans, servicing-released. We received $5.8 billion in proceeds from the sale and recognized a $208 million gain which is included in other noninterest income on our consolidated statement of income. In connection with the sale, we provided $2.2 billion of collateralized loan financing to a third-party sponsored VIE. The loan is measured at amortized cost and is classified in loans on the consolidated balance sheet. The collateral supporting our loan includes the student loans we sold. We do not consolidate the VIE as we do not have power over the significant activities of the entity. Substantially all of the remaining portfolio was sold in second quarter 2021.
RESECURITIZATION ACTIVITIES We enter into resecuritization transactions as part of our trading activities to accommodate the investment and risk management activities of our customers. In our resecuritization transactions, we transfer trading debt securities to VIEs in exchange for new beneficial interests that are sold to third parties at or shortly after securitization settlement. This activity is performed for customers seeking a specific return or risk profile. Substantially all of our transactions involve the resecuritization of conforming mortgage-backed securities issued by the GSEs or GNMA. We do not consolidate the resecuritization VIEs as we share in the decision-making power with third parties and do not hold significant economic interests in the VIEs other than for market-making activities. Table 8.3 presents information about assets transferred to re-securitization VIEs and Table 8.4 presents information about our resecuritization VIEs.
Note 8: Securitizations and Variable Interest Entities (continued)
Off-Balance Sheet Loans Table 8.5 presents information about the principal balances of off-balance sheet loans that were sold or securitized, including residential mortgage loans sold to the GSEs, GNMA and other investors, for which we have some form of continuing involvement (including servicer). Delinquent loans include loans 90 days or more past due and loans in bankruptcy, regardless of delinquency status. In accordance with applicable servicing
Table 8.5: Off-Balance Sheet Loans Sold or Securitized
guidelines, delinquency status continues to advance for loans with COVID-related payment deferrals. For loans sold or securitized where servicing is our only form of continuing involvement, we generally experience a loss only if we were required to repurchase a delinquent loan or foreclosed asset due to a breach in representations and warranties associated with our loan sale or servicing contracts.
Net charge-offs (2)
Delinquent loans and foreclosed Total loans assets (1) Quarter ended March 31,
(in millions) Mar 31, 2021 Dec 31, 2020 Mar 31, 2021 Dec 31, 2020 2021 2020
Commercial $ 114,247 114,134 1,712 2,217 115 71
Residential 767,216 818,886 25,146 29,962 6 31
Total off-balance sheet sold or securitized loans (3) $ 881,463 933,020 26,858 32,179 121 102
(1) Includes $242 million and $394 million of commercial foreclosed assets and $166 million and $204 million of residential foreclosed assets at March 31, 2021, and December 31, 2020, respectively. (2) Net charge-offs exclude loans sold to FNMA, FHLMC and GNMA as we do not service or manage the underlying real estate upon foreclosure and, as such, do not have access to net charge-off
information (3) At March 31, 2021, and December 31, 2020, the table includes total loans of $813.1 billion and $864.8 billion, delinquent loans of $23.9 billion and $28.5 billion, and foreclosed assets of $121 million
and $152 million, respectively, for FNMA, FHLMC and GNMA.
Transactions with Unconsolidated VIEs MORTGAGE LOAN SECURITIZATIONS Table 8.6 includes nonconforming mortgage loan securitizations where we originate and transfer the loans to the unconsolidated securitization VIEs that we sponsor. For additional information about these VIEs, see the “Loan Sales and Securitization Activity” section within this Note. Nonconforming mortgage loan securitizations also include commercial mortgage loan securitizations sponsored by third parties where we did not originate or transfer the loans but serve as master servicer and invest in securities that could be potentially significant to the VIE.
Conforming loan securitization and resecuritization transactions involving the GSEs and GNMA are excluded from Table 8.6 because we are not the sponsor or we do not have power over the activities most significant to the VIEs. Additionally, due to the nature of the guarantees provided by the GSEs and the FHA and VA, our credit risk associated with these VIEs is limited. For additional information about conforming mortgage loan securitizations and resecuritizations, see the “Loan Sales and Securitization Activity” and "Resecuritization Activities" sections within this Note.
TAX CREDIT STRUCTURES We co-sponsor and make investments in affordable housing and sustainable energy projects that are designed to generate a return primarily through the realization of federal tax credits. The projects are typically managed by project sponsors who have the power over the VIE’s assets. In some instances, our investments in these structures may require that we fund future capital commitments at the discretion of the project sponsors.
COMMERCIAL REAL ESTATE LOANS We transfer purchased industrial development bonds and GSE credit enhancements to VIEs in exchange for beneficial interests. We own all of the beneficial interests and may also service the underlying mortgages that serve as collateral to the bonds. Prior to first quarter 2021, we consolidated these VIEs as we controlled the key decisions. During first quarter 2021, we amended the structures such that we no longer control the key decisions of the VIEs. The GSEs have the power to direct the servicing and workout activities of the VIE in the event of a default. As a result,
we deconsolidated the VIEs during first quarter 2021, and recognized the beneficial interests at fair value on our consolidated balance sheet.
OTHER VIE STRUCTURES We engage in various forms of structured finance arrangements with other VIEs, including collateralized debt obligations, asset-backed finance structures and other securitizations collateralized by asset classes other than mortgages. Collateral may include rental properties, asset-backed securities, student loans, mortgage loans and auto loans. We may participate in structuring or marketing the arrangements, as well as provide financing, service one or more of the underlying assets, or enter into derivatives with the VIEs. We may also receive fees for those services. We are not the primary beneficiary of these structures because we do not have power to direct the most significant activities of the VIEs.
Table 8.6 provides a summary of our exposure to the unconsolidated VIEs described above, which includes investments in securities, loans, guarantees, liquidity agreements, commitments and certain derivatives. We exclude certain transactions with unconsolidated VIEs when our continuing involvement is temporary or administrative in nature or insignificant in size.
In Table 8.6, “Total VIE assets” represents the remaining principal balance of assets held by unconsolidated VIEs using the most current information available. For VIEs that obtain exposure to assets synthetically through derivative instruments, the notional amount of the derivative is included in the asset balance. “Carrying value” is the amount in our consolidated balance sheet related to our involvement with the unconsolidated VIEs. “Maximum exposure to loss” is determined as the carrying value of our investment in the VIEs excluding the unconditional repurchase options that have not been exercised, plus the remaining undrawn liquidity and lending commitments, the notional amount of net written derivative contracts, and generally the notional amount of, or stressed loss estimate for, other commitments and guarantees.
Debt, guarantees and other commitments include amounts related to loans sold that we may be required to repurchase, or otherwise indemnify or reimburse the investor or insurer for losses incurred, due to material breach of contractual
Wells Fargo & Company 94
representations and warranties as well as other retained recourse which we believe the possibility is extremely remote, such as arrangements. The maximum exposure to loss for material where the value of our interests and any associated collateral breach of contractual representations and warranties represents declines to zero, without any consideration of recovery or offset a stressed case estimate we utilize for determining stressed case from any economic hedges. Accordingly, this disclosure is not an regulatory capital needs and is considered to be a remote indication of expected loss. scenario.
“Maximum exposure to loss” represents estimated loss that would be incurred under severe, hypothetical circumstances, for
Table 8.6: Unconsolidated VIEs
Carrying value – asset (liability)
Total Debt Equity All other Debt and other (in millions) VIE assets Loans securities (1) securities assets (2) liabilities Net assets
(1) Includes $267 million and $310 million of securities classified as trading at March 31, 2021, and December 31, 2020, respectively. (2) All other assets includes mortgage servicing rights, derivative assets, and other assets (predominantly servicing advances). (3) Prior period has been revised to conform with the current period presentation to reflect the carrying value of loans separately from all other assets.
Wells Fargo & Company
432
95
Note 8: Securitizations and Variable Interest Entities (continued)
Consolidated VIEs We consolidate VIEs where we are the primary beneficiary. We are the primary beneficiary of the following structure types:
COMMERCIAL AND INDUSTRIAL LOANS AND LEASES We securitize dealer floor plan loans and leases in a revolving master trust entity and hold the subordinated notes and residual equity interests. As servicer and residual interest holder, we control the key decisions of the trust and consolidate the entity. The total VIE assets held by the master trust represent a majority of the total VIE assets presented for this category in Table 8.7. In a separate transaction structure, we also provide the majority of debt and equity financing to an SPE that engages in lending and leasing to specific vendors and service the underlying collateral.
OTHER VIE STRUCTURES Other VIEs are primarily related to municipal tender option bond (MTOB) transactions and nonconforming mortgage loan securitizations that we sponsor. MTOBs are vehicles to finance the purchase of municipal bonds through the issuance of short-term debt to investors. Our involvement with MTOBs includes serving as the residual interest
Table 8.7: Transactions with Consolidated VIEs
holder, which provides control over the key decisions of the VIE, as well as the remarketing agent or liquidity provider related to the debt issued to investors. We also securitize nonconforming mortgage loans, in which our involvement includes servicer of the underlying assets and holder of subordinate or senior securities issued by the VIE.
Table 8.7 presents a summary of financial assets and liabilities of our consolidated VIEs. The carrying value represents assets and liabilities recorded on our consolidated balance sheet. Carrying values of assets are presented using GAAP measurement methods, which may include fair value, credit impairment or other adjustments, and therefore in some instances will differ from “Total VIE assets.” For VIEs that obtain exposure synthetically through derivative instruments, the notional amount of the derivative is included in “Total VIE assets.”
On our consolidated balance sheet, we separately disclose (1) the consolidated assets of certain VIEs that can only be used to settle the liabilities of those VIEs, and (2) the consolidated liabilities of certain VIEs for which the VIE creditors do not have recourse to Wells Fargo.
Carrying value – asset (liability)
Total Debt All other Long-term All other (in millions) VIE assets Loans securities (1) assets (2) debt liabilities (3)
March 31, 2021
Commercial and industrial loans and leases $ 6,907 5,002 — 188 — (192)
Commercial real estate loans (4) — — — — — —
Other 1,597 480 965 79 (192) (899)
Total consolidated VIEs $ 8,504 5,482 965 267 (192) (1,091)
December 31, 2020
Commercial and industrial loans and leases $ 6,987 5,005 — 223 — (200)
Total consolidated VIEs $ 13,983 10,869 967 310 (203) (1,100)
(1) Includes $269 million and $269 million of securities classified as trading at March 31, 2021, and December 31, 2020, respectively. (2) All other assets includes cash and due from banks, Interest-earning deposits with banks, derivative assets, equity securities, and other assets. (3) All other liabilities includes short-term borrowings, derivative liabilities, and accrued expenses and other liabilities. (4) For structure description, see the "Transactions with Unconsolidated VIEs" section within this Note. These consolidated VIEs were deconsolidated in first quarter 2021.
Other Transactions In addition to the transactions included in the previous tables, we have used wholly-owned trust preferred security VIEs to issue debt securities or preferred equity exclusively to third-party investors. As the sole assets of the VIEs are receivables from us, we do not consolidate the VIEs even though we own all of the voting equity shares of the VIEs, have fully guaranteed the obligations of the VIEs, and may have the right to redeem the third-party securities under certain circumstances. In our consolidated balance sheet we reported the debt securities issued to the VIEs as long-term junior subordinated debt with a carrying value of $710 million and $704 million at March 31, 2021, and December 31, 2020, respectively. See Note 16 (Preferred Stock) for additional information about trust preferred securities.
Certain money market funds are also excluded from the previous tables because they are exempt from the consolidation analysis. We voluntarily waived a portion of our management fees for these money market funds to maintain a minimum level of daily net investment income. The amount of fees waived was not significant for first quarter 2021 or 2020.
Wells Fargo & Company 96
Note 9: Mortgage Banking Activities
Mortgage banking activities consist of residential and commercial mortgage originations, sales and servicing.
We apply the amortization method to commercial MSRs and apply the fair value method to residential MSRs. The amortized
Table 9.1: Analysis of Changes in Fair Value MSRs
cost of commercial MSRs was $1.3 billion and $1.4 billion with an estimated fair value of $1.7 billion and $1.5 billion at March 31, 2021, and March 31, 2020, respectively. Table 9.1 presents the changes in MSRs measured using the fair value method.
Quarter ended March 31,
(in millions) 2021 2020
Fair value, beginning of year $ 6,125 11,517
Servicing from securitizations or asset transfers (1) 406 461
Sales and other (2) (1) (31)
Net additions 405 430
Changes in fair value:
Due to valuation inputs or assumptions:
Mortgage interest rates (3) 1,630 (3,022)
Servicing and foreclosure costs (4) 9 (73)
Discount rates 47 27
Prepayment estimates and other (5) (95) (189)
Net changes in valuation inputs or assumptions 1,591 (3,257)
Changes due to collection/realization of expected cash flows (6) (585) (564)
Total changes in fair value 1,006 (3,821)
Fair value, end of period $ 7,536 8,126
(1) Includes impacts associated with exercising cleanup calls on securitizations and our right to repurchase delinquent loans from GNMA loan securitization pools. MSRs may increase upon repurchase due to servicing liabilities associated with these delinquent GNMA loans.
(2) Includes sales and transfers of MSRs, which can result in an increase in MSRs if related to portfolios with servicing liabilities. (3) Includes prepayment speed changes as well as other valuation changes due to changes in mortgage interest rates. (4) Includes costs to service and unreimbursed foreclosure costs. (5) Represents other changes in valuation model inputs or assumptions including prepayment speed estimation changes that are independent of mortgage interest rate changes. (6) Represents the reduction in the MSR fair value for the cash flows expected to be collected during the period, net of income accreted due to the passage of time.
Table 9.2 provides key economic assumptions and sensitivity rights resulting from the transfer of loans. See Note 15 (Fair of the current fair value of residential MSRs to immediate Values of Assets and Liabilities) for additional information on key adverse changes in those assumptions. Amounts for residential economic assumptions for residential MSRs. MSRs include purchased servicing rights as well as servicing
Table 9.2: Economic Assumptions and Sensitivity of Residential MSRs
($ in millions, except cost to service amounts) Mar 31,
2021 Dec 31,
2020
Fair value of interests held $ 7,536 6,125
Expected weighted-average life (in years) 4.5 3.7
Key economic assumptions:
Prepayment speed assumption 15.6 % 19.9
Impact on fair value from 10% adverse change $ 447 434
Impact on fair value from 25% adverse change 1,041 1,002
Discount rate assumption 6.1 % 5.8
Impact on fair value from 100 basis point increase $ 317 229
Impact on fair value from 200 basis point increase 608 440
Cost to service assumption ($ per loan) 115 130
Impact on fair value from 10% adverse change 181 181
Impact on fair value from 25% adverse change 452 454
The sensitivities in the preceding table are hypothetical and caution should be exercised when relying on this data. Changes in value based on variations in assumptions generally cannot be extrapolated because the relationship of the change in the assumption to the change in value may not be linear. Also, the effect of a variation in a particular assumption on the value of the other interests held is calculated independently without changing any other assumptions. In reality, changes in one factor may
result in changes in others, which might magnify or counteract the sensitivities.
Wells Fargo & Company 97
Note 9: Mortgage Banking Activities (continued)
We present the components of our managed servicing portfolio in Table 9.3 at unpaid principal balance for loans serviced and subserviced for others and at book value for owned loans serviced.
Table 9.3: Managed Servicing Portfolio
(in billions) Mar 31,
2021 Dec 31,
2020
Residential mortgage servicing:
Serviced and subserviced for others $ 804 859
Owned loans serviced 302 323
Total residential servicing 1,106 1,182
Commercial mortgage servicing:
Serviced and subserviced for others 581 583
Owned loans serviced 122 123 Total commercial servicing 703 706
Total managed servicing portfolio $ 1,809 1,888
Total serviced for others, excluding subserviced for others
MSRs as a percentage of loans serviced for others
Weighted average note rate (mortgage loans serviced for others)
$ 1,373 0.64 %
3.99
1,431 0.52
4.03
At March 31, 2021, and December 31, 2020, we had servicer advances, net of an allowance for uncollectible amounts, of $3.3 billion and $3.4 billion, respectively. As the servicer of loans for others, we advance certain payments of principal, interest, taxes, insurance, and default-related expenses which are generally reimbursed within a short timeframe from cash flows from the trust, GSEs, insurer or borrower. The credit risk related to these advances is limited since the reimbursement is generally senior to cash payments to investors. We also advance payments of taxes and insurance for our owned loans which are collectible
Table 9.4: Mortgage Banking Noninterest Income
from the borrower. We maintain an allowance for uncollectible amounts for advances on loans serviced for others that may not be reimbursed if the payments were not made in accordance with applicable servicing agreements or if the insurance or servicing agreements contain limitations on reimbursements. Servicing advances on owned loans are charged-off when deemed uncollectible.
Table 9.4 presents the components of mortgage banking noninterest income.
Quarter ended March 31,
(in millions) 2021 2020
Servicing fees:
Contractually specified servicing fees, late charges and ancillary fees $ 724 865
Unreimbursed direct servicing costs (1) (124) (107)
Servicing fees 600
Amortization (65) (66)
Changes due to collection/realization of expected cash flows (2) (A) (585) (564)
Net servicing fees (50)
Changes in fair value of MSRs due to valuation inputs or assumptions (3) (B) 1,591 (3,257)
Net derivative gains (losses) from economic hedges (4) (1,640) 3,400
Market-related valuation changes to MSRs, net of hedge results (49)
Total servicing income (loss), net (99) 271
Net gains on mortgage loan originations/sales (5) 1,425 108
Total mortgage banking noninterest income $ 1,326 379
Total changes in fair value of MSRs carried at fair value (A)+(B) $ 1,006 (3,821)
(1) Includes costs associated with foreclosures, unreimbursed interest advances to investors, and other interest costs. (2) Represents the reduction in the MSR fair value for the cash flows expected to be collected during the period, net of income accreted due to the passage of time. (3) Refer to the analysis of changes in fair value MSRs presented in Table 9.1 in this Note for more detail. (4) See Note 14 (Derivatives) for additional discussion and detail on economic hedges. (5) Includes net gains (losses) of $1.3 billion and $(929) million in first quarter 2021 and 2020, respectively, related to derivatives used as economic hedges of mortgage loans held for sale and derivative
loan commitments.
Wells Fargo & Company
758
128
143
98
Note 10: Intangible Assets
Table 10.1 presents the gross carrying value of intangible assets and accumulated amortization.
(1) Balances are excluded commencing in the period following full amortization. (2) Includes a $37 million valuation allowance recorded for amortized MSRs at both March 31, 2020, and December 31, 2020. See Note 9 (Mortgage Banking Activities) for additional information on
MSRs.
Table 10.2 provides the current year and estimated future asset balances at March 31, 2021. Future amortization expense amortization expense for amortized intangible assets. We based may vary from these projections. our projections of amortization expense shown below on existing
Table 10.2: Amortization Expense for Intangible Assets Customer
(in millions) Amortized MSRs relationship and
other intangibles Total
Three months ended March 31, 2021 (actual) $ 65 21 86
Estimate for the remainder of 2021 $ 184 61 245
Estimate for year ended December 31,
2022 218 68 286
2023 191 59 250
2024 166 48 214
2025 143 39 182
2026 109 32 141
In February 2021, we announced an agreement to sell Wells recognized a goodwill write-down related to the sale of a portion Fargo Asset Management and transferred the associated of the student loan portfolio. Table 10.3 shows the allocation of goodwill from the Wealth and Investment Management goodwill to our reportable operating segments. operating segment to Corporate. Also in first quarter 2021, we
March 31, 2021 $ 16,418 3,020 5,375 344 1,133 26,290
Wells Fargo & Company 99
Note 11: Guarantees and Other Commitments
Guarantees are contracts that contingently require us to make written options, recourse obligations, and other types of similar payments to a guaranteed party based on an event or a change in arrangements. Table 11.1 shows carrying value, maximum an underlying asset, liability, rate or index. Guarantees are exposure to loss on our guarantees and the related non-generally in the form of standby and direct pay letters of credit, investment grade amounts.
Table 11.1: Guarantees – Carrying Value and Maximum Exposure to Loss
Maximum exposure to loss Carrying Expires after Expires after value of one year three years Non-
obligation Expires in one through three through five Expires after investment (in millions) (asset) year or less years years five years Total grade
Direct pay letters of credit 18 2,256 2,746 531 39 5,572 1,102
Written options (1) (538) 12,735 7,972 889 58 21,654 13,394
Loans and LHFS sold with recourse (2) 33 177 819 1,870 9,723 12,589 10,332
Exchange and clearing house guarantees — — — — 5,510 5,510 —
Other guarantees and indemnifications (3) — 734 1 1 1,414 2,150 590
Total guarantees $ (331) 27,879 16,500 5,188 17,177 66,744 32,946
(1) Written options, which are in the form of derivatives, are also included in the derivative disclosures in Note 14 (Derivatives). Carrying value net asset position is a result of certain deferred premium option trades.
(2) Represent recourse provided, all to the GSEs, on loans sold under various programs and arrangements. (3) Includes indemnifications provided to certain third-party clearing agents. Estimated maximum exposure to loss was $277 million and $1.4 billion with related collateral of $2.0 billion and $1.2 billion
as of March 31, 2021 and December 31, 2020, respectively.
“Maximum exposure to loss” and “Non-investment grade” are required disclosures under GAAP. Maximum exposure to loss represents the estimated loss that would be incurred under an assumed hypothetical circumstance, despite what we believe is a remote possibility, where the value of our interests and any associated collateral declines to zero. Maximum exposure to loss estimates in Table 11.1 do not reflect economic hedges or collateral we could use to offset or recover losses we may incur under our guarantee agreements. Accordingly, this required disclosure is not an indication of expected loss. We believe the carrying value is more representative of our exposure to loss than maximum exposure to loss. The carrying value represents the fair value of the guarantee, if any, and also includes an ACL for guarantees, if applicable.
Non-investment grade represents those guarantees on which we have a higher risk of performance under the terms of the guarantee. If the underlying assets under the guarantee are non-investment grade (that is, an external rating that is below investment grade or an internal credit default grade that is equivalent to a below investment grade external rating), we consider the risk of performance to be high. Internal credit default grades are determined based upon the same credit policies that we use to evaluate the risk of payment or performance when making loans and other extensions of credit. Credit quality indicators we usually consider in evaluating risk of payments or performance are described in Note 4 (Loans and Related Allowance for Credit Losses).
MERCHANT PROCESSING SERVICES We provide debit and credit card transaction processing services through payment networks directly for merchants and as a sponsor for merchant processing servicers, including our joint venture with a third party that is accounted for as an equity method investment. In our role as the merchant acquiring bank, we have a potential obligation in connection with payment and delivery disputes between the merchant and the cardholder that are resolved in favor of the cardholder. If we are unable to collect the amounts from the merchant, we incur a loss for the refund to the cardholder. We are secondarily obligated to make a refund for transactions involving sponsored merchant processing servicers. We generally have a low likelihood of loss in connection with our merchant processing services because most products and services are delivered when purchased and amounts are generally refunded when items are returned to the merchant. In addition, we may reduce our risk in connection with these transactions by withholding future payments and requiring cash or other collateral. For first quarter 2021, we processed card transaction volume of $372.5 billion as a merchant acquiring bank, and related losses, including those from our joint venture entity, were immaterial.
Wells Fargo & Company 100
GUARANTEES OF SUBSIDIARIES In the normal course of business, the Parent may provide counterparties with guarantees related to its subsidiaries’ obligations. These obligations are included in the Company’s consolidated balance sheet or are reflected as off-balance sheet commitments, and therefore, the Parent has not recognized a separate liability for these guarantees.
The Parent fully and unconditionally guarantees the payment of principal, interest, and any other amounts that may be due on securities that its 100% owned finance subsidiary, Wells Fargo Finance LLC, may issue. These securities are not guaranteed by any other subsidiary of the Parent. The guaranteed liabilities were $1.8 billion and $2.3 billion at March 31, 2021, and December 31, 2020, respectively. These guarantees rank on parity with all of the Parent’s other unsecured and unsubordinated indebtedness. The assets of the Parent consist primarily of equity in its subsidiaries, and the Parent is a separate and distinct legal entity from its subsidiaries. As a result, the Parent’s ability to address claims of holders of these debt securities against the Parent under the guarantee depends on the Parent’s receipt of dividends, loan payments and other funds from its subsidiaries. If any of the Parent’s subsidiaries becomes insolvent, the direct creditors of that subsidiary will have a prior claim on that subsidiary’s assets. The rights of the Parent and the rights of the Parent’s creditors will be subject to that prior claim unless the Parent is also a direct creditor of that subsidiary. For additional information regarding other restrictions on the Parent’s ability to receive dividends, loan payments and other funds from its subsidiaries, see Note 23 (Regulatory Capital Requirements and Other Restrictions).
OTHER COMMITMENTS To meet the financing needs of our customers, we may enter into commitments to purchase debt and equity securities to provide capital for their funding, liquidity or other future needs. As of both March 31, 2021, and December 31, 2020, we had commitments to purchase debt securities of $18 million and commitments to purchase equity securities of $3.1 billion and $3.2 billion, respectively.
As part of maintaining our memberships in certain clearing organizations, we are required to stand ready to provide liquidity to sustain market clearing activity in the event unforeseen events occur or are deemed likely to occur. Certain of these obligations are guarantees of other members’ performance and accordingly are included in Table 11.1 in Other guarantees and indemnifications.
Also, we have commitments to purchase loans and securities under resale agreements from certain counterparties, including central clearing organizations. The amount of our unfunded contractual commitments was $8.7 billion and $12.0 billion as of March 31, 2021, and December 31, 2020, respectively.
Given the nature of these commitments, they are excluded from Table 4.4 (Unfunded Credit Commitments) in Note 4 (Loans and Related Allowance for Credit Losses).
Wells Fargo & Company 101
Note 12: Pledged Assets and Collateral
Pledged Assets Table 12.1 provides the carrying amount of on-balance sheet pledged assets and the fair value of other pledged collateral. Other pledged collateral is collateral we have received from third parties, have the right to repledge and is not recognized on our consolidated balance sheet.
TRADING RELATED ACTIVITY Our trading businesses may pledge debt and equity securities in connection with securities sold under agreements to repurchase (repurchase agreements) and securities lending arrangements. The collateral that we pledge related to our trading activities may include our own collateral as well as collateral that we have received from third parties and have the right to repledge. All of the trading activity pledged collateral is eligible to be repledged or sold by the secured party.
NON-TRADING RELATED ACTIVITY As part of our liquidity management strategy, we may pledge loans, debt securities, and
Table 12.1: Pledged Assets
other financial assets to secure trust and public deposits, borrowings and letters of credit from the Federal Home Loan Bank (FHLB) and the Board of Governors of the Federal Reserve System (FRB) and for other purposes as required or permitted by law or insurance statutory requirements. Substantially all of the non-trading activity pledged collateral is not eligible to be repledged or sold by the secured party.
VIE RELATED We pledge assets in connection with various types of transactions entered into with VIEs. These pledged assets can only be used to settle the liabilities of those entities.
We also have loans recorded on our consolidated balance sheet which represent certain delinquent loans that are eligible for repurchase from GNMA loan securitizations. See Note 8 (Securitizations and Variable Interest Entities) for additional information on consolidated VIE assets.
(in millions) Mar 31,
2021 Dec 31,
2020
Related to trading activities:
Repledged third-party owned debt and equity securities $ 51,214 44,765
Trading debt securities and other 20,805 19,572
Equity securities 716 470
Total pledged assets related to trading activities 72,735 64,807
Related to non-trading activities:
Loans 313,479 344,220
Debt securities:
Available-for-sale 52,487 57,289
Held-to-maturity 13,318 17,290
Other financial assets 727 230
Total pledged assets related to non-trading activities 380,011 419,029
Related to VIEs:
Consolidated VIE assets 6,714 12,146
Loans eligible for repurchase from GNMA securitizations 135 179
Total pledged assets related to VIEs 6,849 12,325
Total pledged assets $ 459,595 496,161
Securities Financing Activities We enter into resale and repurchase agreements and securities borrowing and lending agreements (collectively, “securities financing activities”) typically to finance trading positions (including securities and derivatives), acquire securities to cover short trading positions, accommodate customers’ financing needs, and settle other securities obligations. These activities are conducted through our broker-dealer subsidiaries and, to a lesser extent, through other bank entities. Our securities financing activities primarily involve high-quality, liquid securities such as U.S. Treasury securities and government agency securities and, to a lesser extent, less liquid securities, including equity securities, corporate bonds and asset-backed securities. We account for these transactions as collateralized financings in which we typically receive or pledge securities as collateral. We believe these financing transactions generally do not have material credit risk given the collateral provided and the related monitoring processes.
OFFSETTING OF SECURITIES FINANCING ACTIVITIES Table 12.2 presents resale and repurchase agreements subject to master repurchase agreements (MRA) and securities borrowing and lending agreements subject to master securities lending agreements (MSLA). Collateralized financings, and those with a single counterparty, are presented net on our consolidated balance sheet, provided certain criteria are met that permit balance sheet netting. Substantially all transactions subject to these agreements do not meet those criteria and thus are not eligible for balance sheet netting.
Collateral we pledged consists of non-cash instruments, such as securities or loans, and is not netted on the consolidated balance sheet against the related liability. Collateral we received includes securities or loans and is not recognized on our consolidated balance sheet. Collateral pledged or received may be increased or decreased over time to maintain certain contractual thresholds, as the assets underlying each arrangement fluctuate in value. Generally, these agreements require collateral to exceed the asset or liability recognized on the balance sheet. The following table includes the amount of
Wells Fargo & Company 102
collateral pledged or received related to exposures subject to In addition to the amounts included in Table 12.2, we also enforceable MRAs or MSLAs. While these agreements are have balance sheet netting related to derivatives that is disclosed typically over-collateralized, U.S. GAAP requires disclosure in this in Note 14 (Derivatives). table to limit the reported amount of such collateral to the amount of the related recognized asset or liability for each counterparty.
Table 12.2: Offsetting – Securities Financing Activities Mar 31, Dec 31,
(in millions) 2021 2020
Assets:
Resale and securities borrowing agreements
Gross amounts recognized $ 113,611 92,446
Gross amounts offset in consolidated balance sheet (1) (16,480) (11,513)
Net amounts in consolidated balance sheet (2) 97,131 80,933
Collateral not recognized in consolidated balance sheet (3) (96,386) (80,158)
Net amount (4) $ 745 775
Liabilities:
Repurchase and securities lending agreements
Gross amounts recognized $ 63,062 57,622
Gross amounts offset in consolidated balance sheet (1) (16,480) (11,513)
Net amounts in consolidated balance sheet (5) 46,582 46,109
Collateral pledged but not netted in consolidated balance sheet (6) (46,371) (45,819)
Net amount (4) $ 211 290
(1) Represents recognized amount of resale and repurchase agreements with counterparties subject to enforceable MRAs that have been offset in the consolidated balance sheet. (2) Includes $79.4 billion and $65.6 billion classified on our consolidated balance sheet in federal funds sold and securities purchased under resale agreements at March 31, 2021, and December 31,
2020, respectively. Also includes securities purchased under long-term resale agreements (generally one year or more) classified in loans, which totaled $17.7 billion and $15.3 billion, at March 31, 2021, and December 31, 2020, respectively.
(3) Represents the fair value of collateral we have received under enforceable MRAs or MSLAs, limited in the table above to the amount of the recognized asset due from each counterparty. At March 31, 2021, and December 31, 2020, we have received total collateral with a fair value of $131.2 billion and $108.5 billion, respectively, all of which we have the right to sell or repledge. These amounts include securities we have sold or repledged to others with a fair value of $47.2 billion and $36.1 billion at March 31, 2021, and December 31, 2020, respectively.
(4) Represents the amount of our exposure (assets) or obligation (liabilities) that is not collateralized and/or is not subject to an enforceable MRA or MSLA. (5) Amount is classified in short-term borrowings on our consolidated balance sheet. (6) Represents the fair value of collateral we have pledged, related to enforceable MRAs or MSLAs, limited in the table above to the amount of the recognized liability owed to each counterparty. At
March 31, 2021, and December 31, 2020, we have pledged total collateral with a fair value of $64.6 billion and $59.2 billion, respectively, substantially all of which may be sold or repledged by the counterparty.
REPURCHASE AND SECURITIES LENDING AGREEMENTS Securities sold under repurchase agreements and securities lending arrangements are effectively short-term collateralized borrowings. In these transactions, we receive cash in exchange for transferring securities as collateral and recognize an obligation to reacquire the securities for cash at the transaction’s maturity. These types of transactions create risks, including (1) the counterparty may fail to return the securities at maturity, (2) the fair value of the securities transferred may decline below the amount of our obligation to reacquire the securities, and therefore create an obligation for us to pledge additional amounts, and (3) the counterparty may accelerate the maturity on demand, requiring us to reacquire the security prior to contractual maturity. We attempt to mitigate these risks in various ways. Our collateral primarily consists of highly liquid securities. In addition, we underwrite and monitor the financial strength of our counterparties, monitor the fair value of collateral pledged relative to contractually required repurchase amounts, and monitor that our collateral is properly returned through the clearing and settlement process in advance of our cash repayment. Table 12.3 provides the gross amounts recognized on the consolidated balance sheet (before the effects of offsetting) of our liabilities for repurchase and securities lending agreements disaggregated by underlying collateral type.
Wells Fargo & Company 103
Note 12: Pledged Assets and Collateral (continued)
Table 12.3: Gross Obligations by Underlying Collateral Type
(in millions) Mar 31,
2021 Dec 31,
2020
Repurchase agreements:
Securities of U.S. Treasury and federal agencies $ 28,507 22,922
Securities of U.S. States and political subdivisions 9 4
Federal agency mortgage-backed securities 12,678 15,353
Non-agency mortgage-backed securities 1,007 1,069
Corporate debt securities 10,291 9,944
Asset-backed securities 1,072 1,054
Equity securities 1,211 1,500
Other 683 336
Total repurchases 55,458 52,182
Securities lending arrangements:
Securities of U.S. Treasury and federal agencies 19 64
Federal agency mortgage-backed securities 53 23
Corporate debt securities 38 79
Equity securities (1) 7,375 5,189
Other 119 85
Total securities lending 7,604 5,440
Total repurchases and securities lending $ 63,062 57,622
(1) Equity securities are generally exchange traded and represent collateral received from third parties that has been repledged. We received the collateral through either margin lending agreements or contemporaneous securities borrowing transactions with other counterparties.
Table 12.4 provides the contractual maturities of our gross obligations under repurchase and securities lending agreements.
Table 12.4: Contractual Maturities of Gross Obligations Overnight/ Total gross
(in millions) continuous Up to 30 days 30-90 days >90 days obligation
Total repurchases and securities lending (1) $ 41,636 5,651 5,450 4,885 57,622
(1) Securities lending is executed under agreements that allow either party to terminate the transaction without notice, while repurchase agreements have a term structure to them that technically matures at a point in time. The overnight/continuous repurchase agreements require election of both parties to roll the trade rather than the election to terminate the arrangement as in securities lending.
Wells Fargo & Company 104
Note 13: Legal Actions
Wells Fargo and certain of our subsidiaries are involved in a number of judicial, regulatory, governmental, arbitration, and other proceedings or investigations concerning matters arising from the conduct of our business activities, and many of those proceedings and investigations expose Wells Fargo to potential financial loss. These proceedings and investigations include actions brought against Wells Fargo and/or our subsidiaries with respect to corporate-related matters and transactions in which Wells Fargo and/or our subsidiaries were involved. In addition, Wells Fargo and our subsidiaries may be requested to provide information or otherwise cooperate with government authorities in the conduct of investigations of other persons or industry groups.
Although there can be no assurance as to the ultimate outcome, Wells Fargo and/or our subsidiaries have generally denied, or believe we have a meritorious defense and will deny, liability in all significant legal actions pending against us, including the matters described below, and we intend to defend vigorously each case, other than matters we describe as having settled. We establish accruals for legal actions when potential losses associated with the actions become probable and the costs can be reasonably estimated. For such accruals, we record the amount we consider to be the best estimate within a range of potential losses that are both probable and estimable; however, if we cannot determine a best estimate, then we record the low end of the range of those potential losses. The actual costs of resolving legal actions may be substantially higher or lower than the amounts accrued for those actions.
ATM ACCESS FEE LITIGATION In October 2011, plaintiffs filed a putative class action, Mackmin, et al. v. Visa, Inc. et al., against Wells Fargo & Company, Wells Fargo Bank, N.A., Visa, MasterCard, and several other banks in the United States District Court for the District of Columbia. Plaintiffs allege that the Visa and MasterCard requirement that if an ATM operator charges an access fee on Visa and MasterCard transactions, then that fee cannot be greater than the access fee charged for transactions on other networks, violates antitrust rules. Plaintiffs seek treble damages, restitution, injunctive relief, and attorneys’ fees where available under federal and state law. Two other antitrust cases that make similar allegations were filed in the same court, but these cases did not name Wells Fargo as a defendant. On February 13, 2013, the district court granted defendants’ motions to dismiss the three actions. Plaintiffs appealed the dismissals and, on August 4, 2015, the United States Court of Appeals for the District of Columbia Circuit vacated the district court’s decisions and remanded the three cases to the district court for further proceedings. On June 28, 2016, the United States Supreme Court granted defendants’ petitions for writ of certiorari to review the decisions of the United States Court of Appeals for the District of Columbia. On November 17, 2016, the United States Supreme Court dismissed the petitions as improvidently granted, and the three cases returned to the district court for further proceedings. The Company has entered into an agreement pursuant to which the Company will pay $20.8 million to resolve the cases, subject to court approval.
AUTOMOBILE LENDING MATTERS On April 20, 2018, the Company entered into consent orders with the Office of the Comptroller of the Currency (OCC) and the Consumer Financial Protection Bureau (CFPB) to resolve, among other things, investigations by the agencies into the Company’s compliance risk management
program and its past practices involving certain automobile collateral protection insurance (CPI) policies and certain mortgage interest rate lock extensions. The consent orders require remediation to customers and the payment of a total of $1.0 billion in civil money penalties to the agencies. In July 2017, the Company announced a plan to remediate customers who may have been financially harmed due to issues related to automobile CPI policies purchased through a third-party vendor on their behalf. Multiple putative class actions alleging, among other things, unfair and deceptive practices relating to these CPI policies, have been filed against the Company and consolidated into one multi-district litigation in the United States District Court for the Central District of California. The Company has reached an agreement to resolve the multi-district litigation pursuant to which the Company has agreed to pay, consistent with its remediation obligations under the consent orders, approximately $693 million in remediation to customers with CPI policies placed between October 15, 2005, and September 30, 2016. The settlement amount is not incremental to the Company’s remediation obligations under the consent orders, but instead encompasses those obligations, including remediation payments to date. The settlement amount is subject to change as the Company finalizes its remediation activity under the consent orders. In addition, the Company has agreed to contribute $1 million to a common fund for the class. The district court granted final approval of the settlement on November 21, 2019. Shareholders also filed a putative securities fraud class action against the Company and its executive officers alleging material misstatements and omissions of CPI-related information in the Company’s public disclosures. In January 2020, the court dismissed this action as to all defendants except the Company and a former executive officer and limited the action to two alleged misstatements. In addition, the Company is subject to a class action in the United States District Court for the Central District of California alleging that customers are entitled to refunds related to the unused portion of guaranteed automobile protection (GAP) waiver or insurance agreements between the customer and dealer and, by assignment, the lender. Allegations related to the CPI and GAP programs are among the subjects of a shareholder derivative lawsuit pending in the United States District Court for the Northern District of California. These and other issues related to the origination, servicing, and collection of consumer auto loans, including related insurance products, have also subjected the Company to formal or informal inquiries, investigations, or examinations from federal and state government agencies, including the CFPB. In December 2018, the Company entered into an agreement with all 50 state Attorneys General and the District of Columbia to resolve an investigation into the Company’s retail sales practices, CPI and GAP, and mortgage interest rate lock matters, pursuant to which the Company paid $575 million.
COMMERCIAL LENDING SHAREHOLDER LITIGATION In October and November 2020, plaintiffs filed two putative securities fraud class actions in the United States District Court for the Northern District of California alleging that the Company and certain of its former executive officers made false and misleading statements or omissions regarding, among other things, the Company’s commercial lending underwriting practices, the credit quality of its commercial credit portfolios, and the value of its commercial loans, collateralized loan obligations and commercial mortgage-backed securities.
Wells Fargo & Company 105
Note 13: Legal Actions (continued)
CONSENT ORDER DISCLOSURE LITIGATION Wells Fargo shareholders have brought a putative securities fraud class action in the United States District Court for the Southern District of New York alleging that the Company and certain of its current and former executive officers and directors made false or misleading statements regarding the Company’s efforts to comply with the February 2018 consent order with the Federal Reserve Board and the April 2018 consent orders with the CFPB and OCC. Allegations related to the Company’s efforts to comply with these three consent orders are also among the subjects of a shareholder derivative lawsuit pending in the United States District Court for the Northern District of California.
CONSUMER DEPOSIT ACCOUNT RELATED REGULATORY INVESTIGATIONS The CFPB is conducting an investigation into whether customers were unduly harmed by the Company’s historical practices associated with the freezing (and, in many cases, closing) of consumer deposit accounts after the Company detected suspected fraudulent activity (by third parties or account holders) that affected those accounts. The CFPB is also investigating certain of the Company's past disclosures to customers regarding the minimum qualifying debit card usage required for customers to receive a waiver of monthly service fees on certain consumer deposit accounts.
CORONAVIRUS AID, RELIEF, AND ECONOMIC SECURITY ACT/ PAYCHECK PROTECTION PROGRAM Plaintiffs filed putative class actions in various federal courts against the Company. The actions sought damages and injunctive relief related to the Company’s offering of Paycheck Protection Program (PPP) loans under the Coronavirus Aid, Relief, and Economic Security Act, as well as claims for fees by purported agents who allegedly assisted customers with preparing PPP loan applications submitted to the Company. These actions have been dismissed or, in a limited number of cases, are proceeding on an individual basis. The Company has also received formal and informal inquiries from federal and state government agencies regarding its offering of PPP loans.
FOREIGN EXCHANGE BUSINESS The United States Department of Justice (Department of Justice) is investigating certain activities in the Company’s foreign exchange business, including whether customers may have received pricing inconsistent with commitments made to those customers. Previous investigations by other federal government agencies have been resolved.
INTERCHANGE LITIGATION Plaintiffs representing a class of merchants have filed putative class actions, and individual merchants have filed individual actions, against Wells Fargo Bank, N.A., Wells Fargo & Company, Wachovia Bank, N.A., and Wachovia Corporation regarding the interchange fees associated with Visa and MasterCard payment card transactions. Visa, MasterCard, and several other banks and bank holding companies are also named as defendants in these actions. These actions have been consolidated in the United States District Court for the Eastern District of New York. The amended and consolidated complaint asserts claims against defendants based on alleged violations of federal and state antitrust laws and seeks damages, as well as injunctive relief. Plaintiff merchants allege that Visa, MasterCard, and payment card issuing banks unlawfully colluded to set interchange rates. Plaintiffs also allege that enforcement of certain Visa and MasterCard rules and alleged tying and bundling of services offered to merchants are anticompetitive. Wells Fargo and Wachovia, along with other defendants and entities, are parties to Loss and Judgment
Sharing Agreements, which provide that they, along with other entities, will share, based on a formula, in any losses from the Interchange Litigation. On July 13, 2012, Visa, MasterCard, and the financial institution defendants, including Wells Fargo, signed a memorandum of understanding with plaintiff merchants to resolve the consolidated class action and reached a separate settlement in principle of the consolidated individual actions. The settlement payments to be made by all defendants in the consolidated class and individual actions totaled approximately $6.6 billion before reductions applicable to certain merchants opting out of the settlement. The class settlement also provided for the distribution to class merchants of 10 basis points of default interchange across all credit rate categories for a period of eight consecutive months. The district court granted final approval of the settlement, which was appealed to the United States Court of Appeals for the Second Circuit by settlement objector merchants. Other merchants opted out of the settlement and are pursuing several individual actions. On June 30, 2016, the Second Circuit vacated the settlement agreement and reversed and remanded the consolidated action to the United States District Court for the Eastern District of New York for further proceedings. On November 23, 2016, prior class counsel filed a petition to the United States Supreme Court, seeking review of the reversal of the settlement by the Second Circuit, and the Supreme Court denied the petition on March 27, 2017. On November 30, 2016, the district court appointed lead class counsel for a damages class and an equitable relief class. The parties have entered into a settlement agreement to resolve the money damages class claims pursuant to which defendants will pay a total of approximately $6.2 billion, which includes approximately $5.3 billion of funds remaining from the 2012 settlement and $900 million in additional funding. The Company’s allocated responsibility for the additional funding is approximately $94.5 million. The court granted final approval of the settlement on December 13, 2019, which was appealed to the United States Court of Appeals for the Second Circuit by settlement objector merchants. Several of the opt-out and direct action litigations have been settled while others remain pending.
LOW INCOME HOUSING TAX CREDITS Federal government agencies have undertaken formal or informal inquiries or investigations regarding the manner in which the Company purchased, and negotiated the purchase of, certain federal low income housing tax credits in connection with the financing of low income housing developments.
MORTGAGE LOAN MODIFICATION MATTERS Plaintiffs representing a class of mortgage borrowers have filed separate putative class actions, Hernandez v. Wells Fargo, et al., Coordes v. Wells Fargo, et al., Ryder v. Wells Fargo, Liguori v. Wells Fargo, and Dore v. Wells Fargo, against Wells Fargo Bank, N.A., in the United States District Court for the Northern District of California, the United States District Court for the District of Washington, the United States District Court for the Southern District of Ohio, the United States District Court for the Southern District of New York, and the United States District Court for the Western District of Pennsylvania, respectively. Plaintiffs allege that Wells Fargo improperly denied mortgage loan modifications or repayment plans to customers in the foreclosure process due to the overstatement of foreclosure attorneys’ fees that were included for purposes of determining whether a customer in the foreclosure process qualified for a mortgage loan modification or repayment plan. In March 2020, the Company entered into an agreement pursuant to which the Company paid $18.5 million to resolve the claims of the initial certified class in the Hernandez
Wells Fargo & Company 106
case, which was approved by the district court in October 2020. The Hernandez settlement has been reopened to include additional borrowers who the Company determined should have been included in the settlement class because the Company identified a population of additional borrowers during the relevant class period whose loans had not previously been reviewed for inclusion in the original population of impacted customers. The identification of these additional borrowers will increase the potential class of mortgage borrowers in the other pending matters. In addition, federal banking regulators and other government agencies have undertaken formal or informal inquiries or investigations regarding these and other mortgage servicing matters.
NOMURA/NATIXIS MORTGAGE-RELATED LITIGATION In August 2014 and August 2015, Nomura Credit & Capital Inc. (Nomura) and Natixis Real Estate Holdings, LLC (Natixis) filed a total of seven third-party complaints against Wells Fargo Bank, N.A., in New York state court. In the underlying first-party actions, Nomura and Natixis have been sued for alleged breaches of representations and warranties made in connection with residential mortgage-backed securities sponsored by them. In the third-party actions, Nomura and Natixis allege that Wells Fargo, as master servicer, primary servicer or securities administrator, failed to notify Nomura and Natixis of their own breaches, failed to properly oversee the primary servicers, and failed to adhere to accepted servicing practices. Natixis additionally alleges that Wells Fargo failed to perform default oversight duties. Wells Fargo has asserted counterclaims alleging that Nomura and Natixis failed to provide Wells Fargo notice of their representation and warranty breaches.
OFAC RELATED INVESTIGATION The Company has self-identified an issue whereby certain foreign banks utilized a Wells Fargo software-based solution to conduct import/export trade-related financing transactions with countries and entities prohibited by the Office of Foreign Assets Control (OFAC) of the United States Department of the Treasury. We do not believe any funds related to these transactions flowed through accounts at Wells Fargo as a result of the aforementioned conduct. The Company has made voluntary self-disclosures to OFAC and is cooperating with an inquiry from the Department of Justice.
ORDER OF POSTING LITIGATION Plaintiffs filed a series of putative class actions against Wachovia Bank, N.A., and Wells Fargo Bank, N.A., as well as many other banks, challenging the “high to low” order in which the banks post debit card transactions to consumer deposit accounts. Most of these actions were consolidated in multi-district litigation proceedings (MDL proceedings) in the United States District Court for the Southern District of Florida. The court in the MDL proceedings has certified a class of putative plaintiffs, and Wells Fargo moved to compel arbitration of the claims of unnamed class members. The court denied the motions to compel arbitration in October 2016, and Wells Fargo appealed this decision to the United States Court of Appeals for the Eleventh Circuit. In May 2018, the Eleventh Circuit ruled in Wells Fargo’s favor and found that Wells Fargo had not waived its arbitration rights and remanded the case to the district court for further proceedings. On September 26, 2019, the district court entered an order granting Wells Fargo’s motion and dismissed the claims of unnamed class members in favor of arbitration, which was appealed by plaintiffs to the United States Court of Appeals for the Eleventh Circuit. In April 2021, the Eleventh Circuit upheld the district court's decision.
RETAIL SALES PRACTICES MATTERS A number of bodies or entities, including (a) federal, state, and local government agencies, including the Department of Justice, the United States Securities and Exchange Commission (SEC), and the United States Department of Labor, (b) state attorneys general, including the New York Attorney General, and (c) Congressional committees, have undertaken formal or informal inquiries, investigations, or examinations arising out of certain retail sales practices of the Company that were the subject of settlements with the CFPB, the OCC, and the Office of the Los Angeles City Attorney announced by the Company on September 8, 2016. The Company has responded to requests from certain of the foregoing. As previously disclosed, the Company entered into agreements to resolve the state attorneys general investigations. On February 21, 2020, the Company entered into an agreement with the Department of Justice to resolve the Department of Justice’s criminal investigation into the Company’s retail sales practices, as well as a separate agreement to resolve the Department of Justice’s civil investigation. As part of the Department of Justice criminal settlement, no charges will be filed against the Company provided the Company abides by all the terms of the agreement. The Department of Justice criminal settlement also includes the Company’s agreement that the facts set forth in the settlement document constitute sufficient facts for the finding of criminal violations of statutes regarding bank records and personal information. On February 21, 2020, the Company also entered into an order to resolve the SEC’s investigation arising out of the Company’s retail sales practices. The SEC order contains a finding, to which the Company consented, that the facts set forth include violations of Section 10(b) of the Securities Exchange Act of 1934 and Rule 10b-5 thereunder. As part of the resolution of the Department of Justice and SEC investigations, the Company made payments totaling $3.0 billion. In addition, as part of the settlements and included in the $3.0 billion amount, the Company agreed to the creation of a $500 million Fair Fund for the benefit of investors who were harmed by the conduct covered in the SEC settlement.
In addition, a number of lawsuits were filed by non-governmental parties seeking damages or other remedies related to these retail sales practices. As previously disclosed, the Company entered into various settlements to resolve these lawsuits. A purported Employee Retirement Income Security Act (ERISA) class action was filed in the United States District Court for the District of Minnesota on behalf of 401(k) plan participants. The district court dismissed the action, and on July 27, 2020, the United States Court of Appeals for the Eighth Circuit affirmed the dismissal. The 401(k) plan participants filed a writ of certiorari to the United States Supreme Court, which was denied on May 3, 2021.
RMBS TRUSTEE LITIGATION In December 2014, Phoenix Light SF Limited and certain related entities and the National Credit Union Administration (NCUA) filed complaints in the United States District Court for the Southern District of New York against Wells Fargo Bank, N.A., alleging claims against the Company in its capacity as trustee for a number of residential mortgage-backed securities trusts. Complaints raising similar allegations have been filed by Commerzbank AG in the Southern District of New York and by IKB International and IKB Deutsche Industriebank in New York state court. In each case, the plaintiffs allege that Wells Fargo Bank, N.A., as trustee, caused losses to investors, and plaintiffs assert causes of action based upon, among other things, the trustee’s alleged failure to notify and enforce repurchase obligations of mortgage loan sellers for purported breaches of representations and warranties, notify investors of
Wells Fargo & Company 107
Note 13: Legal Actions (continued)
alleged events of default, and abide by appropriate standards of care following alleged events of default. The Company previously settled two class actions with similar allegations that were filed in November 2014 and December 2016 by institutional investors in the Southern District of New York and New York state court, respectively. In March 2021, the Company entered into an agreement to resolve the case filed by the NCUA.
SEMINOLE TRIBE TRUSTEE LITIGATION The Seminole Tribe of Florida filed a complaint in Florida state court alleging that Wells Fargo, as trustee, charged excess fees in connection with the administration of a minor’s trust and failed to invest the assets of the trust prudently. The complaint was later amended to include three individual current and former beneficiaries as plaintiffs and to remove the Tribe as a party to the case. In December 2016, the Company filed a motion to dismiss the amended complaint on the grounds that the Tribe is a necessary party and that the individual beneficiaries lack standing to bring claims. The motion was denied in June 2018. The case is pending trial.
OUTLOOK As described above, the Company establishes accruals for legal actions when potential losses associated with the actions become probable and the costs can be reasonably estimated. The high end of the range of reasonably possible potential losses in excess of the Company’s accrual for probable and estimable losses was approximately $2.6 billion as of March 31, 2021. The outcomes of legal actions are unpredictable and subject to significant uncertainties, and it is inherently difficult to determine whether any loss is probable or even possible. It is also inherently difficult to estimate the amount of any loss and there may be matters for which a loss is probable or reasonably possible but not currently estimable. Accordingly, actual losses may be in excess of the established accrual or the range of reasonably possible loss. Based on information currently available, advice of counsel, available insurance coverage, and established reserves, Wells Fargo believes that the eventual outcome of the actions against Wells Fargo and/or its subsidiaries will not, individually or in the aggregate, have a material adverse effect on Wells Fargo’s consolidated financial condition. However, it is possible that the ultimate resolution of a matter, if unfavorable, may be material to Wells Fargo’s results of operations for any particular period.
Wells Fargo & Company 108
Note 14: Derivatives
We use derivatives to manage exposure to market risk, including interest rate risk, credit risk and foreign currency risk, and to assist customers with their risk management objectives. We designate certain derivatives as hedging instruments in qualifying hedge accounting relationships (fair value or cash flow hedges). Our remaining derivatives consist of economic hedges that do not qualify for hedge accounting and derivatives held for customer accommodation trading or other purposes. For additional information on our derivative activities, see Note 16 (Derivatives) in our 2020 Form 10-K.
Table 14.1: Notional or Contractual Amounts and Fair Values of Derivatives
Table 14.1 presents the total notional or contractual amounts and fair values for our derivatives. Derivative transactions can be measured in terms of the notional amount, but this amount is not recorded on our consolidated balance sheet and is not, when viewed in isolation, a meaningful measure of the risk profile of the instruments. The notional amount is generally not exchanged, but is used only as the basis on which interest and other payments are determined.
Total derivatives not designated as hedging instruments 62,303 53,071 61,089 56,669
Total derivatives before netting 65,949 54,071 65,682 58,065
Netting (40,520) (39,141) (39,836) (41,556)
Total $ 25,429 14,930 25,846 16,509
Table 14.2 provides information on the gross fair values of derivative assets and liabilities, the balance sheet netting adjustments and the resulting net fair value amount recorded on our consolidated balance sheet, as well as the non-cash collateral associated with such arrangements. We execute substantially all of our derivative transactions under master netting arrangements and reflect all derivative balances and related cash collateral subject to enforceable master netting arrangements on a net basis within the consolidated balance sheet. The “Gross amounts recognized” column in the following table includes $55.9 billion and $48.0 billion of gross derivative assets and liabilities, respectively, at March 31, 2021, and $54.6 billion and $50.1 billion, respectively, at December 31, 2020, with counterparties subject to enforceable master netting arrangements that are eligible for balance sheet netting adjustments. The majority of these amounts are interest rate contracts executed in over-the-counter (OTC) markets. The remaining gross derivative assets and liabilities of $10.0 billion and $6.1 billion, respectively, at March 31, 2021, and $11.1 billion
and $8.0 billion, respectively, at December 31, 2020, include those with counterparties subject to master netting arrangements for which we have not assessed the enforceability because they are with counterparties where we do not currently have positions to offset, those subject to master netting arrangements where we have not been able to confirm the enforceability and those not subject to master netting arrangements. As such, we do not net derivative balances or collateral within the consolidated balance sheet for these counterparties. Cash collateral receivables and payables that have not been offset against our derivatives were $1.6 billion and $2.9 billion, respectively, at March 31, 2021, and $1.8 billion and $984 million, respectively, at December 31, 2020.
We determine the balance sheet netting adjustments based on the terms specified within each master netting arrangement. We disclose the balance sheet netting amounts within the column titled “Gross amounts offset in consolidated balance sheet.” Balance sheet netting adjustments are determined at the counterparty level for which there may be multiple contract
Wells Fargo & Company 109
Note 14: Derivatives (continued)
types. For disclosure purposes, we allocate these netting adjustments to the contract type for each counterparty proportionally based upon the “Gross amounts recognized” by counterparty. As a result, the net amounts disclosed by contract type may not represent the actual exposure upon settlement of the contracts.
We do not net non-cash collateral that we receive and pledge on our consolidated balance sheet. For disclosure purposes, we present the fair value of this non-cash collateral in the column titled “Gross amounts not offset in consolidated balance sheet (Disclosure-only netting)” within the table. We determine and allocate the Disclosure-only netting amounts in the same manner as balance sheet netting amounts.
Table 14.2: Gross Fair Values of Derivative Assets and Liabilities
The “Net amounts” column within Table 14.2 represents the aggregate of our net exposure to each counterparty after considering the balance sheet and Disclosure-only netting adjustments. We manage derivative exposure by monitoring the credit risk associated with each counterparty using counterparty-specific credit risk limits, using master netting arrangements and obtaining collateral. Derivative contracts executed in OTC markets include bilateral contractual arrangements that are not cleared through a central clearing organization but are typically subject to master netting arrangements. The proportion of these derivative contracts relative to our total derivative assets and liabilities are presented in the “Percent exchanged in over-the-counter market” column in Table 14.2. In addition to the netting amounts included in the table, we also have balance sheet netting related to resale and repurchase agreements that are disclosed within Note 12 (Pledged Assets and Collateral).
Gross amounts not offset in
Gross amounts consolidated Percent offset in Net amounts in balance sheet exchanged in
Gross amounts consolidated consolidated (Disclosure-only Net over-the-counter (in millions) recognized balance sheet (1) balance sheet netting) amounts market
Total derivative liabilities $ 58,065 (41,556) 16,509 (3,588) 12,921
(1) Represents amounts with counterparties subject to enforceable master netting arrangements that have been offset in the consolidated balance sheet, including related cash collateral and portfolio level counterparty valuation adjustments. Counterparty valuation adjustments related to derivative assets were $293 million and $399 million and debit valuation adjustments related to derivative liabilities were $205 million and $201 million as of March 31, 2021, and December 31, 2020, respectively. Cash collateral totaled $5.8 billion and $4.5 billion, netted against derivative assets and liabilities, respectively, at March 31, 2021, and $5.5 billion and $7.5 billion, respectively, at December 31, 2020.
Wells Fargo & Company 110
Fair Value and Cash Flow Hedges For fair value hedges, we use interest rate swaps to convert certain of our fixed-rate long-term debt and time certificates of deposit to floating rates to hedge our exposure to interest rate risk. We also enter into cross-currency swaps, cross-currency interest rate swaps and forward contracts to hedge our exposure to foreign currency risk and interest rate risk associated with the issuance of non-U.S. dollar denominated long-term debt. In addition, we use interest rate swaps, cross-currency swaps, cross-currency interest rate swaps and forward contracts to hedge against changes in fair value of certain investments in available-for-sale debt securities due to changes in interest rates, foreign currency rates, or both. For certain fair value hedges of foreign currency risk, changes in fair value of cross-currency swaps attributable to changes in cross-currency basis spreads are excluded from the assessment of hedge effectiveness and recorded in other comprehensive income. See Note 21 (Other Comprehensive Income) for the amounts recognized in other comprehensive income.
For cash flow hedges, we use interest rate swaps to hedge the variability in interest payments received on certain floating-
Table 14.3: Gains (Losses) Recognized on Fair Value Hedging Relationships
rate commercial loans, and paid on certain floating-rate debt due to changes in the contractually specified interest rate. We also use cross-currency swaps to hedge variability in interest payments on fixed-rate foreign currency-denominated long-term debt due to changes in foreign exchange rates.
We estimate $107 million pre-tax of deferred net losses related to cash flow hedges in OCI at March 31, 2021, will be reclassified into net interest income during the next twelve months. The deferred losses expected to be reclassified into net interest income are predominantly related to discontinued hedges of floating rate loans. For cash flow hedges as of March 31, 2021, we are hedging our foreign currency exposure to the variability of future cash flows for all forecasted transactions for a maximum of 9 years. For additional information on our accounting hedges, see Note 1 (Summary of Significant Accounting Policies).
Table 14.3 and Table 14.4 show the net gains (losses) related to derivatives in fair value and cash flow hedging relationships, respectively.
Total Total Noninterest recorded in recorded in
Net interest income income net income OCI Derivative Derivative
(in millions) Debt
securities Deposits Long-term
debt Other gains
(losses) gains
(losses) Quarter ended March 31, 2021
Total amounts presented in the consolidated statement of income and othercomprehensive income $ 2,312 (112) (1,026) 523 N/A 47
Interest contracts Amounts related to interest settlements on derivatives (67) 91 550 — 574 Recognized on derivatives 1,294 (123) (7,071) — (5,900) — Recognized on hedged items (1,258) 119 6,944 — 5,805
Total gains (losses) (pre-tax) on interest rate contracts (31) 87 423 — 479 — Foreign exchange contracts
Amounts related to interest settlements on derivatives 28 — (1) — 27 Recognized on derivatives 1 — (227) 307 81 25 Recognized on hedged items (1) — 194 (317) (124)
Total gains (losses) (pre-tax) on foreign exchange contracts 28 — (34) (10) (16) 25 Total gains (losses) (pre-tax) recognized on fair value hedges $ (3) 87 389 (10) 463 25
Quarter ended March 31, 2020
Total amounts presented in the consolidated statement of income and othercomprehensive income $ 3,472 (1,742) (1,240) 863 N/A 182
Interest contracts
Amounts related to interest settlements on derivatives (46) 70 174 — 198
Recognized on derivatives (1,871) 530 9,775 — 8,434 —
Recognized on hedged items 1,856 (511) (9,426) — (8,081)
Total gains (losses) (pre-tax) on interest rate contracts (61) 89 523 — 551 —
Foreign exchange contracts
Amounts related to interest settlements on derivatives 6 — (85) — (79)
Recognized on derivatives (1) — 107 (785) (679) 144 Recognized on hedged items 2 — (174) 764 592
Total gains (losses) (pre-tax) on foreign exchange contracts 7 — (152) (21) (166) 144
Total gains (losses) (pre-tax) recognized on fair value hedges $ (54) 89 371 (21) 385 144
Wells Fargo & Company 111
Note 14: Derivatives (continued)
Table 14.4: Gains (Losses) Recognized on Cash Flow Hedging Relationships Total Total
recorded in recorded in Net interest income net income OCI
(in millions) Loans Long-term
debt Derivative
gains (losses) Derivative
gains (losses)
Quarter ended March 31, 2021
Total amounts presented in the consolidated statement of income and other comprehensive income $ 7,191 (1,026) N/A 47
Interest rate contracts:
Realized gains (losses) (pre-tax) reclassified from OCI into net income (52) — (52) 52
Net unrealized gains (losses) (pre-tax) recognized in OCI N/A N/A N/A (20)
Total gains (losses) (pre-tax) on interest rate contracts (52) — (52) 32
Foreign exchange contracts:
Realized gains (losses) (pre-tax) reclassified from OCI into net income — (1) (1) 1
Net unrealized gains (losses) (pre-tax) recognized in OCI N/A N/A N/A (11)
Total gains (losses) (pre-tax) on foreign exchange contracts — (1) (1) (10)
Total gains (losses) (pre-tax) recognized on cash flow hedges $ (52) (1) (53) 22
Quarter ended March 31, 2020
Total amounts presented in the consolidated statement of income and other comprehensive income $ 10,065 (1,240) N/A 182
Interest rate contracts:
Realized gains (losses) (pre-tax) reclassified from OCI into net income (56) — (56) 56
Net unrealized gains (losses) (pre-tax) recognized in OCI N/A N/A N/A —
Total gains (losses) (pre-tax) on interest rate contracts (56) — (56) 56
Foreign exchange contracts:
Realized gains (losses) (pre-tax) reclassified from OCI into net income — (2) (2) 2
Net unrealized gains (losses) (pre-tax) recognized in OCI N/A N/A N/A (20)
Total gains (losses) (pre-tax) on foreign exchange contracts — (2) (2) (18)
Total gains (losses) (pre-tax) recognized on cash flow hedges $ (56) (2) (58) 38
Table 14.5 shows the carrying amount and associated cumulative basis adjustment related to the application of hedge accounting that is included in the carrying amount of hedged assets and liabilities in fair value hedging relationships.
Table 14.5: Hedged Items in Fair Value Hedging Relationship
Hedged items currently designated Hedged items no longer designated (1) Hedge accounting Hedge accounting basis
Carrying amount of assets/ basis adjustment Carrying amount of assets/ adjustment (in millions) (liabilities) (2)(4) assets/(liabilities) (3) (liabilities) (4) assets/(liabilities)
(1) Represents hedged items no longer designated in qualifying fair value hedging relationships for which an associated basis adjustment exists at the balance sheet date. (2) Does not include the carrying amount of hedged items where only foreign currency risk is the designated hedged risk. The carrying amount excluded for debt securities is $15.3 billion and for long-
term debt is $(4.5) billion as of March 31, 2021, and $17.6 billion for debt securities and $(4.7) billion for long-term debt as of December 31, 2020. (3) The balance includes $202 million and $153 million of debt securities and long-term debt cumulative basis adjustments as of March 31, 2021, respectively, and $205 million and $130 million of debt
securities and long-term debt cumulative basis adjustments as of December 31, 2020, respectively, on terminated hedges whereby the hedged items have subsequently been re-designated into existing hedges.
(4) Represents the full carrying amount of the hedged asset or liability item as of the balance sheet date, except for circumstances in which only a portion of the asset or liability was designated as the hedged item in which case only the portion designated is presented.
(5) Carrying amount represents the amortized cost.
Wells Fargo & Company 112
Derivatives Not Designated as Hedging Instruments transition the economic hedges of our deferred compensation Derivatives not designated as hedging instruments include plan liabilities from equity securities to derivative instruments. economic hedges and derivatives entered into for customer Changes in the fair values of derivatives used to economically accommodation trading purposes. hedge the deferred compensation plan are reported in personnel
We use economic hedge derivatives to manage our exposure expense. to interest rate risk, equity price risk, foreign currency risk, and For additional information on economic hedges and other credit risk. We also use economic hedge derivatives to mitigate derivatives, see Note 16 (Derivatives) in our 2020 Form 10-K. the periodic earnings volatility caused by mismatches between Table 14.6 shows the net gains (losses), recognized by the changes in fair value of the hedged item and hedging income statement lines, related to derivatives not designated as instrument recognized on our fair value accounting hedges. In hedging instruments. second quarter 2020, we entered into arrangements to
Table 14.6: Gains (Losses) on Derivatives Not Designated as Hedging Instruments
Noninterest income Noninterest
expense
(in millions) Mortgage banking
Net gains (losses)on trading and
securities Other Total Personnel expense Quarter ended March 31, 2021
Net gains (losses) recognized related to derivatives not designated ashedging instruments $ (906) 1,702 (33) 763 (160)
Quarter ended March 31, 2020
Net gains (losses) recognized on economic hedges derivatives:
Interest contracts (1) $ 2,471 — 29 2,500 —
Equity contracts — 1,219 (28) 1,191 —
Foreign exchange contracts — — 627 627 —
Credit contracts — — 16 16 —
Subtotal 2,471 1,219 644 4,334 —
Net gains (losses) recognized on customer accommodation trading andother derivatives:
Interest contracts 553 (2,463) — (1,910) —
Commodity contracts — 112 — 112 —
Equity contracts — 4,749 73 4,822 —
Foreign exchange contracts — (557) — (557) —
Credit contracts — 281 — 281 —
Subtotal 553 2,122 73 2,748 —
Net gains (losses) recognized related to derivatives not designated ashedging instruments $ 3,024 3,341 717 7,082 —
(1) Mortgage banking amounts for first quarter 2021 are comprised of gains (losses) of $(1.6) billion related to derivatives used as economic hedges of MSRs measured at fair value offset by gains (losses) of $1.3 billion related to derivatives used as economic hedges of mortgage loans held for sale and derivative loan commitments. The corresponding amounts for first quarter 2020 are comprised of gains (losses) of $3.4 billion offset by gains (losses) of $(929) million.
Wells Fargo & Company 113
Note 14: Derivatives (continued)
Credit Derivatives Credit derivative contracts are arrangements whose value is derived from the transfer of credit risk of a reference asset or entity from one party (the purchaser of credit protection) to another party (the seller of credit protection). We use credit derivatives to assist customers with their risk management objectives. We may also use credit derivatives in structured product transactions or liquidity agreements written to special purpose vehicles. The maximum exposure of sold credit derivatives is managed through posted collateral, purchased credit derivatives and similar products in order to achieve our desired credit risk profile. This credit risk management provides an ability to recover a significant portion of any amounts that would be paid under sold credit derivatives. We would be
Table 14.7: Sold and Purchased Credit Derivatives
required to perform under the sold credit derivatives in the event of default by the referenced obligors. Events of default include events such as bankruptcy, capital restructuring or lack of principal and/or interest payment. In certain cases, other triggers may exist, such as the credit downgrade of the referenced obligors or the inability of the special purpose vehicle for which we have provided liquidity to obtain funding.
Table 14.7 provides details of sold and purchased credit derivatives.
Notional amount
(in millions) Fair value
asset Fair value
liability Protection
sold (A)
Protection sold – non-
investment grade
Protection purchased with
identical underlyings (B)
Net protection
sold (A)-(B)
Other protectionpurchased
Range ofmaturities
March 31, 2021 Credit default swaps on:
Corporate bonds Structured products
Credit protection on: Default swap index Commercial mortgage-backed securities index Asset-backed securities index
Protection sold represents the estimated maximum exposure to loss that would be incurred under an assumed hypothetical circumstance, where the value of our interests and any associated collateral declines to zero, without any consideration of recovery or offset from any economic hedges. We believe this hypothetical circumstance to be an extremely remote possibility and accordingly, this required disclosure is not an indication of expected loss. The amounts under non-investment grade represent the notional amounts of those credit derivatives on which we have a higher risk of being required to perform under the terms of the credit derivative and are a function of the underlying assets.
We consider the risk of performance to be high if the underlying assets under the credit derivative have an external rating that is below investment grade or an internal credit default grade that is equivalent thereto. We believe the net protection sold, which is representative of the net notional amount of protection sold and purchased with identical underlyings, in combination with other protection purchased, is more representative of our exposure to loss than either non-investment grade or protection sold. Other protection purchased represents additional protection, which may offset the exposure to loss for protection sold, that was not purchased with an identical underlying of the protection sold.
Credit-Risk Contingent Features Certain of our derivative contracts contain provisions whereby if the credit rating of our debt were to be downgraded by certain major credit rating agencies, the counterparty could demand additional collateral or require termination or replacement of derivative instruments in a net liability position. Table 14.8 illustrates our exposure to OTC bilateral derivative contracts with credit-risk contingent features, collateral we have posted, and the additional collateral we would be required to post if the credit rating of our debt was downgraded below investment grade.
Table 14.8: Credit-Risk Contingent Features Mar 31, Dec 31,
(in billions) 2021 2020
Net derivative liabilities with credit-risk contingent features $ 10.3 10.5
Collateral posted 9.1 9.0
Additional collateral to be posted upon a belowinvestment grade credit rating (1) 1.2 1.5
(1) Any credit rating below investment grade requires us to post the maximum amount of collateral.
Wells Fargo & Company 114
Note 15: Fair Values of Assets and Liabilities
We use fair value measurements to record fair value adjustments to certain assets and liabilities and to determine fair value disclosures. Assets and liabilities recorded at fair value on a recurring basis, such as derivatives, residential MSRs, and trading or AFS debt securities, are presented in Table 15.1 in this Note. Additionally, from time to time, we record fair value adjustments on a nonrecurring basis. These nonrecurring adjustments typically involve application of lower of cost or fair value (LOCOM) accounting, write-downs of individual assets or application of the measurement alternative for nonmarketable equity securities. Assets recorded at fair value on a nonrecurring basis are presented in Table 15.4 in this Note. We provide in Table 15.8 estimates of fair value for financial instruments that are not recorded at fair value, such as loans and debt liabilities carried at amortized cost.
See Note 1 (Summary of Significant Accounting Policies) in our 2020 Form 10-K for discussion of how we determine fair value. For descriptions of the valuation methodologies we use for assets and liabilities recorded at fair value on a recurring or nonrecurring basis, see Note 17 (Fair Values of Assets and Liabilities) in our 2020 Form 10-K.
FAIR VALUE HIERARCHY We classify our assets and liabilities recorded at fair value as either Level 1, 2, or 3 in the fair value hierarchy. The highest priority (Level 1) is assigned to valuations based on unadjusted quoted prices in active markets and the lowest priority (Level 3) is assigned to valuations based on significant unobservable inputs. See Note 1 (Summary of Significant Accounting Policies) in our 2020 Form 10-K for a detailed description of the fair value hierarchy.
In the determination of the classification of financial instruments in Level 2 or Level 3 of the fair value hierarchy, we consider all available information, including observable market data, indications of market liquidity and orderliness, and our understanding of the valuation techniques and significant inputs used. This determination is ultimately based upon the specific facts and circumstances of each instrument or instrument category and judgments are made regarding the significance of the unobservable inputs to the instruments’ fair value measurement in its entirety. If unobservable inputs are considered significant, the instrument is classified as Level 3.
We do not classify nonmarketable equity securities in the fair value hierarchy if we use the non-published net asset value (NAV) per share (or its equivalent) as a practical expedient to measure fair value. Marketable equity securities with published NAVs are classified in the fair value hierarchy.
Wells Fargo & Company 115
Note 15: Fair Values of Assets and Liabilities (continued)
Assets and Liabilities Recorded at Fair Value on a Recurring Basis Table 15.1 presents the balances of assets and liabilities recorded at fair value on a recurring basis.
Table 15.1: Fair Value on a Recurring Basis March 31, 2021 December 31, 2020
(in millions)
Trading debt securities: Securities of U.S. Treasury and federal agencies Collateralized loan obligations Corporate debt securities Federal agency mortgage-backed securities Non-agency mortgage-backed securities Other debt securities
Total trading debt securities
Available-for-sale debt securities: Securities of U.S. Treasury and federal agencies Non-U.S. government securities Securities of U.S. states and political subdivisions Federal agency mortgage-backed securities Non-agency mortgage-backed securities Collateralized loan obligations Other debt securities
Total available-for-sale debt securities
Loans held for sale Mortgage servicing rights (residential) Derivative assets (gross):
Total liabilities prior to derivative netting $ (19,999) (54,380) (2,425) (76,804) $ (20,189) (58,313) (2,004) (80,506)
Derivative netting (2) 39,141 41,556
Total liabilities after derivative netting (37,663) (38,950)
(1) Excludes $157 million and $154 million of nonmarketable equity securities as of March 31, 2021, and December 31, 2020, respectively, that are measured at fair value using non-published NAV per share (or its equivalent) as a practical expedient that are not classified in the fair value hierarchy.
(2) Represents balance sheet netting of derivative asset and liability balances, related cash collateral and portfolio level counterparty valuation adjustments. See Note 14 (Derivatives) for additional information.
Wells Fargo & Company 116
Level 3 Assets and Liabilities Recorded at Fair Value on a Recurring Basis Table 15.2 presents the changes in Level 3 assets and liabilities measured at fair value on a recurring basis.
Table 15.2: Changes in Level 3 Fair Value Assets and Liabilities on a Recurring Basis Net unrealized
gains (losses)related to
(in millions)
Balance, beginning
of period Net gains/
(losses) (1) Purchases (2) Sales Settlements
Transfers into
Level 3 (3)
Transfers out of
Level 3 (4)
Balance, end of period
assets and liabilities held at period end (5)
Quarter ended March 31, 2021 Trading debt securities $ 173 16 169 (173) — 7 — 192 8 (6) Available-for-sale debt securities 2,994 (7) 15 — (68) 242 (34) 3,142 (27) (6) Loans held for sale 1,234 (19) 129 (148) (110) 81 (1) 1,166 (17) (7) Mortgage servicing rights (residential) (8) 6,125 1,006 406 (1) — — — 7,536 1,591 (7) Net derivative assets and liabilities:
(1) Includes net gains (losses) included in both net income and other comprehensive income. All amounts represent net gains (losses) included in net income except for $14 million and $(91) million included in other comprehensive income from available-for-sale debt securities for first quarter 2021 and 2020, respectively.
(2) Includes originations of mortgage servicing rights and loans held for sale. (3) All assets and liabilities transferred into Level 3 were previously classified within Level 2. (4) All assets and liabilities transferred out of Level 3 are classified as Level 2. (5) Includes net unrealized gains (losses) related to assets and liabilities held at period end included in both net income and other comprehensive income. All amounts represent net unrealized gains
(losses) included in net income except for $0 million and $(88) million included in other comprehensive income from available-for-sale debt securities for first quarter 2021 and 2020, respectively. (6) Included in net gains (losses) on trading and securities in the consolidated statement of income. (7) Included in mortgage banking income in the consolidated statement of income. (8) For additional information on the changes in mortgage servicing rights, see Note 9 (Mortgage Banking Activities). (9) Included in mortgage banking income, net gains (losses) on trading and securities, and other noninterest income in the consolidated statement of income.
Table 15.3 provides quantitative information about the valuation techniques and significant unobservable inputs used in the valuation of our Level 3 assets and liabilities measured at fair value on a recurring basis for which we use an internal model.
The significant unobservable inputs for Level 3 assets and liabilities inherent in the fair values obtained from third-party vendors are not included in the table, as the specific inputs applied are not provided by the vendor (for additional information on vendor-developed valuations, see Note 17 (Fair Values of Assets and Liabilities) in our 2020 Form 10-K).
Weighted averages of inputs are calculated using outstanding unpaid principal balance for cash instruments, such as loans and securities, and notional amounts for derivative instruments.
Wells Fargo & Company 117
Note 15: Fair Values of Assets and Liabilities (continued)
Insignificant Level 3 assets, net of liabilities 44
Total Level 3 assets, net of liabilities $ 19,930 (3)
(1) The high end of the range of inputs is for servicing modified loans. For non-modified loans the range is $57 - $244 at March 31, 2021, and $63 - $252 at December 31, 2020. (2) Includes a blend of prepayment speeds and expected defaults. Prepayment speeds are influenced by mortgage interest rates as well as our estimation of drivers of borrower behavior. (3) Consists of total Level 3 assets of $23.0 billion and $21.9 billion and total Level 3 liabilities of $2.4 billion and $2.0 billion, before netting of derivative balances, at March 31, 2021, and December 31,
2020, respectively.
For additional information on the internal valuation techniques and significant unobservable inputs used in the valuation of our Level 3 assets and liabilities, including how changes in these inputs affect fair value estimates, see Note 17 (Fair Values of Assets and Liabilities) in our 2020 Form 10-K.
Wells Fargo & Company 118
Assets and Liabilities Recorded at Fair Value on a Nonrecurring Basis We may be required, from time to time, to measure certain assets at fair value on a nonrecurring basis in accordance with GAAP. These adjustments to fair value usually result from application of LOCOM accounting, write-downs of individual assets, or application of the measurement alternative for nonmarketable equity securities.
Table 15.4 provides the fair value hierarchy and fair value at the date of the nonrecurring fair value adjustment for all assets
Table 15.4: Fair Value on a Nonrecurring Basis
that were still held as of March 31, 2021, and December 31, 2020, and for which a nonrecurring fair value adjustment was recorded during the quarter ended March 31, 2021, and year ended December 31, 2020.
Table 15.5 presents the increase (decrease) in value of certain assets held at the end of the respective reporting periods presented for which a nonrecurring fair value adjustment was recognized during the periods presented.
March 31, 2021 December 31, 2020
(in millions) Level 2 Level 3 Total Level 2 Level 3 Total
Loans held for sale (1) 4,517 1,661 6,178 2,672 2,945 5,617
Loans:
Commercial 338 — 338 1,385 — 1,385
Consumer 208 — 208 395 — 395
Total loans 546 — 546 1,780 — 1,780
Mortgage servicing rights (commercial) — — — — 510 510
Total assets at fair value on a nonrecurring basis $ 6,596 1,737 8,333 8,199 4,673 12,872
(1) Predominantly consists of commercial mortgages and residential mortgage – first lien loans.
Nonmarketable equity securities includes impairment on private equity and venture capital investments and gains or losses under the measurement alternative. Other assets includes impairments of operating lease ROU assets, valuation losses on foreclosed real estate and other collateral owned, and impairment on private equity and venture capital investments in consolidated portfolio companies.
Table 15.5: Change in Value of Assets with Nonrecurring Fair Value Adjustment
Quarter ended March 31,
(in millions) 2021 2020
Loans held for sale $ 25 (39)
Loans:
Commercial (130) (95)
Consumer (47) (71)
Total loans (177) (166) Nonmarketable equity securities 210 (424) Other assets (19) (334)
Total $ 39 (963)
Table 15.6 provides quantitative information about the valuation techniques and significant unobservable inputs used in the valuation of our Level 3 assets that are measured at fair value on a nonrecurring basis and determined using an internal model. The table is limited to financial instruments that had nonrecurring fair value adjustments during the periods presented. Weighted averages of inputs are calculated using outstanding unpaid principal balance for cash instruments, such as loans, and carrying value prior to the nonrecurring fair value measurement for nonmarketable equity securities.
Wells Fargo & Company 119
Note 15: Fair Values of Assets and Liabilities (continued)
Total $ 4,673 (1) See Note 17 (Fair Values of Assets and Liabilities) in our 2020 Form 10-K for additional information on the valuation technique(s) and significant unobservable inputs used in the valuation of Level 3
assets. (2) Consists of approximately $1.4 billion and $2.6 billion of government insured/guaranteed loans purchased from GNMA-guaranteed mortgage securitizations at March 31, 2021, and December 31,
2020, respectively, and approximately $300 million of other mortgage loans that are not government insured/guaranteed at both March 31, 2021, and December 31, 2020. (3) Applies only to non-government insured/guaranteed loans. (4) Includes the impact on prepayment rate of expected defaults for government insured/guaranteed loans, which impact the frequency and timing of early resolution of loans. (5) Includes $417 million of private equity and venture capital investments in consolidated portfolio companies classified in other assets on the consolidated balance sheet at December 31, 2020.
Fair Value Option option elections, see Note 17 (Fair Values of Assets and The fair value option is an irrevocable election, generally only Liabilities) in our 2020 Form 10-K. permitted upon initial recognition of financial assets or liabilities, Table 15.7 reflects differences between the fair value to measure eligible financial instruments at fair value with carrying amount of the assets for which we have elected the fair changes in fair value reflected in earnings. We may elect the fair value option and the contractual aggregate unpaid principal value option to align the measurement model with how the amount at maturity. Nonaccrual loans and loans 90 days or more financial assets or liabilities are managed or to reduce complexity past due and still accruing included in LHFS which we have or accounting asymmetry. Following is a discussion of the elected the fair value option were insignificant at March 31, portfolios for which we elected the fair value option. For 2021, and December 31, 2020. additional information, including the basis for our fair value
Table 15.7: Fair Value Option
March 31, 2021 December 31, 2020
(in millions)
Fair value carrying amount
Aggregateunpaid
principal
Fair value carrying
amount less aggregate
unpaidprincipal
Fair value carrying amount
Aggregateunpaid
principal
Fair value carrying
amount less aggregate
unpaidprincipal
Loans held for sale $ 23,538 23,429 109 18,806 18,217 589
Wells Fargo & Company 120
The changes in fair value related to initial measurement and subsequent changes in fair value included in earnings for LHFS accounted for under the fair value option were $363 million and $335 million for the quarters ended March 31, 2021 and 2020, respectively. Substantially all of these amounts were included in the mortgage banking noninterest income line of the consolidated statement of income. For performing loans, instrument-specific credit risk gains or losses were derived principally by determining the change in fair value of the loans due to changes in the observable or implied credit spread. Credit spread is the market yield on the loans less the relevant risk-free benchmark interest rate. For nonperforming loans, we attribute all changes in fair value to instrument-specific credit risk. Gains and losses attributable to instrument-specific credit risk related to assets accounted for under the fair value option for the quarters ended March 31, 2021 and 2020 were insignificant.
Table 15.8: Fair Value Estimates for Financial Instruments
Disclosures about Fair Value of Financial Instruments Table 15.8 presents a summary of fair value estimates for financial instruments that are not carried at fair value on a recurring basis. Some financial instruments are excluded from the scope of this table, such as certain insurance contracts, certain nonmarketable equity securities, and leases. This table also excludes assets and liabilities that are not financial instruments such as the value of the long-term relationships with our deposit, credit card and trust customers, MSRs, premises and equipment, goodwill and deferred taxes.
Loan commitments, standby letters of credit and commercial and similar letters of credit are not included in Table 15.8. A reasonable estimate of the fair value of these instruments is the carrying value of deferred fees plus the allowance for unfunded credit commitments, which totaled $1.3 billion and $1.4 billion at March 31, 2021, and December 31, 2020, respectively.
The total of the fair value calculations presented does not represent, and should not be construed to represent, the underlying fair value of the Company.
Estimated fair value
(in millions) Carrying amount Level 1 Level 2 Level 3 Total
March 31, 2021
Financial assets
Cash and due from banks (1) $ 28,339 28,339 — — 28,339
Interest-earning deposits with banks (1) 258,394 258,214 180 — 258,394
Federal funds sold and securities purchased under resale agreements (1) 79,502 — 79,502 — 79,502
Total financial liabilities $ 324,728 — 311,641 21,321 332,962
(1) Amounts consist of financial instruments for which carrying value approximates fair value. (2) Excludes lease financing with a carrying amount of $15.1 billion and $15.4 billion at March 31, 2021, and December 31, 2020, respectively. (3) Excludes deposit liabilities with no defined or contractual maturity of $1.4 trillion at both March 31, 2021, and December 31, 2020, respectively. (4) Excludes capital lease obligations under capital leases of $28 million at both March 31, 2021, and December 31, 2020, respectively.
Wells Fargo & Company 121
Note 16: Preferred Stock
We are authorized to issue 20 million shares of preferred stock and 4 million shares of preference stock, both without par value. Preferred shares outstanding rank senior to common shares both as to dividends and liquidation preference but have no general voting rights. We have not issued any preference shares under this authorization. If issued, preference shares would be limited to one vote per share. Our total authorized, issued and outstanding preferred stock is presented in the following two
Table 16.1: Preferred Stock Shares
tables along with the Employee Stock Ownership Plan (ESOP) Cumulative Convertible Preferred Stock.
In January 2021, we issued $3.5 billion of our Preferred Stock, Series BB, and in February 2021, we issued $1.05 billion of our Preferred Stock, Series CC. In March 2021, we redeemed our Preferred Stock Series I, Series P and Series W, and partially redeemed our Preferred Stock, Series N, for an aggregate cost of $4.5 billion.
DEP Shares Dividend Equalization Preferred Shares (DEP) $ 10 97,000 $ 10 97,000 Series I (1) Floating Class A Preferred Stock — — 100,000 25,010 Series L (2) 7.50% Non-Cumulative Perpetual Convertible Class A Preferred Stock 1,000 4,025,000 1,000 4,025,000 Series N (3) 5.20% Non-Cumulative Perpetual Class A Preferred Stock 25,000 30,000 25,000 30,000 Series O 5.125% Non-Cumulative Perpetual Class A Preferred Stock 25,000 27,600 25,000 27,600 Series P (3) 5.25% Non-Cumulative Perpetual Class A Preferred Stock — — 25,000 26,400 Series Q 5.85% Fixed-to-Floating Non-Cumulative Perpetual Class A Preferred Stock 25,000 69,000 25,000 69,000 Series R 6.625% Fixed-to-Floating Non-Cumulative Perpetual Class A Preferred Stock 25,000 34,500 25,000 34,500 Series S 5.90% Fixed-to-Floating Non-Cumulative Perpetual Class A Preferred Stock 25,000 80,000 25,000 80,000 Series U 5.875% Fixed-to-Floating Non-Cumulative Perpetual Class A Preferred Stock 25,000 80,000 25,000 80,000 Series W (3) 5.70% Non-Cumulative Perpetual Class A Preferred Stock — — 25,000 40,000 Series X 5.50% Non-Cumulative Perpetual Class A Preferred Stock 25,000 46,000 25,000 46,000 Series Y 5.625% Non-Cumulative Perpetual Class A Preferred Stock 25,000 27,600 25,000 27,600 Series Z 4.75% Non-Cumulative Perpetual Class A Preferred Stock 25,000 80,500 25,000 80,500 Series AA 4.70% Non-Cumulative Perpetual Class A Preferred Stock 25,000 46,800 25,000 46,800
Series BB
3.90% Fixed-Reset Non-Cumulative Perpetual Class A Preferred Stock 25,000 140,400 — —
(1) Series I preferred stock issuance relates to trust preferred securities. See Note 8 (Securitizations and Variable Interest Entities) for additional information. This issuance has a floating interest rate that is the greater of three-month London Interbank Offered Rate (LIBOR) plus 0.93% and 5.56975%. In first quarter 2021, Preferred Stock, Series I, was redeemed.
(2) Preferred Stock, Series L, may be converted at any time, at the option of the holder, into 6.3814 shares of our common stock, plus cash in lieu of fractional shares, subject to anti-dilution adjustments.
(3) In first quarter 2021, 16,000 shares of Preferred Stock, Series N, were redeemed. In addition, Preferred Stock, Series P and Series W were fully redeemed. (4) See the “ESOP Cumulative Convertible Preferred Stock” section in this Note for additional information about the liquidation preference for the ESOP Cumulative Convertible Preferred Stock.
Wells Fargo & Company 122
768
Table 16.2: Preferred Stock – Shares Issued and Carrying Value March 31, 2021 December 31, 2020
Shares Liquidation Shares Liquidation issued and preference Carrying issued and preference Carrying
(in millions, except shares) outstanding value value Discount outstanding value value Discount
DEP Shares Dividend Equalization Preferred Shares (DEP) 96,546 $ — — — 96,546 $ — — — Series I (1) Floating Class A Preferred Stock — — — — 25,010 2,501 2,501 — Series L (2) 7.50% Non-Cumulative Perpetual Convertible Class A Preferred Stock 3,967,995 3,968 3,200 768 3,967,995 3,968 3,200 Series N (3) 5.20% Non-Cumulative Perpetual Class A Preferred Stock 14,000 350 350 — 30,000 750 750 — Series O 5.125% Non-Cumulative Perpetual Class A Preferred Stock 26,000 650 650 — 26,000 650 650 — Series P (3) 5.25% Non-Cumulative Perpetual Class A Preferred Stock — — — — 25,000 625 625 — Series Q 5.85% Fixed-to-Floating Non-Cumulative Perpetual Class A Preferred Stock 69,000 1,725 1,725 — 69,000 1,725 1,725 — Series R 6.625% Fixed-to-Floating Non-Cumulative Perpetual Class A Preferred Stock 33,600 840 840 — 33,600 840 840 — Series S 5.90% Fixed-to-Floating Non-Cumulative Perpetual Class A Preferred Stock 80,000 2,000 2,000 — 80,000 2,000 2,000 — Series U 5.875% Fixed-to-Floating Non-Cumulative Perpetual Class A Preferred Stock 80,000 2,000 2,000 — 80,000 2,000 2,000 — Series W (3) 5.70% Non-Cumulative Perpetual Class A Preferred Stock — — — — 40,000 1,000 1,000 — Series X 5.50% Non-Cumulative Perpetual Class A Preferred Stock 46,000 1,150 1,150 — 46,000 1,150 1,150 — Series Y 5.625% Non-Cumulative Perpetual Class A Preferred Stock 27,600 690 690 — 27,600 690 690 — Series Z 4.750% Non-Cumulative Perpetual Class A Preferred Stock 80,500 2,013 2,013 — 80,500 2,013 2,013 — Series AA 4.70% Non-Cumulative Perpetual Class A Preferred Stock 46,800 1,170 1,170 — 46,800 1,170 1,170 —
Series BB
3.90% Fixed-Reset Non-Cumulative Perpetual Class A Preferred Stock 140,400 3,510 3,510 — — — — —
Total 5,572,683 $ 21,938 21,170 768 5,496,293 $ 21,904 21,136
(1) Floating rate for Preferred Stock, Series I, is the greater of three-month London Interbank Offered Rate (LIBOR) plus 0.93% and 5.56975%. In first quarter 2021, Preferred Stock, Series I, was redeemed.
(2) Preferred Stock, Series L, may be converted at any time, at the option of the holder, into 6.3814 shares of our common stock, plus cash in lieu of fractional shares, subject to anti-dilution adjustments.
(3) In first quarter 2021, $400 million of Preferred Stock, Series N, was redeemed. In addition, Preferred Stock, Series P and Series W were fully redeemed. (4) See the “ESOP Cumulative Convertible Preferred Stock” section in this Note for additional information about the liquidation preference for the ESOP Cumulative Convertible Preferred Stock.
Wells Fargo & Company
768
123
Note 16: Preferred Stock (continued)
ESOP CUMULATIVE CONVERTIBLE PREFERRED STOCK All shares of our ESOP Cumulative Convertible Preferred Stock (ESOP Preferred Stock) were issued to a trustee acting on behalf of the Wells Fargo & Company 401(k) Plan (the 401(k) Plan). Dividends on the ESOP Preferred Stock are cumulative from the date of initial issuance and are payable quarterly at annual rates based upon the year of issuance. Each share of ESOP Preferred Stock released from the unallocated reserve of the 401(k) Plan is converted into shares of our common stock based on the stated
Table 16.3: ESOP Preferred Stock
value of the ESOP Preferred Stock and the then current market price of our common stock. The ESOP Preferred Stock is also convertible at the option of the holder at any time, unless previously redeemed. We have the option to redeem the ESOP Preferred Stock at any time, in whole or in part, at a redemption price per share equal to the higher of (a) $1,000 per share plus accrued and unpaid dividends or (b) the fair market value, as defined in the Certificates of Designation for the ESOP Preferred Stock.
Shares issued and outstanding Carrying value Adjustable dividend rate
Mar 31, Dec 31, Mar 31, Dec 31, (in millions, except shares) 2021 2020 2021 2020 Minimum Maximum
ESOP Preferred Stock
$1,000 liquidation preference per share
2018 221,945 221,945 $ 222 222 7.00 % 8.00 %
2017 163,210 163,210 163 163 7.00 8.00
2016 162,450 162,450 162 162 9.30 10.30
2015 92,904 92,904 93 93 8.90 9.90
2014 99,151 99,151 99 99 8.70 9.70
2013 61,948 61,948 62 62 8.50 9.50
2012 20,634 20,634 21 21 10.00 11.00
Total ESOP Preferred Stock (1) 822,242 822,242 $ 822 822
Unearned ESOP shares (2) $ (875) (875)
(1) At both March 31, 2021, and December 31, 2020, additional paid-in capital included $53 million related to ESOP preferred stock. (2) We recorded a corresponding charge to unearned ESOP shares in connection with the issuance of the ESOP Preferred Stock. The unearned ESOP shares are reduced as shares of the ESOP Preferred
Stock are committed to be released.
Wells Fargo & Company 124
Note 17: Revenue from Contracts with Customers
Our revenue includes net interest income on financial operating segments, including additional financial information instruments and noninterest income. Table 17.1 presents our and the underlying management accounting process, see Note revenue by operating segment. For additional description of our 22 (Operating Segments).
Table 17.1: Revenue by Operating Segment Quarter ended March 31, 2021
Consumer Corporate and Wealth and Banking and Commercial Investment Investment Reconciling Consolidated
(in millions) Lending Banking Banking Management Corporate Items (1) Company
Net interest income (2) $ 5,615 1,283 1,778 657 (430) (105) 8,798
Total card fees 819 52 18 1 2 — 892 Mortgage banking (2) 342 — 40 (3) — — 379 Net gains (losses) from trading activities (2) — (5) 35 (1) 35 — 64 Net gains on debt securities (2) — — — — 237 — 237 Net gains (losses) from equity securities (2) — (194) 116 (261) (1,062) — (1,401) Lease income (2) — 198 1 — 154 — 353 Other (2) 560 133 147 20 302 (652) 510
Total noninterest income 2,647 728 1,369 2,432 (119) (652) 6,405
Total revenue $ 8,649 2,502 3,388 3,270 700 (792) 17,717
(1) Taxable-equivalent adjustments related to tax-exempt income on certain loans and debt securities are included in net interest income, while taxable-equivalent adjustments related to income tax credits for low-income housing and renewable energy investments are included in noninterest income, in each case with corresponding impacts to income tax expense (benefit). Adjustments are included in Corporate, Commercial Banking, and Corporate and Investment Banking and are eliminated to reconcile to the Company’s consolidated financial results.
(2) These revenues are related to financial assets and liabilities, including loans, leases, securities and derivatives, with additional details included in other footnotes to our financial statements. (3) We earned trailing commissions of $298 million and $275 million for the quarters ended March 31, 2021 and 2020, respectively. (4) The cost of credit card rewards and rebates of $310 million and $385 million for the quarters ended March 31, 2021 and 2020, respectively, are presented net against the related revenues. (5) In first quarter 2021, trust and investment management fees and asset-based brokerage fees were combined into a single line item for investment advisory and other asset-based fees, and
brokerage commissions and other brokerage services fees were combined into a single line item for commissions and brokerage services fees. Prior period balances have been revised to conform with the current period presentation.
INVESTMENT ADVISORY AND OTHER ASSET-BASED FEES are earned The amount of trailing commissions is variable based on the for providing brokerage advisory, asset management and trust length of time the customer holds the shares and on changes in services. the value of the underlying assets.
Fees from advisory account relationships with brokerage Asset management services include managing and customers are charged based on a percentage of the market administering assets, including mutual funds, and institutional value of the client’s assets. Services and obligations related to separate accounts. Fees for these services are generally providing investment advice, active management of client assets, determined based on a tiered scale relative to the market value and assistance with selecting and engaging a third-party advisory of assets under management (AUM). In addition to AUM, we manager are generally satisfied over a month or quarter. Trailing have client assets under administration (AUA) that earn various commissions are earned for selling shares to investors and our administrative fees which are generally based on the extent of obligation is satisfied at the time shares are sold. However, these the services provided to administer the account. Services with fees are received and recognized over time during the period the AUM and AUA-based fees are generally satisfied over time. customer owns the shares and we remain the broker of record.
Wells Fargo & Company 125
Note 17: Revenue from Contracts with Customers (continued)
Trust services include acting as a trustee or agent for corporate trust, personal trust, and agency assets. Obligations for trust services are generally satisfied over time; however, obligations for activities that are transitional in nature are satisfied at the time of the transaction.
COMMISSIONS AND BROKERAGE SERVICES FEES are earned for providing brokerage services.
Commissions from transactional accounts with brokerage customers are earned for executing transactions at the client’s direction. Our obligation is generally satisfied upon the execution of the transaction and the fees are based on the size and number of transactions executed.
Note 18: Employee Benefits and Other Expenses
Pension and Postretirement Plans We sponsor a frozen noncontributory qualified defined benefit retirement plan, the Wells Fargo & Company Cash Balance Plan (Cash Balance Plan), which covers eligible employees of Wells Fargo. The Cash Balance Plan was frozen on July 1, 2009, and no new benefits accrue after that date. For additional information on our pension and postretirement plans, including plan assumptions, investment strategy and asset allocation,
Table 18.1: Net Periodic Benefit Cost
Fees earned from other brokerage services include securities clearance, omnibus and networking fees received from mutual fund companies in return for providing record keeping and other administrative services, and annual account maintenance fees charged to customers. Our obligation is satisfied at the time we provide the service which is generally at the time of the transaction.
For a description of our other revenues, see Note 20 (Revenue from Contracts with Customers) in our 2020 Form 10-K.
projected benefit payments, and valuation methodologies used for assets measured at fair value, see Note 21 (Employee Benefits and Other Expenses) in our 2020 Form 10-K.
Table 18.1 presents the components of net periodic benefit cost. Service cost is reported in personnel expense and all other components of net periodic benefit cost are reported in other noninterest expense on the consolidated statement of income.
2021 2020
Pension benefits Pension benefits
Non- Other Non- Other (in millions) Qualified qualified benefits Qualified qualified benefits Quarter ended March 31,
Service cost $ 4 — — 3 — —
Interest cost 71 3 3 86 4 4
Expected return on plan assets (152) — (5) (148) — (6)
Amortization of net actuarial loss (gain) 37 4 (5) 36 4 (5)
Amortization of prior service credit — — (2) — — (2)
Other Expenses Regulatory Charges and Assessments expense, which is included in other noninterest expense, was $217 million and $163 million in first quarter 2021 and 2020, respectively, and primarily consisted of Federal Deposit Insurance Corporation (FDIC) deposit assessment expense.
Wells Fargo & Company 126
Note 19: Restructuring Charges
The Company began pursuing various initiatives to reduce expenses and create a more efficient and streamlined organization in third quarter 2020. Actions from these initiatives may include (i) reorganizing and simplifying business processes and structures to improve internal operations and the customer experience, (ii) reducing headcount, (iii) optimizing third-party spending, including for our technology infrastructure, and (iv) rationalizing our branch and administrative locations, which may include consolidations and closures.
Restructuring charges are recorded as a component of noninterest expense on our consolidated statement of income.
Table 19.1: Accruals for Restructuring Charges
The following costs associated with these initiatives are included in restructuring charges. • Personnel costs – Severance costs associated with
headcount reductions with payments made over time in accordance with our severance plan, as well as payments for other employee benefit costs such as incentive compensation.
• Facility closure costs – Write-downs and acceleration of depreciation and amortization of owned or leased assets for branch and administrative locations, as well as related decommissioning costs.
• Other – Impairment of other assets and costs associated with our technology infrastructure.
Table 19.1 provides details on our restructuring charges.
(in millions) Personnel costs Facility closure costs Other Total December 31, 2019 $ — — — —
(1) Represents reduction of expense for changes in previously estimated amounts based on refinements of assumptions.
Wells Fargo & Company 127
Note 20: Earnings and Dividends Per Common Share
Table 20.1 shows earnings per common share and diluted earnings per common share and reconciles the numerator and denominator of both earnings per common share calculations.
Table 20.1: Earnings Per Common Share Calculations
Quarter ended March 31,
(in millions, except per share amounts) 2021 2020
Wells Fargo net income $ 4,742 653
Less: Preferred stock dividends and other (1) 379 611
Wells Fargo net income applicable to common stock (numerator) $ 4,363 42
Earnings per common share
Average common shares outstanding (denominator) 4,141.3 4,104.8
Per share $ 1.05 0.01
Diluted earnings per common share
Average common shares outstanding 4,141.3 4,104.8
Add: Restricted share rights (2) 29.7 30.5
Diluted average common shares outstanding (denominator) 4,171.0 4,135.3
Per share $ 1.05 0.01
(1) The quarters ended March 31, 2021 and 2020, includes $44 million and $272 million, respectively, from the elimination of discounts or issuance costs associated with redemptions of preferred stock. (2) Calculated using the treasury stock method.
Table 20.2 presents the outstanding securities that were anti-dilutive and therefore not included in the calculation of diluted earnings per common share.
Table 20.2: Outstanding Anti-Dilutive Securities
(in millions)
Weighted-average
Quarter end
2021
shares
ed March 31,
2020 Convertible Preferred Stock, Series L (1) 25.3 25.3
Restricted share rights (2) 0.3 —
(1) Calculated using the if-converted method. (2) Calculated using the treasury stock method.
Table 20.3 presents dividends declared per common share.
Table 20.3: Dividends Declared Per Common Share
Quarter ended March 31,
2021 2020
Per common share $ 0.10 0.51
Wells Fargo & Company 128
Note 21: Other Comprehensive Income
Table 21.1 provides the components of other comprehensive income (OCI), reclassifications to net income by income statement line item, and the related tax effects.
Table 21.1: Summary of Other Comprehensive Income
Quarter ended March 31,
2021 2020
Before Tax Net of Before Tax Net of (in millions) tax effect tax tax effect tax
Debt securities: Net unrealized losses arising during the period $ (2,012) 500 (1,512) $ (110) 22 (88) Reclassification of net (gains) losses to net income:
Interest income on debt securities (1) 137 (34) 103 66 (16) Net gains on debt securities (151) 35 (116) (237) 48 (189) Other noninterest income — — — (1) — (1)
Subtotal reclassifications to net income (14) 1 (13) (172) 32 (140)
Net change (2,026) 501 (1,525) (282) 54 (228)
Derivatives and hedging activities: Fair Value Hedges:
Change in fair value of excluded components on fair value hedges (2) 25 (6) 19 144 (35) 109 Cash Flow Hedges:
Net unrealized losses arising during the period on cash flow hedges (31) 8 (23) (20) 5 (15) Reclassification of net losses to net income:
Interest income on loans 52 (13) 39 56 (14) 42 Interest expense on long-term debt 1 — 1 2 (1) 1
Subtotal reclassifications to net income 53 (13) 40 58 (15)
Net change 47 (11) 36 182 (45) 137
Defined benefit plans adjustments: Net actuarial and prior service gains arising during the period 10 (3) 7 3 (1) 2 Reclassification of amounts to noninterest expense (3):
Amortization of net actuarial loss 36 (9) 27 35 (8) 27 Settlements and other — 1 1 1 — 1
Subtotal reclassifications to noninterest expense 36 (8) 28 36 (8)
Net change 46 (11) 35 39 (9)
Foreign currency translation adjustments: Net unrealized gains (losses) arising during the period 13 (2) 11 (194) 1 (193)
Net change 13 (2) 11 (194) 1 (193)
Other comprehensive income (loss) $ (1,920) $ 477 $ (1,443) $ (255) $ 1 $ (254)
Less: Other comprehensive income (loss) from noncontrolling interests, net of tax 1 (1)
Wells Fargo other comprehensive loss, net of tax $ (1,444) $ (253)
(1) Represents net unrealized gains and losses amortized over the remaining lives of securities that were transferred from the available-for-sale portfolio to the held-to-maturity portfolio. (2) Represents changes in fair value of cross-currency swaps attributable to changes in cross-currency basis spreads, which are excluded from the assessment of hedge effectiveness and recorded in
other comprehensive income. (3) These items are included in the computation of net periodic benefit cost (see Note 18 (Employee Benefits and Other Expenses) for additional information).
Wells Fargo & Company
50
43
28
30
129
Note 21: Other Comprehensive Income (continued)
Table 21.2 provides the cumulative OCI balance activity on an after-tax basis.
Table 21.2: Cumulative OCI Balances Defined Foreign Cumulative benefit currency other
Debt Fair value Cash flow plans translation comprehensive (in millions) securities hedges (1) hedges (2) adjustments adjustments income (loss) Quarter ended March 31, 2021 Balance, beginning of period $ 3,039 (204) (125) (2,404) (112) 194
Net unrealized gains (losses) arising during the period (1,512) 19 (23) 7 11 (1,498)
Amounts reclassified from accumulated other comprehensiveincome (13) — 40 28 — 55
Net change (1,525) 19 17 35 11 (1,443) Less: Other comprehensive income from noncontrolling interests — — — — 1 1
Balance, end of period 1,514 (185) (108) (2,369) (102) (1,250) Quarter ended March 31, 2020
Balance, beginning of period 1,552 (180) (298) (2,223) (162) (1,311) Net unrealized gains (losses) arising during the period (88) 109 (15) 2 (193) (185)
Amounts reclassified from accumulated other comprehensive income (140) — 43 28 — (69)
Net change (228) 109 28 30 (193) (254) Less: Other comprehensive loss from noncontrolling interests — — — — (1) (1)
Balance, end of period 1,324 (71) (270) (2,193) (354) (1,564)
(1) Substantially all of the amounts for fair value hedges are foreign exchange contracts. (2) Substantially all of the amounts for cash flow hedges are interest rate contracts.
Wells Fargo & Company 130
Note 22: Operating Segments
Our management reporting is organized into four reportable operating segments: Consumer Banking and Lending; Commercial Banking; Corporate and Investment Banking; and Wealth and Investment Management. All other business activities that are not included in the reportable operating segments have been included in Corporate. We define our reportable operating segments by type of product and customer segment, and their results are based on our management reporting process. The management reporting process measures the performance of the reportable operating segments based on the Company’s management structure, and the results are regularly reviewed by our Chief Executive Officer and Operating Committee. The management reporting process is based on U.S. GAAP and includes specific adjustments, such as funds transfer pricing for asset/liability management, shared revenues and expenses, and taxable-equivalent adjustments to consistently reflect income from taxable and tax-exempt sources, which allows management to assess performance consistently across the operating segments.
In February 2021, we announced an agreement to sell Wells Fargo Asset Management (WFAM) and moved the business from the Wealth and Investment Management operating segment to Corporate. Prior period balances have been revised to conform with the current period presentation. This change did not impact the previously reported consolidated financial results of the Company.
Consumer Banking and Lending offers diversified financial products and services for consumers and small businesses with annual sales generally up to $5 million. These financial products and services include checking and savings accounts, credit and debit cards, as well as home, auto, personal, and small business lending.
Commercial Banking provides financial solutions to private, family owned and certain public companies. Products and services include banking and credit products across multiple industry sectors and municipalities, secured lending and lease products, and treasury management.
Corporate and Investment Banking delivers a suite of capital markets, banking, and financial products and services to corporate, commercial real estate, government and institutional clients globally. Products and services include corporate banking, investment banking, treasury management, commercial real estate lending and servicing, equity and fixed income solutions, as well as sales, trading, and research capabilities.
Wealth and Investment Management provides personalized wealth management, investment and retirement products and services to clients across U.S.-based businesses including Wells Fargo Advisors and The Private Bank. We serve clients’ brokerage needs, and deliver financial planning, private banking, credit, and fiduciary services to high-net worth and ultra-high-net worth individuals and families.
Corporate includes corporate treasury and enterprise functions, net of allocations (including funds transfer pricing, capital, liquidity and certain expenses), in support of the reportable operating segments, as well as our investment portfolio and affiliated venture capital and private equity partnerships. In addition, Corporate includes all restructuring charges related to our efficiency initiatives. See Note 19 (Restructuring Charges) for additional information on restructuring charges. Corporate also includes certain lines of business that management has determined are no longer consistent with the long-term strategic goals of the Company, including our student loan business, rail car leasing business, and WFAM, as well as results for previously divested businesses.
Basis of Presentation FUNDS TRANSFER PRICING Corporate treasury manages a funds transfer pricing methodology that considers interest rate risk, liquidity risk, and other product characteristics. Operating segments pay a funding charge for their assets and receive a funding credit for their deposits, both of which are included in net interest income. The net impact of the funding charges or credits is recognized in corporate treasury.
REVENUE AND EXPENSE SHARING When lines of business jointly serve customers, the line of business that is responsible for providing the product or service recognizes revenue or expense with a referral fee paid or an allocation of cost to the other line of business based on established internal revenue-sharing agreements.
When a line of business uses a service provided by another line of business or enterprise function (included in Corporate), expense is generally allocated based on the cost and use of the service provided.
TAXABLE-EQUIVALENT ADJUSTMENTS Taxable-equivalent adjustments related to tax-exempt income on certain loans and debt securities are included in net interest income, while taxable-equivalent adjustments related to income tax credits for low-income housing and renewable energy investments are included in noninterest income, in each case with corresponding impacts to income tax expense (benefit). Adjustments are included in Corporate, Commercial Banking, and Corporate and Investment Banking and are eliminated to reconcile to the Company’s consolidated financial results.
Wells Fargo & Company 131
Note 22: Operating Segments (continued)
Table 22.1 presents our results by operating segment.
Table 22.1: Operating Segments Quarter ended March 31,
($ in millions)
Consumer Banking and
Lending Commercial
Banking
Corporate andInvestment
Banking
Wealth and Investment
Management Corporate Reconciling
Items (1) Consolidated
Company
2021 Net interest income (2) $ 5,615 1,283 1,778 657 (430) (105) 8,798 Noninterest income 3,039 925 1,845 2,887 1,319 (750) 9,265
Total revenue 8,654 2,208 3,623 3,544 889 (855) 18,063
(1) Taxable-equivalent adjustments related to tax-exempt income on certain loans and debt securities are included in net interest income, while taxable-equivalent adjustments related to income tax credits for low-income housing and renewable energy investments are included in noninterest income, in each case with corresponding impacts to income tax expense (benefit). Adjustments are included in Corporate, Commercial Banking, and Corporate and Investment Banking and are eliminated to reconcile to the Company’s consolidated financial results.
(2) Net interest income is the difference between interest earned on assets and the cost of liabilities to fund those assets. Interest earned includes actual interest earned on segment assets as well as interest credits for any funding of a segment available to be provided to other segments. The cost of liabilities includes actual interest expense on segment liabilities as well as funding charges for any funding provided from other segments.
Wells Fargo & Company
653
132
Note 23: Regulatory Capital Requirements and Other Restrictions
Regulatory Capital Requirements The Company and each of its subsidiary banks are subject to regulatory capital adequacy requirements promulgated by federal banking regulators. The FRB establishes capital requirements for the consolidated financial holding company, and the OCC has similar requirements for the Company’s national banks, including Wells Fargo Bank, N.A. (the Bank).
Table 23.1 presents regulatory capital information for Wells Fargo & Company and the Bank in accordance with Basel III capital requirements. Our capital adequacy is assessed based on the lower of our risk-based capital ratios calculated under the Standardized Approach and under the Advanced Approach. The Standardized Approach applies assigned risk weights to broad risk categories, while the calculation of risk-weighted assets (RWAs) under the Advanced Approach differs by requiring
Table 23.1: Regulatory Capital Information (1)
applicable banks to utilize a risk-sensitive methodology, which relies upon the use of internal credit models, and includes an operational risk component. The Basel III capital requirements for calculating Common Equity Tier 1 (CET1) and tier 1 capital, along with RWAs, are fully phased-in. However, the requirements for determining tier 2 and total capital are still in accordance with transition requirements and are scheduled to be fully phased-in by the end of 2021. Accordingly, the information presented below reflects fully phased-in CET1 capital, tier 1 capital, and RWAs, but reflects total capital still in accordance with transition requirements.
At March 31, 2021, the Bank and our other insured depository institutions were considered well-capitalized under the requirements of the Federal Deposit Insurance Act.
Wells Fargo & Company Wells Fargo Bank, N.A.
March 31, 2021 December 31, 2020 March 31, 2021 December 31, 2020
(in millions, except ratios) Advanced Approach
Standardized Approach
Advanced Approach
Standardized Approach
Advanced Approach
Standardized Approach
Advanced Approach
Standardized Approach
Regulatory capital: Common Equity Tier 1 Tier 1 Total Assets:
$ 139,724 159,675 187,651
139,724 159,675 197,533
138,297 158,196 186,934
138,297 158,196 196,660
149,957 149,957 163,989
149,957 149,957 173,392
150,168 150,168 164,412
150,168 150,168 173,719
Risk-weighted assets (2) Adjusted average assets Regulatory capital ratios: Common Equity Tier 1 capital Tier 1 capital Total capital
1,109,354 1,909,264
12.60 % 14.39 16.92
1,178,996 1,909,264
11.85 * 13.54 * 16.75 *
1,158,355 1,900,258
11.94 13.66 16.14 *
1,193,744 1,900,258
11.59 * 13.25 * 16.47
967,790 1,736,044
15.49 15.49 16.94
1,075,024 1,736,044
13.95 13.95 16.13
* * *
1,012,751 1,735,406
14.83 14.83 16.23
1,085,599 1,735,406
13.83 * 13.83 * 16.00 *
Wells Fargo & Company Wells Fargo Bank, N.A.
Regulatory leverage: Total leverage exposure (3) Supplementary leverage ratio (SLR) (3)(4) Tier 1 leverage ratio (5)
$
March 31, 2021
2,019,389 7.91 % 8.36
December 31, 2020
1,963,971 8.05 8.32
March 31, 2021
2,095,040 7.16 8.64
December 31, 2020
2,041,952 7.35 8.65
*Denotes the binding ratio based on the lower calculation under the Advanced and Standardized Approaches. (1) At March 31, 2021, the impact of the CECL transition provision issued by federal banking regulators on the regulatory capital of the Company was an increase in capital of $1.3 billion, reflecting a
$991 million (post-tax) increase in capital recognized upon our initial adoption of CECL, offset by 25% of the $9.2 billion increase in our ACL under CECL from January 1, 2020, through March 31, 2021. The impact of the CECL transition provision on the regulatory capital of the Bank at March 31, 2021, was an increase in capital of $1.3 billion.
(2) RWAs for the Company and the Bank included an increase of $1.0 billion under the Standardized Approach and decreases of $1.4 billion and $1.3 billion, respectively, under the Advanced Approach related to the impact of the CECL transition provision on the excess allowance for credit losses as of March 31, 2021.
(3) The SLR consists of tier 1 capital divided by total leverage exposure. Total leverage exposure consists of total average assets, less goodwill and other permitted tier 1 capital deductions (net of deferred tax liabilities), plus certain off-balance sheet exposures.
(4) In 2020, the FRB issued an interim final rule that temporarily allowed the exclusion for on-balance sheet amounts of U.S. Treasury securities and deposits at Federal Reserve Banks from the calculation of total leverage exposure in the denominator of the SLR. The Company adopted this interim final rule, but the Bank did not elect to apply these exclusions. The interim final rule expired on April 1, 2021.
(5) The tier 1 leverage ratio consists of tier 1 capital divided by total average assets, excluding goodwill and certain other items as determined under the rule.
At March 31, 2021, under transition requirements, the CET1, tier 1 and total capital ratio requirements for the Company included a global systemically important bank (G-SIB) surcharge of 2.00%. The G-SIB surcharge is not applicable to the Bank. In addition, the CET1, tier 1 and total capital ratio requirements for the Company and the Bank included a stress capital buffer of 2.50% under the Standardized Approach and a capital conservation buffer of 2.50% under the Advanced Approach. The Company is required to maintain these risk-based capital ratios and to maintain an SLR of at least 5.00% (comprised of a 3.00% minimum requirement plus a supplementary leverage buffer of 2.00%) to avoid restrictions on capital distributions and discretionary bonus payments. The Bank is required to maintain an SLR of at least 6.00% to be considered well-capitalized under applicable regulatory capital adequacy rules. Table 23.2 presents the risk-based capital and leverage requirements under
transition requirements to which the Company and the Bank were subject as of March 31, 2021, and December 31, 2020, which were the same under both the Standardized and Advanced Approaches.
Table 23.2: Risk-Based Capital and Leverage Ratios – Transition Requirements
Wells Fargo &Company Wells Fargo Bank, N.A.
Mar 31, 2021 Mar 31, 2021 and Dec 31, 2020 and Dec 31, 2020
Common Equity Tier 1 capital 9.00 % 7.00
Tier 1 capital 10.50 8.50
Total capital 12.50 10.50
Tier 1 leverage 4.00 4.00
Supplementary leverage 5.00 6.00
Wells Fargo & Company 133
Note 23: Regulatory Capital Requirements and Other Restrictions (continued)
Capital Planning Requirements The FRB’s capital plan rule establishes capital planning and other requirements that govern capital distributions, including dividends and share repurchases, by certain large bank holding companies (BHCs), including Wells Fargo. The FRB conducts an annual Comprehensive Capital Analysis and Review exercise and has also published guidance regarding its supervisory expectations for capital planning, including capital policies regarding the process relating to common stock dividend and repurchase decisions in the FRB’s SR Letter 15-18. The Parent’s ability to make certain capital distributions is subject to the requirements of the capital plan rule and is also subject to the Parent meeting or exceeding certain regulatory capital minimums.
On March 25, 2021, the FRB announced that it was extending measures it previously announced limiting large BHCs, including Wells Fargo, from making any capital distribution (excluding any capital distribution arising from the issuance of a capital instrument eligible for inclusion in the numerator of a regulatory capital ratio), unless otherwise approved by the FRB. The FRB has generally authorized BHCs to (i) provided that the BHC does not increase the amount of its common stock dividends to be larger than the level paid in second quarter 2020, pay common stock dividends and make share repurchases that, in the aggregate, do not exceed an amount equal to the average of the BHC’s net income for the four preceding calendar quarters; (ii) make share repurchases that equal the amount of share issuances related to expensed employee compensation; and (iii) redeem and make scheduled payments on additional tier 1 and tier 2 capital instruments. The FRB has also announced that if a BHC remains above all of its minimum risk-based capital requirements in this year's supervisory stress test, these additional limitations on capital distributions will end for that BHC after June 30, 2021. However, a BHC that falls below any of its minimum risk-based capital requirements in this year's supervisory stress test will remain subject to the additional limitations on capital distributions through September 30, 2021, and if the BHC remains below the capital required by the supervisory stress test at that time, the existing stress capital buffer framework will impose even stricter capital distribution limitations.
Loan and Dividend Restrictions Federal law restricts the amount and the terms of both credit and non-credit transactions between a bank and its nonbank affiliates. Additionally, federal laws and regulations limit the dividends that a national bank may pay.
Our nonbank subsidiaries are also limited by certain federal and state statutory provisions and regulations covering the amount of dividends that may be paid in any given year. In addition, under a Support Agreement dated June 28, 2017, as amended and restated on June 26, 2019, among Wells Fargo & Company, the parent holding company (the “Parent”), WFC Holdings, LLC, an intermediate holding company and subsidiary of the Parent (the “IHC”), Wells Fargo Bank, N.A., Wells Fargo Securities, LLC, Wells Fargo Clearing Services, LLC, and certain other direct and indirect subsidiaries of the Parent designated as material entities for resolution planning purposes or identified as related support entities in our resolution plan, the IHC may be restricted from making dividend payments to the Parent if certain liquidity and/or capital metrics fall below defined triggers or if the Parent’s board of directors authorizes it to file a case under the U.S. Bankruptcy Code.
For additional information on loan and dividend restrictions, see Note 28 (Regulatory Capital Requirements and Other Restrictions) in our 2020 Form 10-K.
Cash Restrictions Cash and cash equivalents may be restricted as to usage or withdrawal. Table 23.3 provides a summary of restrictions on cash and cash equivalents.
Table 23.3: Nature of Restrictions on Cash and Cash Equivalents Mar 31, Dec 31,
(in millions) 2021 2020 Reserve balance for non-U.S. central banks $ 234 243
Segregated for benefit of brokerage customersunder federal and other brokerage regulations 908 957
Wells Fargo & Company 134
Glossary of Acronyms
ACL Allowance for credit losses HTM Held-to-maturity AFS Available-for-sale LCR Liquidity coverage ratio ALCO Asset/Liability Committee LHFS Loans held for sale ARM Adjustable-rate mortgage LIBOR London Interbank Offered Rate ASC Accounting Standards Codification LIHTC Low-income housing tax credit ASU Accounting Standards Update LOCOM Lower of cost or fair value AUA Assets under administration LTV Loan-to-value AUM Assets under management MBS Mortgage-backed security AVM Automated valuation model MSR Mortgage servicing right BCBS Basel Committee on Banking Supervision NAV Net asset value BHC Bank holding company NPA Nonperforming asset CCAR Comprehensive Capital Analysis and Review NSFR Net stable funding ratio CD Certificate of deposit OCC Office of the Comptroller of the Currency CECL Current expected credit loss OCI Other comprehensive income CET1 Common Equity Tier 1 OTC Over-the-counter CFPB Consumer Financial Protection Bureau OTTI Other-than-temporary impairment CLO Collateralized loan obligation PCD Purchased credit-deteriorated CLTV Combined loan-to-value PCI Purchased credit-impaired CPI Collateral protection insurance PTPP Pre-tax pre-provision profit CRE Commercial real estate RMBS Residential mortgage-backed securities DPD Days past due ROA Return on average assets ESOP Employee Stock Ownership Plan ROE Return on average equity FASB Financial Accounting Standards Board ROTCE Return on average tangible common equity FDIC Federal Deposit Insurance Corporation RWAs Risk-weighted assets FHA Federal Housing Administration SEC Securities and Exchange Commission FHLB Federal Home Loan Bank S&P Standard & Poor’s Ratings Services FHLMC Federal Home Loan Mortgage Corporation SLR Supplementary leverage ratio FICO Fair Isaac Corporation (credit rating) SOFR Secured Overnight Financing Rate FNMA Federal National Mortgage Association SPE Special purpose entity FRB Board of Governors of the Federal Reserve System TDR Troubled debt restructuring GAAP Generally accepted accounting principles TLAC Total Loss Absorbing Capacity GNMA Government National Mortgage Association VA Department of Veterans Affairs GSE Government-sponsored entity VaR Value-at-Risk G-SIB Global systemically important bank VIE Variable interest entity HQLA High-quality liquid assets WIM Wealth and Investment Management
Wells Fargo & Company 135
Note 23: Regulatory Capital Requirements and Other Restrictions (continued)
PART II – OTHER INFORMATION Item 1. Legal Proceedings
Information in response to this item can be found in Note 13 (Legal Actions) to Financial Statements in this Report which information is incorporated by reference into this item.
Item 1A. Risk Factors
Information in response to this item can be found under the “Financial Review – Risk Factors” section in this Report which information is incorporated by reference into this item.
Item 2. Unregistered Sales of Equity Securities and Use of Proceeds
The following table shows Company repurchases of its common stock for each calendar month in the quarter ended March 31, 2021.
Maximum number of Total number shares that may yet
of shares Weighted average be repurchased under Calendar month repurchased (1) price paid per share the authorizations
January 11,558,076 $ 32.15 655,683,183
February 53,726 34.67 655,629,457
March 5,599,343 39.71 650,030,114
Total 17,211,145 (1) All shares were repurchased under an authorization covering up to 350 million shares of common stock approved by the Board of Directors and publicly announced by the Company on July 23, 2019.
In addition, the Company publicly announced on January 15, 2021, that the Board of Directors authorized the repurchase of an additional 500 million shares of common stock. Unless modified or revoked by the Board, these authorizations do not expire.
Wells Fargo & Company 136
Item 6. Exhibits
A list of exhibits to this Form 10-Q is set forth below.
The Company’s SEC file number is 001-2979. On and before November 2, 1998, the Company filed documents with the SEC under the name Norwest Corporation. The former Wells Fargo & Company filed documents under SEC file number 001-6214.
Exhibit Number Description Location 3(a) Restated Certificate of Incorporation, as amended and in effect on the date hereof. Filed herewith. 3(b) By-Laws. Incorporated by reference to
Exhibit 3.1 to the Company’s CurrentReport on Form 8-K filed March 1,2018.
4(a) See Exhibits 3(a) and 3(b). 4(b) The Company agrees to furnish upon request to the Commission a copy of each
instrument defining the rights of holders of senior and subordinated debt ofthe Company.
22 Subsidiary guarantors and issuers of guaranteed securities and affiliates whosesecurities collateralize securities of the registrant.
Incorporated by reference toExhibit 22 to the Company’s AnnualReport on Form 10-K for the yearended December 31, 2020.
31(a) Certification of principal executive officer pursuant to Section 302 of theSarbanes-Oxley Act of 2002.
Filed herewith.
31(b) Certification of principal financial officer pursuant to Section 302 of the Sarbanes-Oxley Act of 2002.
Filed herewith.
32(a) Certification of Periodic Financial Report by Chief Executive Officer Pursuant toSection 906 of the Sarbanes-Oxley Act of 2002 and 18 U.S.C. § 1350.
Furnished herewith.
32(b) Certification of Periodic Financial Report by Chief Financial Officer Pursuant toSection 906 of the Sarbanes-Oxley Act of 2002 and 18 U.S.C. § 1350.
Furnished herewith.
101.INS Inline XBRL Instance Document The instance document does not appear in the interactive data filebecause its XBRL tags are embeddedwithin the inline XBRL document.
Note 23: Regulatory Capital Requirements and Other Restrictions (continued)
SIGNATURE
Pursuant to the requirements of the Securities Exchange Act of 1934, the registrant has duly caused this Report to be signed on its behalf by the undersigned, thereunto duly authorized.