WP-2015-015 Universal food security program and nutritional intake: Evidence from the hunger prone KBK districts in Odisha Andaleeb Rahman Indira Gandhi Institute of Development Research, Mumbai June 2015 http://www.igidr.ac.in/pdf/publication/WP-2015-015.pdf
Transcript
WP-2015-015
Universal food security program and nutritional intake: Evidencefrom the hunger prone KBK districts in Odisha
Andaleeb Rahman
Indira Gandhi Institute of Development Research, MumbaiJune 2015
Growth in income although an essential driver of improved nutritional outcomes, has proved to be
insufficient in ensuring a decline in hunger and malnourishment (FAO, 2012). Widespread hunger
manifests itself in insufficient food intake and poor diet quality which results in malnutrition and
mortality. In order to improve nutrition of the poor, consumer food subsidies are an important
policy instrument in many low income countries. Social protection measures such as the food
assistance programs have a crucial role to play in promoting greater nutrient intake and hence the
overall nutrition (Lentz & Barret, 2013). The provision of staple food at subsidized prices not only
increases access to food to the beneficiaries but also provides them an implicit income transfer
which is difference between the open market and subsidized price for every unit of the food item
purchased. Whether this gain in income would translate into improved nutrition has been a much
debated issue, although the empirical evidence is fairly limited. Theoretically, price subsidies
would have a positive effect on nutrition if the income gain is spent on the consumption on more
nutritious items. On the other hand, if households substitute away from the less costly staple food
items towards those which are tastier but less nutritionally dense, consumer subsidies would lead
to a decline in the nutrient intake and hence overall nutrition. Using data from a randomized field
experiment in China, Jensen & Miller (2011) found no evidence of the consumer price subsidy on
nutrition.1 In fact, households which are provided the food subsidy substitute away from the staple
food towards those food items which are expensive sources and low on nutrient leading to a
reduction in the calorie intake and other important vitamins and minerals. Also in the In the case
of China, Shimokawa (2010) finds that consumer subsidies have an asymmetric effect on nutrient
intake. While an increase in consumer food subsidies positively affects the total energy intake,
removal of the subsidies leaves the energy intake unaffected.
In many developing countries like India, consumer food subsidies are a common form of
nutritional assistance. The government of India provides subsidized foodgrains to the poorer
households under its Public Distribution System (PDS) which is amongst the largest food security
1 Based upon the results from their randomized field experiment, they also caution against any generalized interpretation of the relationship between consumer food subsidies on nutrient intake. They state that the impact of
consumer food subsidy on nutrient intake would depend upon how households value this marginal implicit income
transfer, which in turn would depend upon the current income level and dietary preferences of the household. A
household living below the subsistence level may spend more on food while those above the basic minimum standard
of living may not spend the extra income on food.
programs in the world. How consumer subsidies through PDS impacts overall nutrient intake and
diet quality has been an issue of lively debate in India. Evaluation studies on the link between PDS
and nutrient intake have come up with contrasting results. One of the earlier studies evaluating the
effectiveness of PDS was by Kochar (2005). She looked at the impact of the move from a universal
PDS to a scheme targeted towards a poorer population in 1997. With a targeted PDS, poorer
population was to be provided higher consumer subsidies. She used this variation over time to
study how it impacted calorie consumption. She found that greater income transfer through the
PDS did not lead to greater calorie consumption for the targeted households.
In recent years, there has been a revival of the PDS in India with the Indian state governments
taking various measures to improve delivery and coverage of the PDS. The average monthly
consumption of rice from PDS increased from 4.1 kg to 7.7 kg per household between 2004-05
and 2011-12. Similarly, the consumption of wheat increased from 1.5 kg to 3.5 kg during this
period. The resultant increase in the average income transfer to the households has been from Rs.
31.10 in 2004-05 to Rs. 85.21 in 2011-12. This exogenous increase in the consumer subsidy and
the resultant income transfer as result of the improvements in the PDS delivery system give us an
ideal setting to evaluate the link between consumer subsidy and nutrient intake. Kaushal and
Muchomba (2011) study whether this improvement in PDS led to greater consumption of nutrients.
They find no significant relationship between higher nutritional intake and PDS participation.
Krishnamurthy et. al. (2013) on the other hand find that the improvements in the PDS delivery
system in Chhattisgarh did lead to higher nutrient intake and diet quality.
This paper concentrates on the state of Odisha which is amongst the poorest states of India
suffering from “alarming” levels of hunger (Menon et. al. 2009). Even within Odisha, there are
sharp differences in the extent of food security between the different regions: costal, southern and
eastern (World Food Program & Institute of Human Development, 2008). The Kalahandi-
Balangir-Koraput (KBK) region which consists of 8 districts lying in the southern part of Odisha
has historically been found to be suffering from chronic poverty, hunger and distress migration
(Parida, 2008). Recognizing the poor nutritional indicators and poverty in the KBK region, the
government decided to move away from PDS targeted towards the poor towards a universal PDS
in these districts of Odisha in 2008. This led to differential levels of income transfer across these
two regions of the state. In the KBK region, income transfers were higher than the non-KBK
districts with a targeted scheme. We exploit this variation in the income transfer over time across
the KBK and non-KBK regions of Odisha to evaluate the link between consumer subsidies through
PDS and nutrient intake.
While doing so, this paper makes the following contribution. Firstly, it provides evidence on the
role of publicly provided assistance program in improving the nutrient intake and diet quality in a
state with low level of economic development and regional disparity. Secondly, it underscores the
importance of publicly provided food transfers in reducing nutrient inadequacy. Thirdly, this paper
also contributes to the debate on targeted versus universal food security scheme by presenting
insights from a natural experiment of universal PDS existing in one region while a targeted is in
place in another region of the state. When analysing the impact of PDS on the intake of nutrients,
the focus of this paper goes beyond the total energy intake as measured through the consumption
of calories. In addition to calories, two major macro-nutrients, viz. protein and fat are also accorded
equal attention. Since for improved nutritional and health outcomes, the quality of diet is equally
important, this paper also focusses on the dietary composition.
This paper is organized in the following way. Section 2 provides a background on the revival of
PDS, its relevance for the households in KBK districts and the existing evidence on the link
between PDS and nutrient intake. Section 3 discusses the existing evidences on PDS and nutrient
intake followed by a description of the data and the summary statistics in section 4. Econometric
methodology and the identification strategy is discussed in section 5. Results are presented in
section 6 and following section concludes the analysis.
2. Background
India’s PDS has attracted criticism from large quarters for its failure to reach the poor and
escalating costs of operation. According to the Performance Evaluation Report of the Planning
Commission of India (2005), PDS has neither been able to enhance its reach to the poor nor could
it reduce the fiscal burden. On account of rejuvenated efforts by the various state governments led
by a combination of effective delivery and improved monitoring mechanism, there has been a
marked improvement in the performance of PDS in recent times2. Not only has there been an
expansion in the coverage of PDS, the share of grains as consumed from the PDS has increased.
Odisha has been a front-runner in terms of the restructuring the PDS (Aggarwal, 2011). The
government of Odisha also made PDS more attractive by reducing the subsidised price of
foodgrains. Since 1997 when PDS became a targeted scheme in India, it focussed on the poorer
households. Foodgrain entitlements and the price to be charged were different for the poor and
non-poor households. Ration cards were distributed classifying them as BPL (Below Poverty Line)
and APL (Above Poverty line) households. In 2000, another category of ration cards was included
under the Antyodaya Anna Yojana (AAY) for the poorest of the poor households. Owing to poor
nutritional status in the KBK region of Odisha, the difference between the APL and BPL
households was removed in the KBK districts in August, 2008. Now, all the households living in
the KBK districts were eligible for the subsidised rice through PDS. This led to an increase the
number of beneficiaries from approximately 30 lakh to 55 Lakh (Wadhwa, 2011). Extra allocation
for the increase in the number of beneficiaries has been made by reducing the BPL quota from 35
kgs. to 25 kgs. for them.
2.1 Poverty and nutrition in Odisha
On major development indicators, Odisha is similar to the most backward regions in the world. As
per the official poverty line figures, 17.29 percent of the urban and 35.69 percent of the rural
population was found to be poor in 2011-12. India State Hunger Index, 2008 reports Odisha to be
suffering from “alarming” level of hunger (Menon et. al., 2009). High level of food insecurity is
evident in the form of higher mortality and under-nutrition, especially amongst the scheduled tribes
(STs) and the scheduled castes (SCs). Against the overall 43 percent of the children being
underweight in the state, the share of the scheduled tribes (STs) and (SCs) was found to be much
higher at 59 percent and 59.4 percent respectively (World Food Program & Institute of Human
Development, 2008). While poverty and poor nutritional outcomes are correlated, the situation in
Odisha is compounded by a multitude of other problems such as spatial disadvantage, social
identity and the influence of naxal violence. This has led to considerable disparity within the state-
across social groups and regions.
2 For a detailed description of the various state government initiatives, please refer to Khera (2011)
2.2 Regional disparities and the KBK districts
A key feature of the poor economic development in Odisha is the persistent regional disparities.
Districts along the eastern ghats with a higher share of tribal population are most food insecure
(World Food Program & Institute of Human Development, 2008). Coastal Odisha performs better
compared to rest of the state while the districts lying in the eastern ghats districts are the most
deprived ones. Rural poverty rate in southern Odisha stands highest at 48 percent followed by the
northern (40 percent) and coastal regions (21 percent)3. The KBK region consists of 8 districts
lying in the southern part of Odisha (Figure 1)4. These districts in the KBK region are culturally
and linguistically homogeneous and constitute 30.59 percent of the total geographical area of the
state. Agriculture remains the primary occupation in these districts with a majority of the families
being engaged as agricultural labour (Census of India, 2011). These districts have historically been
found to be suffering from chronic poverty and distress migration (Parida, 2008). KBK region did
attract a lot of attention ever since the news of starvation death from there came out during the mid
‘80s. Agriculture which is the primary source of livelihood in the KBK region is highly
underdeveloped owing to vulnerability to natural calamities (Shah et. al., 2007). Droughts and
floods are common in this region and the irrigation facilities are unevenly distributed. This often
leads to wide fluctuations in the agricultural production. Another feature of the KBK districts is
the larger proportion of SC and ST households. In districts like Rayagada, Nabarangapur, Koraput
and Malkanagiri close to 70 percent of the households either belong to the SCs or STs. Lack of
inadequate infrastructure such as road connectivity also acts as a major constraint. Forest cover in
the region is also vulnerable to degradation on account of intensive use, shifting cultivation and
mining. A combination of these factors makes the population in the region extremely vulnerable
to any kind of economic shock.
To moderate the exposure and vulnerability of the households to such adverse economic shocks,
the government has allocated large amount of money for various social protection measures in the
3 Author’s calculations using the nationally representative National Sample Survey Organisation (NSSO) data. 4 BK region comprised of the 3 districts- Kalahandi, Bolangir and Koraput till 1992-93 when they were re-organised
into eight districts namely- Malkangiri, Koraput, Nabrangpur, Kalahandi, Rayagada, Nuapada, Balangir and Sonepur.
Koraput, Malkangiri, Nabarangpur, Rayagada and Kalahandi are part of the Eastern Ghats which are hilly and have a
large forest cover. Balangir, Nuapada and Subarnapur districts are a part of the central tablelands, and have a more
varied topography in the form of plain agricultural lands, hills and rolling uplands.
KBK region5. In spite of that, districts in the KBK region continue to figure amongst the poorest
districts in the country as identified by the Planning Commission (Kujur, 2006). Programs to
promote food security were initiated which aimed at providing food throughout the year for the
old and those living below the poverty line. Cooked meals made from the locally procured
nutritious vegetables were to be provided to the beneficiaries through the Anganwadi Centres
(World Food Program & Institute of Human Development, 2008). It was expected to help increase
intake of the required minerals and vitamins in addition to the calories. National Human Rights
Commission has found strong evidence of malnutrition to persist in the KBK region despite the
implementation of these welfare schemes. Failure of Public Distribution System (PDS) has been
cited as a major reason for high level of undernutrition in this region.
Figure 1: Odisha and KBK districts
5 Long Term Action Plan (LTAP) for the KBK region in 1993 and another a Revised Long Term Action Plan (RLTAP)
in 1998-99 was prepared in the objective of mitigating drought and poverty alleviation, but these schemes were not
much of a success.
3. Existing evidences on the link between PDS and nutrition
The provision of staple foodgrains at subsidised prices as provided through the PDS are important
in increasing the access to food and ensuring basic minimum level of energy intake. Almost half
of the household calorie intake from staple foodgrains in India comes from the PDS (Ray, 2007).
In spite of the importance of PDS in total nutritional intake in the diet, its impact on overall
nutritional intake and outcomes is not well founded in the literature. In terms of impact of PDS on
child health outcomes, the only research paper that exists is by Tarozzi (2005).6 Rest of the papers
look at the link between PDS and consumption of calories, protein and fat and come up with
contrasting results.
Foodgrains provided through PDS affects the nutritional intake of the households in direct and
indirect ways. Providing foodgrains at subsidised rates to households with low levels of nutritional
intake directly improves their total energy intake. Food price subsidies as provided through PDS
could also push households to consume more calories from other more nutritious food items which
could further improve the quality of their diets. Kochar (2005) examined the outcome of greater
consumer subsidy or implicit income transfer to the BPL households owing to the change in PDS
from a universal to a targeted scheme in 1997. She finds that the greater wheat subsidy to the BPL
households did not lead to an improvement in their overall calorie intake. Kaushal and Muchomba
(2013) also evaluate the impact of the transition from universal to a targeted PDS on the nutritional
intake using nationally representative data for the period 1993-94 and 2009-10. While the sample
of states in Kochar (2005) was restricted only to the wheat consuming states, Kaushal and
Muchomba (2013) including the rice consuming states as well since the states which have
performed better in terms of providing foodgrains have been the rice consuming ones. Both the
results though are quite similar. There is a negligible to negative effect of the greater consumer
subsidy from PDS on total calorie intake. The contribution of wheat and rice, which are provided
through PDS as a source of calories have increased but the contribution of coarse cereals and other
more nutritious food items such as pulses, eggs, fish and meat has been unaffected. Contrary to
these earlier studies, evaluating the PDS reforms in the state of Chhattisgarh, Krishnamurthy et. al
(2013) find that PDS reforms have not only increased the intake of calories, but improved the
6 It focuses on the link between child malnutrition and PDS. He finds that a sudden reduction in the foodgrains subsidy
as provided through PDS has no impact of child nutrition as measured by weight-for-age, casting doubt on the ability
of the PDS to provide nutritional security.
quality of diet as well. Household diets have a greater share of calories from pulses and other
animal-based proteins.
The estimation methodology as adopted in Kochar (2005) and Kaushal and Muchomba (2013)
have their limitations. Kochar (2005) compares the change in nutrient intake of the poorer
households after PDS became a targeted scheme. But, the baseline survey which she uses does not
have information on whether the household was officially classified as poor or not. Based upon
certain observable characteristics of the household, Kochar (2005) estimates the probability of a
household being poor. Jensen & Miller (2011) argue that such an identification of the poor
households is incorrect. Incorrect identification of poor and nonpoor households may bias the
result towards finding a statistically insignificant relationship between nutrient intake and
consumer food subsidy. Kaushal & Muchomba (2013) encounter a similar problem. In the absence
of any identification of the poor households in the survey they used, they also use a regression
method to arrive at the predicted probability of a household being poor. Recognizing the
impreciseness of their identification method, they drop those households from the sample with
monthly per capita expenditure (MPCE) less than the median to ensure a reasonable comparison.
Their method suffers from some arbitrariness. Restricting the sample reduces the number of
observation and leads to a loss of predictive power. The limitations of Kochar’s (2005) study, viz.
the calculation of the probability of being a poor household, is also valid here. Another point worth
noting here is that these evaluation studies use data for the period when the amount of foodgrains
consumed through PDS was extremely low for most states. Krishnamurthy et. al. (2013), on the
other hand focus on the state of Chhattisgarh which underwent large scale expansion of PDS during
1999-00 and 2004-05. Using the difference in difference methods with the districts in the
neighboring state of Chhattisgarh as the control group, Krishnamurthy et al (2013) find a
substantial rise in the importance of PDS as a source of calories and it facilitated an improvement
in diet quality of the households.
4. Data and Descriptive Statistics
Data used in this paper comes from the nationally representative consumer expenditure surveys
(CES) as carried out by the National Sample Survey Organization (NSSO). Two rounds of the data
constituting 3819 and 2973 rural households in Odisha for the years 2004-05 and 2011-12
respectively is used here. The survey collects household level information on the quantity
consumed of a range of food and non-food items and the expenditure incurred on them in the last
30 days7. Quantity and expenditure information on the items consumed from PDS like rice, wheat,
sugar and kerosene is also collected as a part of the surveys. These surveys also contain information
on the monthly per-capita expenditure (MPCE) and other socio-economic characteristics of the
households which includes their geographical location, social group, religion, composition of the
household, type of ration card held and the durable goods possessed. The sample design used in
these surveys makes it representative of the districts for the rural and urban areas seperately
(Chaudhuri and Gupta, 2009). The impact of PDS is quantified using the cross-sectional variation
over time. The 2004-05 survey acts as a baseline since a universal PDS in Odisha came into being
in 2008 while the information from 2011-12 survey captures the post-intervention outcomes. The
sample is restricted to rural areas of Odisha since the PDS revival has been more effective in the
rural areas.
We convert the consumption of food items into its nutrient content (calorie, protein and fat) using
the nutrient content of Indian food items according to Gopalan et al (1991).8 There was a slight
change in the survey questionnaire over time. The 2004-05 survey did not take into account the
consumption of free meals. Though free meals constitute a very small part of the daily intake,
nutrient intake from free meals has been removed for the sake of comparability here. To look at
the source of nutrients and the variety of food items in the diet, food consumption is sub-divided
into the following six groups: cereals, pulses, dairy products, eggs, fish and meat, fruits and
vegetables, edible oils and other food items.
4.1 Descriptive Statistics
Per-capita expenditure in rural Odisha is lower than the all-India average. Within Odisha, KBK
region has a lower MPCE as compared to other districts. In 2004-05, monthly per-capita
expenditure in the KBK districts of Odisha in stood at Rs. 294.95 as compared to Rs. 415.32 in the
other districts at 2004-05 constant prices. KBK districts continue to have a lower level of
7 There were two survey schedules used in 2011-12 based upon the 30 days and 7 days recall period. This article uses
the 30 days schedule for the sake of comparability over time. 8 Nutrient conversion charts by Gopalan et al (1991) are also used by the Government of India in their calculations.
expenditure in 2011-12 as well but the gap between MPCE of the KBK and non-KBK districts has
narrowed down in 2011-12 as compared to 2004-05.
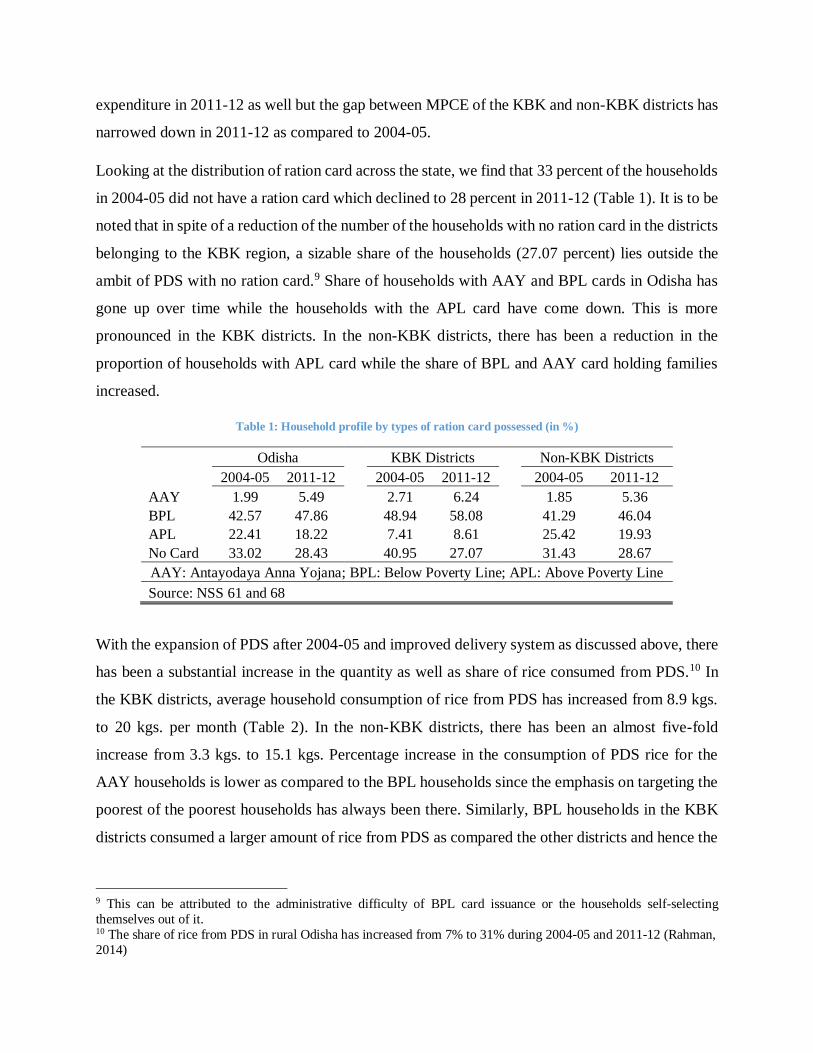
Looking at the distribution of ration card across the state, we find that 33 percent of the households
in 2004-05 did not have a ration card which declined to 28 percent in 2011-12 (Table 1). It is to be
noted that in spite of a reduction of the number of the households with no ration card in the districts
belonging to the KBK region, a sizable share of the households (27.07 percent) lies outside the
ambit of PDS with no ration card.9 Share of households with AAY and BPL cards in Odisha has
gone up over time while the households with the APL card have come down. This is more
pronounced in the KBK districts. In the non-KBK districts, there has been a reduction in the
proportion of households with APL card while the share of BPL and AAY card holding families
increased.
Table 1: Household profile by types of ration card possessed (in %)
Odisha KBK Districts Non-KBK Districts
2004-05 2011-12 2004-05 2011-12 2004-05 2011-12
AAY 1.99 5.49 2.71 6.24 1.85 5.36
BPL 42.57 47.86 48.94 58.08 41.29 46.04
APL 22.41 18.22 7.41 8.61 25.42 19.93
No Card 33.02 28.43 40.95 27.07 31.43 28.67
AAY: Antayodaya Anna Yojana; BPL: Below Poverty Line; APL: Above Poverty Line
Source: NSS 61 and 68
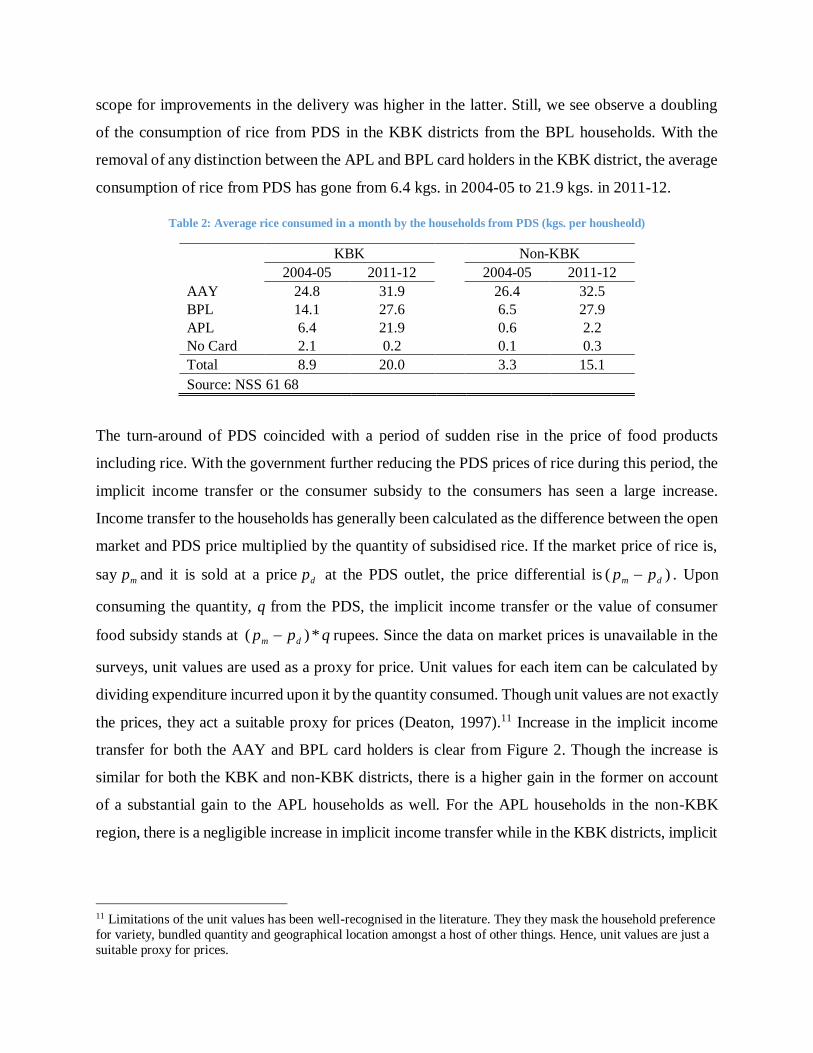
With the expansion of PDS after 2004-05 and improved delivery system as discussed above, there
has been a substantial increase in the quantity as well as share of rice consumed from PDS.10 In
the KBK districts, average household consumption of rice from PDS has increased from 8.9 kgs.
to 20 kgs. per month (Table 2). In the non-KBK districts, there has been an almost five-fold
increase from 3.3 kgs. to 15.1 kgs. Percentage increase in the consumption of PDS rice for the
AAY households is lower as compared to the BPL households since the emphasis on targeting the
poorest of the poorest households has always been there. Similarly, BPL households in the KBK
districts consumed a larger amount of rice from PDS as compared the other districts and hence the
9 This can be attributed to the administrative difficulty of BPL card issuance or the households self-selecting
themselves out of it. 10 The share of rice from PDS in rural Odisha has increased from 7% to 31% during 2004-05 and 2011-12 (Rahman,
2014)
scope for improvements in the delivery was higher in the latter. Still, we see observe a doubling
of the consumption of rice from PDS in the KBK districts from the BPL households. With the
removal of any distinction between the APL and BPL card holders in the KBK district, the average
consumption of rice from PDS has gone from 6.4 kgs. in 2004-05 to 21.9 kgs. in 2011-12.
Table 2: Average rice consumed in a month by the households from PDS (kgs. per housheold)
KBK Non-KBK
2004-05 2011-12 2004-05 2011-12
AAY 24.8 31.9 26.4 32.5
BPL 14.1 27.6 6.5 27.9
APL 6.4 21.9 0.6 2.2
No Card 2.1 0.2 0.1 0.3
Total 8.9 20.0 3.3 15.1
Source: NSS 61 68
The turn-around of PDS coincided with a period of sudden rise in the price of food products
including rice. With the government further reducing the PDS prices of rice during this period, the
implicit income transfer or the consumer subsidy to the consumers has seen a large increase.
Income transfer to the households has generally been calculated as the difference between the open
market and PDS price multiplied by the quantity of subsidised rice. If the market price of rice is,
say mp and it is sold at a price dp at the PDS outlet, the price differential is )( dm pp . Upon
consuming the quantity, q from the PDS, the implicit income transfer or the value of consumer
food subsidy stands at qpp dm *)( rupees. Since the data on market prices is unavailable in the
surveys, unit values are used as a proxy for price. Unit values for each item can be calculated by
dividing expenditure incurred upon it by the quantity consumed. Though unit values are not exactly
the prices, they act a suitable proxy for prices (Deaton, 1997).11 Increase in the implicit income
transfer for both the AAY and BPL card holders is clear from Figure 2. Though the increase is
similar for both the KBK and non-KBK districts, there is a higher gain in the former on account
of a substantial gain to the APL households as well. For the APL households in the non-KBK
region, there is a negligible increase in implicit income transfer while in the KBK districts, implicit
11 Limitations of the unit values has been well-recognised in the literature. They they mask the household preference
for variety, bundled quantity and geographical location amongst a host of other things. Hence, unit values are just a
suitable proxy for prices.
income transfer to the APL households is close to Rs. 200, slightly less as compared to the BPL
households there.
Figure 2: Average monthly implicit income transfer to the households
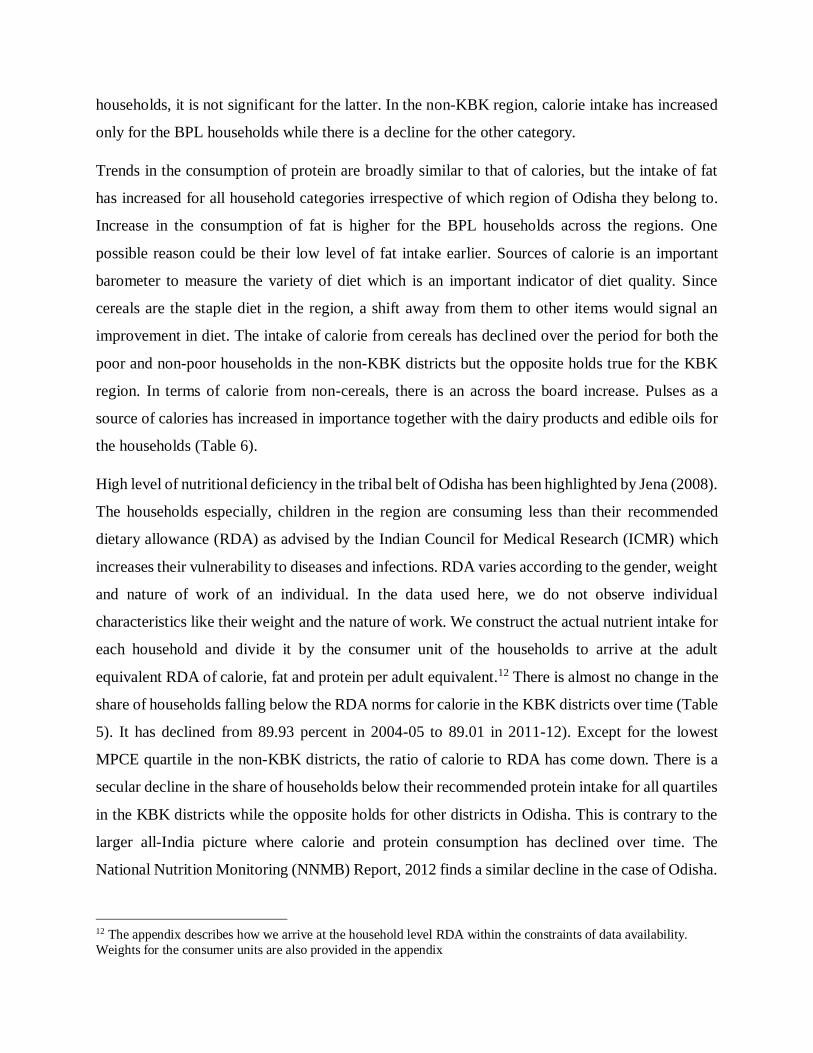
Average nutrient intake is lower in the KBK region of Odisha (Table 3). In 2011-12, mean per-
capita daily calorie intake was 1819 kcal in districts belonging to the KBK region as compared to
2046.5 kcal in non-KBK region. Similar pattern exists for fats and protein. For households
differentiated on the basis of ration cards, those with the APL card are better with respect to others
in terms of nutrient intake. AAY card holders in the KBK region consumed a lower amount of fat
than the BPL households, but their daily intake of calorie and protein is higher. For the non-KBK
districts, it is difficult to differentiate between the AAY and BPL households. In Table 4, we
compare changes in the average nutrient intake over the two survey rounds using the t-test. Since,
the AAY households constitute a small proportion of our sample and they are also poor, we include
them in the BPL category here. Table 6 reports the intake of not only the major macronutrients-
calorie, protein and fat but also the calorie sources for the major food groups as described earlier.
Overall, there is an increase in the intake of calories. But, it is not found to be statistically
significant. For the BPL households, this increase is not only larger but statistically significant
(Table 4). Increase in consumption of calories is larger for the BPL households belonging to the
KBK region (237.3 kcal as compared to 45.1 kcal in the non-KBK region). In the KBK region,
though there is an overall increase in the calorie intake for the BPL as well as the non-BPL
households, it is not significant for the latter. In the non-KBK region, calorie intake has increased
only for the BPL households while there is a decline for the other category.
Trends in the consumption of protein are broadly similar to that of calories, but the intake of fat
has increased for all household categories irrespective of which region of Odisha they belong to.
Increase in the consumption of fat is higher for the BPL households across the regions. One
possible reason could be their low level of fat intake earlier. Sources of calorie is an important
barometer to measure the variety of diet which is an important indicator of diet quality. Since
cereals are the staple diet in the region, a shift away from them to other items would signal an
improvement in diet. The intake of calorie from cereals has declined over the period for both the
poor and non-poor households in the non-KBK districts but the opposite holds true for the KBK
region. In terms of calorie from non-cereals, there is an across the board increase. Pulses as a
source of calories has increased in importance together with the dairy products and edible oils for
the households (Table 6).
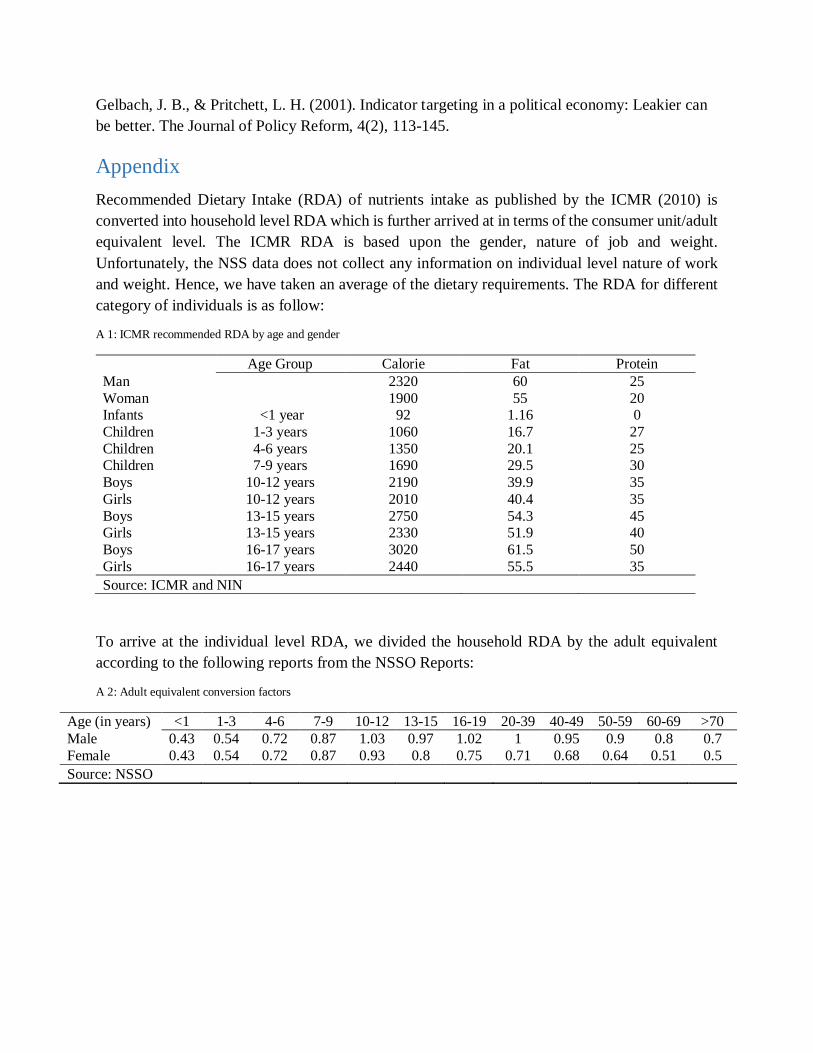
High level of nutritional deficiency in the tribal belt of Odisha has been highlighted by Jena (2008).
The households especially, children in the region are consuming less than their recommended
dietary allowance (RDA) as advised by the Indian Council for Medical Research (ICMR) which
increases their vulnerability to diseases and infections. RDA varies according to the gender, weight
and nature of work of an individual. In the data used here, we do not observe individual
characteristics like their weight and the nature of work. We construct the actual nutrient intake for
each household and divide it by the consumer unit of the households to arrive at the adult
equivalent RDA of calorie, fat and protein per adult equivalent.12 There is almost no change in the
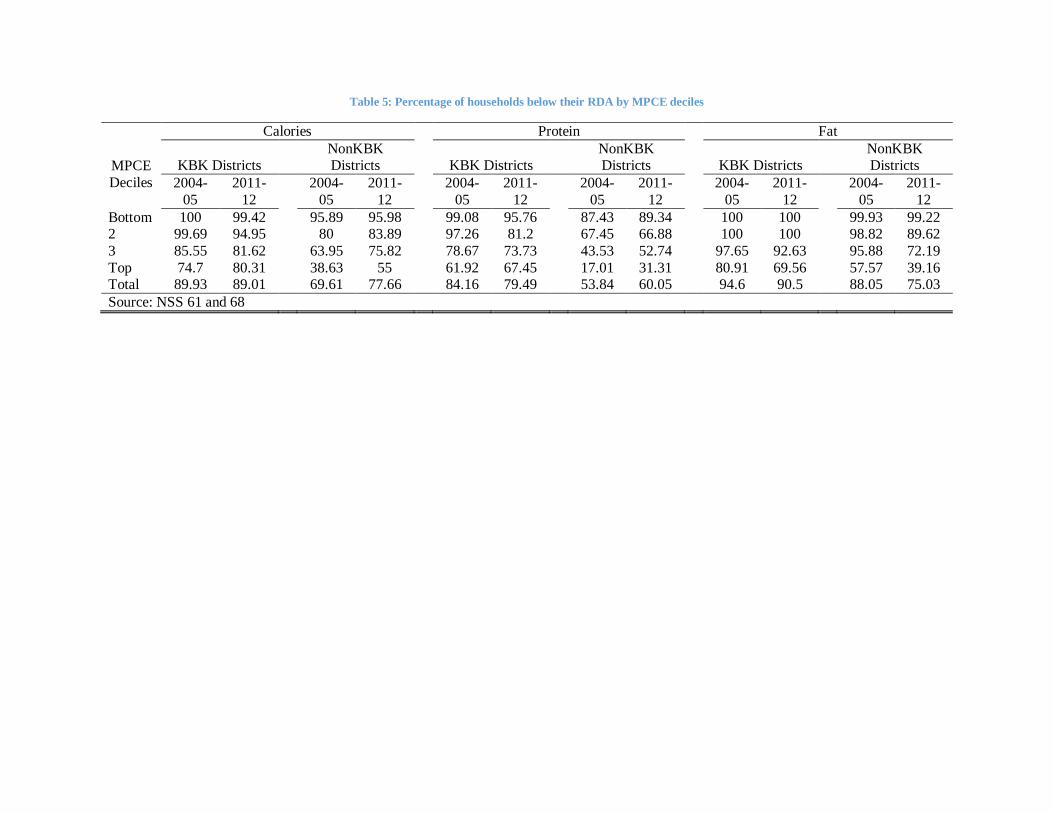
share of households falling below the RDA norms for calorie in the KBK districts over time (Table
5). It has declined from 89.93 percent in 2004-05 to 89.01 in 2011-12). Except for the lowest
MPCE quartile in the non-KBK districts, the ratio of calorie to RDA has come down. There is a
secular decline in the share of households below their recommended protein intake for all quartiles
in the KBK districts while the opposite holds for other districts in Odisha. This is contrary to the
larger all-India picture where calorie and protein consumption has declined over time. The
National Nutrition Monitoring (NNMB) Report, 2012 finds a similar decline in the case of Odisha.
12 The appendix describes how we arrive at the household level RDA within the constraints of data availability.
Weights for the consumer units are also provided in the appendix
This anomaly may be a reflection of the extremely low of nutrient intake in the KBK region.
Deaton & Dreze (2009) have argued that the decline in the energy intake is not a worry since there
has been a change in nature of occupation which require less manual labour. An improvement in
the sanitation and health requirement has further lowered nutrient requirements. Their argument
might not hold for the rural KBK districts where a majority households are still employed in
agriculture and mortality remains high. In addition, the state of sanitation and water availability
remains inadequate. In terms of fat intake, all households in the first and second MPCE quartiles
of the KBK districts are found to be below their RDA.
The triple DID estimator, 𝜏𝐷𝐼𝐷𝑡𝑟 gives a measure of the move towards universal PDS in KBK
districts on its BPL population. By subtracting the change over time for the BPL households in the
non-KBK region, i.e. 𝐸(𝑌1,𝐵𝑃𝐿𝐶 − 𝑌0,𝐵𝑃𝐿
𝐶 |𝑇 = 0) and other non-BPL households in KBK districts
viz. (𝐸(𝑌1,𝑜𝑡ℎ𝑇 − 𝑌0,𝑜𝑡ℎ
𝑇 |𝑇 = 1) from changes in BPL households belonging to the KBK districts,
𝜏𝐷𝐼𝐷𝑡𝑟 informs us of the true impact of the removal of APL-BPL difference in the KBK region upon
the BPL households.
The outcome variable in the above econometric specification are the major macronutrients- calorie,
fat and protein in daily per-capita terms. In addition to that we look at the amount of calorie
consumed through different food source- pulses, dairy products, eggs, fish and meat, vegetable
and fruits, edible oils and others.14 It is essential to control for the socio-economic and other
demographic characteristics since the nutritional status of the households are not invariant to them.
Chronic energy deficiency is found to vary across religions, social groups, occupation of the
household head, literacy, income and landholding pattern (National Institute of Nutrition, 2012).
We take into account these factors while running the regressions.
We control for the household characteristics such as social groups (ST, SC, OBC and others),
primary occupation of the household (self-employed in agriculture, self-employed in non-
agriculture and others), religion (Hinduism, Islam, Christianity and others), size of the household,
share of children in the age group of 0-6 and 7-14, land size decile class, monthly per-capita
expenditure (MPCE) decile class, gender and educational attainment of the household head,
sources of cooking and lighting and whether there is a salaried member in the household.
6 Estimation Results
Results from the DID regressions are presented in Table 6. Estimates as reported in column (1)
were arrived at by controlling for the district fixed effects but not for the household characteristics.
In the column (2), both district fixed effects and the household characteristics were controlled for.
14 Regression uses a logarithmic transformation for the nutrient intake.
Columns (3)-(5) report results from the quantile DID regression at the 25th, 50th and 75th quantile.
The results suggest that the universal PDS in KBK region has led to 8 percent increase in per-
capita intake of calories. Similarly, the per-capita protein and fat-intake have increased by 8 and
10 percent respectively in the KBK districts. Controlling for the covariates and including the
district fixed effects, the coefficients decline slightly but the broader pattern remains the same.
Coefficients on the time dummy is positive for nutrients (calorie, protein and fat), but the KBK
region dummy is found be statistically insignificant.
One can see from the column (2) that on account of a universal PDS, there has been 7 percent
increase in the consumption of calories and protein while fat intake has increased by 11 percent in
the KBK region. Increase in the intake of non-cereals (20 percent) is larger than that of cereals (21
percent). Since, cereals are supplied through the PDS, we expect the coefficient to be positive and
significant which we do find.15 We also find a greater gain in the consumption of non-cereals
which suggests a greater diversity in the diet. Looking at the coefficients in the case of various
calorie sources as the outcome variables, we find a greater consumption of calorie from pulses,
animal proteins, fruits and vegetables and edible oil. There has been 42 percent increase in the
consumption of pulses, 27 percent in the case of calories from eggs, fish and meat, 33 percent from
vegetables and fruits and 27 percent from the edible oils. No increase in the consumption of dairy
products is found. The quantile DID estimates (columns (3-5) in Table 8) suggest a greater impact
on the nutrient intake for the lowers quantile.16 There has been 44 percent increase in calories from
pulses for those in the lowest quantile. This decreases monotonically as one goes up the higher
quantiles. Similar is the pattern for eggs, fish and meat and vegetables and fruits.
Table 6: Difference in Difference Estimates
Without covariates and
District FEs
With Covariates and District FEs
Quantiles
OLS OLS 0.25 0.5 0.75
(1) (2) (3) (4) (5)
15 Of course, we can have a negative coefficient when the outcome variable is calorie from cereals. Since, the
households are consuming a greater amount of rice than earlier from PDS, a negative coefficient would be found. 16 Impact is the same across quantiles for protein.
Notes: The covariates used in the estimates for columns (2)-(4) are the household social
groups (ST, SC, OBC and others), household type, religion, size of the household,
percentage of children in the age group of 0-6 and 7-14, land size class, gender and
educational attainment of the housheold head, sources of cooking and lighting ans wether
the household has a salaried member. Standard errors are provided in parentheses. ***
p<0.01, ** p<0.05, * p<0.1
6.1 Ratio of nutrient intake and the RDA
Summary statistics suggest that households in the KBK districts of Odisha fall well short of their
recommended nutrient intake. To investigate whether a universal PDS in the KBK region furthered
their progression towards their RDA of calories, protein and fat, we run separate DID regression
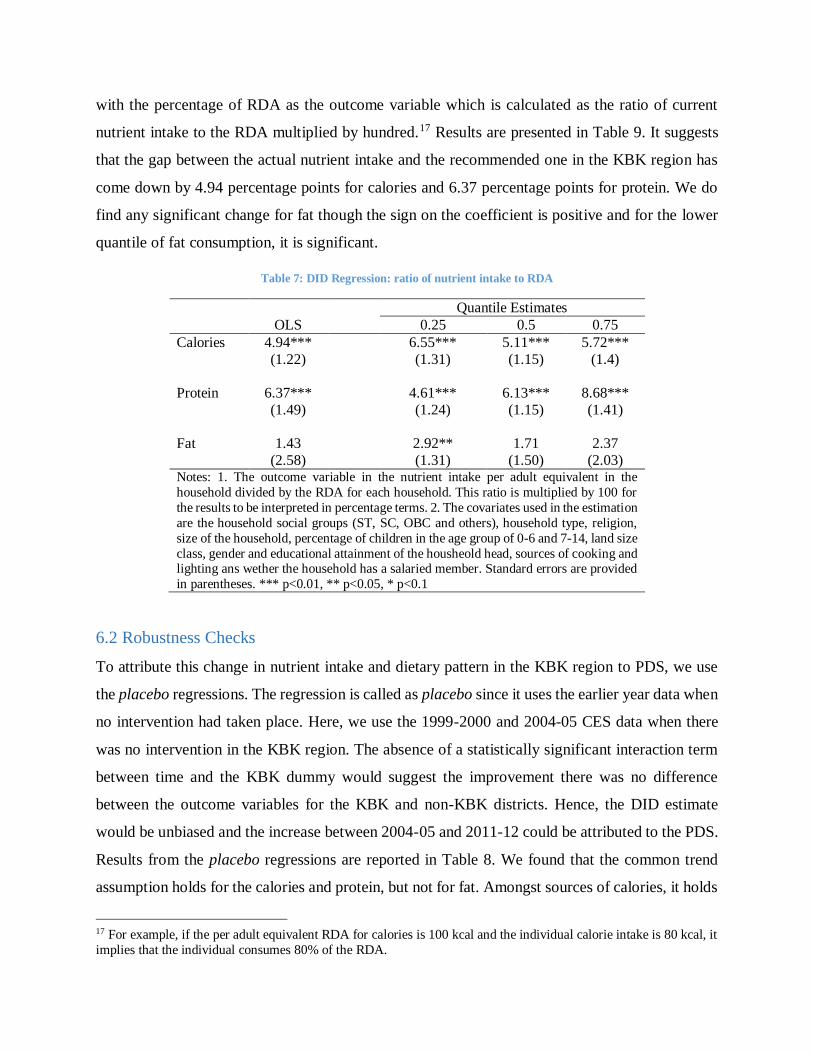
with the percentage of RDA as the outcome variable which is calculated as the ratio of current
nutrient intake to the RDA multiplied by hundred.17 Results are presented in Table 9. It suggests
that the gap between the actual nutrient intake and the recommended one in the KBK region has
come down by 4.94 percentage points for calories and 6.37 percentage points for protein. We do
find any significant change for fat though the sign on the coefficient is positive and for the lower
quantile of fat consumption, it is significant.
Table 7: DID Regression: ratio of nutrient intake to RDA
OLS
Quantile Estimates
0.25 0.5 0.75
Calories 4.94*** 6.55*** 5.11*** 5.72***
(1.22) (1.31) (1.15) (1.4)
Protein 6.37*** 4.61*** 6.13*** 8.68***
(1.49) (1.24) (1.15) (1.41)
Fat 1.43 2.92** 1.71 2.37
(2.58) (1.31) (1.50) (2.03) Notes: 1. The outcome variable in the nutrient intake per adult equivalent in the
household divided by the RDA for each household. This ratio is multiplied by 100 for
the results to be interpreted in percentage terms. 2. The covariates used in the estimation
are the household social groups (ST, SC, OBC and others), household type, religion,
size of the household, percentage of children in the age group of 0-6 and 7-14, land size
class, gender and educational attainment of the housheold head, sources of cooking and lighting ans wether the household has a salaried member. Standard errors are provided
in parentheses. *** p<0.01, ** p<0.05, * p<0.1
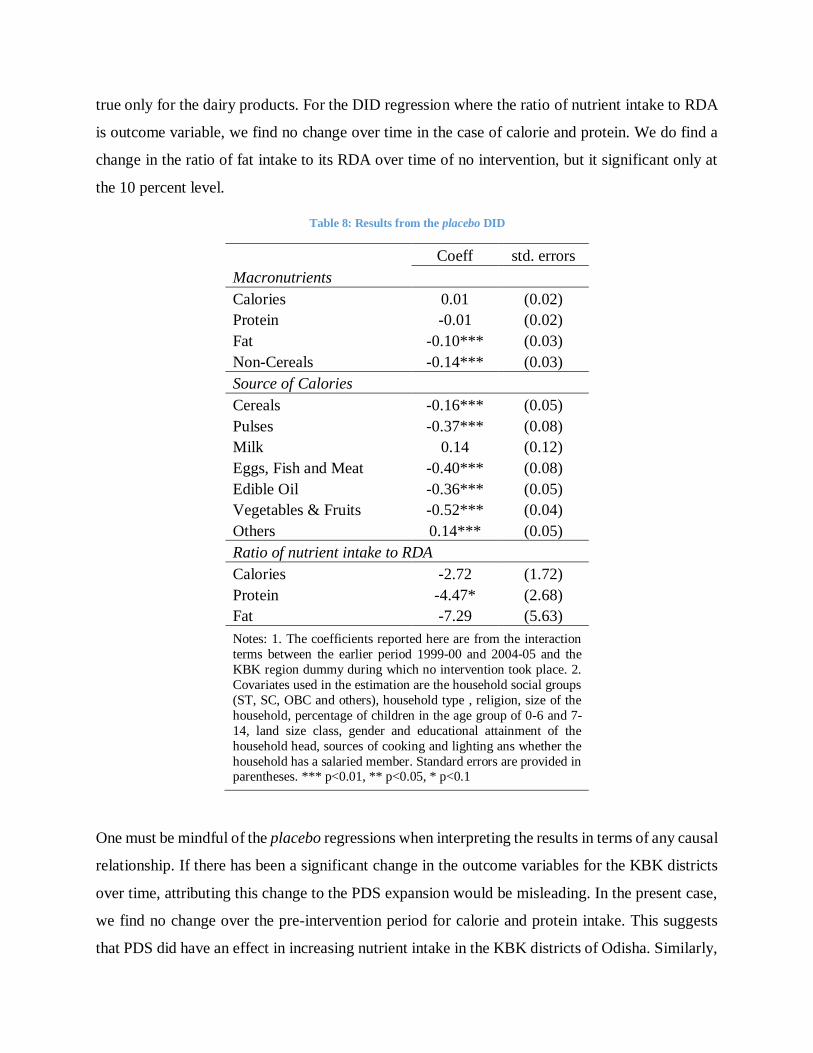
6.2 Robustness Checks
To attribute this change in nutrient intake and dietary pattern in the KBK region to PDS, we use
the placebo regressions. The regression is called as placebo since it uses the earlier year data when
no intervention had taken place. Here, we use the 1999-2000 and 2004-05 CES data when there
was no intervention in the KBK region. The absence of a statistically significant interaction term
between time and the KBK dummy would suggest the improvement there was no difference
between the outcome variables for the KBK and non-KBK districts. Hence, the DID estimate
would be unbiased and the increase between 2004-05 and 2011-12 could be attributed to the PDS.
Results from the placebo regressions are reported in Table 8. We found that the common trend
assumption holds for the calories and protein, but not for fat. Amongst sources of calories, it holds
17 For example, if the per adult equivalent RDA for calories is 100 kcal and the individual calorie intake is 80 kcal, it
implies that the individual consumes 80% of the RDA.
true only for the dairy products. For the DID regression where the ratio of nutrient intake to RDA
is outcome variable, we find no change over time in the case of calorie and protein. We do find a
change in the ratio of fat intake to its RDA over time of no intervention, but it significant only at
the 10 percent level.
Table 8: Results from the placebo DID
Coeff std. errors
Macronutrients
Calories 0.01 (0.02)
Protein -0.01 (0.02)
Fat -0.10*** (0.03)
Non-Cereals -0.14*** (0.03)
Source of Calories
Cereals -0.16*** (0.05)
Pulses -0.37*** (0.08)
Milk 0.14 (0.12)
Eggs, Fish and Meat -0.40*** (0.08)
Edible Oil -0.36*** (0.05)
Vegetables & Fruits -0.52*** (0.04)
Others 0.14*** (0.05)
Ratio of nutrient intake to RDA
Calories -2.72 (1.72)
Protein -4.47* (2.68)
Fat -7.29 (5.63)
Notes: 1. The coefficients reported here are from the interaction
terms between the earlier period 1999-00 and 2004-05 and the
KBK region dummy during which no intervention took place. 2.
Covariates used in the estimation are the household social groups
(ST, SC, OBC and others), household type , religion, size of the
household, percentage of children in the age group of 0-6 and 7-
14, land size class, gender and educational attainment of the
household head, sources of cooking and lighting ans whether the
household has a salaried member. Standard errors are provided in parentheses. *** p<0.01, ** p<0.05, * p<0.1
One must be mindful of the placebo regressions when interpreting the results in terms of any causal
relationship. If there has been a significant change in the outcome variables for the KBK districts
over time, attributing this change to the PDS expansion would be misleading. In the present case,
we find no change over the pre-intervention period for calorie and protein intake. This suggests
that PDS did have an effect in increasing nutrient intake in the KBK districts of Odisha. Similarly,
improvements in the ratio of nutrient intake to RDA can be attributed to PDS. Though, we cannot
say the same for the different calorie sources as their consumption pattern do not follow the same
trend.
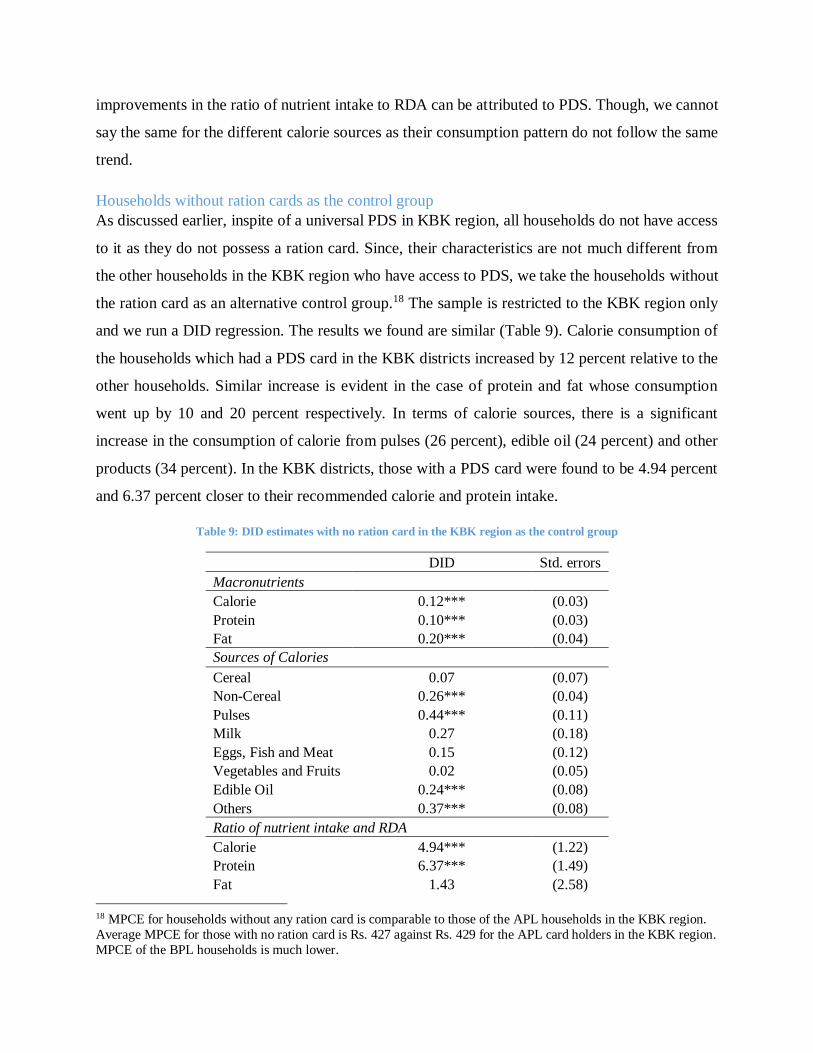
Households without ration cards as the control group
As discussed earlier, inspite of a universal PDS in KBK region, all households do not have access
to it as they do not possess a ration card. Since, their characteristics are not much different from
the other households in the KBK region who have access to PDS, we take the households without
the ration card as an alternative control group.18 The sample is restricted to the KBK region only
and we run a DID regression. The results we found are similar (Table 9). Calorie consumption of
the households which had a PDS card in the KBK districts increased by 12 percent relative to the
other households. Similar increase is evident in the case of protein and fat whose consumption
went up by 10 and 20 percent respectively. In terms of calorie sources, there is a significant
increase in the consumption of calorie from pulses (26 percent), edible oil (24 percent) and other
products (34 percent). In the KBK districts, those with a PDS card were found to be 4.94 percent
and 6.37 percent closer to their recommended calorie and protein intake.
Table 9: DID estimates with no ration card in the KBK region as the control group
DID Std. errors
Macronutrients
Calorie 0.12*** (0.03)
Protein 0.10*** (0.03)
Fat 0.20*** (0.04)
Sources of Calories
Cereal 0.07 (0.07)
Non-Cereal 0.26*** (0.04)
Pulses 0.44*** (0.11)
Milk 0.27 (0.18)
Eggs, Fish and Meat 0.15 (0.12)
Vegetables and Fruits 0.02 (0.05)
Edible Oil 0.24*** (0.08)
Others 0.37*** (0.08)
Ratio of nutrient intake and RDA
Calorie 4.94*** (1.22)
Protein 6.37*** (1.49)
Fat 1.43 (2.58)
18 MPCE for households without any ration card is comparable to those of the APL households in the KBK region.
Average MPCE for those with no ration card is Rs. 427 against Rs. 429 for the APL card holders in the KBK region.
MPCE of the BPL households is much lower.
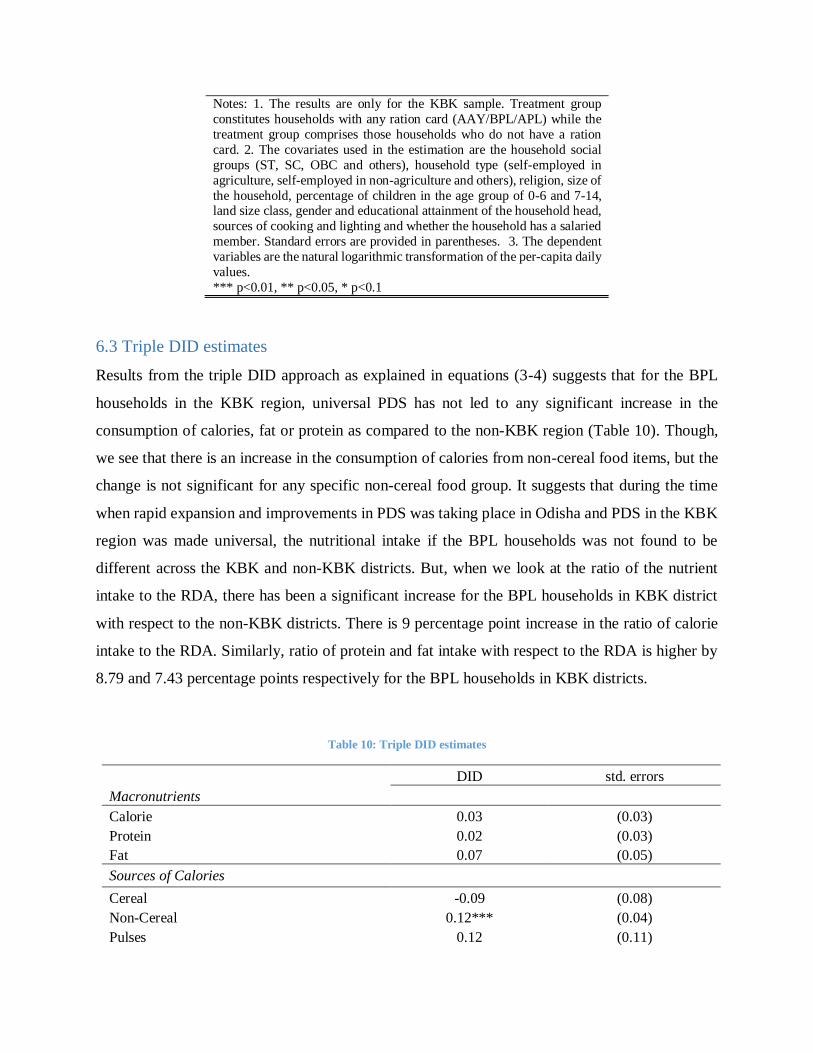
Notes: 1. The results are only for the KBK sample. Treatment group
constitutes households with any ration card (AAY/BPL/APL) while the
treatment group comprises those households who do not have a ration
card. 2. The covariates used in the estimation are the household social
groups (ST, SC, OBC and others), household type (self-employed in
agriculture, self-employed in non-agriculture and others), religion, size of
the household, percentage of children in the age group of 0-6 and 7-14, land size class, gender and educational attainment of the household head,
sources of cooking and lighting and whether the household has a salaried
member. Standard errors are provided in parentheses. 3. The dependent
variables are the natural logarithmic transformation of the per-capita daily
values.
*** p<0.01, ** p<0.05, * p<0.1
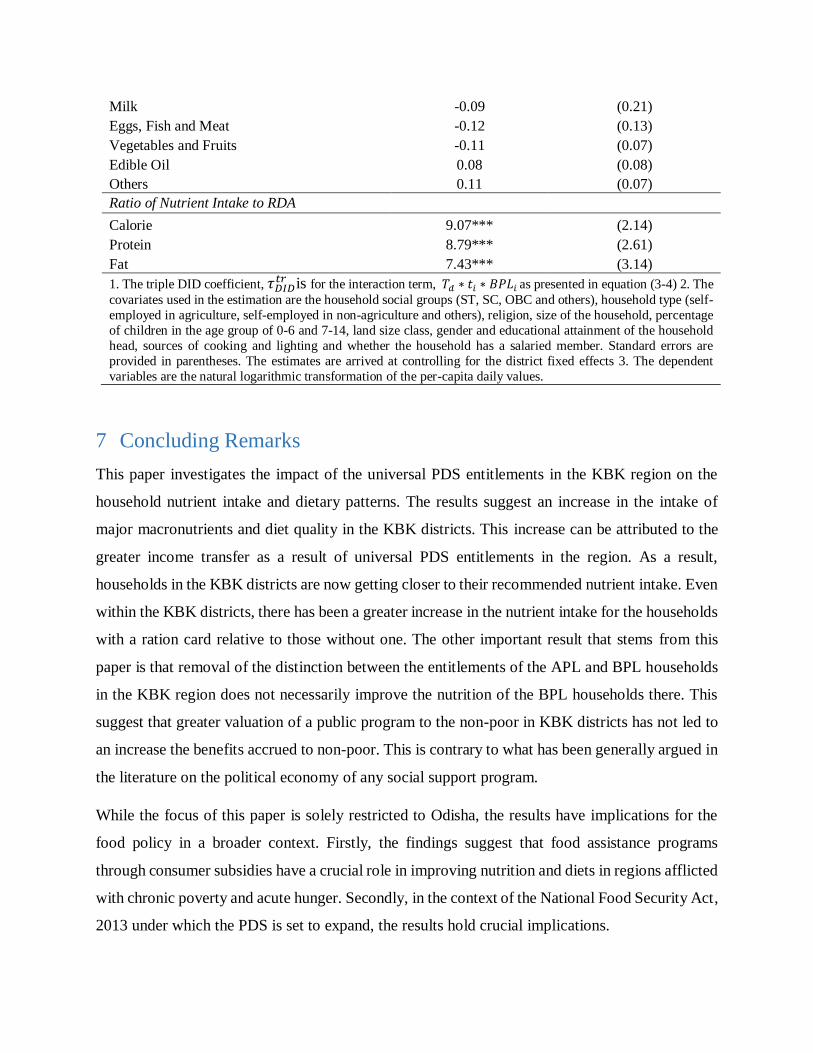
6.3 Triple DID estimates
Results from the triple DID approach as explained in equations (3-4) suggests that for the BPL
households in the KBK region, universal PDS has not led to any significant increase in the
consumption of calories, fat or protein as compared to the non-KBK region (Table 10). Though,
we see that there is an increase in the consumption of calories from non-cereal food items, but the
change is not significant for any specific non-cereal food group. It suggests that during the time
when rapid expansion and improvements in PDS was taking place in Odisha and PDS in the KBK
region was made universal, the nutritional intake if the BPL households was not found to be
different across the KBK and non-KBK districts. But, when we look at the ratio of the nutrient
intake to the RDA, there has been a significant increase for the BPL households in KBK district
with respect to the non-KBK districts. There is 9 percentage point increase in the ratio of calorie
intake to the RDA. Similarly, ratio of protein and fat intake with respect to the RDA is higher by
8.79 and 7.43 percentage points respectively for the BPL households in KBK districts.
Table 10: Triple DID estimates
DID std. errors
Macronutrients
Calorie 0.03 (0.03)
Protein 0.02 (0.03)
Fat 0.07 (0.05)
Sources of Calories
Cereal -0.09 (0.08)
Non-Cereal 0.12*** (0.04)
Pulses 0.12 (0.11)
Milk -0.09 (0.21)
Eggs, Fish and Meat -0.12 (0.13)
Vegetables and Fruits -0.11 (0.07)
Edible Oil 0.08 (0.08)
Others 0.11 (0.07)
Ratio of Nutrient Intake to RDA
Calorie 9.07*** (2.14)
Protein 8.79*** (2.61)
Fat 7.43*** (3.14)
1. The triple DID coefficient, 𝜏𝐷𝐼𝐷𝑡𝑟 is for the interaction term, 𝑇𝑑 ∗ 𝑡𝑖 ∗ 𝐵𝑃𝐿𝑖 as presented in equation (3-4) 2. The
covariates used in the estimation are the household social groups (ST, SC, OBC and others), household type (self-
employed in agriculture, self-employed in non-agriculture and others), religion, size of the household, percentage
of children in the age group of 0-6 and 7-14, land size class, gender and educational attainment of the household
head, sources of cooking and lighting and whether the household has a salaried member. Standard errors are
provided in parentheses. The estimates are arrived at controlling for the district fixed effects 3. The dependent
variables are the natural logarithmic transformation of the per-capita daily values.
7 Concluding Remarks
This paper investigates the impact of the universal PDS entitlements in the KBK region on the
household nutrient intake and dietary patterns. The results suggest an increase in the intake of
major macronutrients and diet quality in the KBK districts. This increase can be attributed to the
greater income transfer as a result of universal PDS entitlements in the region. As a result,
households in the KBK districts are now getting closer to their recommended nutrient intake. Even
within the KBK districts, there has been a greater increase in the nutrient intake for the households
with a ration card relative to those without one. The other important result that stems from this
paper is that removal of the distinction between the entitlements of the APL and BPL households
in the KBK region does not necessarily improve the nutrition of the BPL households there. This
suggest that greater valuation of a public program to the non-poor in KBK districts has not led to
an increase the benefits accrued to non-poor. This is contrary to what has been generally argued in
the literature on the political economy of any social support program.
While the focus of this paper is solely restricted to Odisha, the results have implications for the
food policy in a broader context. Firstly, the findings suggest that food assistance programs
through consumer subsidies have a crucial role in improving nutrition and diets in regions afflicted
with chronic poverty and acute hunger. Secondly, in the context of the National Food Security Act,
2013 under which the PDS is set to expand, the results hold crucial implications.
Though the findings of this paper suggest that greater consumption of grains through PDS leads to
an improvements in the consumption of non-grains, a generalisation of the result would need
careful consideration. Results arrived here use Odisha as the sample state with KBK districts as
our reference point. Since, the KBK districts have been historically found to be nutrient deficient,
any form of income of income transfer would promote greater food consumption.
References
FAO (2012) The State of Food Insecurity in the World 2012: Economic growth is necessary but
not sufficient to accelerate reduction of hunger and malnutrition. FAO, Rome.
Lentz, E. C., & Barrett, C. B. (2013). The economics and nutritional impacts of food assistance
policies and programs. Food Policy, 42, 151-163.
Jensen, R. T., & Miller, N. H. (2011). Do consumer price subsidies really improve nutrition?.
Review of Economics and Statistics, 93(4), 1205-1223.
Shimokawa, S. (2013). When does dietary knowledge matter to obesity and overweight
prevention?. Food Policy, 38, 35-46.
Kaushal, N., & Muchomba, F. (2013). How Consumer Price Subsidies Affect Nutrition (No.
w19404). National Bureau of Economic Research.
Kochar, A. (2005). Can targeted food programs improve nutrition? An empirical analysis of
India’s Public Distribution System. Economic Development and Cultural Change, 54(1), 203-
235.
Krishnamurthy, P., Pathania, V. S., & Tandon, S. (2013). Food Price Subsidies and Nutrition:
Evidence from State Reforms to India's Public Distribution System. UC Berkeley Public Law
Research Paper No. 2345675.
Menon, P., Deolalikar, A. B., & Bhaskar, A. (2009). India state hunger index: Comparisons of
hunger across states. International Food Policy Research Institute, New Delhi.
World Food Program and Institute of Human Development. Food insecurity atlas of rural India.
Technical report, 2008.
Parida, Nabakishore (2008). Chronic Poverty and Hunger in KBK Region of Orissa: Identifying
Causes in the Perspective of a Case Study in Watershed Development Project in Nabarangpur
District. Unpublished Manuscript. Institute of Social Studies, Hague.
Planning Commission of India (2005). Performance Evaluation of Targeted Public Distribution
System (TPDS). Government of India, New Delhi.
Aggarwal, A. (2011). The PDS in Rural Orissa: Against the Grain. Economic & Political
Weekly, 46 (36), 3.
Wadhwa, Justice D P (2009): “Justice Wadhwa Committee on Public Distribution System,
Orissa”, Available at http://pdscvc.nic.in/orissa-report.htm
Khera, Reetika (2011): “Revival of the Public Distribution System: Evidence and Explanations”,
Economic & Political Weekly, 36-50.
Shah, A., Nayak, S. K., & Das, B. (2008). Remoteness and Chronic Poverty in a Forest Region
of Southern Orissa: A Tale of Entitlement Failure and State Apathy. Chronic poverty research
centre (CPRC).
Kujur, R. K. (2006). Underdevelopment and naxal movement. Economic and Political Weekly,
557-559.
Ray, R. (2007). Changes in food consumption and the implications for food security and
undernourishment: India in the 1990s. Development and Change, 38(2), 321-343.
Tarozzi, A. (2005). The Indian Public Distribution System as provider of food security: Evidence
from child nutrition in Andhra Pradesh. European Economic Review, 49(5), 1305-1330.
Chaudhuri, S., & Gupta, N. (2009). Levels of living and poverty patterns: a district-wise analysis
for India. Economic and Political Weekly, 94-110.
Gopalan, C. et.al. (1991): Nutritive Value of Indian Foods. National Institute of Nutrition, Indian
Council of Medical Research. Hyderabad et.al. (1991): Nutritive Value of Indian Foods. National
Institute of Nutrition, Indian Council of Medical Research, Hyderabad.
National Institute of Nutrition (2012). Diet and nutritional status of rural population prevalence
of hypertension & diabetes among adults and infants & young child feeding practices. National
Institute of Nutrition, Hyderabad.
Deaton, A., & Drèze, J. (2009). Food and nutrition in India: facts and interpretations. Economic
and Political Weekly, 42-65.
Imbens, Guido W. and Wooldridge, Jeffrey M. (2009). Recent developments in the
econometrics of program evaluation. Journal of Economic Literature, 47(1): 5-86.
Ravallion, M. (2007). Evaluating anti-poverty programs. Handbook of development economics,
4, 3787-3846.
Besley, T., Kanbur, S. R., & Mundial, B. (1990). The principles of targeting (Vol. 385). Office of
the Vice President, Development Economics, World Bank.
Gelbach, J. B., & Pritchett, L. (2002). Is more for the poor less for the poor? The politics of
means-tested targeting. Topics in Economic Analysis & Policy, 2(1).