Page 1
1
Universal metrics to compare the effectiveness of
climate change adaptation projects
April 2011
Martin Stadelmann∗, Axel Michaelowa*, Sonja Butzengeiger-Geyer+, Michel Köhler+
Abstract
Adaptation to climate change is increasingly supported through international financing. In contrast to
mitigation, where the effectiveness of policy action can be measured through the metric "tonnes of
CO2 equivalent reduced", no universally accepted metric for assessment of adaptation effectiveness
exists. Without such a metric, adaptation finance vehicles such as the Adaptation Fund under the
Kyoto Protocol encounter challenges when trying to compare the adaptive effect of ongoing or
proposed projects in order to achieve an efficient allocation of their funds. The first experiences with
adaptation funding show a tendency to use intermediate outcome indicators but no final impact
metrics, similar to the state-of-art in development funding. This might lead to a backlash against
adaptation funding by electorates in the North if the funding cannot show clear results. We assess
two possible candidates for generic adaptation effectiveness metrics: 1) wealth saved from
destruction through climate change impacts, and 2) disability-adjusted life years saved (DALYs),
which are widely used in public health policy analysis. Apart from those two metrics we propose to
use no-harm assessments in the environmental and cultural field. We discuss uncertainties
encountered in applying these metrics, including the uncertain link between commonly reported
outcome indicators and our metrics for saved wealth and health. The two metrics are tested by
assessing five adaptation project proposals. Finally, we line out some ideas to handle these
uncertainties, e.g. the use of regularly updated sectoral methodologies and agreed climate and
economic models.
Keywords: Climate change, adaptation, efficiency, parameters, project evaluation, health, wealth
∗ Center for Comparative and International Studies, University of Zurich, Affolternstrasse 56, CH-8050 Zürich, Switzerland. Corresponding
author: [email protected]
+ Perspectives GmbH, Fenglerstr. 9a, D-22041 Hamburg, Germany.
Page 2
2
1. Climate change and the emergence of adaptation policies
Burning of fossil fuels and other human activities have led to an increase of atmospheric CO2
concentrations from around 280 parts per million (ppm) in the preindustrial era to over 379 ppm by
2005. Global temperature increase from preindustrial levels has already reached more than 0.7°C,
and temperatures are expected to further raise 1.1-6.4 °C until 2100 leading to sea-level rise, melting
of ice and changes in wind and precipitation patterns (Solomon et al., 2007).
Due to these alarming trends, anthropogenic climate change has been on the agenda of the
international community for the last two decades and led to a series of multilateral treaties to
address the problem. The United Nations Framework Convention on Climate Change (UNFCCC, 1992)
has the ultimate objective to achieve a “stabilization of greenhouse gas concentrations in the
atmosphere at a level that would prevent dangerous anthropogenic interference with the climate
system. Such a level should be achieved within a time frame sufficient to allow ecosystems to adapt
naturally to climate change, to ensure that food production is not threatened and to enable
economic development to proceed in a sustainable manner” (Art. 2 UNFCCC). The Kyoto Protocol to
the UNFCCC agreed in 1997 has introduced legally binding emissions targets for industrialized
countries and an array of market mechanisms to reduce the costs of reaching those targets. These
market mechanisms include the Clean Development Mechanism (CDM), which allows the generation
of greenhouse gas emissions credits through emission reduction projects in developing countries.
While adaptation to the adverse effects of climate change has generally taken a back seat to
mitigation in international climate policy, Parties to the UNFCCC and the Kyoto Protocol have
increasingly realized that adaptation is vital in order to reduce the impacts of climate change that has
already taken place or to which we they are committed. Therefore, in 2001 the UNFCCC has set up
two funds for adaptation financed by voluntary contributions of industrialized countries – the Least
Developed Countries Fund (LDCF) and Special Climate Change Fund (SCCF), which are managed by
the Global Environment Facility (GEF). In 2007, parties of the Kyoto Protocol established the
Adaptation Fund (AF) with a creative system of financing. The AF receives 2% of all emission credits
(CERs) issued under the CDM, i.e. an in-kind tax on emissions credit transactions. The CERs are then
sold by the Trustee of the AF (i.e. the World Bank) in tranches. However, attempts to extend this tax
to other market mechanisms have failed due to the resistance of Russia and other countries in
transition.
The unexpected success of the CDM has led to a substantial inflow of finance to the AF. By late
February 2011, 550 million CERs had been issued and the AF thus received 11 million CERs, which
currently have a market value of about 170 million USD, which is a large sum raised in only 5 years
compared to the 270 million USD the LDCF and the SCCF have raised together in the last 10 years
(HBS/ODI, 2011).
Besides these existing funds, the negotiations about a post-2012 climate policy regime have led to
the commitment of industrialized countries to provide 30 billion $ of “fast start” financing to
developing countries within the period 2010-2012. Around one third of these funds are allocated
towards adaptation (own analysis using data from HBS/ODI, 2010; WRI, 2010).
Page 3
3
Currently, projects financed with international adaptation funding are not assessed according to
comparable metrics. .The guidelines used by the AF’s Project and Programme Review Committee
(PPRC) entail many criteria for the assessment of projects, such as economic, social, and
environmental benefits, meeting national standards, cost-effectiveness, arrangements for
management and monitoring etc. (AFB, 2010b). These multiple criteria are very general and do not
allow to compare the concrete adaptation effect of project proposals. As another example, the GEF
is missing efficiency indicators and global targets for adaptation projects (GEF, 2008).
From an economic point of view, it would be desirable to maximize the adaptive benefit achieved
with the available financial resources for adaptation, especially given the limited level of these
resources compared with the adaptation needs calculated by Parry et al. (2009), which are three
orders of magnitude higher. This implies that funds need to be allocated to those
projects/programmes that bring most benefits to economies, people and the environment, which
requires first of all clear metrics of the “adaptive benefit” and secondly an evaluation of proposals
with regards to these metrics.
In this paper, we try to identify universal metrics for adaptation benefits and test them by assessing
existing adaptation projects. First, the lack of universal metrics, as well as its opportunities and
challenges are specified. Second, we discuss how the AF and GEF evaluate their adaptation
interventions and assess the currently used indicators. Third, we analyze first attempts in the
literature to use universal indicators and propose two universal metrics: Saved Wealth and Saved
Health. As these metrics depend on long-term results of the projects, we discuss how (measurable)
outcome indicators can be linked with them. To illustrate and test our approach, we apply it to
specific examples and conclude.
Page 4
4
2. Lack of universally accepted metrics: opportunities and challenges
For projects mitigating GHG emissions a universal consensus has emerged that their effectiveness is
to be measured in terms of tCO2 equivalent reduced. This metric is used for all project-based
mechanisms and allows calculating the efficiency of projects in terms of currency units spent to
achieve one t CO2 equivalent reduced.
Regarding adaptation, the situation is much more diffuse as adaptation policies just start to emerge
and even basic concepts of adaptation are still contested. The 4th IPCC assessment report (Adger et
al., 2007) is lamenting the lack of globally accepted and agreed indicators for vulnerability and
adaptive capacity, while also noting that there is no consensus on the usefulness of such generic
indicators. A 2008 workshop on adaptation metrics has not managed to identify universal metrics but
only stated that good adaptation metrics should be comparable but also context-specific and
developed in participatory processes (IGES and WorldBank, 2008). The lack of universal metrics has
continued until today (UNFCCC, 2010a).
The skepticism against global indicators and the call for bottom-up approaches may be linked to the
disciplinary background of many adaptation researchers and stakeholder: they are mainly coming
from qualitative, case-study based social science. In this vein, e.g. Klein (2009) argues that
vulnerability cannot just be defined by technical experts as any definitions involve value judgments.
In his view, a definition rather has to evolve through a “consultative, stakeholder-driven process”.
Economists have not managed to clearly specify adaptation metrics either. While there have been
several highly publicized studies on the economics of adaptation (Agrawala and Fankhauser, 2008;
WorldBank, 2010), they have concentrated on highly aggregated adaptation costs and did not assess
how effectiveness of projects could be measured.
A recent review of approaches for assessing costs and benefits of adaptation options (UNFCCC,
2010b: 68) clearly shows that most approaches focus on either on adaptation costs or vulnerability /
risk management. Only two options clearly compare costs and impacts: cost-benefit analysis (see e.g.
ECAWG, 2009; Moench et al., 2009) and cost-effectiveness analysis. This situation can be compared
to the early days of assessing effectiveness of emission reduction, where the metrics to compare the
effect of different greenhouse gases were contested.
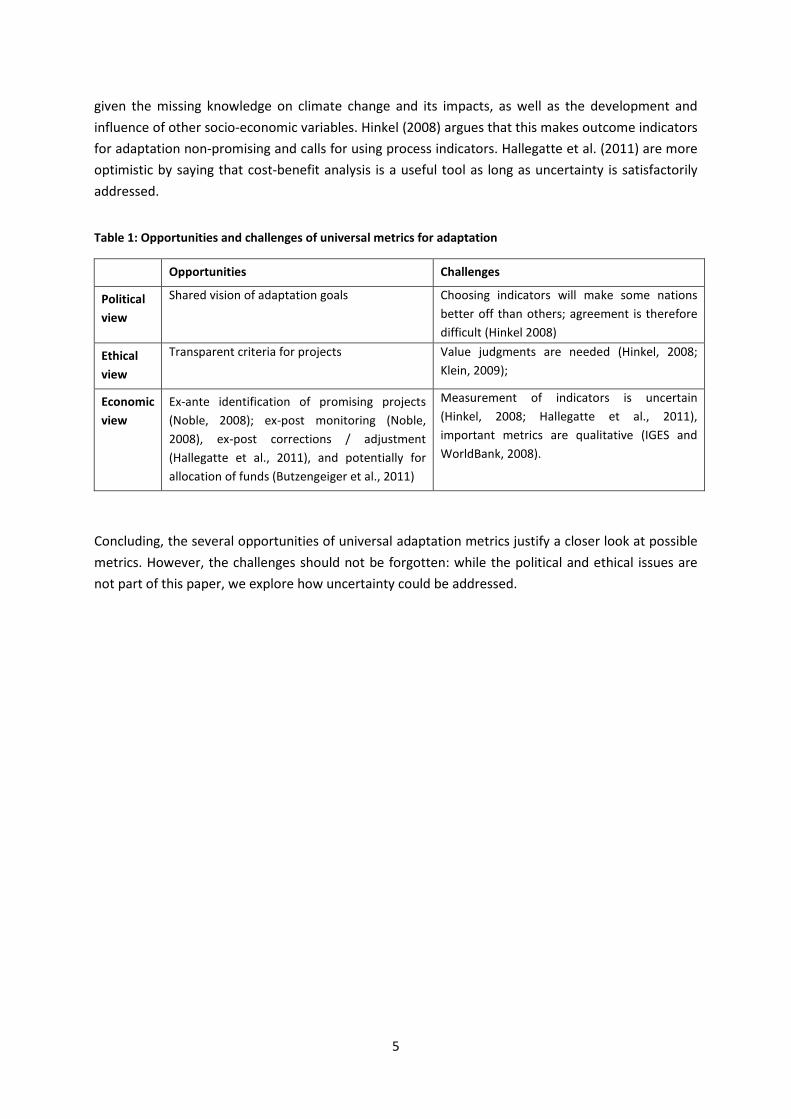
What may be the reasons for the lack of global indicators, apart from disciplinary backgrounds? Table
1 shows that universal metrics have both opportunities and challenges. On the political side, agreed
adaptation metrics may help to improve the shared vision in the climate change regime. However,
political agreement may be difficult as some metrics leave some nations better off than others..
Ethically, universal indicators may bring some transparency in assessing adaptation projects but
some scholars argue that defining universal adaptation metrics will include value judgements, which
raises the question which stakeholders are involved in defining the metrics (Hinkel, 2008; Klein,
2009).
The largest advantages of universal indicator are on the economic side. Promising projects and
programmes may be identified ex-ante and monitoring may allow for ex-post adjustments of projects
(Noble, 2008; Hallegatte et al., 2011). The main challenge here is that the prediction and
measurement of indicators for adaptation is highly uncertain (Hinkel, 2008; Hallegatte et al., 2011)
Page 5
5
given the missing knowledge on climate change and its impacts, as well as the development and
influence of other socio-economic variables. Hinkel (2008) argues that this makes outcome indicators
for adaptation non-promising and calls for using process indicators. Hallegatte et al. (2011) are more
optimistic by saying that cost-benefit analysis is a useful tool as long as uncertainty is satisfactorily
addressed.
Table 1: Opportunities and challenges of universal metrics for adaptation
Opportunities Challenges
Political
view
Shared vision of adaptation goals Choosing indicators will make some nations
better off than others; agreement is therefore
difficult (Hinkel 2008)
Ethical
view
Transparent criteria for projects Value judgments are needed (Hinkel, 2008;
Klein, 2009);
Economic
view
Ex-ante identification of promising projects
(Noble, 2008); ex-post monitoring (Noble,
2008), ex-post corrections / adjustment
(Hallegatte et al., 2011), and potentially for
allocation of funds (Butzengeiger et al., 2011)
Measurement of indicators is uncertain
(Hinkel, 2008; Hallegatte et al., 2011),
important metrics are qualitative (IGES and
WorldBank, 2008).
Concluding, the several opportunities of universal adaptation metrics justify a closer look at possible
metrics. However, the challenges should not be forgotten: while the political and ethical issues are
not part of this paper, we explore how uncertainty could be addressed.
Page 6
6
3. Synthesizing three approaches for effectiveness of adaptation projects
When searching for a universal metric for the effectiveness of adaptation projects, three existing
approaches are particularly relevant: vulnerability assessment, cost-benefit and cost-effectiveness
assessment.
Reducing vulnerability is the shared goal of many adaptation programs and is anchored in several
UNFCCC documents. However, vulnerability is not universally defined and many different
vulnerability indicators and assessment exist: the Disaster Risk Index, the impact vulnerability index,
the Disaster Deficit Index , UNDP’s Vulnerability Reduction Assessment (VRA) scorecard and further
vulnerability indicators (GEF, 2008). Politically, it has never been possible to agree on a specific
indicator. Therefore, vulnerability has to be incorporated in any adaptation metric system but
developing a new vulnerability (benefit) index will not solve the problem.
Another starting point for universal effectiveness metrics is cost-benefit analysis simply looking at
economic benefits of adaptation projects. For example, Moench et al. (2009) discuss the
appropriateness of cost-benefit analysis coupled with intense stakeholder participation and apply
cost-benefit analysis for a series of case studies in India and Pakistan. In a bold study, the Economics
of Climate Adaptation Working Group (ECAWG, 2009: 23) criticized the lack of a systematic way of
estimating climate risks and the absence of an overarching methodology to facilitate comparisons
between the risks posed by different hazards and in different geographies.. It developed a
methodology that gave rise to adaptation benefit-cost curves and applied it to China, Guyana, India,
Mali, Samoa, Tanzania, the UK, and the US. Such cost-benefit analysis can be criticized for often
neglecting non-monetary benefits such as health, which is recognized by Moench et al. (2009: 4).
Cost-effectiveness analysis, as the third approach, includes non-monetary or difficult-to-monetize
benefits as well: it identifies the least-cost method of reaching a prescribed target or risk reduction
level. For instant, it is widely used in the literature on public health (see e.g. Detsky and Naglie,
1990). On the down side, cost-effectiveness analysis for adaptation was only applied in a sectoral
context until now. Universal metrics are missing, which hinders to compare effects between different
areas.
With the indicators to be proposed, we aim at synthesizing the three approaches: while we want to
avoid the monetary-only approach of cost-benefit analysis, we also want to guarantee global
comparability, currently missing in cost-effectiveness studies focusing on. Furthermore, vulnerability
should be captured by the metrics as well.
As starting point, we analyze the current evaluation system of GEF and the AF, in order to identify
existing metrics already used.
Page 7
7
4. Current evaluation of adaptation projects in multilateral institutions
This chapter looks at the current evaluation system within GEF and the AFB in order to analyze
currently used indicators. First, the idea of the results-chain is explained in order to illustrate how
uncertainty is addressed by current evaluation systems. Second, the concrete evaluation frameworks
are assessed and adaptation metrics identified.
The results chain and how it addresses uncertainty
Effectiveness indicators for the evaluation of projects in multilateral institutions can be found in their
Results-Based Management (RBM) frameworks. Following the introduction of performance-based
management in the public sector reforms of industrialized countries in the 1990s, RBM has become
popular in multilateral and bilateral development organizations (Hulme; UNDP, 2007). Both the GEF
managed adaptation funds and the AF have established a RBM framework (GEF, 2009; AFB, 2010c).
A RBM framework is according to the OECD a ‘strategy aimed at achieving important changes in the
way government agencies operate with improving performance (achieving better results)
(Binnendijk, 2001).” Therefore, the RBM does not only consist of measuring the performance of
projects and programmes but also to learn and modify programme design. In the following, we will
just discuss the measuring of performance or results.
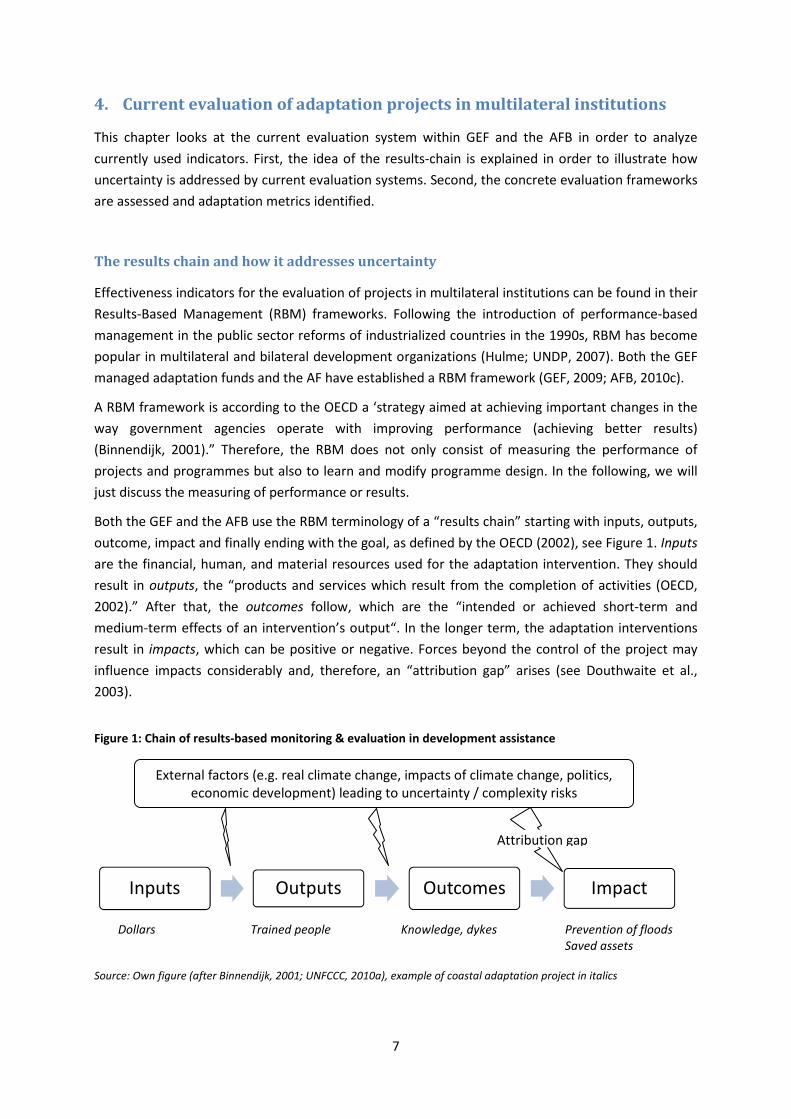
Both the GEF and the AFB use the RBM terminology of a “results chain” starting with inputs, outputs,
outcome, impact and finally ending with the goal, as defined by the OECD (2002), see Figure 1. Inputs
are the financial, human, and material resources used for the adaptation intervention. They should
result in outputs, the “products and services which result from the completion of activities (OECD,
2002).” After that, the outcomes follow, which are the “intended or achieved short-term and
medium-term effects of an intervention’s output“. In the longer term, the adaptation interventions
result in impacts, which can be positive or negative. Forces beyond the control of the project may
influence impacts considerably and, therefore, an “attribution gap” arises (see Douthwaite et al.,
2003).
Figure 1: Chain of results-based monitoring & evaluation in development assistance
Dollars Trained people Knowledge, dykes Prevention of floods
Saved assets
Source: Own figure (after Binnendijk, 2001; UNFCCC, 2010a), example of coastal adaptation project in italics
Inputs Outputs Outcomes Impact
Attribution gap
External factors (e.g. real climate change, impacts of climate change, politics,
economic development) leading to uncertainty / complexity risks
Page 8
8
To illustrate the different concepts along the result-chain, we may take the example of a coastal
adaptation project. The input would consist of the money and human resources invested in the
adaptation project, while the output could comprise the amount of trained or informed people. The
short-term or mid-term outcome could be soft skills such as enhanced knowledge on climate change
induced sea-level rise or hard technology intervention such as the building of dams. In the long-term
this should contribute to the protection from flooding and, thereby, saving of assets and lives, which
would be the impact.
Clearly, the inputs and outputs are best under control of the project and programme managers,
while outcomes and even more impacts and goals are difficult to influence and measure. The risks
and “noise” of external factors (see UNFCCC, 2010a) are increasing when moving to long-term results
such as impacts (Binnendijk, 2001). While multilateral institutions can measure outputs and some of
their outcomes they have to make strong assumptions about external factors and risks to estimate
the long-term impacts. This fact is also reflected in the proposed AFB project evaluation framework
(AFB, 2011a), according to which project proponents have to discuss the risks that outcomes are not
sustainable
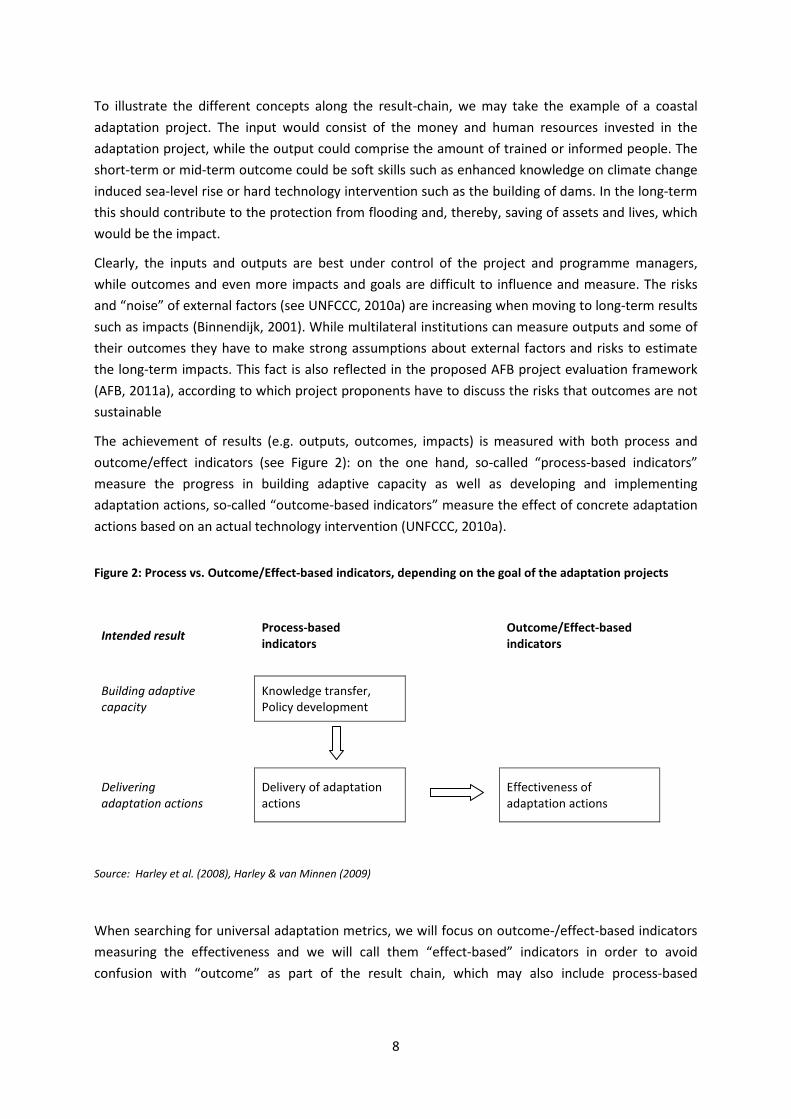
The achievement of results (e.g. outputs, outcomes, impacts) is measured with both process and
outcome/effect indicators (see Figure 2): on the one hand, so-called “process-based indicators”
measure the progress in building adaptive capacity as well as developing and implementing
adaptation actions, so-called “outcome-based indicators” measure the effect of concrete adaptation
actions based on an actual technology intervention (UNFCCC, 2010a).
Figure 2: Process vs. Outcome/Effect-based indicators, depending on the goal of the adaptation projects
Intended result
Process-based
indicators
Outcome/Effect-based
indicators
Building adaptive
capacity
Knowledge transfer,
Policy development
Delivering
adaptation actions
Delivery of adaptation
actions
Effectiveness of
adaptation actions
Source: Harley et al. (2008), Harley & van Minnen (2009)
When searching for universal adaptation metrics, we will focus on outcome-/effect-based indicators
measuring the effectiveness and we will call them “effect-based” indicators in order to avoid
confusion with “outcome” as part of the result chain, which may also include process-based
Page 9
9
indicators. In the following, we will assess, which indicators GEF and the AF use for the different
steps in the result chain, and if those indicators are more process- or effect-based.
Indicators of the GEF managed funds
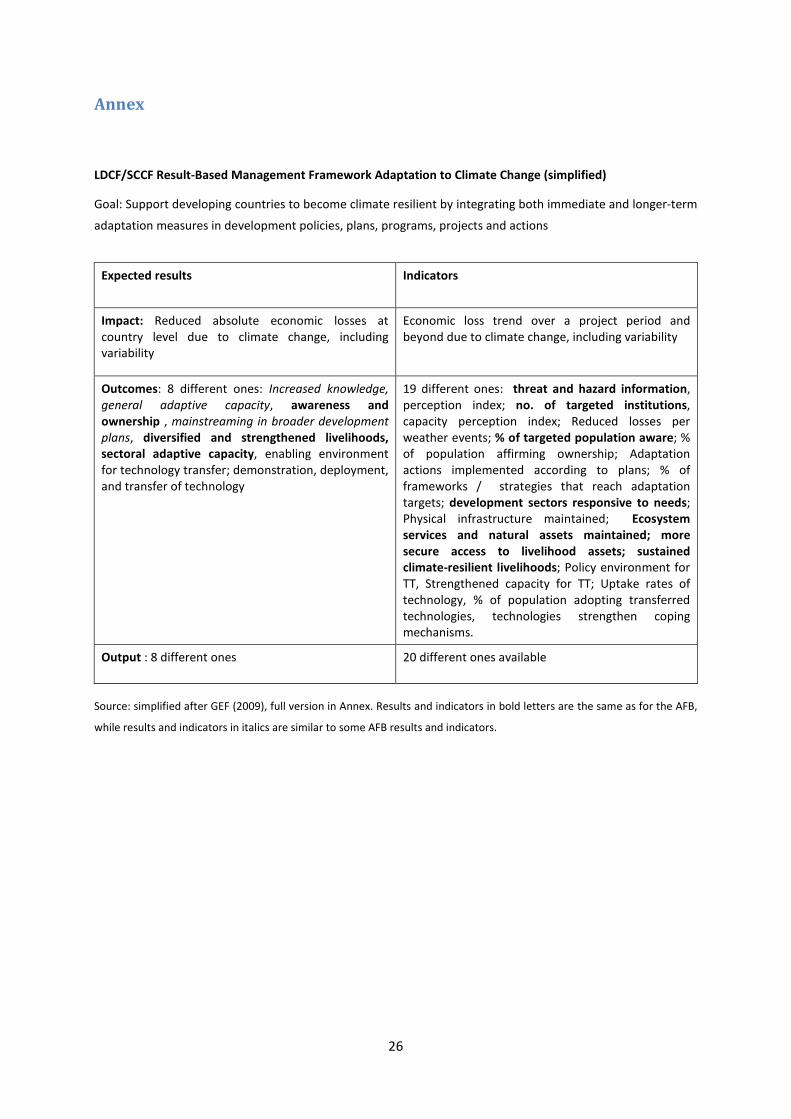
The GEF (2009) uses the same RBM Framework and indicators for adaptation projects for both the
LDCF and the SCCF. Under this framework, eight outcome results are aimed at: climate change
information, institutional capacity, mainstreaming of adaptation awareness and ownership, sectoral
adaptive capacity, diversified and strengthened livelihoods, and transfer and adaption of
technologies1. Most of the 19 indicators for outcomes are clearly process-based such as the provision
of information or integration of adaptation into sectoral or development strategies.
However, on the impact-level, the only indicator - the reduction of economic losses - is clearly
outcome and not process-based. Therefore, the GEF framework has a global indicator for
effectiveness of adaptation projects. However, it is not clear how the economic loss savings and non-
monetary benefits are assessed. Furthermore, an internal review of the RBM (GEF, 2008) criticized
that the GEF has not set targets for its indicators and does not prioritize projects with a higher
contribution to reaching the target.
The higher order goal is to provide support for developing countries to become climate resilient. This
higher order goal of “support for resiliency” is logically not clearly a result of the impact (the
reduction of economic losses), as it should be according to the theory; “support for resiliency” is
rather a pre-condition of “reducing economic losses”.
Indicators of the Adaptation Fund
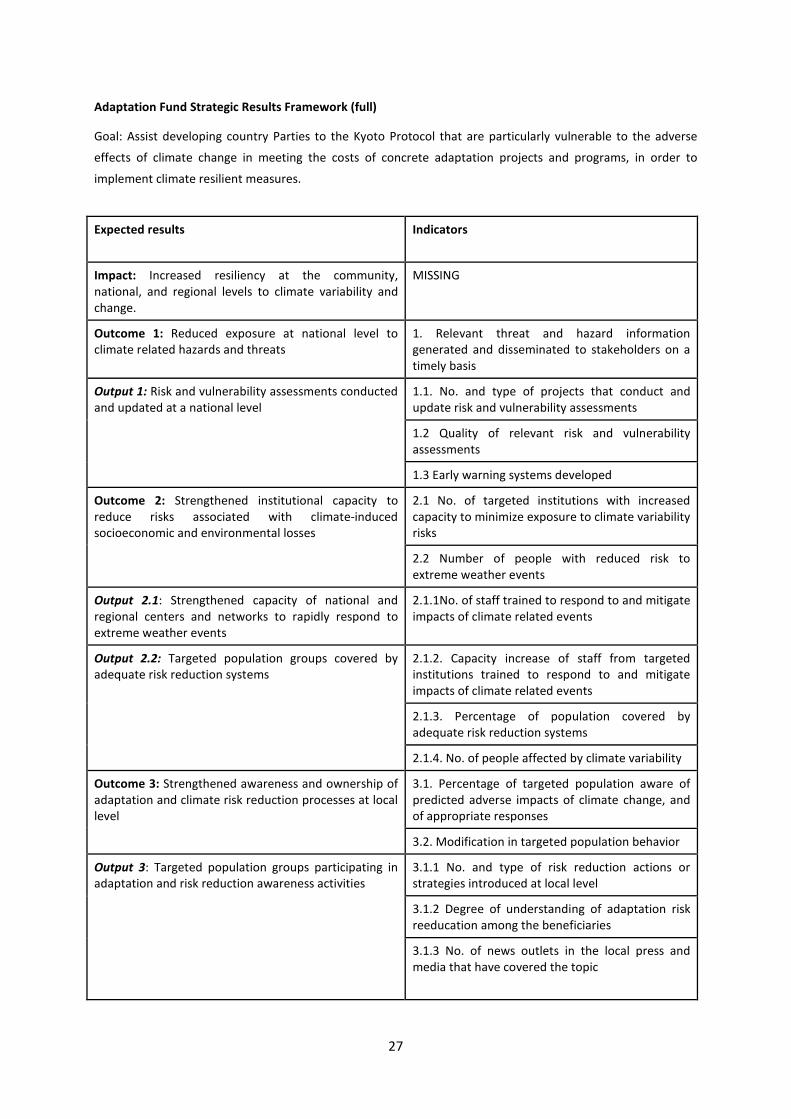
The Adaptation Fund strives for almost the same results and uses similar outcome indicators as the
GEF in its Strategic Results Framework (AFB, 2010a)2. Similarly to the GEF, the overwhelming majority
of the indicators are process and not outcome based.
One of the major differences to the GEF framework is the absence of any impact indicator. While
“Increased resiliency to climate variability and change” is the description of the impact, it is neither
clearly defined what such resiliency could mean nor is an impact indicator given. As well, the links
1 The outcomes contribute to three objectives: reducing vulnerability, building adaptive capacity and
transferring as well as adopting technologies. The distinctions between the three objectives are sometimes
unclear: e.g. some capacity building is grouped under “reducing vulnerability” rather than “building adaptive
capacity”
2 It excludes, however, the transfer and adoption of technologies with its two outcomes and five indicators,
while “ecosystem services” are seen as a main outcome, which are only a subsidiary indicator for the outcome
“Adaptive capacity within relevant development sectors and natural resources” in case of the GEF.
Page 10
10
between the outcomes and the impact remains unclear3. Therefore, the indicator system of the
Adaptation Fund covers the initial parts of the results chain and would require substantial
elaboration when aiming for universal indicators.
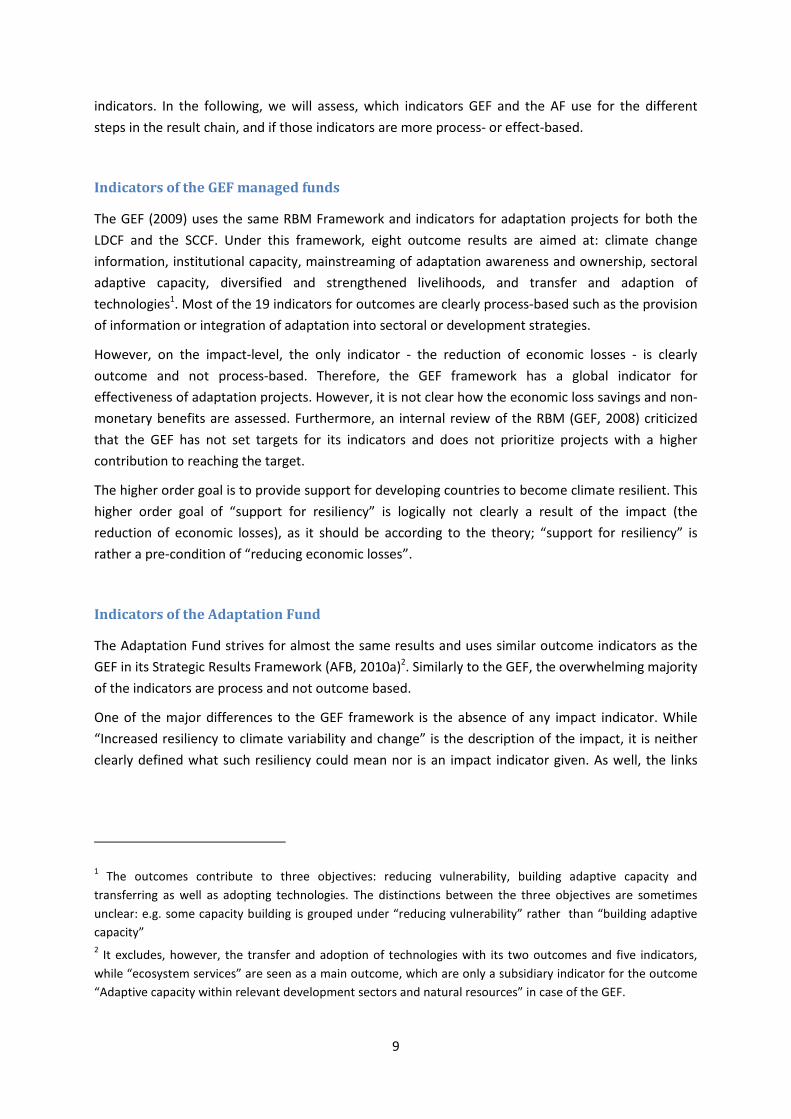
Comparison of GEF and AFB approaches and related challenges
When comparing the two frameworks under the idea of global adaptation indicators at least three
critical issues arise (marked with flash in Table 2). First, the global impact indicators are missing
either altogether as in case of the AF or there is only one economic indicator which is unable to
capture all benefits including health and environment as in case of the GEF. Second, even if we had
global impact indicators, there are no elaborated causal links between outcome and impact
concepts. Implicitly, the two frameworks assume that outcomes lead to a proportional impact
beyond the “attribution gap” (Douthwaite et al., 2003). This strongly depends on the “dilution” by
the multiple forces active in that gap. Third, and related to the second concern, is the focus on
process- rather than outcome-based indicators in the two frameworks. The output indicators are 75-
90% process-based, which is understandable as outputs are just a first step towards a longer goal.
However, it is more critical that on the outcome level, still 65-70% are clearly process-based, and
only 10-15% clearly results-based indicators. When measuring or estimating those process-based
outcome indicators in a final evaluation, there is still a really high uncertainty regarding achieving
long-term adaptation impacts.
Table 2: Comparison of GEF & Adaptation Fund Results Framework (lightning strokes mark problems)
GEF LDCF / SCCF Results-Based Management
Framework
Adaptation Fund Strategic Results Framework
Impact Economic loss trend as indicator for impact,
outcome-based indicator but �only economic
�Link to outcomes unclear
Increased resiliency as impact
� No indicator determined
� Link to outcomes unclear
Outcome 8 different results and 19 indicators,
�65% are clearly process-based indicators,
Link to outputs mostly clear
7 different results and 11 indicators,
� 70% are clearly process-based indicators
Link to outputs mostly clear
Output 8 different results and 20 indicators,
75% are clearly process-based indicators
8 different results and 16 indicators.
90% are clearly process-based indicators
Source: own table, after GEF (2009) and AFB (2010a: 6),
Reflecting these three problematic areas – lack of impact indicators, focus on process indicators and
missing outcome-impact link, we will now explore universal impact metrics that meet the following
3 Similar as the GEF, the AFB has assistance for climate resilience in developing countries as goal. Again, the goal to assist
developing countries is rather a precondition for the impact (increased resiliency) rather than the result.
Page 11
11
criteria: they should be effect- and not process-based, and they should causally be link to existing
more process-based outcome indicators.
5. Two possible impact metrics
Theoretically, the effects of adaptation projects could be measured in monetary terms. This
theoretical approach underlies the cost-benefit analysis approach of ECAWG (2009) which leads to a
“benefit cost curve” for adaptation projects. However, a substantial share of the benefits of
adaptation projects is the avoidance of direct impacts on human life and health. Then the challenge
arises how to value human life and human health. Fankhauser and Tol (1998) argue that “values of a
statistical life” embodying people’s attitude to mortality risks should be used for that valuation.
These values strongly depend on the income of the person and thus are substantially lower for a
poor person than that of a rich person, varying by a factor of 15 between China and OECD countries
(Fankhauser and Tol, 1998: 70)4. This approach thus became heavily contested in the elaboration of
the 2nd Assessment Report of the IPCC, when developing country authors and policymakers strongly
attacked what was seen as “Northern arrogance” (described condescendingly by Tol, 1997). As a
response to the controversy, Fearnside (1998) suggested to separate human lives and property
values. In our view, Fearnside’s approach should be followed to avoid endless political debates about
an equitable valuation of human life and health. This is also in line with UNFCCC (2010b) which
stresses that pure cost-benefit analysis “fails to account for those costs and benefits that cannot be
reflected in monetary terms, such as ecological impacts and impacts on health”. We thus
differentiate between monetary and human life/health-related benefits, in the form of two
indicators.
Saved Wealth (SW)
Accumulated income not spent for consumption gives rise to wealth; this can include productive
assets and other forms of property (e.g. real estate and precious metals). The indicator specifies
wealth protected by an adaptation project against destruction by climate change impacts. For cross-
country comparisons, Purchasing Power Parity should be used.
When assessing the wealth benefit of an adaptation project/programme one can use two different
concepts: absolute wealth and relative wealth (assessed on an aggregate or individual level):.
• Absolute wealth saved: This approach, similar to the approach in cost-benefit analysis,
measures the absolute wealth saved The concept is straightforward but does not take into
4 Other studies even have value of a statistical life based on surveys and studies is ranging from below to over
20 Million 2000 USD (Viscusi and Aldy, 2003; Viscusi and Gayer, 2003) and he valuation is country, income, and
age-dependent (Viscusi and Aldy, 2003; Aldy and Viscusi, 2008)
Page 12
12
account differences of wealth, which might be crucial for overall resilience: Regions with a
higher wealth level would be favoured. The indicator would be currency units.
• Relative wealth saved (aggregated assessment): Here, the absolute wealth saved by the
project/programme is divided by the total wealth of the region, city or community. This
allows to cater for differences in average wealth, but does not yet cover the distribution of
wealth within the project region. The indicator would be % wealth saved times population.
• Relative wealth saved (individual level assessment): This concept relates to the affected
number of people and their individual wealth shares protected by the adaptation project. In
contrast to the aggregate assessment of relative wealth, here the relative wealth is assessed
on an individual level and then summed up. Data challenges are massive as every person has
to be accounted individually. It might only be possible in countries with a highly efficient tax
administration and no data confidentiality restrictions regarding personal fortunes. Given
data constraints, the concept is more realistic, when using a city or community as individual
unit: in this case, the total relative wealth saved consists of the sum of the relative wealth
saved in each city or community, rather the sum of the relative wealth saved per individual.
Advantages and disadvantages of the different approaches are described in Table 3:
Table 3: Approaches to measure Saved Wealth
Concept Description Advantages Disadvantages
Absolute wealth saved Wealth benefit in
absolute terms
Relatively easy to
measure
Benefits richer countries,
does not reflect
vulnerability
Relative wealth saved
(assessed on an
aggregate level)
Wealth benefit relative to
overall assets of a nation
(or region, city,
community), multiplied
with population
Allocates (adaptation)
funds to poorest
countries (or regions,
cities, communities)
Benefits not necessarily
poorest or most vulnerable
persons within a country (or
region, city, community)
Relative wealth saved
(assessed on an
individual level)
Wealth % saved per
person (or city; multiplied
with population of city);
individual percentages are
summed up
Close to vulnerability Data access difficult in case
of individualized approach
The relative wealth concept (on an aggregated basis), seems to be most adequate from a
vulnerability perspective taking data availability into account. The more local the geographical scale
of this relative wealth concept is, the better the concept addresses vulnerability. However, from an
economic perspective, the absolute wealth concept is most appropriate as it measures the overall
wealth savings (which may still be distributed). We thus propose to both include relative and
Page 13
13
absolute wealth savings in the Saved Wealth indicator in order to balance vulnerability and
economics benefits.
For determining the potential of an adaptation activity to save wealth, one needs to consider
autonomous developments of the wealth of the relevant region during the project duration.
Demographic and/or economic developments over time will lead to changes of property, and
therefore wealth under a baseline scenario.
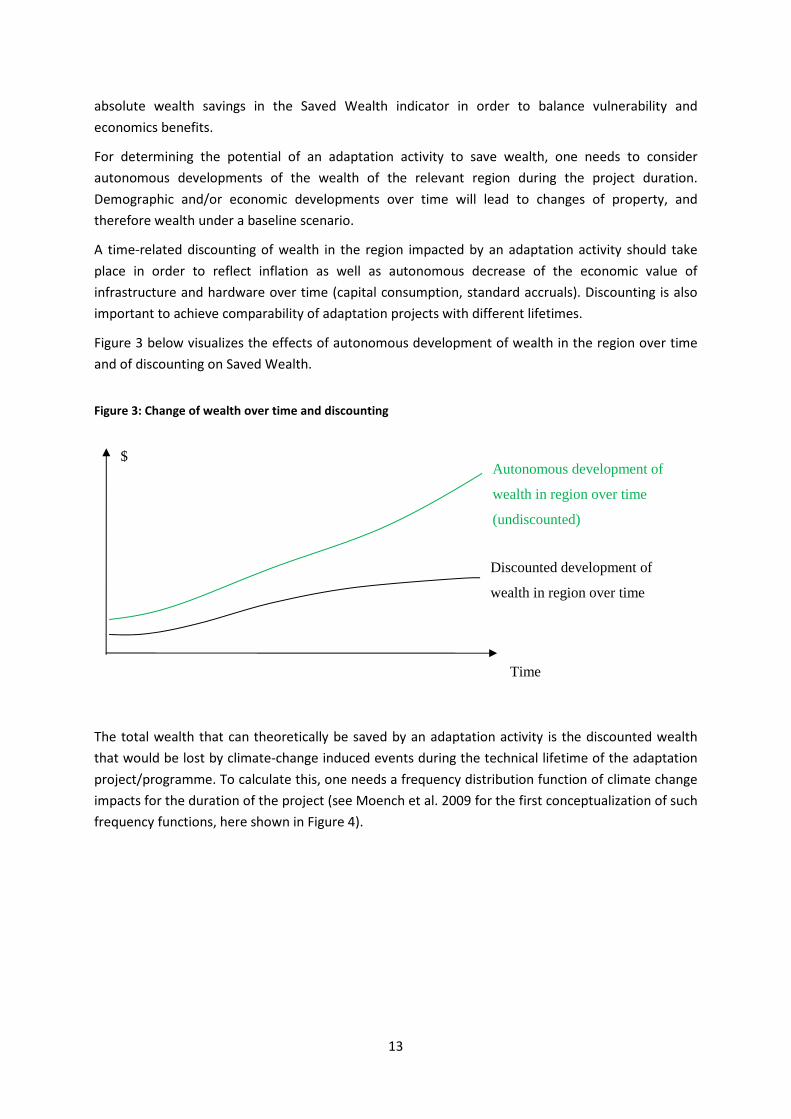
A time-related discounting of wealth in the region impacted by an adaptation activity should take
place in order to reflect inflation as well as autonomous decrease of the economic value of
infrastructure and hardware over time (capital consumption, standard accruals). Discounting is also
important to achieve comparability of adaptation projects with different lifetimes.
Figure 3 below visualizes the effects of autonomous development of wealth in the region over time
and of discounting on Saved Wealth.
Figure 3: Change of wealth over time and discounting
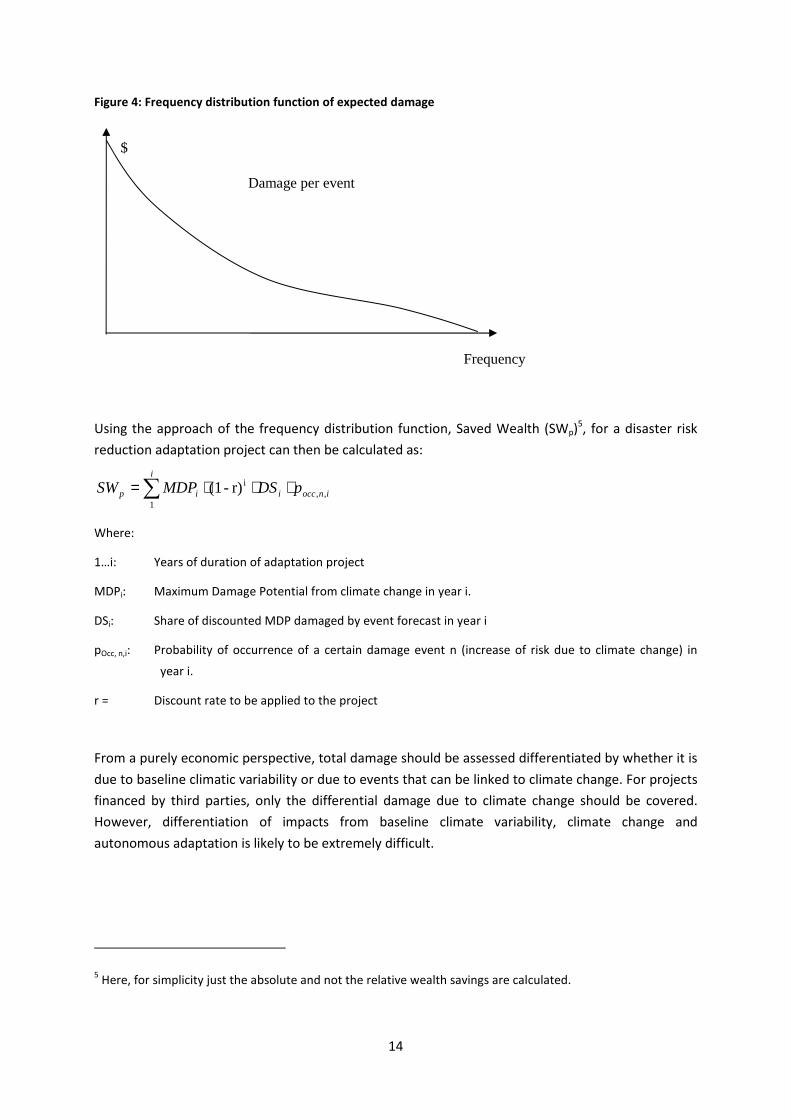
The total wealth that can theoretically be saved by an adaptation activity is the discounted wealth
that would be lost by climate-change induced events during the technical lifetime of the adaptation
project/programme. To calculate this, one needs a frequency distribution function of climate change
impacts for the duration of the project (see Moench et al. 2009 for the first conceptualization of such
frequency functions, here shown in Figure 4).
Autonomous development of
wealth in region over time
(undiscounted)
Discounted development of
wealth in region over time
$
Time
Page 14
14
Figure 4: Frequency distribution function of expected damage
Using the approach of the frequency distribution function, Saved Wealth (SWp)5, for a disaster risk
reduction adaptation project can then be calculated as:
∑ ⋅⋅⋅=i
inocciip pDSMDPSW1
,,ir)-(1
Where:
1…i: Years of duration of adaptation project
MDPi: Maximum Damage Potential from climate change in year i.
DSi: Share of discounted MDP damaged by event forecast in year i
pOcc, n,i: Probability of occurrence of a certain damage event n (increase of risk due to climate change) in
year i.
r = Discount rate to be applied to the project
From a purely economic perspective, total damage should be assessed differentiated by whether it is
due to baseline climatic variability or due to events that can be linked to climate change. For projects
financed by third parties, only the differential damage due to climate change should be covered.
However, differentiation of impacts from baseline climate variability, climate change and
autonomous adaptation is likely to be extremely difficult.
5 Here, for simplicity just the absolute and not the relative wealth savings are calculated.
Frequency
Damage per event
$
Page 15
15
Saved Health (SH)
As discussed above, valuation of human life is fraught with ethical challenges and thus should be
avoided, especially if comparing industrialized and developing countries. In this section, we look at
the concept of Disability Adjusted Life Years Saved (DALYs), which was introduced 1993 by the World
Bank (WorldBank, 1993), and has since then been systematically utilized – inter alia by the World
Health Organization (WHO) in the “Global Burden of Disease Concept” (GBD), which provides a
comprehensive and comparable assessment of mortality and loss of health due to diseases, injuries
and risk factors for all regions of the world (WHO, 2010a). It is a concept to quantify the burden of
disability and death, expressed as the number of years lost due to disability and early death.
∑ ⋅⋅+⋅=i
iii DDWILNDALY
Where:
N: Numbers of deaths
L: standard life expectancy at age of death (in years). Here, an ethical issue is the choice of the region.
From an equity viewpoint, the average global life expectancy should be chosen, whereas from a comparative
economic view, the locally applicable life expectancy would be preferred.
Ii: Cases of disease / injury i
DWi: Disability weight of disease / injury i.
Di = Average duration of disease / injury i (years)
The weight factor DW reflects the severity of the disease or injury on a scale from 0 (perfect health)
to 1 (dead) and have been estimated by WHO (2010b) for a wide range of diseases.
Taking the frequency distribution function approach described above (see Figure 2), for assessing the
saved health for a particular adaptation activity, one needs to define a health damage frequency
distribution function that quantifies the typical health damages of a given event and its frequency.
Environmental and cultural benefits
The valuation of non-monetary environmental and cultural benefits is fraught with conceptual
difficulties (see e.g. Bockstael and Freeman, 2005). Fankhauser et al. (1998) describe the differences
in willingness-to-pay and willingness-to-accept valuation approaches. In our view, the challenges of
this approach are so high that a simple “no harm” rule should be followed for the evaluation of
adaptation projects. For projects of certain minimum sizes, a qualitative evaluation system
comparable e.g. to standard Environmental Impact Assessments (EIA) could be applied to check
whether an adaptation project has negative impacts regarding biodiversity, soil, air and water
pollution. Likewise, projects should check whether cultural heritage, be it material or immaterial
Page 16
16
would be jeopardized. Generally, an approach could be imagined where the host country of foreign-
funded adaptation projects approves the ecologic and cultural sustainability; in a procedure akin to
today’s approval of CDM projects.
Conclusions on the proposed metrics
Obviously, introduction of the impact indicators requires highly challenging data collection exercises.
Given the uncertainties of future climate change and economic development, coordinated
approaches are required to prevent ad hoc choices of data that are favourable for the project
developer. At first, a political agreement on the downscaled climate models used for derivation of
the frequency curves of climate impacts is required. In a similar vein, forecasts for economic
development need to be made consistent to allow a comparable wealth forecast. While the use of
such indicators is certainly a non-perfect solution given data constraint, it is preferable to a situation
where projects are evaluated according to a heterogeneous set of (often project-specific) process
indicators.
Furthermore, the proposed set of impact metrics fulfils three criteria for impact metrics set out
before;
1. The metrics go beyond a pure economic analysis by using a health metric (and the
environmental/cultural no-harm rule)
2. Vulnerability is addressed by both including a health and a relative wealth metric
3. DALYs and the different wealth indicators are clearly effect- and not process-based indicators.
The only criterion not clearly fulfilled, is the one of outcome-impact links or in other words, how to
address the attribution gap. We will address this in the following.
Page 17
17
6. Linking of outcome indicators with proposed impact metrics
As we have argued above, the current outcome and impact indicators are not clearly linked. In this
section, we will both try to link outcome indicators and impact metrics on basis of the literature, as
well as setting out a proposal for dealing with these links in the future.
Links according to existing literature
The outcome indicators used here are mainly taken from the GEF RBM framework (GEF, 2008),
adding the outcome indicator of “ecosystem services” from the AF strategic framework (AFB, 2010b).
As impact indicators we use the two indicators proposed above.
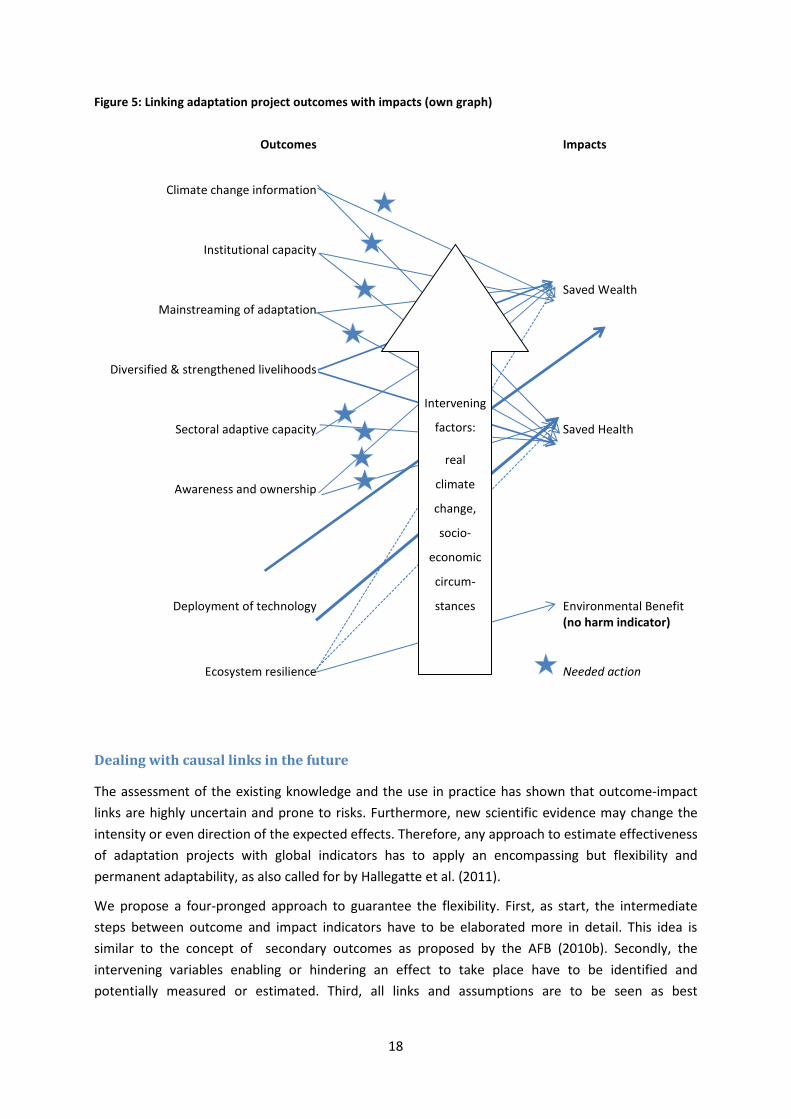
Generally, following the existing theoretical literature, we may assume that all outcome indicators
have a positive impact on reducing vulnerability, which we measure here in Saved Wealth and
Health. The last IPCC report (Adger et al., 2007) emphasized the relevance of all outcomes shown in
Figure 5 for adaptation and reducing vulnerability.
The only one not explicitly mentioned as factor contributing to adaptation is ecosystem resilience.
However, Adger et al. (2007) see ecosystem resilience as one of the goals of adaptation measures
and it may be seen as directly environmental benefit. Generally, the literature is not very explicit
about the size of the effects, while it becomes clear that only few effects are direct such as the use of
new dam technology on saving wealth. Most links are rather indirect and require an intermediate
action (e.g. the climate change information provided by an early warning system has to be put into
use via disaster response actions). Furthermore, several intervening factors may reduce the strength
of the theoretical link.
A key issue for outcome-impact links is the time horizon. The longer an adaptation intervention lasts,
the higher is the risk that an adaptation, appropriate in the short and maybe medium term, turns
into maladaptation – “changes in natural or human systems that inadvertently increase vulnerability
to climatic stimuli” (McCarthy et al., 2001). For example, an adaptation project may change the
design level of water supply for an irrigation system based on the estimate of the increased river flow
due to glacial melting in the catchment area. As long as the glacial melting continues, the project
contributes nicely to adaptation, but once the glaciers have vanished, the irrigation system will be
oversized and a water supply crisis will erupt. So in the long term, the link between outcome and
impact indicators will be weakened.
A response to the risk of maladaptation could be to introduce an indicator that defines the risk of
long term maladaptation and to check this indicator periodically, triggering an adjustment in the
adaptation project design. In the context of the irrigation project case, the indicator would be glacier
volume in the catchment area and the probable date of glacier disappearance. If for example, the
glacier disappearance would be less than a decade in the future, a downsizing of the irrigation
system would be started combined with an economic diversification strategy.
Page 18
18
Figure 5: Linking adaptation project outcomes with impacts (own graph)
Outcomes
Impacts
Climate change information
Institutional capacity
Saved Wealth
Mainstreaming of adaptation
Diversified & strengthened livelihoods
Sectoral adaptive capacity Saved Health
Awareness and ownership
Deployment of technology Environmental Benefit
(no harm indicator)
Ecosystem resilience
Needed action
Dealing with causal links in the future
The assessment of the existing knowledge and the use in practice has shown that outcome-impact
links are highly uncertain and prone to risks. Furthermore, new scientific evidence may change the
intensity or even direction of the expected effects. Therefore, any approach to estimate effectiveness
of adaptation projects with global indicators has to apply an encompassing but flexibility and
permanent adaptability, as also called for by Hallegatte et al. (2011).
We propose a four-pronged approach to guarantee the flexibility. First, as start, the intermediate
steps between outcome and impact indicators have to be elaborated more in detail. This idea is
similar to the concept of secondary outcomes as proposed by the AFB (2010b). Secondly, the
intervening variables enabling or hindering an effect to take place have to be identified and
potentially measured or estimated. Third, all links and assumptions are to be seen as best
Intervening
factors:
real
climate
change,
socio-
economic
circum-
stances
Page 19
19
assumption for-the-time-being. As soon as new scientific evidence is available, the assumptions have
to be changed. Fourth, the outcome (and output) indicators as set out here are to be complemented
or replaced by other indicators, if scientific studies show the importance of further indicators. In the
end, various approaches and ways may lead to the desired results. Certainly, the current eight or
nine indicators are too broad if applied to specific sectors. An example of refined indicators per
sector is given by Schönthaler et al. (2010).
How can this encompassing and flexible approach be achieved institutionally? One idea is to
elaborate specific causal-chain methodologies for each sector or even better for each project type,
similar to the methodologies in the CDM (see Michaelowa, 2005). Methodologies could be
elaborated by the Adaptation Fund itself, country programme managers, international organizations
or academic experts. Each methodology would have to be approved by the AFB and revisions can be
proposed by stakeholders or the AFB itself at any time, as long as they are based on the newest
scientific findings.
7. Application of framework to specific examples
In order to illustrate and test the applicability of the proposed impact metrics and their relation to
the outcome, we assessed five adaptation projects. For the assessment we use information in the
official project proposals downloaded from the Adaptation Fund website at the end of February
(AFB, 2011b). No external sources were used to verify the information, which means that the
following results are more indicative than precise.
Table 4 shows the predicted benefits of the 5 projects when assessed against our metrics.
Relating to absolute saved wealth (measured in annual $ saved per $ of requested grant), project A
has the highest score, followed by D and C. The other two projects did not give any information on
absolute saved wealth. Where absolute wealth benefits were given, justification was mostly scarce
and the assumptions were not fully specified. Projects report saved wealth not over the total project
lifetime but only per year, which raises the question how long a project will last.
Relative wealth saved is measured here in number of persons, which’s personal income is saved per
Million $ of requested grant6. Here, project E scored highest before projects C, E and D. For project B
the factor could not be calculated as numbers of beneficiaries and absolute saved wealth are missing.
Interestingly, project C is performing better on this relative wealth indicator than project D, where as
it is the other way round in case of absolute wealth saved. The reason is both higher number of
beneficiaries and lower income in case of project C.
Finally, when assessing health saved, measured in DALYs saved per Million $ of requested grant, we
find no data in the project documents. For project E we know the number of beneficiaries with
6 This relative wealth number was calculated as share of average income saved multiplied with the number of beneficiaries.
Therefore, aggregate wealth numbers were used, as individual wealth numbers are not available. Average income was
assumed to equal the national GDP per capita using data from the World Bank (2011).
Page 20
20
malnutrition, and assuming a disability weight of malnutrition of 0.3 we can estimate the number of
DALYs saved.
Table 4: Assessment of 5 real-world adaptation projects against proposed metrics
Metric Unit Project A Project B Project C Project D Project E
Beneficiary intensity Persons with improved
livelihoods / million $ 22,600
Not
reported 950 50 26,850
Wealth saved -absolute $ saved p.a. / $ 6 Not
reported 0.3 0.7
Not
reported
Wealth saved – relative
(aggregate level)
# of personal wealth
saved/ million $ 5,000
Not
reported 700 75 [530]
Health saved DALYs / million $ Not
reported
Not
reported
Not
reported
Not
reported 120,000
Environmental benefits [qualitative scale] Positive Positive Positive Slightly
positive Positive
Source: own assessment, using project documents from AFB (2011b). As numbers given here are based on low-quality data
and rather illustrative, neither the country nor the requested funding is given here to guarantee anonymity
The numbers given here would indicate that projects A & E perform highest on the adaptive benefit,
before projects C and D. Deciding on the exact rating for the adaptive benefit will depend on the
political weighting of different indicators. Environmental no-harm is never a critical issue, as all
projects show significant positive environmental benefits. Interestingly, the low rating of project B is
consistent with a general review of the projects (not indicator-related).
Table 5 shows the assessment of predicted outcomes for these five projects. Two major challenges
arrived: First, the projects do not report the standard AFB outcome indicators but project-specific
ones. Secondly, information on the projected achievements is of low quality due to non-
transparency on assumptions. Due to these challenges and the small sample, it is not possible to
thoroughly analyse the interrelation between the outcome and our proposed impact indicators.
Nevertheless, we make some observations: the project A, performing well with our impact
indicators, has also most high ratings on outcome indicators, while project B has also most low
ratings.
Page 21
21
Table 5: Assessment of 5 real-world adaptation projects against standard outcome indicators
Outcome / Indicator Project A Project B Project C Project D Project E
CC information / Relevant threat and hazard
information generated and disseminated to
stakeholders on a timely basis
Partly
fulfilled
Partly
fulfilled
Partly
fulfilled Fulfilled
Partly
fulfilled
Institutional capacity / No. of targeted
institutions with increased capacity to minimize
exposure to climate variability risks
Fulfilled Fulfilled Partly
fulfilled Fulfilled
Partly
fulfilled
Awareness &ownership / Percentage of targeted
population aware of predicted adverse impacts of
climate change, and of appropriate responses
Partly
fulfilled
Hardly
fulfilled Fulfilled
Partly
fulfilled
Partly
fulfilled
Sectoral adaptive capacity / Physical
infrastructure improved to withstand climate
change and variability-induced stress
Hardly
fulfilled
Partly
fulfilled Fulfilled Fulfilled Fulfilled
Ecosystem resilience / Ecosystem services and
natural assets maintained or improved under
climate change and variability-induced stress
Fulfilled Fulfilled Fulfilled Partly
fulfilled Fulfilled
Diversified & strengthened livelihoods /
Percentage of households and communities
having more secure (increased) access to
livelihood assets
Fulfilled Hardly
fulfilled
Partly
fulfilled
Partly
fulfilled Fulfilled
Mainstreaming of adaptation / Climate change
priorities are integrated into national
development strategy
Fulfilled Partly
fulfilled
Partly
fulfilled
Partly
fulfilled
Partly
fulfilled
Source: own assessment, using project documents from AFB (2011b). As numbers given here are based on low-quality
data and rather illustrative, neither the country nor the requested funding is given here to guarantee anonymity. Only
own indicator was chosen per outcome; the following ones were omitted: number of people with reduced risk to extreme
weather events, modification in targeted population behaviour, development sectors' services responsive to evolving
needs from changing and variable climate, percentage of targeted population with sustained climate-resilient livelihoods.
This illustrative analysis of five adaptation projects has revealed three major problems: missing data
on impact indicators, missing assumptions and inconsistency between AF/GEF indicators and the one
used by projects. For making global metrics feasible, AF projects would have to be obliged to use
agreed outcome indicators and to report on promising impact indicators to assess their feasibility
before introduction.
Page 22
22
8. Conclusion and discussion
In contrast to climate change mitigation, the effectiveness of adaptation projects so far is not
evaluated according to universally accepted metrics. As adaptation so far was the “step child” of the
climate regime, it was mainly treated as a by-product of development assistance and thus the
evaluation procedures of development assistance projects have traditionally been used. These
procedures are based on a “results chain”, with a series of indicators from input to project impacts.
The key feature of this chain is the “attribution gap” between outcome and impact indicators, which
is due to the effect of many non-project related influence on the level of the impact indicators.
Adaptation has now become a full strand of international climate policy with the setup of funds that
are to finance adaptation projects, as well as with the “fast start” financing of industrialized countries
for climate-change related activities in developing countries. We find that all the funds focus mainly
on output and outcome indicators, with very few impact indicators being used.
To avoid a situation where adaptation funding is essentially distributed in a “first come, first serve”
mode, it is imperative to agree on one or a set of indicators that allow a choice of adaptation projects
according to their effectiveness per unit of money invested. A single, universal indicator is not
possible due to the challenges in valuating protection of human lives and health. We therefore
propose two main indicators: one assessing economic assets saved from destruction by climate
change impacts (Saved Wealth) and one calculating human lives and health protected (Saved Health).
The former indicator is a combination of two values, one of which is the absolute value of wealth
saved, while the other looks at the relative wealth saved. This is done in order to take into account
vulnerability. The latter indicator uses the concept of disability-adjusted life-years saved (DALYs).
The indicators are calculated in a procedure that first estimates the expected wealth existing in the
project area over time. Subsequently, the expected climate change damages during the lifetime of
the adaptation project are calculated to set the baseline. A frequency distribution of damaging
events is used for this purpose. Finally, the remaining damages after implementation or the project
are assessed.
To reduce uncertainties that may make the indicator calculation irrelevant, coordinated approaches
for the determination of wealth forecasts and damage frequency curves are required. A political
agreement on the climate and economic models used would help. Here, the regulatory structure for
the evaluation of emissions mitigation projects in the context of the Clean Development Mechanism
could serve as example. As an initial step, the indicator systems of adaptation funds should be
oriented versus outcome indicators. Moreover, indicators should periodically assess the risk of
maladaptation, especially for projects with a very long lifetime. The links between outcome and
impact indicators should be studied in more detail.
Page 23
23
References
Adger, W.N., Agrawala, S., Mirza, M.M.Q., Conde, C., O’Brien, K., Pulhin, J., Pulwarty, R., Smit, B. and
Takahashi, K., 2007. Assessment of adaptation practices, options, constraints and capacity.
Climate Change 2007. Impacts, Adaptation and Vulnerability. Contribution of Working Group
II to the Fourth Assessment Report of the Intergovernmental Panel on Climate Change, M. L.
Parry, O. F. Canziani, J. P. Palutikof, P. J. Van der Linden, and C. E. Hanson (eds.). Cambridge
University Press, Cambridge ; New York. 717-43.
AFB, 2010a. Project Level Results Framework And Baseline Guidance Document. AFB/EFC.3/3,
Adaptation Fund Board secretariat, Washington D.C.
AFB, 2010b. Operational policies and guidelines for parties to access resources from the Adaptation
Fund. Annex I: Strategic priorities, policies and guidelines of the Adaptation Fund adopted by
the CMP. Adaptation Fund Board secretariat, City.
AFB, 2010c. An approach to implementing Result-Based Management (RBM). Adaptation Fund Board.
Ninth Meeting. Bonn, March 23-25, 2010. Agenda item 9. c). AFB/B.9/7, Adaptation Fund
Board secretariat, Washington D.C.
AFB, 2011a. Draft guidelines for project/programmes final evaluations Adaptation Fund Board. Ethics
and Finance Committee. Fourth Meeting. Bonn, March 16, 2011. Agenda item 5 b).
AFB/EFC.4/6, Adaptation Fund Board secretariat, Washington D.C.
AFB, 2011. Project and Programme Proposals. <http://adaptation-
fund.org/projectprogrammeproposals>, accessed 25th February 2011.
Agrawala, S. and Fankhauser, S., 2008. Economic Aspects of Adaption to Climate Change. Costs,
Benefits and Policy Instruments. Organisation for Economic Co-operation and Development,
Paris.
Aldy, J.E. and Viscusi, W.K., 2008. Adjusting the value of a statistical life for age and cohort effects.
Review of Economics and Statistics, 90 (3). 573-81.
Binnendijk, A., 2001. Results based management in the development co-operation agencies: A review
of experiences background report. Organisation for Economic Co-operation and
Development, Paris.
Bockstael, N.E. and Freeman, A.M., 2005. Welfare Theory and Evaluation. Handbook of
environmental economics, K.-G. Mäler and J. R. Vincent (eds.). Elsevier, Amsterdam. 517-70.
Butzengeiger, S., Michaelowa, A., Köhler, M. and Stadelmann, M., 2011. Policy instruments for
climate change adaptation - lessons from mitigation and preconditions for introduction of
market mechanisms for adaptation. Colorado Conference on Earth System Governance:
Crossing Boundaries and Building Bridges, 17-20 May 2011, Colorado State University.
Detsky, A. and Naglie, G., 1990. A Clinician's Guide to Cost-Effectiveness Analysis. Annals of Internal
Medicine, (113). 147-54.
Douthwaite, B., Kuby, T., van de Fliert, E. and Schulz, S., 2003. Impact pathway evaluation: an
approach for achieving and attributing impact in complex systems. Agricultural Systems, 78.
243-65.
ECAWG, 2009. Shaping climate resilient development. A framework for decisionmaking. A report of
the Economics of Climate Adaptation Working Group. ClimateWorks Foundation, Global
Environment Facility, European Commission, McKinsey & Company, The Rockefeller
Foundation, Standard Chartered Bank and Swiss Re, San Francisco, Washington D.C., Brussels
et al.
Fankhauser, S. and Tol, R., 1998. The value of human life in global warming impacts – a comment.
Mitigation and Adaptation Strategies for Global Change 3. 87–88.
Fankhauser, S., Tol, R. and Pearce, D., 1998. Extensions and alternatives to climate change impact
valuation: on the critique of IPCC Working Group III’s impact estimates. Environment and
Development Economics, 3. 59–81.
Page 24
24
Fearnside, P., 1998. The Value of Human Life in Global Warming Impacts. Mitigation and Adaptation
Strategies for Global Change, (3). 83-85.
GEF, 2008. Background and Elements for a GEF Monitoring and Evaluation Framework on
Adaptation. Lessons from GEF Climate Change Adaptation projects. GEF Evaluation Office in
Cooperation with the GEF Adaptation Task Force. LDCF/SCCF Council Meeting April 25, 2008.
GEF/LDCF.SCCF.4/Inf.4, Global Environment Facility, Washington D.C.
GEF, 2009. Implementation of Results Based Management under the Least Development Countries
Fund and the Special Climate Change Fund GEF/LDCF.SCCF.7/4, Global Environment Facility,
Washington D.C.
Hallegatte, S., Lecocq, F. and de Perthuis, C., 2011. Designing Climate Change Adaptation Policies. An
Economic Framework. Policy Research Working Paper Series, W. Bank (ed), 5568. World
Bank, Washington D.C.
Harley, M. and van Minnen, J., 2009. Development of Adaptation Indicators. ETC/ACC Technical Paper
2009/6. European Topic Centre on Air and Climate Change, Bilthoven.
Harley, M., Horrocks, L., Hodgson, N. and van Minnen, J., 2008. Climate change vulnerability and
adaptation indicators. ETC/ACC Technical Paper 2008/9. European Topic Centre on Air and
Climate Change, Bilthoven.
HBS/ODI, 2010. Fast Start Finance. Pledges made by countries.
<http://www.climatefundsupdate.org/fast-start-finance>, accessed 31st August 2010.
HBS/ODI, 2011. Climate Funds. <http://www.climatefundsupdate.org/listing>, accessed 26th
February 2011.
Hinkel, J., 2008. Comparing possible outcomes or describing social learning? Presentation hold at the
"Expert Consultation on Adaptation Metrics", 17-18 April 2008, Tokyo.
Hulme, D., The Making of the Millennium Development Goals: Human Development Meets Results-
based Management In an Imperfect World. BWPI Working Paper 16. Brooks World Poverty
Institute. University of Manchester, Manchester.
IGES and WorldBank, 2008. Expert Consultation on Adaptation Metrics. Tokyo, 17-18 April 2008.
Institute for Global Environmental Strategies & World Bank, Hayama & Washington, D.C.
Klein, R., 2009. Identifying countries that are particularly vulnerable to the adverse effects of climate
change: an academic or a political challenge? Carbon and Climate Law Review 3. 284-91.
McCarthy, J.J., Canziani, O.F., Leary, N.A., Dokken, D.J. and White, K.S., 2001. Climate change 2001 :
impacts, adaptation, and vulnerability : contribution of Working Group II to the third
assessment report of the Intergovernmental Panel on Climate Change. Cambridge University
Press, Cambridge, UK ; New York.
Michaelowa, A., 2005. Determination of baselines and additionality for the CDM: a crucial element of
credibility of the climate regime. F. Yamin (ed.), Earthscan, London. 289-304.
Moench, M., Fajber, E., Dixit, A., Caspari, E. and Pokhrel, A., 2009. Catalyzing climate and disaster
resilience. Processes for identifying tangible and economically robust strategies. Final Report
of the Risk to Resilience Study. Institute for Social and Environmental Transition, Kathmandu.
Noble, I., 2008. Why Adaptation Metrics? Presentation hold at the "Expert Consultation on
Adaptation Metrics", 17-18 April 2008, Tokyo.
OECD, 2002. Glossary of Key Terms in Evaluation and Results Based Management. Organisation for
Economic Co-operation and Development, Paris.
Parry, M., Arnell, N., Berry, P., Dodman, D., Fankhauser, S., Hope, C., Kovats, S. and Nicholls, R., 2009.
Assessing the costs of adaptation to climate change. A review of the UNFCCC and other
recent estimates. International Institute for Environment and Development, London.
Schönthaler, K., von Andrian-Werburg, S., Wulfert, K., Luthardt, V., Kreinsen, B., Schultz-Sternberg, R.
and Hommel, R., 2010. Establishment of an Indicator Concept for the German Strategy on
Adaptation to Climate Change. German Federal Environment Agency, Dessau.
Page 25
25
Solomon, S., Qin, D., Manning, M., Chen, Z., Marquis, M., Averyt, K.B., Tignor, M. and Miller, H.L.,
2007. Climate change 2007. The Physical Science Basis. Contribution of Working Group I to
the Fourth assessment report of the Intergovernmental Panel on Climate Change. Cambridge
University Press, Cambridge ; New York.
Tol, R., 1997. The social cost controversy – a personal appraisal. Proceedings of the international
symposium “Prospects for integrated environmental assessment: Lessons learnt from the
case of climate change", A. Sors, S. Liberatore, S. Funtowicz, J. Hourcade, and J. Fellous (eds.).
Brussels. 35-40.
UNDP, 2007. Evaluation of Results Based Management at UNDP. United Nations Development
Programme, Evaluation Office, New York.
UNFCCC, 1992. United Nations Framework Convention on Climate Change. United Nations
Framework Convention on Climate Change, Bonn.
UNFCCC, 2010a. Synthesis report on efforts undertaken to monitor and evaluate the implementation
of adaptation projects, policies and programmes and the costs and effectiveness of
completed projects, policies and programmes, and views on lessons learned, good practices,
gaps and needs FCCC/SBSTA/2010/5, United Nations Framework Convention on Climate
Change, Bonn.
UNFCCC, 2010b. Potential costs and benefits of adaptation options: A review of existing literature.
Technical paper. FCCC/TP/2009/2/Rev.1, United Nations Framework Convention on Climate
Change, Bonn.
Viscusi, W.K. and Aldy, J.E., 2003. The value of a statistical life: A critical review of market estimates
throughout the world. Journal of Risk and Uncertainty, 27 (1). 5-76.
Viscusi, W.K. and Gayer, T., 2003. Quantifying and Valuing Environmental Health Risks. Handbook of
environmental economics, K.-G. Mäler and J. R. Vincent (eds.). Elsevier, Amsterdam. 1029-
103.
WHO, 2010. Disability weights, discounting and age weighting of DALYs.
<http://www.who.int/healthinfo/global_burden_disease/daly_disability_weight/en/index.ht
ml>, accessed 16th October 2010.
WHO, 2010. Global Burden of Disease.
<http://www.who.int/healthinfo/global_burden_disease/en/>, accessed 16th October 2010.
WorldBank, 1993. World Development Report 1993: Investing in health. Oxford University Press,
Oxford.
WorldBank, 2010. Economics of Adaptation to Climate Change Study (EACC). A Synthesis Report. Final
Consultation Draft. World Bank, Washington D.C.
WorldBank, 2011. GDP per capita (current US$).
<http://data.worldbank.org/indicator/NY.GDP.PCAP.CD>, accessed 28th April 2011.
WRI, 2010. Summary of Developed Country ‘Fast-Start’ Climate Finance Pledges.
<http://www.wri.org/stories/2010/02/summary-developed-country-fast-start-climate-
finance-pledges>, accessed 31st August 2010.
Page 26
26
Annex
LDCF/SCCF Result-Based Management Framework Adaptation to Climate Change (simplified)
Goal: Support developing countries to become climate resilient by integrating both immediate and longer-term
adaptation measures in development policies, plans, programs, projects and actions
Expected results Indicators
Impact: Reduced absolute economic losses at
country level due to climate change, including
variability
Economic loss trend over a project period and
beyond due to climate change, including variability
Outcomes: 8 different ones: Increased knowledge,
general adaptive capacity, awareness and
ownership , mainstreaming in broader development
plans, diversified and strengthened livelihoods,
sectoral adaptive capacity, enabling environment
for technology transfer; demonstration, deployment,
and transfer of technology
19 different ones: threat and hazard information,
perception index; no. of targeted institutions,
capacity perception index; Reduced losses per
weather events; % of targeted population aware; %
of population affirming ownership; Adaptation
actions implemented according to plans; % of
frameworks / strategies that reach adaptation
targets; development sectors responsive to needs;
Physical infrastructure maintained; Ecosystem
services and natural assets maintained; more
secure access to livelihood assets; sustained
climate-resilient livelihoods; Policy environment for
TT, Strengthened capacity for TT; Uptake rates of
technology, % of population adopting transferred
technologies, technologies strengthen coping
mechanisms.
Output : 8 different ones 20 different ones available
Source: simplified after GEF (2009), full version in Annex. Results and indicators in bold letters are the same as for the AFB,
while results and indicators in italics are similar to some AFB results and indicators.
Page 27
27
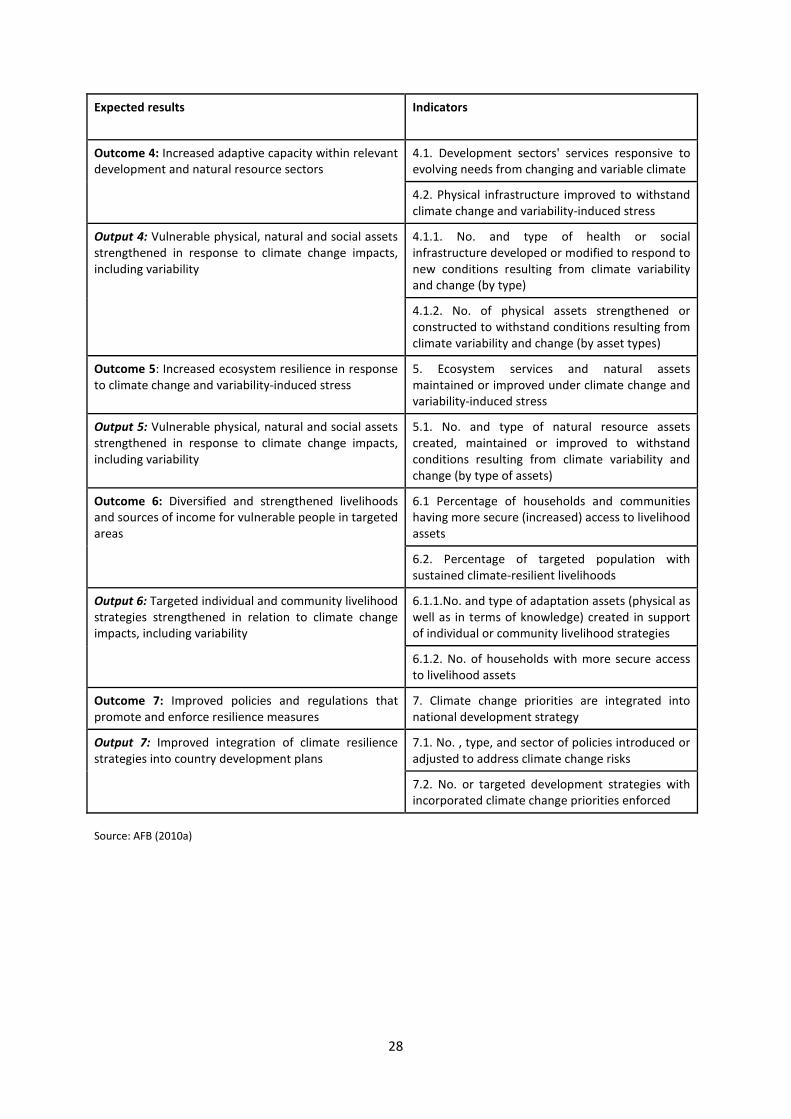
Adaptation Fund Strategic Results Framework (full)
Goal: Assist developing country Parties to the Kyoto Protocol that are particularly vulnerable to the adverse
effects of climate change in meeting the costs of concrete adaptation projects and programs, in order to
implement climate resilient measures.
Expected results Indicators
Impact: Increased resiliency at the community,
national, and regional levels to climate variability and
change.
MISSING
Outcome 1: Reduced exposure at national level to
climate related hazards and threats
1. Relevant threat and hazard information
generated and disseminated to stakeholders on a
timely basis
Output 1: Risk and vulnerability assessments conducted
and updated at a national level
1.1. No. and type of projects that conduct and
update risk and vulnerability assessments
1.2 Quality of relevant risk and vulnerability
assessments
1.3 Early warning systems developed
Outcome 2: Strengthened institutional capacity to
reduce risks associated with climate-induced
socioeconomic and environmental losses
2.1 No. of targeted institutions with increased
capacity to minimize exposure to climate variability
risks
2.2 Number of people with reduced risk to
extreme weather events
Output 2.1: Strengthened capacity of national and
regional centers and networks to rapidly respond to
extreme weather events
2.1.1No. of staff trained to respond to and mitigate
impacts of climate related events
Output 2.2: Targeted population groups covered by
adequate risk reduction systems
2.1.2. Capacity increase of staff from targeted
institutions trained to respond to and mitigate
impacts of climate related events
2.1.3. Percentage of population covered by
adequate risk reduction systems
2.1.4. No. of people affected by climate variability
Outcome 3: Strengthened awareness and ownership of
adaptation and climate risk reduction processes at local
level
3.1. Percentage of targeted population aware of
predicted adverse impacts of climate change, and
of appropriate responses
3.2. Modification in targeted population behavior
Output 3: Targeted population groups participating in
adaptation and risk reduction awareness activities
3.1.1 No. and type of risk reduction actions or
strategies introduced at local level
3.1.2 Degree of understanding of adaptation risk
reeducation among the beneficiaries
3.1.3 No. of news outlets in the local press and
media that have covered the topic
Page 28
28
Expected results Indicators
Outcome 4: Increased adaptive capacity within relevant
development and natural resource sectors
4.1. Development sectors' services responsive to
evolving needs from changing and variable climate
4.2. Physical infrastructure improved to withstand
climate change and variability-induced stress
Output 4: Vulnerable physical, natural and social assets
strengthened in response to climate change impacts,
including variability
4.1.1. No. and type of health or social
infrastructure developed or modified to respond to
new conditions resulting from climate variability
and change (by type)
4.1.2. No. of physical assets strengthened or
constructed to withstand conditions resulting from
climate variability and change (by asset types)
Outcome 5: Increased ecosystem resilience in response
to climate change and variability-induced stress
5. Ecosystem services and natural assets
maintained or improved under climate change and
variability-induced stress
Output 5: Vulnerable physical, natural and social assets
strengthened in response to climate change impacts,
including variability
5.1. No. and type of natural resource assets
created, maintained or improved to withstand
conditions resulting from climate variability and
change (by type of assets)
Outcome 6: Diversified and strengthened livelihoods
and sources of income for vulnerable people in targeted
areas
6.1 Percentage of households and communities
having more secure (increased) access to livelihood
assets
6.2. Percentage of targeted population with
sustained climate-resilient livelihoods
Output 6: Targeted individual and community livelihood
strategies strengthened in relation to climate change
impacts, including variability
6.1.1.No. and type of adaptation assets (physical as
well as in terms of knowledge) created in support
of individual or community livelihood strategies
6.1.2. No. of households with more secure access
to livelihood assets
Outcome 7: Improved policies and regulations that
promote and enforce resilience measures
7. Climate change priorities are integrated into
national development strategy
Output 7: Improved integration of climate resilience
strategies into country development plans
7.1. No. , type, and sector of policies introduced or
adjusted to address climate change risks
7.2. No. or targeted development strategies with
incorporated climate change priorities enforced
Source: AFB (2010a)