UNIVERSIDAD AUTONOMA DE MADRID ESCUELA POLITECNICA SUPERIOR PROYECTO FIN DE CARRERA Analysis of possibilities to use information from NetFlow protocol for improvement of performance of Wide Area Network Pablo Escat Juanes MAYO 2015 1
Transcript
UNIVERSIDAD AUTONOMA DE MADRID
ESCUELA POLITECNICA SUPERIOR
PROYECTO FIN DE CARRERA
Analysis of possibilities to use information from NetFlow protocol for improvement of performance of Wide Area Network
Pablo Escat Juanes
MAYO 2015
1
2
Analysis of possibilities to use information from NetFlow protocol for improvement of performance of Wide Area Network
AUTOR: Pablo Escat Juanes
TUTOR: Krzysztof Wajda, AGH University of Science and Technology, PoloniaPONENTE: Jorge E. López de Vergara Méndez
Escuela Politécnica SuperiorUniversidad Autónoma de Madrid
ABRIL 2015
3
4
This thesis is dedicated to my parents José Luis and Blanca, because this would have been impossible without them.
The ones that have helped me in my search of happinness, and for their love and support throughout my life.
5
6
Acknowledgement:
I would like to express a special gratitude to my supervisor on this thesis Dr. Krzysztof Wajda for the useful comments, remarks and engagement through the learning process of this master thesis. Also, I would like to thank Mr. Grzegorz Rzym for introducing me to the topic as well for the support on the way, even it was not his responsability. Really thankful for their precious time spent during the development of this thesis.
Also all my colleagues that support me during this large proccess; friends from Spain and Poland for keeping me harmonious and keeping me committed to finish this work.
7
8
Abstract
The main goal of this project is to analyze the data regarding to the connections of the Wide Area Networks (WAN) with the networks of Akademia Górniczo-Hutnicza (AGH University), and therefore try to obtain possibilities of optimizimization. Due to this, by analyzing the dumps of the connections, we will collect the characteristics of this network, and therefore to try to figure out how to resolve the troubleshooting this connections encountered.
This document contains the obtained results of a deep analyze of the traffic produced on a WAN and along it (campus network), and also the methods and tools that have been used during the development of it.
Once shown the results of the analyze, the study of possible solutions, deducted from previous studies will be presented, showing all the possibilities that might perform somehow the WAN and also the possible drawbacks of them.
Keywords:
Netflow, flow analysis, nfdump, WAN optimization, performance monitoring.
9
Resumen:
El principal objetivo de este proyecto es analizar la información relacionada con las conexiones que las Redes de Área Extensa (WAN) realizan con la red de la Universidad AGH de Cracovia,en Polonia, y de ahí obtener posibilidades de optimización. Es por ello que, mediante análisis de los registros de las conexiones, recogeremos las características de nuestra red, y de este análisis intentaremos averiguar cómo resolver los problemas que estas conexiones sufren.
Este documento contiene los resultados obtenidos de un profundo análisis de el tráfico producido en una WAN y a lo largo de ella (red del campus), y también los métodos y herramientas usadas durante el desarrollo de este.
Una vez expuestos los resultados del análisis, el estudio de las posibles soluciones, deducido de estudios previos será presentado, explicando las posibilidades que podrían llevarse a cabo y los posibles inconvenientes de estas.
Palabras clave:
Netflow, flow analysis, nfdump, WAN optimization, performance monitoring.
10
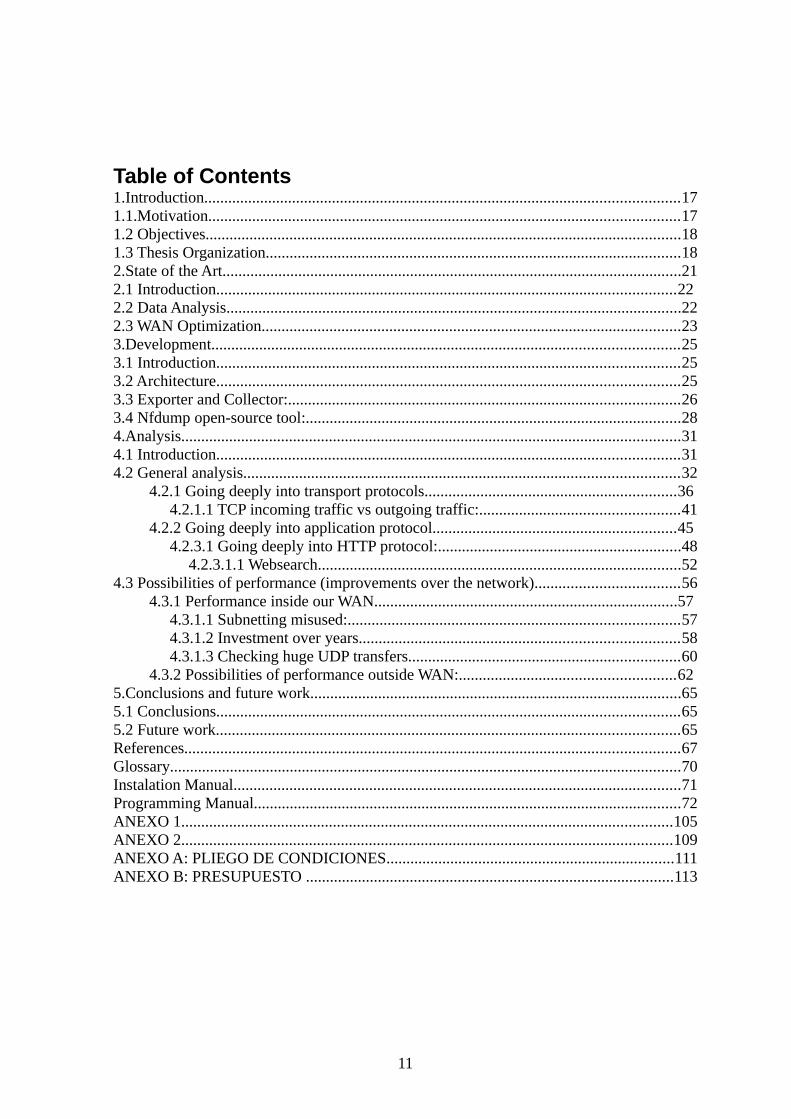
Table of Contents1.Introduction.......................................................................................................................171.1.Motivation......................................................................................................................171.2 Objectives.......................................................................................................................181.3 Thesis Organization........................................................................................................182.State of the Art...................................................................................................................212.1 Introduction...................................................................................................................22 2.2 Data Analysis..................................................................................................................222.3 WAN Optimization.........................................................................................................233.Development.....................................................................................................................253.1 Introduction....................................................................................................................253.2 Architecture....................................................................................................................253.3 Exporter and Collector:..................................................................................................263.4 Nfdump open-source tool:..............................................................................................284.Analysis.............................................................................................................................314.1 Introduction....................................................................................................................314.2 General analysis.............................................................................................................32
4.2.1 Going deeply into transport protocols...............................................................364.2.1.1 TCP incoming traffic vs outgoing traffic:..................................................41
4.2.2 Going deeply into application protocol.............................................................454.2.3.1 Going deeply into HTTP protocol:.............................................................48
4.2.3.1.1 Websearch...........................................................................................524.3 Possibilities of performance (improvements over the network)....................................56
4.3.2 Possibilities of performance outside WAN:......................................................625.Conclusions and future work.............................................................................................655.1 Conclusions....................................................................................................................655.2 Future work....................................................................................................................65References............................................................................................................................67Glossary................................................................................................................................70Instalation Manual................................................................................................................71Programming Manual...........................................................................................................72ANEXO 1...........................................................................................................................105ANEXO 2...........................................................................................................................109ANEXO A: PLIEGO DE CONDICIONES........................................................................111ANEXO B: PRESUPUESTO ............................................................................................113
11
12
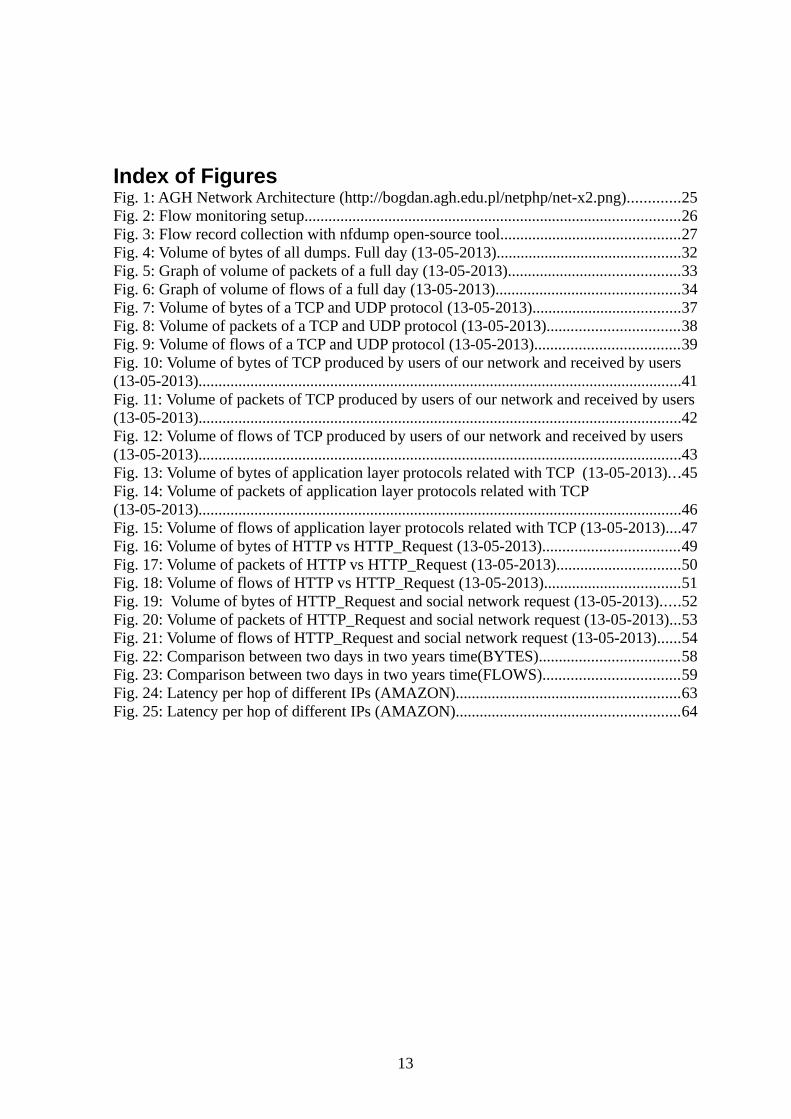
Index of FiguresFig. 1: AGH Network Architecture (http://bogdan.agh.edu.pl/netphp/net-x2.png).............25Fig. 2: Flow monitoring setup..............................................................................................26Fig. 3: Flow record collection with nfdump open-source tool.............................................27Fig. 4: Volume of bytes of all dumps. Full day (13-05-2013)..............................................32Fig. 5: Graph of volume of packets of a full day (13-05-2013)...........................................33Fig. 6: Graph of volume of flows of a full day (13-05-2013)..............................................34Fig. 7: Volume of bytes of a TCP and UDP protocol (13-05-2013).....................................37Fig. 8: Volume of packets of a TCP and UDP protocol (13-05-2013).................................38Fig. 9: Volume of flows of a TCP and UDP protocol (13-05-2013)....................................39Fig. 10: Volume of bytes of TCP produced by users of our network and received by users (13-05-2013).........................................................................................................................41Fig. 11: Volume of packets of TCP produced by users of our network and received by users (13-05-2013).........................................................................................................................42Fig. 12: Volume of flows of TCP produced by users of our network and received by users (13-05-2013).........................................................................................................................43Fig. 13: Volume of bytes of application layer protocols related with TCP (13-05-2013)...45Fig. 14: Volume of packets of application layer protocols related with TCP (13-05-2013).........................................................................................................................46Fig. 15: Volume of flows of application layer protocols related with TCP (13-05-2013)....47Fig. 16: Volume of bytes of HTTP vs HTTP_Request (13-05-2013)..................................49Fig. 17: Volume of packets of HTTP vs HTTP_Request (13-05-2013)...............................50Fig. 18: Volume of flows of HTTP vs HTTP_Request (13-05-2013)..................................51Fig. 19: Volume of bytes of HTTP_Request and social network request (13-05-2013).....52Fig. 20: Volume of packets of HTTP_Request and social network request (13-05-2013)...53Fig. 21: Volume of flows of HTTP_Request and social network request (13-05-2013)......54Fig. 22: Comparison between two days in two years time(BYTES)...................................58Fig. 23: Comparison between two days in two years time(FLOWS)..................................59Fig. 24: Latency per hop of different IPs (AMAZON)........................................................63Fig. 25: Latency per hop of different IPs (AMAZON)........................................................64
13
14
Index of TablesTable 1: Features of NetFlow versions data reduction.........................................................28Table 2: Data of general analysis over a day(13-05-2013)..................................................35Table 3: Data of analysis of TCP and UDP protocol over a day (13-05-2013)....................40Table 4: Data of Analysis of Incoming and Outgoing TCP connections..............................44
15
16
1.Introduction
1.1 Motivation
Nowadays, the use of Internet is somehow essential in the daylife of human beings. Internet can be considered as the biggest WAN, composed of smaller WAN that can be also composed of Local Area Networks (LAN).
Sustained, rapid growth, increased economic competition, and proliferation of new applications have combined to change the character of the Internet in recent years.Troubleshooting and analyzing performance of WAN-deployed applications is an evolving business. Many products and services are available on the market to accommodate the needs of large and small WAN companies. Those companies invest a lot of money to improve and have a well and efficient network.
Internet traffic measurement has been a subject of interest as long as it has been there existing. A number of comprehensive studies have been published over the years as the Internet has evolved from the original Advanced Research Projects Agency Network (ARPANET) [Kleinrock76] to today’s multi-provider commercial environment.
While traffic classification techniques are improving in accuracy and efficiency, traffic classification remains an open problem in Internet research due to the continued proliferation of different Internet application behaviors, further aggravated by growing incentives to disguise some applications to avoid filtering or blocking.
The packet-based traffic analysis is not as scalable as flow-based one due to logical reasons understanding what is a flow [1] “A network flow is defined as an unidirectional sequence of packets between given source and destination end points”, and also because packet capture in high-speed networks requires expensive hardware and substantial infrastructure.This high suitability in high-speed networks is just the first advantage to compare with packet capture. They are widely deployed, due to their integration in high-end packet forwarding devices (around 70% of commercial and research network operators have devices that support flow export [2]).
Provides a significant data reduction (in the order of 1/2000 of the original volume [3]). Also flow export is usually less-sensitive than packet export, since packet headers are considered.
17
By the use of this well known flow analyzer Netflow, due to the built-in monitoring capabilties from Cisco routers, we improve this analysis, and it is necessary to get to our goal of founding the possibilities to perform the network.
1.2 Objectives
The main goal of this thesis is trying to optimize WAN´s, previously doing a deep analysis of the usage of this network, understanding the previous use of WAN transmissions and studying all the possible paths and ways to reduce the usage of WAN links.
In this paper, we report a deep analysis based on traffic measurements taken from the collectors of traffic from AGH campus network. We characterize the traffic over 24 hours scale, in terms of traffic volume, flow volume, flow duration, and traffic composition in terms of IP protocols, transport protocols, as Transmission Control Protocol (TCP) or User Datagram Protocol (UDP), and we characterize this traffic by using the OpenSource tool called nfdump1, to improve the filters of application protocols and to obtain the concrete data necessary to check the possibilities of performance.
1.3 Thesis Organization
The thesis is divided into different parts:
– First of all, after this introduction, a brief state of the art will be introduced regarding to the Request for Comments (RFC) and other important documents related to this thesis, and focusing on the parts that are more important regarding to flow-based monitoring.
– After this, the design of the project will be explained,
– Developing the project is the step that follows the analysis. In this point, by the use of our main tool (Netflow) and also by the usage of scripts, and high-level programmed modules were all the analyzed data will allow us to figure out the global and local use of the network and will give us a more specific overview of this particular network we are working on.
– Once we know the different behaviour of our network transmissions with the rest (knowing top talkers, mostly used ports, hosts, or subnets requested) we will try to find the possibilities of performing WAN optimization, dividing this aspect into our WAN and rest of connectivity (access links or LANs).
1 http://www.nfdump.sourceforge.net/
18
– This thesis will conclude by exposing the best way (or ways) to perform the network and also making a brief documentation of possible future works related to it.
19
20
2.State of the Art
2.1 Flow monitoring
Since there is a traffic flows of information running over a network, the goal of analyzing it and monitoring it has become more and more important to the people working on it, not just because of “what is the network been used for”, perhaps “how is it used”.
Flow-data monitoring and analysis have been proposed and developed throughout the years. We can say that the first steps was developing network monitoring approaches divided in two categories:
-Active monitoring: Injecting traffic into the network to perform different types of measurements as the well known commands PING and TRACEROUTE.
-Passive monitoring: Observing existing traffic as it passes by a measurement point and, therefore, observe the traffic generated by users.
The aim of monitoring traffic on high-speed networks has raised flow monitoring, making it a prevalent method.Before flow-based monitoring tooks the importance that has now a days, the wellknown packet-based analysis used to be the most commonly used, but high-speed networks (up to 100 Gbps) require expensive hardware and huge infrastructure to allocate and later analyze the packets.Because of this a more scalable approach for use in high-speed networks is flow export, in which packets are aggregated into flows and exported for storage and analysis. Initial works on this, date back from nineties and create a solid base for modern protocols such as Netflow [4] or IP Flow Information Exporter (IPFIX) [5].
There are other related technologies with the term “flow” that do not solve the same problems as flow export.
Sflow [6] is very similar to flow export technologies, but not supporting for example 1:1 packet sampling as flow export technologies do.OpenFlow [7] which controls a flow-level information available within the OpenFlow control plane (e.g., packet and byte counters) was recently used for performing network measurements [8], but since it separates control plane from data plane [9] it should not be considered as a flow export technology.
21
Finally, Deep Packet Inspection(DPI), which is a data analysis approach that refers to the process of analyzing packet payloads, but typically considering just individual packets, not as the flows.
2.2 Data Analysis
When discussing the data analysis, we could distinguish three different areas that relates to the analysis of a wide area network:
Flow Analysis & Reporting, use to check “how” your network is being used by the users, just by browsing and filtering flow data, checking statistics like top talkers, subnets that exchange more traffic, usage of bandwidth, and also the possibility of reporting and alerting when some of this situations is exceed, just by configuring a traffic threshold. With the help of some graphs we can check the moments where the traffic behaves different, due to something that might be malicious or purely bening. Nfsen2 is the typical application providing this functionality.
In Threat Detection we can distinguish between two types of uses:Flow data may be used purely for analyzing which host has communicated with which each other host (i.e., forensics), potentially including summaries of the number of packet and bytes involved, the number of connections, etc. The second utilizes the definition of a flow for analyzing certain types of threats, which allows for modeling threats in terms of network behavior. In the remainder of this section, we discuss an example of both types.
Is in this part where a lot of research has be done trying to make flow export especially useful for the detection of the following attacks and malwares [10]: Distributed Denial of Service (DDoS) attacks, network scans, worm spreading, and botnet communication. The commonality between these attacks is that they affect metrics that can be directly derived from flow records, such as the volume of traffic in terms of packets and bytes, the number of active flows in a certain time interval, suspicious port numbers commonly used by worms, and suspicious destination hosts for traffic.
Performance Monitoring which aims at observing the status of services running on the network.We can distinguish between the possibility of performing the exporter and collector somehow to get better flows to analyze, checking the clock resolution effects, or developing some methods for exporter profiling. But as in this case, the need of administration permission is needed we will focus on performing
2 http://nfsen.sourceforge.net/
22
As it is mentioned in [1], “The performance of data analysis applitations is
usually measured by means of interface responsiveness” . The most common metrics that are used to perform data analysis applications report include Round-Trip-Time (RTT), delay, jitter, response time, packet loss and bandwidth usage. As for the other types of data analysis, the greatest strength of monitoring performance using flow measurements comes from the strategical vantage points from where flow measurements are usually taken.
There are some different researchs about how to use this metrics, such as RTT or one-way delay[11], packet loss[12], and also the idea of trajectory sampling [13] , to perform the network, but not fully-related with flow analysis of data on real situations as in our case,taking more into account the possibilities of changing some methods that are used on the network or, as said before, sampling the trajectory over the network, but not the final post-processed data.For example, in the case of [12], the RTT or one-way delay was made between two routers, estimateing from the difference between the flow start times reported by the routers for the same flow. But if we try to apply this approach to empirical data, it turns out that the results are affected by timing errors. So we can say that our search of possibilities of performance will focus on the flows related with application protocols, report of the subnets, and top-talkers of them, and IP usage for high volume , or “high sharing”. Also explaining other possibilities that could be done, but with a storng dependency on Information Elements (IE), network administrative permissions, or technology implemented, e.g. Multiprotocol Label Switching (MPLS).
2.3 WAN optimization
Due to the performance degradation produced by natural characteristics of Wide Area Networks (WAN), such as high packet loss rate or high latency, there have been many papers of studies related to it. Therefore, we can find different techniques for improving a WAN acceleration, such as minimizing bandwidth utilization, addressing the latency or improving the protocol performance. But most of the techniques aim to maximize application performance. Techniques connected with this include compression, data deduplication, caching, prefetching [18][19] (or proactive caching), or protocol optimization [17]. Our study will take into account the possibilities of caching or prefetching some information, based on Hyper Text Transfer Protocol (HTTP) used by the users, as it might reduce the latency experienced by them.
In our case, as our thesis is based on flow analysis, we will focus on HTTP application layer protocol , taking into account a TopN analysis, based on Markatos [20], which suggested a Top-10 criterion. For Top-10 criterion a server should be responsible for calculating in a specified period time the most requested webpages, documents or files, to accelerate RTT of users
23
connections. Moreover, the TopN HTTP connections related to social network,
will be analyzed as this approachcan give us a better approach for caching and also for deciding what should be cached.
We will also check the session layer, as several studies present interesting ideas for WAN acceleration, as Domain Name Server (DNS) and Uniform Resource Locator (URL) rewriting techniques [22], and parse and push techniques[21].
24
3.Development
3.1 Introduction
To develop our tool for analyzing the dumps of AGH Campus Network is neccesary to talk first of all about the architecture and topology of our WAN, just to understand it in a better way, and also explain briefly fundamentals about the exporting and collecting process, which does not involve directly this thesis, but for sure the final stage before the analysis, as each of these stages affects the final flow data and consequently, its analysis.
3.2 Architecture
In this section an overview of the study of our network will be done, taking into account what is the architecture of our flow monitoring, where the exporter and the collector are placed and how they are affecting the incoming data to our network.
Also explaining the topology of the campus network to figure out, in the next point, what are the possibilities of analysis on our flow data
In order to explain in a better way how the network processes our flows, we have to
25
assume that the exporter is allocated on Cyfronet (which vendor is Pioneer). The dumps to be processed are collected at UCI border router, with a speed link of 10Gbps (on the building A-2 to be more accurate) . There is a second line (back up) in case some data is lost.
Getting moreover into or virtualized netrwork, is needed to say that AGH Campsus Network is divided into 50 Virtual Area Networks (VLAN) all with the same permissions and purposes, except the one configured to the Rector´s office, because of security purposes. This is an important point to split our analysis on the next point, due to the close similarity between all of them, so we can suggest a reconfiguration of some of them depending on the use given, and to understand also in a better way where the flows come from and if its reasonable or not the data that they send or receive.
3.3 Exporter and Collector:
In most of the typical flow monitoring setups we can distinguish different stages; a first stage called Packet Observation, where packets are captured and pre-processed for further use. In this step is important to know that the timestamping of them are done by any condition.
The last part of Packet Observation is packet sampling and filtering, where only certain kinds of packets that fix some criteria. Packet sampling aims at reducing the load of subsequent stages or processes and Packet filtering tries to deterministically separate all the packets having a certain property from those not having it [14].
26
Fig. 2: Flow monitoring setup
After this stage Flow Metering and Export where packets are aggregated into flows and flow records are exported. Here the flow sampling and filtering is done, and in contrast with packet sampling and filtering, this two processes are performed after the Metering Process and therefore work on flow records instead of packets, so if a flow doesnt match certain criteria, all packets would not be accounted. Due to this, there is possibility of performing this stage aiming to get a better layout of the flow records, by selecting different IE´s [16]. In our case, and in the case of four iut of seven exporters, the typical 5-tuple is the way to describe our IP flows. It is important to remark that depending on the goal that is followed, there might be some IEs that fit better with our aims.So we can say that flow exporters with application awareness combine DPI with traditional flow export .A case for this are MPLS labels; “since every packet can carry a stacked set of such labels, one traditionally has to define a dedicated position for every label, e.g., mplsTopLabelStackSection, mplsTopLabelStackSection2, etc., with structured data, an MPLS label stack can be encoded using a single IE” [1].
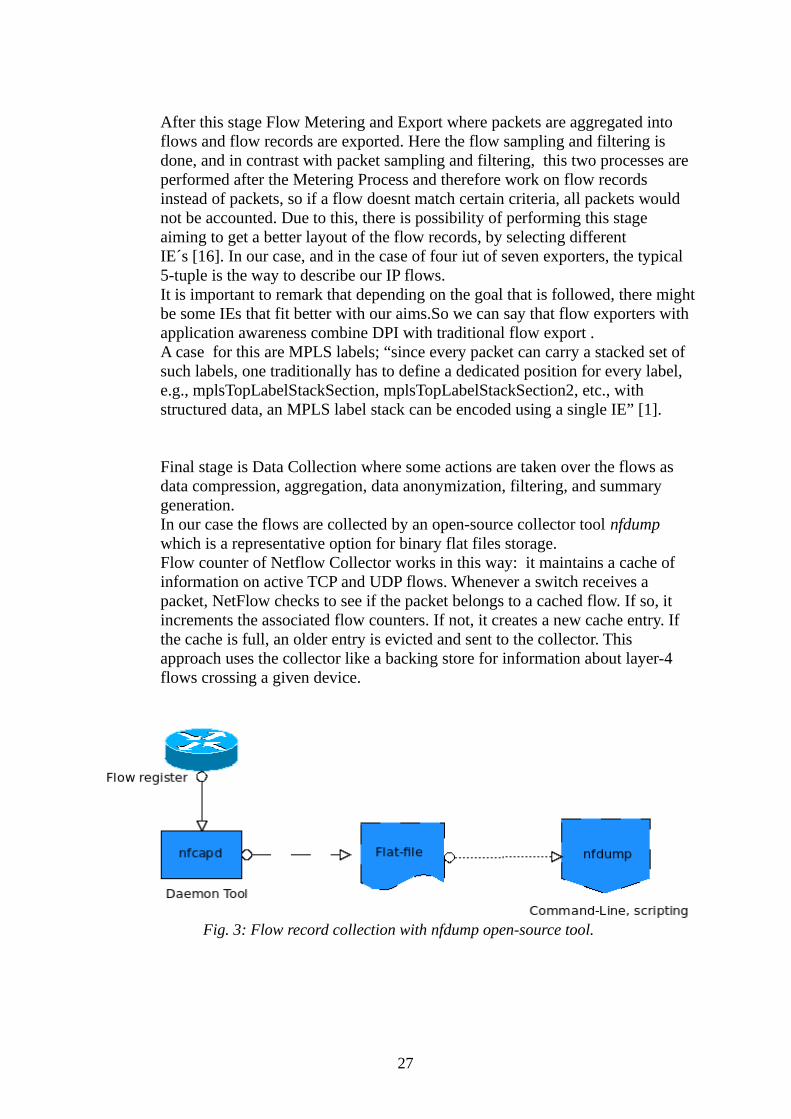
Final stage is Data Collection where some actions are taken over the flows as data compression, aggregation, data anonymization, filtering, and summary generation. In our case the flows are collected by an open-source collector tool nfdump which is a representative option for binary flat files storage. Flow counter of Netflow Collector works in this way: it maintains a cache of information on active TCP and UDP flows. Whenever a switch receives a packet, NetFlow checks to see if the packet belongs to a cached flow. If so, it increments the associated flow counters. If not, it creates a new cache entry. If the cache is full, an older entry is evicted and sent to the collector. This approach uses the collector like a backing store for information about layer-4 flows crossing a given device.
27
Fig. 3: Flow record collection with nfdump open-source tool.
Table 1: Features of NetFlow versions data reduction
Some studies proposed a kind of performing over the metrics taken by exporter and collector, related with the flow cache (Flow Cache Entry Expiration or Flow Cache Size), and also with the Processing Delay or Flow Record Deduplication. But from the point of view of our thesis, an analysis made after this stage will not give any clue about if our flows have been exported and collected on the best way.
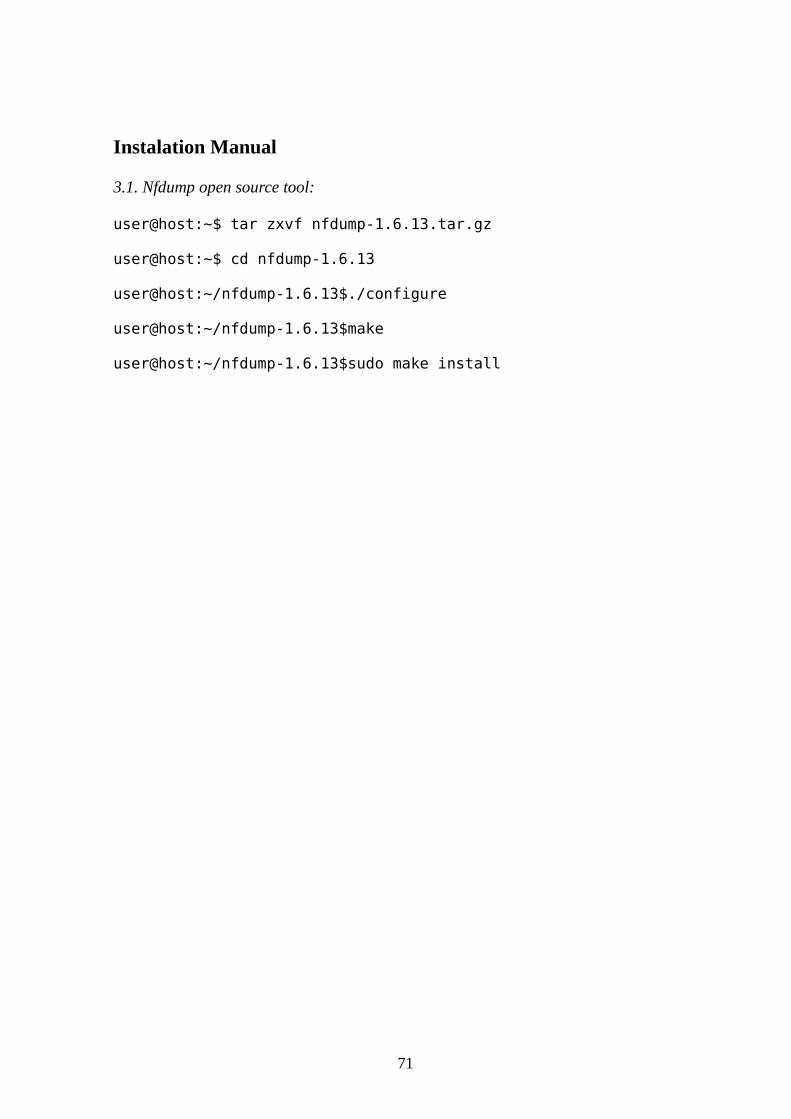
3.4 Nfdump open-source tool:
Nfdump is a set of tools to collect and process NetFlow data. It's fast and has a powerful filter pcap like syntax analyzer. It supports netflow versions v1, v5, v7, v9 and IPFIX as well as a limited set of sflow. It includes support for CISCO ASA (National Spot Exchange Limited (NSEL)) and CISCO Network Address Translation (NAT) devices, which export event logging records as v9 flows. Also nfdump is fully IPv6 compatible[15].
Nfdump uses intervals of 5 minutes by default, captured by nfcapd which is a netflow capture daemon , so each folder of a day to analyze consist on 288 files of dumps, binary files that can be interpreted by nfdump.
So finally, we will need to develop our tools to analyze the huge volume of dumps that are collected everyday, the procedures and table of statistics that nfdump provides us, and also some programming tools as bash scripting and perl scripting, to give that statistics created by nfdump a better way to be interpreted and processed, such as textsampling, invoking tools as WHOIS3 or NSLOOKUP4, and for basic calculations with the data display.
A tool to analyze day by day (a day is collected in 288 nfcapds (files) over a folder named YEAR-MONTH-DAY) has been developed , using the information given and making a deep analysis of it, just by nfdump processes, awk and perl scripting.
29
30
4.Analysis
4.1 Introduction
Data Analysis is the final stage in a flow monitoring setup, where the results of all previous stages come together, knowing that, in our case, flows have been collected by nfdump.
Normally this stage is divided into 3 different stages, which are Flow Analysis and Report, Threat Detection and Performance monitoring, but in our case we are not really interested in finding possible attacks to our network, just to figured out by analyzing the data that flows into it, the possibilities of peroforming it.
As in this case, the data analysis is made manually, we don´t take into account the possibilities of performing the processing delay of the collector, or the frequency of exporting flows. Because of that, if some packets were lost during exporting and collecting process, we need to deal with it.
Due to this, we will split our analysis into 3 different stages that will, somehow, take into account the previous stages that we mentioned (flow analysis and reporting, threat detection and performance monitoring).First we will make a robust analysis of the flows exported and collected, taking into account most used transport and application protocols, separating them into bytes, packets and flows, and also incoming and outgoing connections. Here is where some reports about usage of the bandwidth, high data volume transmission or long-delay flows.
Once the robust analysis is done, we will focus on the possibilities of performance on WAN. As commented before, the TCP protocol will be deeply analyzed, to check how this “slow-start flows” are acting over the network, and also by finding the possible prefetched data that could help to reduce application latency received by users.
Finally our goal will focus on the possibilities of caching bulk data that might not be needed to be sent during rush hours of the day, and prefetching the possible information that, in our analysis, seems to be the most popular one.
In the next stages of the memory, an overview of the tool of analysis will be explained.Its important to say that, because of the high-volume of data created by statistics, it could be a drawback in some cases, due to the time of executing the whole tool, and the hardware needed to store the information.
31
4.2 General analysis
The Data Analysis has to start with a general overview of flows that are passing throw our observation point.
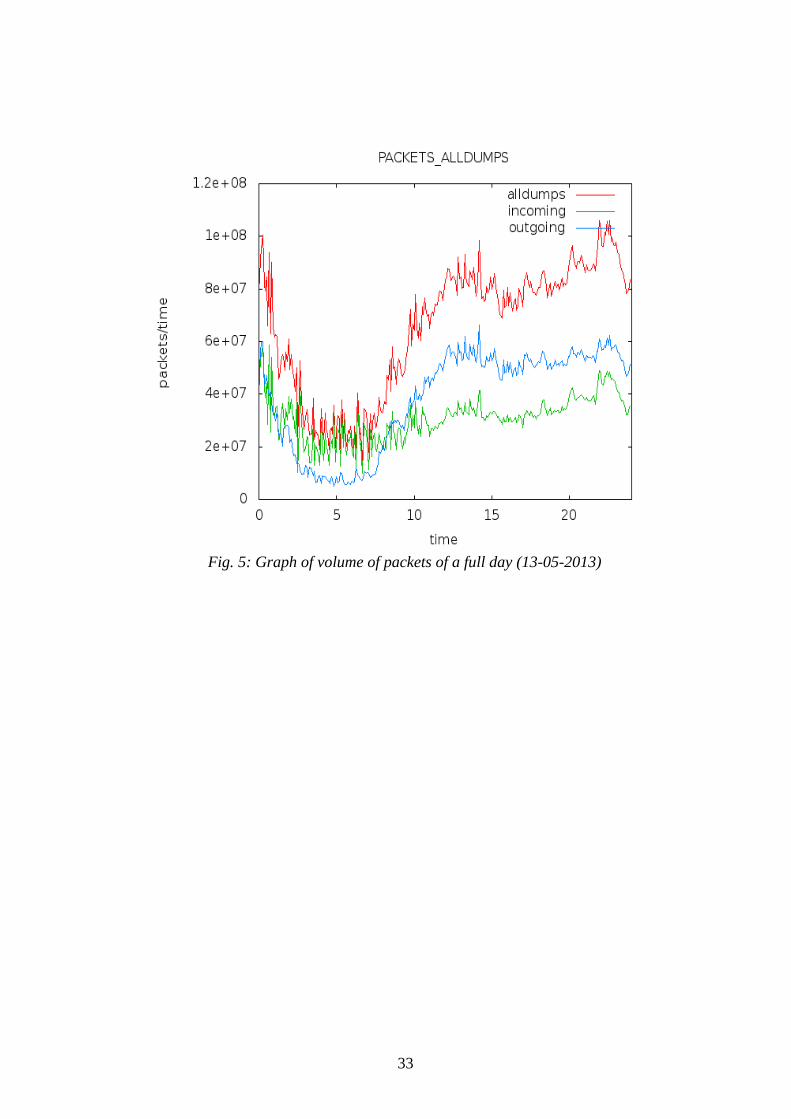
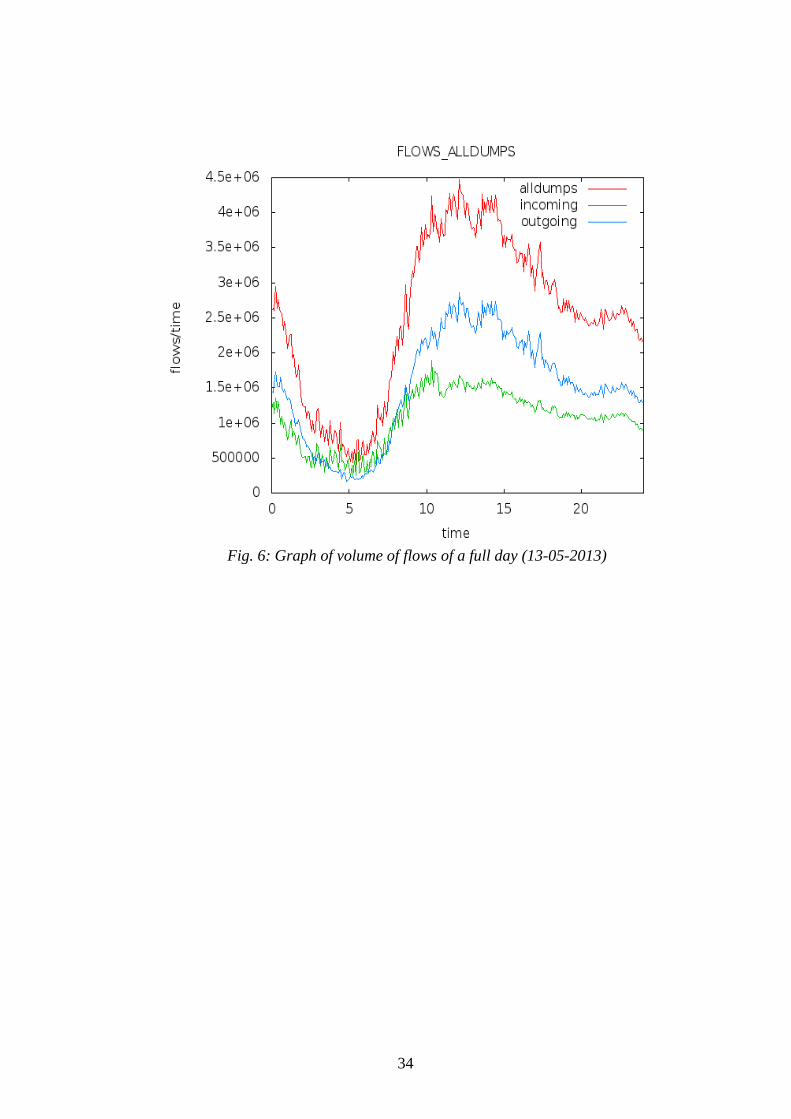
The most general analysis that can be made consist on calculating the amount of bytes, packets and flows of a single day. This means analyzing the 288 nfcapds (each of them 5 minutes real-time), with simple nfdump commands and basic awk scripting.We obtain the total amount of bytes, packets and flows for a random day.
The next three graphs represent the volume of bytes, packets, and flows over a day.In red the total amount of it, and in green and blue the data that is being send from our campus, and the one that is received respectively (OUTGOING/INCOMING).This is improved in our scripts just by simply filtering the subnets and adresses belonging to our network, from others that not belong to it.
32
Fig. 4: Volume of bytes of all dumps. Full day (13-05-2013).
33
Fig. 5: Graph of volume of packets of a full day (13-05-2013)
34
Fig. 6: Graph of volume of flows of a full day (13-05-2013)
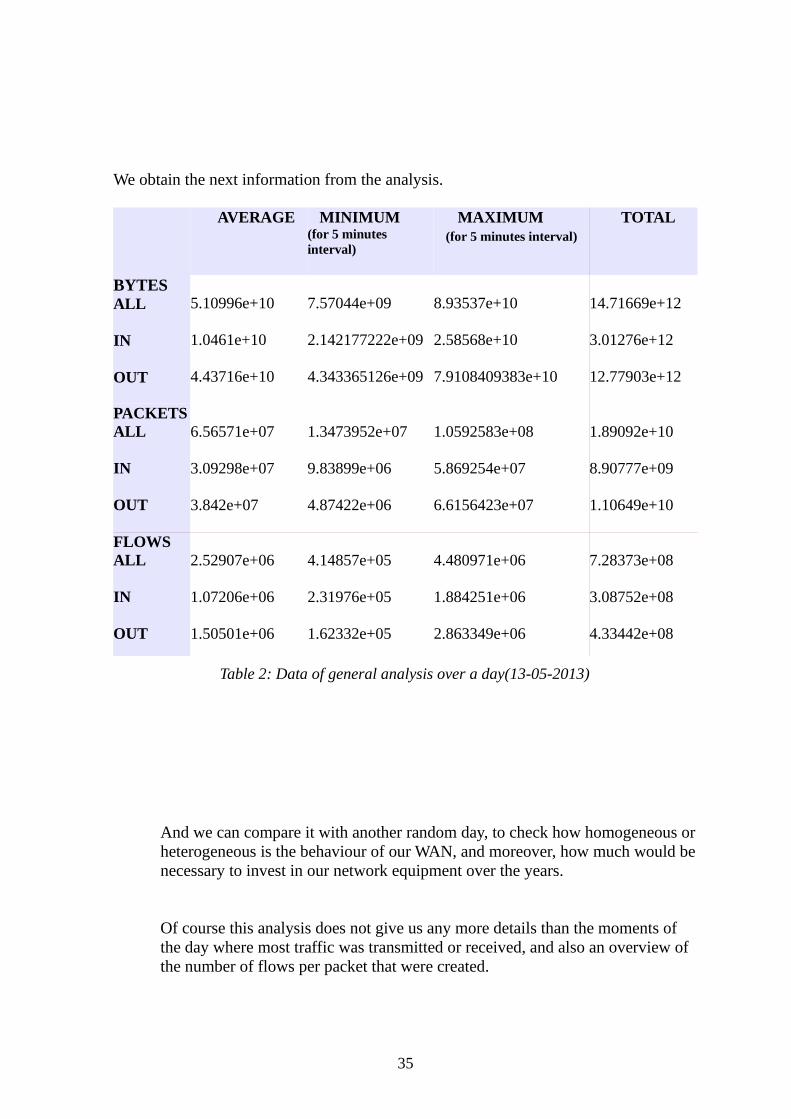
We obtain the next information from the analysis.
AVERAGE
MINIMUM (for 5 minutes interval)
MAXIMUM (for 5 minutes interval)
TOTAL
BYTESALL
IN
OUT
5.10996e+10
1.0461e+10
4.43716e+10
7.57044e+09
2.142177222e+09
4.343365126e+09
8.93537e+10
2.58568e+10
7.9108409383e+10
14.71669e+12
3.01276e+12
12.77903e+12
PACKETSALL
IN
OUT
6.56571e+07
3.09298e+07
3.842e+07
1.3473952e+07
9.83899e+06
4.87422e+06
1.0592583e+08
5.869254e+07
6.6156423e+07
1.89092e+10
8.90777e+09
1.10649e+10
FLOWSALL
IN
OUT
2.52907e+06
1.07206e+06
1.50501e+06
4.14857e+05
2.31976e+05
1.62332e+05
4.480971e+06
1.884251e+06
2.863349e+06
7.28373e+08
3.08752e+08
4.33442e+08
Table 2: Data of general analysis over a day(13-05-2013)
And we can compare it with another random day, to check how homogeneous or heterogeneous is the behaviour of our WAN, and moreover, how much would be necessary to invest in our network equipment over the years.
Of course this analysis does not give us any more details than the moments of the day where most traffic was transmitted or received, and also an overview of the number of flows per packet that were created.
35
4.2.1 Going deeply into transport protocols
To understand on a better way our network it´s necessary to check which are the Top protocols used. Because of that a script was created to obtain the metrics of transport protocol and application protocol.
It is interesting to know that, as nfdump works on transport layer, it has only sintax filtering for protocols on this layer (TCP or UDP) . So, due to this, we need to know how the application protocols work, taking into account their transport protocol, possible ports that are used and, in some cases, the number of packets sent or received.
As our search of possibilities for performance are deeply related with TCP protocol we will focus on its behaviour.
Nfdump allows us to filter all the TCP connections as it works on transport layer, and has the TCP protocol as a type of protocol filter.
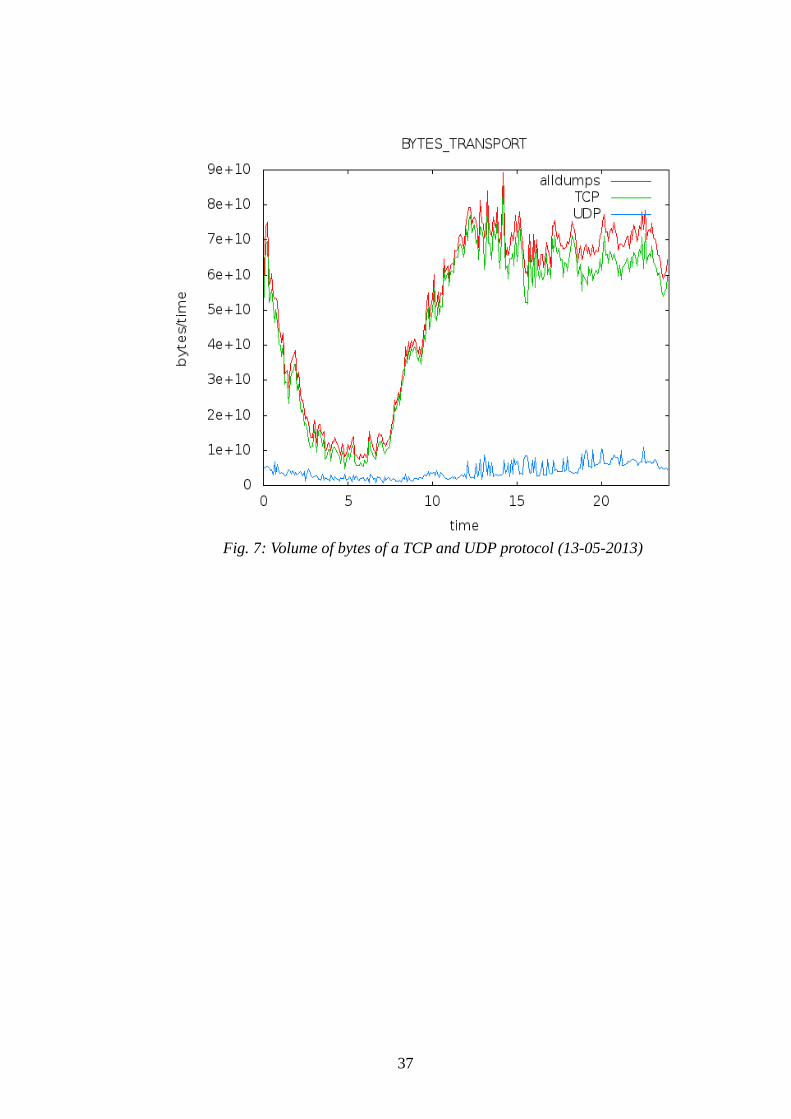
In the next graphs we can check the popularity of use of TCP protocol. It seems that is the “host” of our flows as it is almost in-line with the analysis made to all the dumps without any filtering.
36
37
Fig. 7: Volume of bytes of a TCP and UDP protocol (13-05-2013)
38
Fig. 8: Volume of packets of a TCP and UDP protocol (13-05-2013)
39
Fig. 9: Volume of flows of a TCP and UDP protocol (13-05-2013)
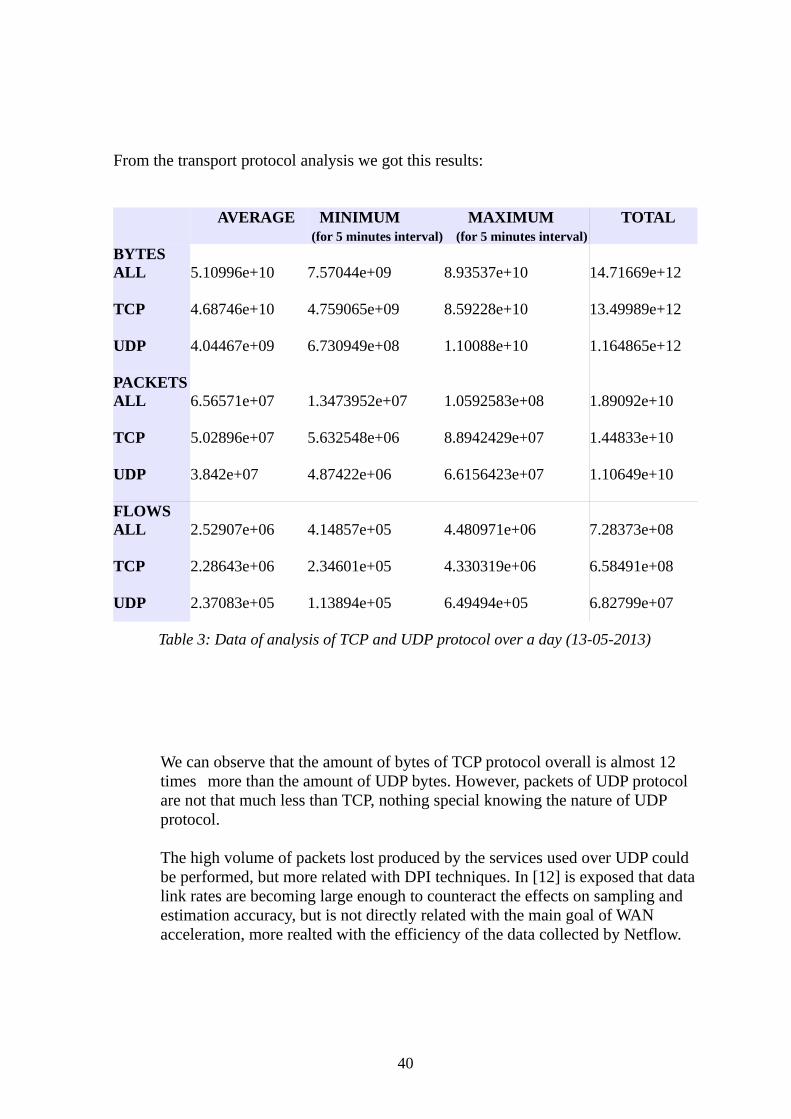
From the transport protocol analysis we got this results:
AVERAGE
MINIMUM (for 5 minutes interval)
MAXIMUM (for 5 minutes interval)
TOTAL
BYTESALL
TCP
UDP
5.10996e+10
4.68746e+10
4.04467e+09
7.57044e+09
4.759065e+09
6.730949e+08
8.93537e+10
8.59228e+10
1.10088e+10
14.71669e+12
13.49989e+12
1.164865e+12
PACKETSALL
TCP
UDP
6.56571e+07
5.02896e+07
3.842e+07
1.3473952e+07
5.632548e+06
4.87422e+06
1.0592583e+08
8.8942429e+07
6.6156423e+07
1.89092e+10
1.44833e+10
1.10649e+10
FLOWSALL
TCP
UDP
2.52907e+06
2.28643e+06
2.37083e+05
4.14857e+05
2.34601e+05
1.13894e+05
4.480971e+06
4.330319e+06
6.49494e+05
7.28373e+08
6.58491e+08
6.82799e+07
Table 3: Data of analysis of TCP and UDP protocol over a day (13-05-2013)
We can observe that the amount of bytes of TCP protocol overall is almost 12 times more than the amount of UDP bytes. However, packets of UDP protocol are not that much less than TCP, nothing special knowing the nature of UDP protocol.
The high volume of packets lost produced by the services used over UDP could be performed, but more related with DPI techniques. In [12] is exposed that data link rates are becoming large enough to counteract the effects on sampling and estimation accuracy, but is not directly related with the main goal of WAN acceleration, more realted with the efficiency of the data collected by Netflow.
40
4.2.1.1 TCP incoming traffic vs outgoing traffic:
As we mentioned before, the TCP protocol is the more widely used on the transport protocol, and so, we will focus on its behaviour.
Nfdump allows us to filter all the TCP connections as it works on transport layer and has TCP as a type of protocol filter. So just by knowing the IP adresses and subnets of our network, we can split the traffic into two: from inside our network (sent by users), and from outside it (replies from the Internet).
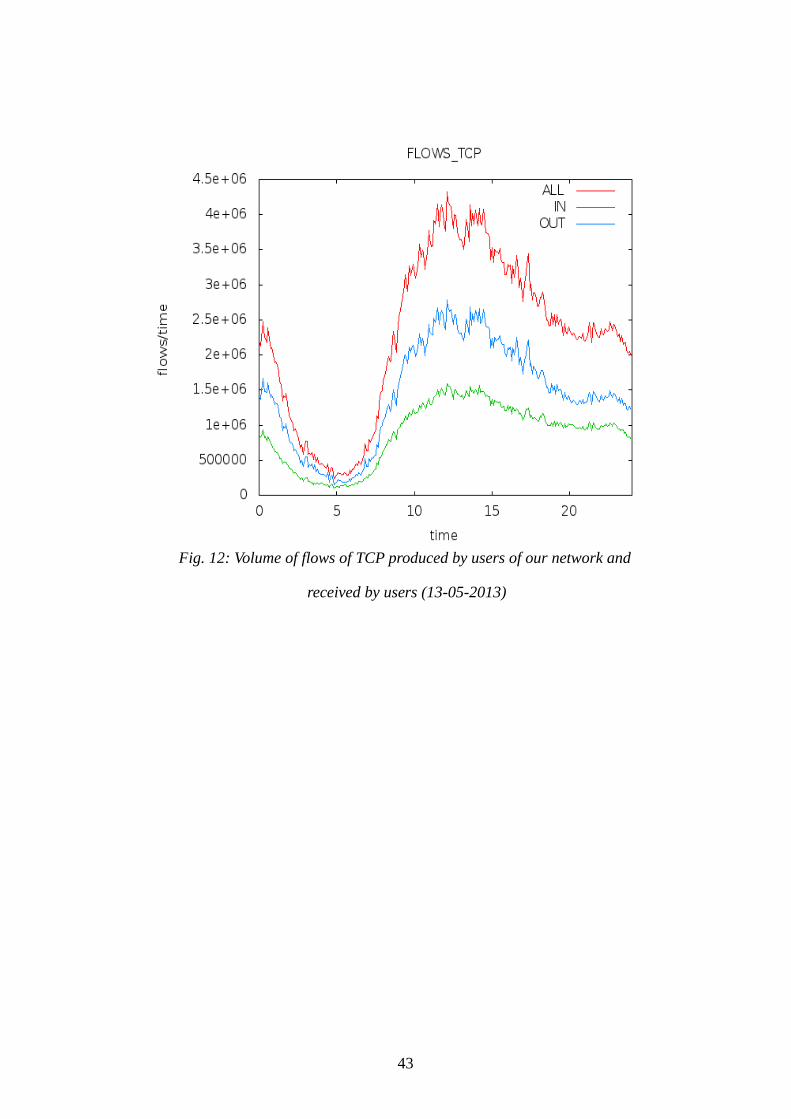
In the next figures (fig.12, fig.13, fig.14) we represent the amount of bytes, packets and flows recorded on our Netflow Capture Daemon (nfcapds).
41
Fig. 10: Volume of bytes of TCP produced by users of our network and
received by users (13-05-2013)
42
Fig. 11: Volume of packets of TCP produced by users of our network and
received by users (13-05-2013).
43
Fig. 12: Volume of flows of TCP produced by users of our network and
received by users (13-05-2013)
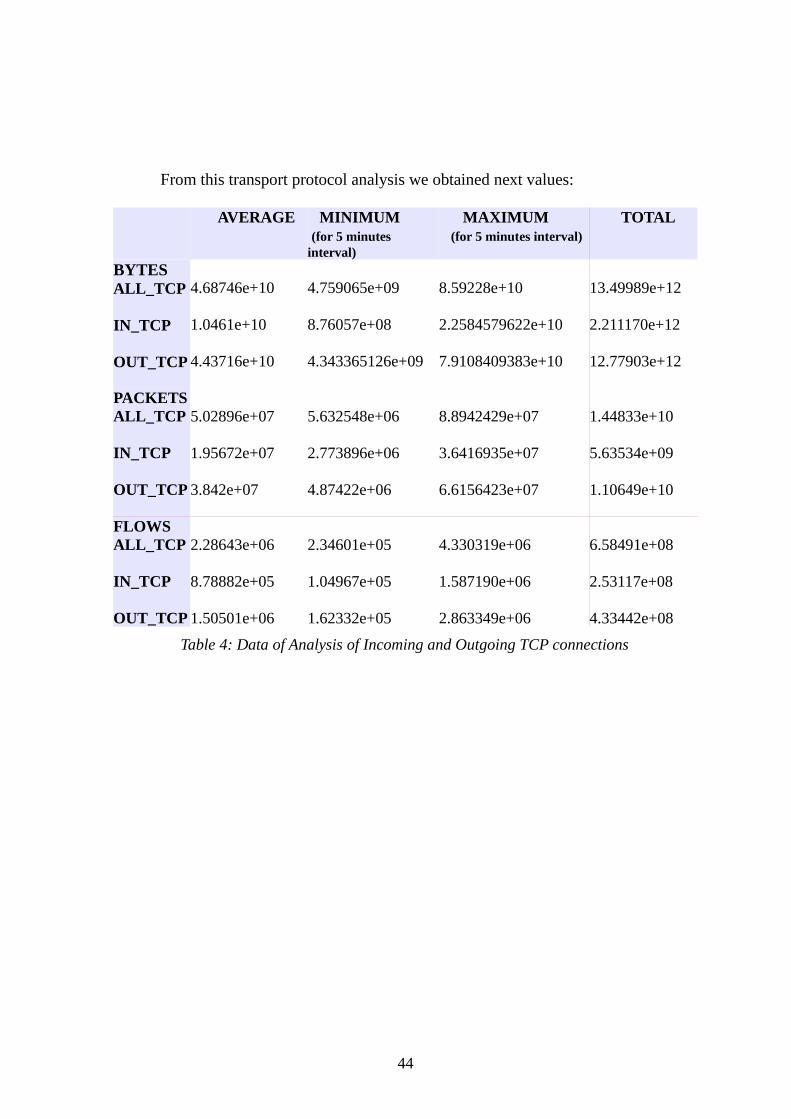
From this transport protocol analysis we obtained next values:
AVERAGE
MINIMUM (for 5 minutes interval)
MAXIMUM (for 5 minutes interval)
TOTAL
BYTESALL_TCP
IN_TCP
OUT_TCP
4.68746e+10
1.0461e+10
4.43716e+10
4.759065e+09
8.76057e+08
4.343365126e+09
8.59228e+10
2.2584579622e+10
7.9108409383e+10
13.49989e+12
2.211170e+12
12.77903e+12
PACKETSALL_TCP
IN_TCP
OUT_TCP
5.02896e+07
1.95672e+07
3.842e+07
5.632548e+06
2.773896e+06
4.87422e+06
8.8942429e+07
3.6416935e+07
6.6156423e+07
1.44833e+10
5.63534e+09
1.10649e+10
FLOWSALL_TCP
IN_TCP
OUT_TCP
2.28643e+06
8.78882e+05
1.50501e+06
2.34601e+05
1.04967e+05
1.62332e+05
4.330319e+06
1.587190e+06
2.863349e+06
6.58491e+08
2.53117e+08
4.33442e+08
Table 4: Data of Analysis of Incoming and Outgoing TCP connections
44
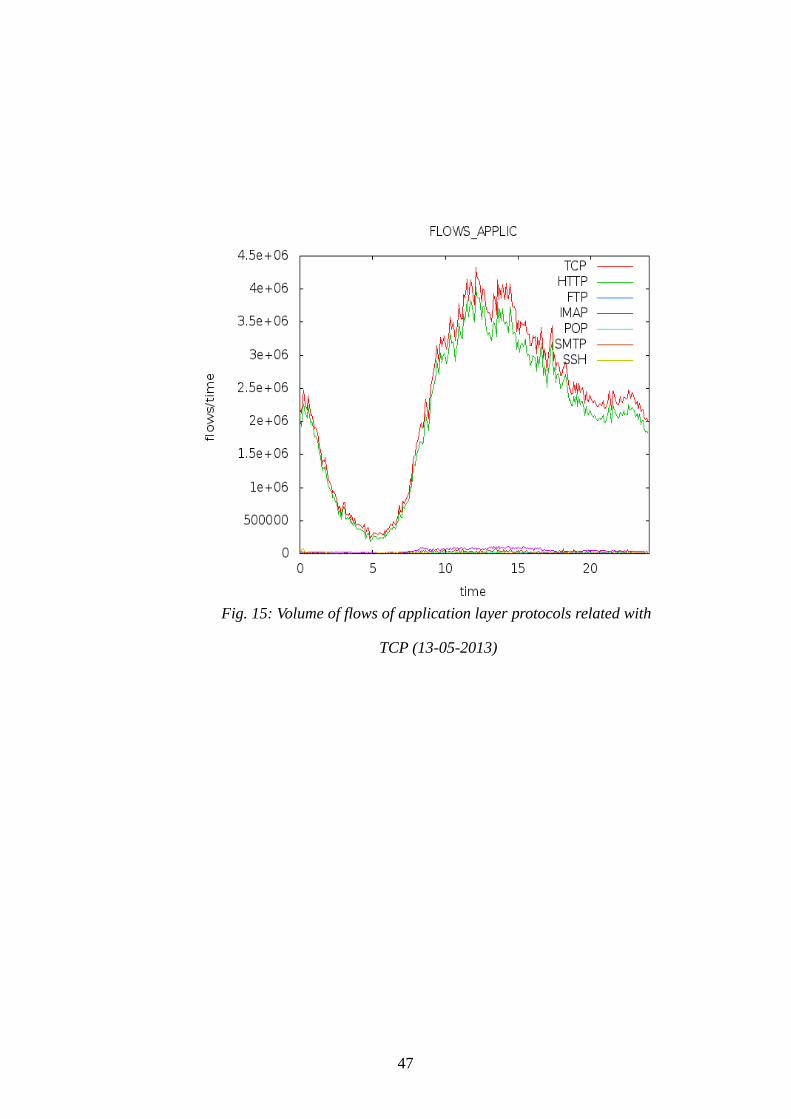
4.2.2 Going deeply into application protocol
At this point, an analysis of the usage of application protocol will be presented to make sure what is obvious in most common WANs, this is, that the HTTP protocol is the most used on the Internet.As the application performance is modified due to the limitations of the protocols that are not designed for WAN in general, such as long transmission paths, high network latency, network congestion and limited available bandwidth [16].
The process for filtering the information was made with a script taking into account the transport layer protocol and the ports that are used for each application.
Next figures (fig. 16, fig. 17, fig. 18) will illustrate the amount of bytes, packets and flows used:
45
Fig. 13: Volume of bytes of application layer protocols related with TCP
(13-05-2013)
46
Fig. 14: Volume of packets of application layer protocols related with
TCP (13-05-2013)
47
Fig. 15: Volume of flows of application layer protocols related with
TCP (13-05-2013)
4.2.2.1 Going deeply into HTTP protocol:
As we finally want to perform the usage of WAN´s, and due to the total amount of use of this protocol, we make a deep analyze of this protocol regarding to our flows. Basing our analysis on the adresses and subnets that belongs to some of the most popular websites, speculated by us, we will try to characterize the behaviour of this flows and find the benefits and drawbacks of optimizing this different application services, based on previous studies and in our own experience.
As we have previously checked the amount of data produced by users and received by them, in this case we wont take into account this perspective, due to the almost “inlined” traffic of HTTP over the whole amount of traffic.
In this section we will see the amount of request that users ask to the network, with the main goal of finding what are the most requested ones. In next section
we will compare this request with a group of net addresses and IP´s related with social networking to try to figure out if there is some possibility of prefetching (web-prefetching) information that could help to accelerate the WAN.
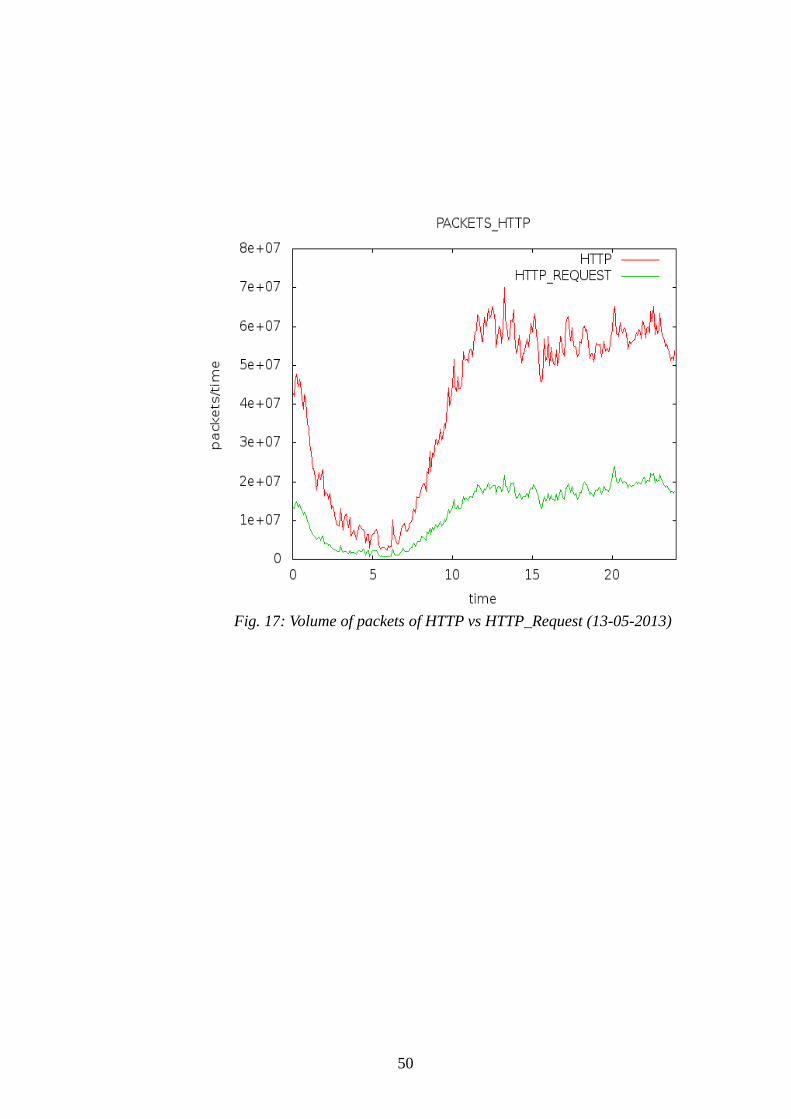
Next figure (fig. 16, fig. 17. fig. 18) illustrates the volume of HTTP request in a day, in comparison to the total volume of data that HTTP has produced.
48
49
Fig. 16: Volume of bytes of HTTP vs HTTP_Request (13-05-2013)
50
Fig. 17: Volume of packets of HTTP vs HTTP_Request (13-05-2013)
The 5,56% of the HTTP bytes, 31,05% packets and 31.8% of flows come from REQUEST.
It is strange to see that the amount of requested flows is not so close to the theorically 50% (every request has a response), but due to the possibility of some applications that might be using port 80 and protocol TCP (as p2p) might be including some data which is out of this particular analysis. It could be also related with the sampling frequency used to generate the flows.
And, as we explained before, we will search the quantity of requests being produced by filtering the nfcapds with a group of net addresses and IP´s searched by nslookup, whois and some of them taken from tier 1 companies. This will allow us to see whether social networking (Facebook, Youtube, Twitter, Amazon, Dropbox...) is the most used application networking due to the high amount of students inside a campus.
51
Fig. 18: Volume of flows of HTTP vs HTTP_Request (13-05-2013)
4.2.2.1.1 Websearch
The filtering of social media is not really accurate as many application services are connected between each other (correlated such as e.g. Amazon with Instagram) and also due to external links that can interfere with our analysis of webpages. Eventhough, the information taken could allow us to see if some information would be better placed or cached on a server, or on the other side, if it is something that does not correspond to us, and corresponds to other companies to invest effort on it.
As said before, we analyze the possible request connections from our network to different wellknown webpages by filtering by possible IP adresses and subnets previously obtained by the use of whois, nslookup and some given by network companies. This will give us a perspective of how much social network impacts on our WAN.
52
Fig. 19: Volume of bytes of HTTP_Request and social network request
(13-05-2013)
53
Fig. 20: Volume of packets of HTTP_Request and social network request
(13-05-2013)
The previous graphs shows a big difference between the usage of Facebook. This can mean, that there is a lack of IP adresses in our scripts, or that Facebook is the most used social webpage on our network. But if we use the TopN statistics from nfdump we observe the 10 most HTTP connections in terms of volume of bytes. And checking with WHOIS these IP adresses we observe that 173.194.70.0/24 belongs to Google.Inc, 31.13.64.0/24 and 69.171.246.16 belongs to Facebook, and the subnet 212.191.227.0/24 belongs to PIONIER, our vendor in Poznan, and at the same time related with Google Ireland.
54
Fig. 21: Volume of flows of HTTP_Request and social network request
We observe that Google has a major contribution of flows sent over HTTP traffic, but due to the huge amount of applications and addresses that Google has, it seems to be difficult to really check just by flow analyzing which application belonging to Google is taking that amount of traffic.
55
4.3 Possibilities of performance (improvements over the network)
In this section we will explain what possibilities have been found during the analysis of the flow data collected. We will split the possibilities in two different cases: Inside our WAN and outside WAN.
This means taking advantage of the data-traffic flowing inside our network, splitting the analysis into the different subnets that form the Campus network, checking for high-volume of peer to peer (P2P) connections between our users and speculating about the possible investment that could need to be done over the years talking about amount of data processed by day. And on the other hand, outside our WAN we will try to check if our Top10 over the social network that we have analyzed. We will examine the path that this traffic is taking over the Internet, to try to see if our DNS server works properly or not with this IP addresses, in terms of latency and hops taken until the destination address. This will be improve by basic active monitoring commands PING and TRACEROUTE.
We do this because the main point of performing the HTTP protocol aims on decreasing the latency perceived by final users, so by checking the hops and latency between servers, we could take some clues about which are the better paths.
56
4.3.1 Performance inside our WAN
As the topology and architecture of our network is wellknown by us, it can be easier to check if it is being used in the right way, or if there are some resources that are not being used on the proper way.
4.3.1.1 Subnetting misused:
By filterring all the subnets that form our campus network we can check how they have been used, which are the most used ones or even if some of them are not used during the whole day.
Our analysis gave us different points of view:
•38,775% of the subnets have an average of volume of traffic 3 magnitudes less than the total average of subnetting traffic.
•8,17% of the subnets where not used during the day.
•26.53% of them with an average of 6 magnitudes below total average.
•The most used subnet is the one configured for the Students Dorms, with an average of 3.26401e+09 bytes. Comparing to the 1.0461e+10 average from the total subnet group, we can see that almost all the traffic produced, with a huge difference between this one, and the rest of them.
This might be a possible approach to manage in a better way the Virtual Local Area Networks created by administrator, by for example reducing the properties of the less used ones, as they are taking, not only all the IP adresses configured by DHCP, also there is a port reserved for every of this VLAN´s, so somehow is a misused.Also splitting the most used one into different ones as it might be overused, or aggregating links to it and/or taking into account some quality of service priorization.
57
4.3.1.2 Investment over years
Just by simply comparing the amount of bytes that our network processes in one day, separated by 2 years period we can see how the flow´s average of packet lenght has grown over the years [23] and, therefore there is a need of investing in new equipment.
Comparing both days:
58
Fig. 22: Comparison between two days in two years time(BYTES)
So as said before, we can see that the amount of data sent is higher even the number of flows stays more or less the same. The amount of bytes for a random day of 2015 is 20.25622e+12. Compared to the 14.71669e+12 bytes of 2013 day, a growth of 27,8% approximately, which is a significant value.
59
Fig. 23: Comparison between two days in two years time(FLOWS)
4.3.1.3 Checking huge UDP transfers
As P2P has nowadays a restrictive use due to copyright issues, it is also needed to take into account non-legal file transactions over our network.
For this reason we will check the TopN statistics of UDP protocol produced by users of the dorms of th eCampus, as it is the VLAN that most traffic exchange and also because we speculate that is the place where this situations can come across.
We take two ways to analyze this events:
First one checking the TopN UDP connections that where made not by well-known ports (over 1024). This approach give us next statistics:
Top 10 Src IP Addr ordered by bytes: Date first seen Duration Proto Src IP Addr Flows(%) Packets(%) Bytes(%) pps bps bpp 2013-03-24 06:13:58.620 4380359.260 any 149.156.124.21 3.6e+06(19.8) 125.8e+06(13.0) 36.5e+09(13.6) 28 66654 290 2013-03-24 05:57:59.556 4381309.332 any 149.156.124.3 1.6e+06( 9.0) 69.2e+06( 7.1) 23.0e+09( 8.6) 15 41956 332 2013-03-24 18:04:13.548 4337744.332 any 149.156.124.1 842625( 4.6) 54.5e+06( 5.6) 21.0e+09( 7.8) 12 38692 385 2013-03-24 15:28:23.644 4347094.236 any 149.156.124.11 1.1e+06( 6.0) 63.0e+06( 6.5) 19.9e+09( 7.4) 14 36600 315 2013-03-24 06:04:10.620 4380943.264 any 149.156.124.14 804272( 4.4) 117.8e+06(12.2) 19.7e+09( 7.3) 26 35983 167 2013-03-24 07:08:57.648 4377049.232 any 149.156.124.9 1.3e+06( 6.9) 44.0e+06( 4.5) 17.9e+09( 6.7) 10 32768 407 2013-03-24 07:03:06.640 4377406.244 any 149.156.124.2 2.2e+06(11.9) 79.8e+06( 8.2) 16.5e+09( 6.2) 18 30242 207 2013-03-24 19:23:58.568 4332948.304 any 149.156.124.17 308790( 1.7) 19.8e+06( 2.0) 12.3e+09( 4.6) 4 22672 619 2013-03-24 06:13:00.620 4380415.260 any 149.156.124.13 355195( 1.9) 60.0e+06( 6.2) 11.1e+09( 4.1) 13 20266 185 2013-03-24 06:12:36.604 4380439.276 any 149.156.124.8 1.6e+06( 8.7) 35.4e+06( 3.7) 9.8e+09( 3.7) 8 17988 278
Summary: total flows: 18282426, total bytes: 268.3e+09, total packets: 968.4e+06, avg bps: 489979, avg pps: 221, avg bpp: 277 Time window: 2013-03-24 05:57:59 - 2013-05-13 23:59:57 Total flows processed: 231071700, Blocks skipped: 0, Bytes read: 14788787424 Sys: 61.099s flows/second: 3781872.1 Wall: 99.110s flows/second: 2331463.5
We see that the amount of bpp is between 100-400 bytes, comparing with other cases of study related with P2P flow detection[24] But taking into account the average of bytes per packet fix with P2P behaviour, but due to the nature of this analysis not enough information is taken to check if they are sharing non-legal files.
60
If we try to check the BitTorrent trackers, based on UDP protocol and destination port number 80 we obtain the next statistics:
Top 10 Src IP Addr ordered by bytes: Date first seen Duration Proto Src IP Addr Flows(%) Packets(%) Bytes(%) pps bps bpp 2013-05-13 08:46:36.952 50463.888 any 149.156.124.14 231(21.7) 10219(20.2) 2.3e+06(20.4) 0 359 222 2013-05-13 07:34:47.976 33402.884 any 149.156.124.10 168(15.8) 8400(16.6) 1.9e+06(16.7) 0 446 222 2013-05-13 00:54:37.940 76819.912 any 149.156.124.21 168(15.8) 8400(16.6) 1.9e+06(16.7) 0 194 222 2013-05-13 12:10:57.912 33832.952 any 149.156.124.1 140(13.2) 7000(13.8) 1.6e+06(14.0) 0 367 222 2013-05-13 07:28:35.968 56448.888 any 149.156.124.11 140(13.2) 7000(13.8) 1.6e+06(14.0) 0 220 222 2013-05-13 00:43:02.928 64871.940 any 149.156.124.18 112(10.5) 5600(11.1) 1.2e+06(11.2) 0 153 222 2013-05-13 09:49:33.936 22070.920 any 149.156.124.17 62( 5.8) 2468( 4.9) 447000( 4.0) 0 162 181 2013-05-13 10:12:12.928 32600.928 any 149.156.124.2 33( 3.1) 1412( 2.8) 320432( 2.9) 0 78 226 2013-05-13 01:16:19.948 46942.916 any 149.156.124.8 4( 0.4) 12( 0.0) 7996( 0.1) 0 1 666 2013-05-13 22:36:11.856 109.980 any 149.156.124.9 2( 0.2) 6( 0.0) 4258( 0.0) 0 309 709
Summary: total flows: 1064, total bytes: 11.1e+06, total packets: 50545, avg bps: 1103, avg pps: 0, avg bpp: 220 Time window: 2013-05-13 00:43:02 - 2013-05-13 23:09:24 Total flows processed: 231071700, Blocks skipped: 0, Bytes read: 14788787424 Sys: 52.819s flows/second: 4374758.8 Wall: 82.994s flows/second: 2784166.5
As we can observe, between the fourth and the seventh TopN, the amount of bytes and packets transmitted is the same, what is suspicious, but the amount of data does not seem to fix with the criteria of sharing big files, as movies or other content.
The possibility of recording TCP flags on our flows would make the detection of P2P connections much easier, but it will increase also the amount of data collected.
Due to this the only way for threat detection to optimize in this aspect the network, is by taking care of single IP´s exchanging information with a defined number of hosts, which could be done by inspecting deeply this TopN IP addresses.
But as every IP might contain hundreds or thousands of users, this approach might need using other tools as Deep Packet Inspection (DPI).
61
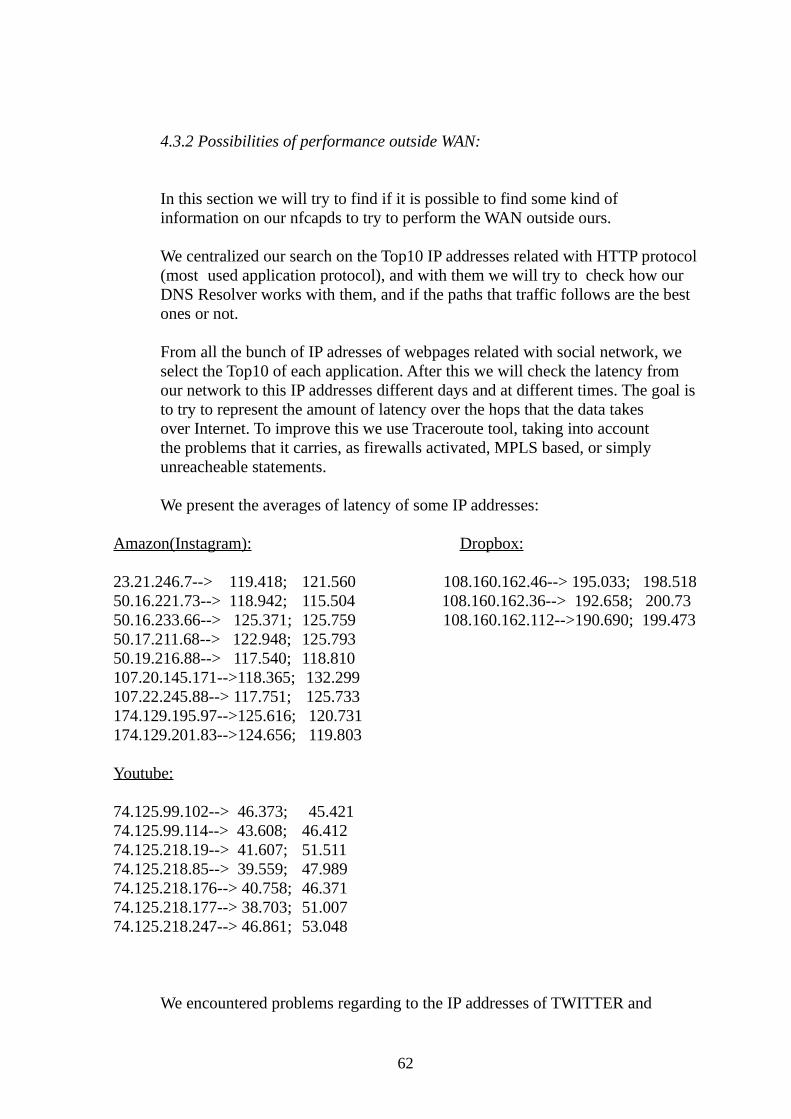
4.3.2 Possibilities of performance outside WAN:
In this section we will try to find if it is possible to find some kind of information on our nfcapds to try to perform the WAN outside ours.
We centralized our search on the Top10 IP addresses related with HTTP protocol (most used application protocol), and with them we will try to check how our DNS Resolver works with them, and if the paths that traffic follows are the best ones or not.
From all the bunch of IP adresses of webpages related with social network, we select the Top10 of each application. After this we will check the latency from our network to this IP addresses different days and at different times. The goal is to try to represent the amount of latency over the hops that the data takes over Internet. To improve this we use Traceroute tool, taking into account the problems that it carries, as firewalls activated, MPLS based, or simply unreacheable statements.
We present the averages of latency of some IP addresses:
We encountered problems regarding to the IP addresses of TWITTER and
62
FACEBOOK and also some of the other webpages. As we can see the latencies
seem to be similar among them, so the step of checking the number of hops seems to be neccesary.Using traceroute tool, the IP addresses which latency could not be checked (as the ones from TWITTER), seem to respond to this tool, but not completely.
The output times that we obtain, are the latency between three packets sent (by default) to the first system or router between our network and the IP address selected.
63
Fig. 24: Latency per hop of different IPs (AMAZON)
As we can see in the graphs (fig.24, fig. 25), knowing that these 10 hops have the same path (after that the traffic seems to get no response back), we can say that the latency perceived on them is not correlated with the option that we took at the beginning for checking the best path. Comparing the figures (fig.24, fig. 25) above, and knowing that the first seven hops of Youtube and Amazon are the same we can say that checking the latency to find the best path seems to be not possible only with the data collected on our flows.
The differences between latencies of same kind of packet sent, reflect that the traffic can experience high latencies over the paths that seem not to be critical, as the first 5 hops until Poznan Pionier provider, so it is not possible to find any advantage over this with our analysis.
64
Fig. 25: Latency per hop of different IPs (AMAZON)
5.Conclusions and future work
5.1 Conclusions
In this thesis we have analyzed whole days of flow-based information recorded inside AGH Campus network to find possibilities of performance over WAN´s.
The data obtained seem to demonstrate that is easier to perform a WAN which is wellknown, as knowing subnets, topology and data collected, not only for security or legal reasons, but also for performing monitoring (or searching) the parts of the network that are misused, such as subnets or, on the other hand overused. Also we can speculate about the amount of information that could be increased throw the years just by analyzing days with long period difference between them.
Regarding the possibilities of optimizing the behaviour of our network with others, it seems to be difficult to search for possibilities of performance improvements due to the heterogenous nature of WANs.After checking the Top10 HTTP IP addresses, the oportunities to find some advantage of such analysis seems to be difficult, as we have checked that the latency experimented outside our network varies randomly in a really short period of time.
5.2 Future work
Future work over presented issues will deal with the possibilities of collecting extra Information Elements, as flags from TCP protocol or related to MPLS, as sometimes the 5-tuple information is not enough for analysis of different kinds of network applications (or services). As a given example, if our flows would have had recorded Autonomous System numbers (AS), our filtering of web services' traffic would have been better. But for this purpose it is needed to configure the AS route table inside our Netflow devices.
Also the possibility of caching and prefetching data on a server inside our campus network from most used applications could be an interesting possibility in the future, as we have seen the amount of HTTP connections related with Google, Youtube or Facebook is notable over the total amount of HTTP traffic. It is importnat to know that this web applications use HTTPS protocol, and due to this, seems to be impossible to cache some of this info on a server.
65
66
References
[1] B. Claise, B. Trammell, and P. Aitken, “Specification of the IP Flow Information Export (IPFIX) protocol for the exchange of flow informa- tion,” RFC 7011 (Internet Standard), Internet Engineering Task Force, Sep. 2013. [Online]. Available: http://www.ietf.org/rfc/rfc7011.txt
[2] European Parliament & Council, Directive 2006/24/EC of the European Parliament and of the Council of 15 March 2006 on the Retention of Data Generated or Processed in Connection With the Provision of Pub- licly Available Electronic Communications Services or of Public Com- munications Networks and Amending Directive 2002/58/EC, Mar. 2006. Available: http://eur-lex.europa.eu/LexUriServ/LexUriServ.do? uri=OJ:L:2006:105:0054:0063:EN:PDF
[3]Rick Hofstede, Pavel Celeda, Brian Trammell, Idilio Drago, Ramin Sadre, Anna Sperotto, and Aiko Pras , “Flow Monitoring Explained: From Packet Capture to Data Analysis With NetFlow and IPFIX ” , in Communications Surveys & Tutorials, IEEE (Volume:16 , Issue: 4 ) , Nov. 2014.https://webmail.uam.es/imp/basic.php?mailbox=SU5CT1g&page=mailbox&newmail=1&mpage=1https://webmail.uam.es/imp/basic.php?mailbox=SU5CT1g&page=mailbox&newmail=1&mpage=1
[4]Cisco IOS NetFlow - White Papers – Cisco: “Introduction to Cisco IOS NetFlow – A Technical Overview”. [Online]. Available: http://www.cisco.com/c/en/us/products/ios-nx-os-software/ios-netflow/white-paper-listing.html
[5] N. Brownlee, “Flow-based measurement: IPFIX development and de- ployment,” IEICE Trans. Commn un., vol. 94, no. 8, pp. 2190–2198, Aug. 2011.
[6] P. Phaal, sFlow Version 5, Jul. 2004http://ieeexplore.ieee.org/xpls/abs_all.jsp?arnumber=6042388&tag=1. [Online]. Available: http://sflow.org/ sflow_version_5.txt
[7] “OpenFlow switch specification,” Palo Alto, CA, USA, Sep. 6, 2012.
[8] C. Yu et al., “FlowSense: Monitoring network utilization with zero mea- surement cost,” in Proc. 14th Int. Conf PAM, vol. 7799, Lecture Notes in Computer Science, 2013, pp. 31–41, Springer Berlin Heidelberg.
[9] A. Lara, A. Kolasani, and B. Ramamurthy, “Network innovation using OpenFlow: A survey,” IEEE Commun. Surveys Tuts., vol. 16, no. 1, pp. 493–512, 2014.
[10] A. Sperotto et al., “An overview of IP flow-based intrusion detection,” IEEE Commun. Surveys Tuts., vol. 12, no. 3, pp. 343–356, 2010.
[11] J. Kögel, “One-way delay measurement based on flow data: Quantifica- tion and compensation of errors by exporter profiling,” in Proc. ICOIN, 2011, pp. 25–30.
[12] Y. Gu, L. Breslau, N. Duffield, and S. Sen, “On passive one-way loss measurements using sampled flow statistics,” 2009.
[13] N. G. Duffield and M. Grossglauser, “Trajectory sampling for direct traffic observation,” IEEE/ACM Trans. Netw., vol. 9, 2001.
[14] T. Zseby, M. Molina, N. Duffield, S. Niccolini, and F. Raspall, “Sampling and filtering techniques for IP packet selection,” RFC 5475 (Proposed Standard), Internet Engineering Task Force, Mar. 2009. [Online]. Avail- able: http://www.ietf.org/rfc/rfc5475.txt
[17] IANA, IP Flow Information Export (IPFIX) Entities, Jun. 2013. [Online]. Available: http://www.iana.org/assignments/ipfix/ipfix.xml
[18] J. Domenech, J. Sahuquillo, J. Gil, and A. Pont, “The Impact of the Web Prefetching Architecture on the Limits of Reducing User’s Perceived Latency,” in Proc. IEEE/WIC/ACM International Conference on Web Intelligence, Dec. 2006, pp. 740 –744.
[19] A. Georgakis and H. Li, “User behavior modeling and content based speculative web page prefetching,” Data Knowl. Eng., vol. 59, pp. 770–788, December 2006.
[20] E. Markatos and C. Chronaki, “A top-10 approach to prefetching on the web,” in Proc. INET, Geneva, Switzerland, 1998.
68
[21] P. Rodriguez, S. Mukherjee, and S. Ramgarajan, “Session level tech- niques for improving web browsing performance on wireless links,” in Proc. 13th international conference on World Wide Web, New York, NY, USA, 2004, pp. 121–130.
[22] R. Chakravorty, A. Clark, and I. Pratt, “Gprsweb: optimizing the web for gprs links,” in Proc. 1st international conference on Mobile systems, applications and services (MobiSys), San Francisco, California, 2003, pp. 317–330.
[23] Lei Qian Brian, E. Carpenter , “A Flow-Based Performance Analysis of TCP and TCP Applications ”, 2011 3rd International Conference on Computer and Network Technology (ICCNT 2011) , [Online], Available: http://ieeexplore.ieee.org/xpl/login.jsp?tp=&arnumber=6506531&url=http%3A%2F%2Fieeexplore.ieee.org%2Fiel7%2F6495635%2F6506523%2F06506531.pdf%3Farnumber%3D6506531
[24]Ahmed Bashir. “Classifying P2P Activities in Netflow Records: A Case Study (BitTorrent & Skype)”,Carleton University Ottawa, Ontario,2012
if [ ! -d $(echo $2"stats/") ]; then mkdir -p $(echo $2"stats/")fi
for i in $(echo $1"nfcapd*") ;do nfdump -r $i -q -o extended|perl -pi -e 's/GRE/J/g'|perl -pi -e 's/\sM/e+06/g'|perl -pi -e 's/\sG/e+09/g' >> $(echo $2"stats/stat_alldumps2_`echo $j`")((j++))done
j=1001for i in $(echo $2"stats/*"); do awk '{ SUM += $11} END { print SUM }' $i >> $(echo $2"bytes_alldumps.txt") awk '{ SUM += $10} END { print SUM }' $i >> $(echo $2"packets_alldumps.txt") awk '{ SUM += $12} END { print SUM }' $i >> $(echo $2"flows_alldumps.txt")((j++))done
if [ ! -d $(echo $2"incoming/stats/") ]; then mkdir -p $(echo $2"incoming/stats/")fi
for i in $(echo $1"nfcapd*") ;do nfdump -r $i -q 'src net 149.156.0.0/16' -o extended|perl -pi -e 's/GRE/J/g'|perl -pi -e 's/\sM/e+06/g'|perl -pi -e 's/\sG/e+09/g' >> $(echo $2"incoming/stats/stat_alldumps2_`echo $j`")((j++))done
j=1001for i in $(echo $2"incoming/stats/*"); do awk '{ SUM += $11} END { print SUM }' $i >> $(echo $2"incoming/bytes_alldumps.txt") awk '{ SUM += $10} END { print SUM }' $i >> $(echo $2"incoming/packets_alldumps.txt") awk '{ SUM += $12} END { print SUM }' $i >> $(echo $2"incoming/flows_alldumps.txt")((j++))done
if [ ! -d $(echo $2"outgoing/stats/") ]; then mkdir -p $(echo $2"outgoing/stats/")fi
for i in $(echo $1"nfcapd*") ;do nfdump -r $i -q 'dst net 149.156.0.0/16' -o extended|perl -pi -e 's/GRE/J/g'|perl -pi -e 's/\sM/e+06/g'|perl -pi -e 's/\sG/e+09/g' >> $(echo $2"outgoing/stats/stat_alldumps2_`echo $j`")((j++))done
j=1001for i in $(echo $2"outgoing/stats/*"); do awk '{ SUM += $11} END { print SUM }' $i >> $(echo $2"outgoing/bytes_alldumps.txt") awk '{ SUM += $10} END { print SUM }' $i >> $(echo $2"outgoing/packets_alldumps.txt") awk '{ SUM += $12} END { print SUM }' $i >> $(echo $2"outgoing/flows_alldumps.txt")((j++))done
if [ ! -d $(echo $2"relatedTCP/HTTP/stats/") ]; then mkdir -p $(echo $2"relatedTCP/HTTP/stats/")
84
fi
for i in $(echo $1"nfcapd*") ;do nfdump -r $i -q '( (proto TCP) ) and (( port 80) or ( port 443))' -o extended|perl -pi -e 's/\sM/e+06/g'|perl -pi -e 's/\sG/e+09/g' >> $(echo $2"relatedTCP/HTTP/stats/stat_HTTPS`echo $j`")((j++))done
for i in $(echo $2"relatedTCP/HTTP/stats/*")do awk '{ SUM += $11} END { print SUM }' $i >> $(echo $2"relatedTCP/HTTP/bytes_HTTPS.txt")
awk '{ SUM += $10} END { print SUM }' $i >> $(echo $2"relatedTCP/HTTP/packets_HTTPS.txt")
awk '{ SUM += $12} END { print SUM }' $i >> $(echo $2"relatedTCP/HTTP/flows_HTTPS.txt")
if [ ! -d $(echo $2"relatedTCP/HTTP2/stats/") ]; then mkdir -p $(echo $2"relatedTCP/HTTP2/stats/")fi
for i in $(echo $1"nfcapd*") ;do nfdump -r $i -q '(src net 149.156.0.0/16 and (proto TCP) ) and ((dst port 80) or ( dst port 443))' -o extended|perl -pi -e 's/\sM/e+06/g'|perl -pi -e 's/\sG/e+09/g' >> $(echo $2"relatedTCP/HTTP2/stats/stat_HTTPS`echo $j`")((j++))done
for i in $(echo $2"relatedTCP/HTTP2/stats/*")do
85
awk '{ SUM += $11} END { print SUM }' $i >> $(echo $2"relatedTCP/HTTP2/bytes_HTTPS.txt")
awk '{ SUM += $10} END { print SUM }' $i >> $(echo $2"relatedTCP/HTTP2/packets_HTTPS.txt")
awk '{ SUM += $12} END { print SUM }' $i >> $(echo $2"relatedTCP/HTTP2/flows_HTTPS.txt")
if [ ! -d $(echo $2"Amazon/stats/") ]; then mkdir -p $(echo $2"Amazon/stats/")fi
for i in /$(echo $1"nfcapd*") ;do nfdump -r $i -q'((src net 149.156.0.0/16) and (net 54.210.0.0/15 or net 54.224.0.0/12 or net 216.137.32.0/19 or net 174.129.0.0/16 or net 54.224.0.0/12 or net 107.20.0.0/14 or net 176.34.0.0/19 or net 54.64.0.0/13 or net 174.129.0.0/16 or net 207.171.160.0/19 or net 72.21.192.0/19 or net 8.18.144.0/24 or net 8.18.145.0/24 or net 203.83.220.0/22 or net 205.251.192.0/18 or net 204.246.160.0/19 or net 54.176.0.0/12 or net 54.160.0.0/12 or net 54.192.0.0/16 or net 54.193.0.0/16 or net 54.194.0.0/15 or net 54.196.0.0/15 or net 54.198.0.0/16 or net 54.199.0.0/16 or net 204.236.128.0/17 or net 199.255.192.0/22 or net 107.20.0.0/14 or net 27.0.0.0/22 or net 87.238.82.0/23 or net 87.238.84.0/23 or net 87.238.80.0/21 or net 87.238.86.0/24 or net 87.238.87.0/24 or net 54.252.0.0/16 or net 46.51.128.0/18 or net 46.51.192.0/20 or net 46.51.224.0/19 or net 23.20.0.0/14 or net 54.230.0.0/15 or net 177.71.128/17 or net 54.224.0.0/12 or net 54.240.0.0/12 or net 54.248.0.0/15 or net 54.244.0.0/16 or net 50.16.0.0/14 or net 50.112.0.0/16 or net 87.238.80.0/21 or net 87.238.82.0/23 or net 87.238.84.0/23 or net 216.182.224.0/20 or net 184.72.0.0/15 or net 54.247.0.0/16 or net 54.72.0.0/13 or net 54.80.0.0/12 or net 54.192.0.0/12 or net 54.208.0.0/15 or net 176.34.0.0/19 or net 176.32.112.0/21 or net 176.32.120.0/22 or net 175.41.192.0/18 or net 54.216.0.0/14 or net 54.220.0.0/15 or net 54.208.0.0/13 or net 54.240.0.0/12 or net 54.224.0.0/12 or net 79.125.0.0/17 or net 103.4.8.0/21 or net 176.32.64.0/19 or net 177.72.240.0/21 or net 99.127.232.0/22 or net 176.32.96.0/21 or net 184.169.128.0/17 or net 177.71.128.0/17 or net 96.127.0.0/17 or net 176.32.104.0/21 or net 178.236.0.0/20 or net 79.125.0.0/17 or net 46.137.0.0/17 or net 103.246.150.0/23 or net 176.32.126.0/23 or net 177.71.192.0/20 or net 185.48.120.0/22 or net 177.72.240.0/21 or net 63.238.12.0/22 or net 122.248.192.0/18 or net 177.71.128.0/17 or net 63.238.16.0/23 or net 79.125.0.0/17 or net 66.7.64.0/19)) and (proto TCP) and (dst port 80 or dst port 443)' -o extended|perl -pi -e 's/\sM/e+06/g'|perl -pi -e 's/\sG/e+09/g'|perl -pi -e 's/0e+09RE/\ J/g' >> $(echo $2"Amazon/stats/stat_TopNWebsearch_Amazon_`echo $j`")((j++))done
92
#FACEBOOK
if [ ! -d $(echo $2"FACEBOOK/stats/") ]; then mkdir -p $(echo $2"FACEBOOK/stats/")fi
for i in /$(echo $1"nfcapd*") ;do nfdump -r $i -q '((src net 149.156.0.0/16) and (net 173.252.64.0/18 or net 31.13.64.0/18 or net 69.171.224.0/19 or net 174.129.0.0/16 or net 66.220.144.0/20 or net 66.220.152.0/21 or net 66.220.159.0/24 or net 69.63.176.0/20 or net 69.63.184.0/21 or net 69.171.224.0/19 or net 69.171.239.0/24 or net 69.171.240.0/20 or net 69.171.255.0/24 or net 74.119.76.0/22 or net 103.4.96.0/22 or net 173.252.64.0/18 or net 173.252.70.0/24 or net 173.252.96.0/19 or net 204.15.20.0/22 or net 31.13.24.0/21 or net 31.13.64.0/18 or net 31.13.64.0/19 or net 31.13.64.0/24 or net 31.13.65.0/24 or net 31.13.66.0/24 or net 31.13.67.0/24 or net 31.13.68.0/24 or net 31.13.69.0/24 or net 31.13.70.0/24 or net 31.13.71.0/24 or net 31.13.72.0/24 or net 31.13.73.0/24 or net 31.13.74.0/24 or net 31.13.75.0/24 or net 31.13.76.0/24 or net 31.13.77.0/24 or net 31.13.96.0/19 or ip 145.47.125.105 or ip 145.47.130.161 or ip 145.47.134.248 or ip 145.47.174.78 or ip 145.47.174.87 or ip 145.47.21.135 or ip 145.47.21.78 or ip 145.47.233.105 or ip 145.47.245.84 or dst ip 145.47.250.14 or ip 145.47.73.228 or ip 145.47.80.105 or ip 2.17.15.139 or ip 2.18.143.139 or ip 2.18.47.139 or ip 2.19.242.110 or ip 2.19.255.139 or ip 49.77.203.78 or ip 49.77.203.87 or ip 49.77.234.222 or ip 49.77.239.78 or ip 49.77.239.87 or ip 75.69.0.106 or ip 75.69.0.115 or ip 75.69.0.216 or ip 75.69.0.226 or ip 75.69.0.248 or ip 75.69.0.35 or ip 75.69.0.56 or ip 75.69.0.63 or ip 75.69.120.105 or ip 75.69.120.219 or ip 75.69.120.56 or ip 75.69.182.219 or ip 75.69.247.106 or ip 75.69.247.19 or ip 75.69.247.57 or ip 75.69.247.63 or ip 75.69.247.79 or ip 75.69.45.106 or ip 75.69.45.248 or ip 75.69.45.56 or ip 75.69.45.63 or ip 75.69.8.63 or ip 92.123.111.139 or ip 92.123.151.139 or ip 92.123.199.139 or ip 92.123.31.139 or ip 95.100.15.139 or ip 95.100.223.139 or ip 95.100.249.113 or ip 95.100.249.130 or ip 95.100.249.97 or ip 95.100.255.32 or ip 95.100.63.139 or ip 95.100.97.200)) and (proto TCP) and ((dst port 80) or (dst port 443))' -o extended|perl -pi -e 's/\sM/e+06/g'|perl -pi -e 's/\sG/e+09/g'|perl -pi -e 's/0e+09RE/\ J/g' >> $(echo $2"FACEBOOK/stats/stat_TopNWebSearch_FACEBOOK`echo $j`")((j++))done
#TWITTER
if [ ! -d $(echo $2"TWITTER/stats/") ]; then mkdir -p $(echo $2"TWITTER/stats/")fi
for i in /$(echo $1"nfcapd*") ;do nfdump -r $i -q '((src net 149.156.0.0/16) and (net 199.59.148.0/22 or net 199.96.56.0/21 or net 8.25.196.0/23 or net
93
8.25.194.0/23 or net 199.16.156.0/22 or net 103.252.112.0/22 or net 192.133.76.0/22) and (proto TCP) and (dst port 80) or (dst port 443))' -o extended|perl -pi -e 's/\sM/e+06/g'|perl -pi -e 's/\sG/e+09/g'|perl -pi -e 's/0e+09RE/\ J/g' >> $(echo $2"TWITTER/stats/stat_TopNWebSearch_DROPBOX`echo $j`")((j++))done
#YOUTUBE
if [ ! -d $(echo $2"YOUTUBE/stats/") ]; then mkdir -p $(echo $2"YOUTUBE/stats")fi
for i in /$(echo $1"nfcapd*") ;do nfdump -r $i -q '((src net 149.156.0.0/16) and (ip 74.125.132.118 or ip 74.125.132.93 or ip 74.125.136.101 or ip 74.125.136.102 or ip 74.125.136.138 or ip 74.125.136.139 or ip 74.125.216.112 or ip 74.125.216.113 or ip 74.125.216.114 or ip 74.125.216.117 or ip 74.125.216.145 or ip 74.125.216.146 or ip 74.125.216.147 or ip 74.125.216.148 or ip 74.125.216.150 or ip 74.125.216.178 or ip 74.125.216.179 or ip 74.125.216.17 or ip 74.125.216.181 or ip 74.125.216.182 or ip 74.125.216.183 or ip 74.125.216.208 or ip 74.125.216.20 or ip 74.125.216.210 or ip 74.125.216.211 or ip 74.125.216.212 or ip 74.125.216.213 or ip 74.125.216.214 or ip 74.125.216.215 or ip 74.125.216.23 or ip 74.125.216.240 or ip 74.125.216.241 or ip 74.125.216.242 or ip 74.125.216.243 or ip 74.125.216.244 or ip 74.125.216.245 or ip 74.125.216.246 or ip 74.125.216.48 or ip 74.125.216.50 or ip 74.125.216.55 or ip 74.125.216.80 or ip 74.125.216.81 or ip 74.125.216.82 or ip 74.125.216.83 or ip 74.125.216.87 or ip 74.125.218.112 or ip 74.125.218.113 or ip 074.125.218.114 or ip 74.125.218.115 or ip 74.125.218.116 or ip 74.125.218.117 or ip 74.125.218.118 or ip 74.125.218.119 or ip 74.125.218.144 or ip 74.125.218.145 or ip 74.125.218.146 or ip 74.125.218.147 or ip 74.125.218.148 or ip 74.125.218.149 or ip 74.125.218.150 or ip 74.125.218.151 or ip 74.125.218.16 or ip 74.125.218.176 or ip 74.125.218.177 or ip 74.125.218.178 or ip 74.125.218.179 or ip 74.125.218.17 or ip 74.125.218.180 or ip 74.125.218.181 or ip 74.125.218.182 or ip 74.125.218.183 or ip 74.125.218.18 or ip 74.125.218.19 or ip 74.125.218.208 or ip 74.125.218.209 or ip 74.125.218.210 or ip 74.125.218.211 or ip 74.125.218.212 or ip 74.125.218.213 or ip 74.125.218.214 or ip 74.125.218.215 or ip 74.125.218.21 or ip 74.125.218.22 or ip 74.125.218.23 or ip 74.125.218.240 or ip 74.125.218.241 or ip 74.125.218.242 or ip 74.125.218.243 or ip 74.125.218.244 or ip 74.125.218.245 or ip 74.125.218.246 or ip 74.125.218.247 or ip 74.125.218.48 or ip 74.125.218.49 or ip 74.125.218.50 or ip 74.125.218.51 or ip 74.125.218.52 or ip 74.125.218.53 or ip 74.125.218.54 or ip 74.125.218.55 or ip 74.125.218.81 or ip 74.125.218.82 or ip 74.125.218.83 or ip 74.125.218.84 or ip 74.125.218.85 or ip 74.125.218.86 or ip 74.125.218.87 or ip 74.125.232.128 or ip 74.125.232.129 or ip 74.125.232.130 or ip 74.125.232.131 or ip 74.125.232.137 or ip 74.125.99.102 or ip 74.125.99.103 or ip 74.125.99.104 or ip 74.125.99.105 or ip 74.125.99.106 or ip 74.125.99.107 or ip 74.125.99.108 or ip
94
74.125.99.109 or ip 74.125.99.110 or ip 74.125.99.111 or ip 74.125.99.112 or ip 74.125.99.113 or ip 74.125.99.114 or ip 74.125.99.115 or ip 74.125.99.116 or ip 74.125.99.117 or ip 74.125.99.118 or ip 74.125.99.119 or ip 74.125.99.120 or ip 74.125.99.121 or ip 74.125.99.70 or ip 74.125.99.71 or ip 74.125.99.72 or ip 74.125.99.73 or ip 74.125.99.74 or ip 74.125.99.75 or ip 74.125.99.76 or ip 74.125.99.77 or ip 74.125.99.78 or ip 74.125.99.79 or ip 74.125.99.80 or ip 74.125.99.81 or ip 74.125.99.82 or ip 74.125.99.83 or ip 74.125.99.84 or ip 74.125.99.85 or ip 74.125.99.86 or ip 74.125.99.87 or ip 74.125.99.88 or ip 74.125.99.89 or ip 74.125.99.74 or ip 74.125.99.75 or ip 74.125.99.76 or ip 74.125.99.77 or ip 74.125.99.78 or ip 74.125.99.79 or ip 74.125.99.80 or ip 74.125.99.81 or ip 74.125.99.82 or ip 74.125.99.83 or ip 74.125.99.84 or ip 74.125.99.85 or ip 74.125.99.86 or ip 74.125.99.87 or ip 74.125.99.88 or ip 74.125.99.89 or ip 212.191.227.80 or ip 212.191.227.110 or ip 212.191.227.121 or ip 212.191.227.112 or ip 212.191.227.113 or ip 212.191.227.123 or ip 212.191.227.88 or ip 212.191.227.106 or ip 212.191.227.102 or ip 212.191.227.99 or ip 212.191.227.91 or ip 212.191.227.90 or ip 212.191.227.95 or ip 212.191.227.117 or ip 212.191.227.101) and (proto TCP) and ((dst port 80) or (dst port 443)))' -o extended|perl -pi -e 's/\sM/e+06/g'|perl -pi -e 's/\sG/e+09/g'|perl -pi -e 's/0e+09RE/\ J/g' >> $(echo $2"YOUTUBE/stats/stat_YOUTUBE`echo $j`")((j++))done
#DROPBOX
if [ ! -d $(echo $2"DROPBOX/stats/") ]; then mkdir -p $(echo $2"DROPBOX/stats")fi
for i in /$(echo $1"nfcapd*") ;do nfdump -r $i -q '((src net 149.156.0.0/16) and (net 108.160.160.0/20 or net 199.47.216.0/22 or net 205.189.0.0/24) and (proto TCP) and ((dst port 80) or (dst port 443)))' -o extended|perl -pi -e 's/\sM/e+06/g'|perl -pi -e 's/\sG/e+09/g'|perl -pi -e 's/0e+09RE/\ J/g' >> $(echo $2"DROPBOX/stats/stat_DROPBOX_`echo $j`")((j++))done
95
9. topNhttp.sh
#!/bin/bashj=1001
#TOPN SUBNET SENDING TRAFFIC :
if [ ! -d $(echo $2"TopNhttp/stats/") ]; then mkdir -p $(echo $2"TopNhttp/stats/")fi
for i in /$(echo $1"nfcapd*") ;do nfdump -R /home/pablo/Escritorio/2013-05-13/nfcapd.201305130000:nfcapd.201305132355 -n 10 -s dstip/bytes '((src net 149.156.0.0/16) and (proto TCP) and (dst port 80 or dst port 443) )' -o extended |perl -pi -e 's/\sM/e+06/g'|perl -pi -e 's/\sG/e+09/g' >> $(echo $2"TopNhttp/stats/stat_TopNhttp`echo $j`")((j++))done
96
10. topNsubnets.sh
#!/bin/bashj=1001
#TOPN SUBNET SENDING TRAFFIC :
if [ ! -d $(echo $2"TopNsubnetsSending/stats/") ]; then mkdir -p $(echo $2"TopNsubnetsSending/stats/")fi
for i in /$(echo $1"nfcapd*") ;do nfdump -r $i -q 'src net 149.156.0.0/16 ' -o extended -s ip/bps/pps|perl -pi -e 's/\sM/e+06/g'|perl -pi -e 's/\sG/e+09/g' >> $(echo $2"TopNsubnetsSending/stats/stat_TopNsubnets`echo $j`")((j++))done
for i in $(echo $2"TopNsubnetsSending/stats/*")do awk '{ SUM += $11} END { print SUM }' $i >> $(echo $2"TopNsubnetsSending/bytes_TopNsubnetsSending.txt")
awk '{ SUM += $10} END { print SUM }' $i >> $(echo $2"TopNsubnetsSending/packets_TopNsubnetsSending.txt")
awk '{ SUM += $12} END { print SUM }' $i >> $(echo $2"TopNsubnetsSending/flows_TopNsubnetsSending.txt")
if [ ! -d $(echo $2"TopNsubnetsReceiving/stats/") ]; then mkdir -p $(echo $2"TopNsubnetsReceiving/stats/")fi
for i in /$(echo $1"nfcapd*") ;do nfdump -r $i -q 'dst net 149.156.0.0/16 ' -o extended -s ip/bps/pps|perl -pi -e 's/\sM/e+06/g'|perl -pi -e 's/\sG/e+09/g' >> $(echo $2"TopNsubnetsReceiving/stats/stat_TopNsubnetsReceiving`echo $j`")((j++))
97
done
for i in $(echo $2"TopNsubnetsReceiving/stats/*")do awk '{ SUM += $11} END { print SUM }' $i >> $(echo $2"TopNsubnetsReceiving/bytes_TopNsubnetsReceiving.txt")
awk '{ SUM += $10} END { print SUM }' $i >> $(echo $2"TopNsubnetsReceiving/packets_TopNsubnetsReceiving.txt")
awk '{ SUM += $12} END { print SUM }' $i >> $(echo $2"TopNsubnetsReceiving/flows_TopNsubnetsReceiving.txt")
done
98
11. topNwebSearch.sh
#!/bin/bash
#AMAZON (INSTAGRAM)
if [ ! -d $(echo $2"Amazon/stats/") ]; then mkdir -p $(echo $2"Amazon/stats/")fi
nfdump -R /home/pablo/Escritorio/2013-05-13/nfcapd.201305130000:nfcapd.201305132355 -n 10 -s dstip/bytes -o extended '((src net 149.156.0.0/16) and (net 54.210.0.0/15 or net 54.224.0.0/12 or net 216.137.32.0/19 or net 174.129.0.0/16 or net 54.224.0.0/12 or net 107.20.0.0/14 or net 176.34.0.0/19 or net 54.64.0.0/13 or net 174.129.0.0/16 or net 207.171.160.0/19 or net 72.21.192.0/19 or net 8.18.144.0/24 or net 8.18.145.0/24 or net 203.83.220.0/22 or net 205.251.192.0/18 or net 204.246.160.0/19 or net 54.176.0.0/12 or net 54.160.0.0/12 or net 54.192.0.0/16 or net 54.193.0.0/16 or net 54.194.0.0/15 or net 54.196.0.0/15 or net 54.198.0.0/16 or net 54.199.0.0/16 or net 204.236.128.0/17 or net 199.255.192.0/22 or net 107.20.0.0/14 or net 27.0.0.0/22 or net 87.238.82.0/23 or net 87.238.84.0/23 or net 87.238.80.0/21 or net 87.238.86.0/24 or net 87.238.87.0/24 or net 54.252.0.0/16 or net 46.51.128.0/18 or net 46.51.192.0/20 or net 46.51.224.0/19 or net 23.20.0.0/14 or net 54.230.0.0/15 or net 177.71.128/17 or net 54.224.0.0/12 or net 54.240.0.0/12 or net 54.248.0.0/15 or net 54.244.0.0/16 or net 50.16.0.0/14 or net 50.112.0.0/16 or net 87.238.80.0/21 or net 87.238.82.0/23 or net 87.238.84.0/23 or net 216.182.224.0/20 or net 184.72.0.0/15 or net 54.247.0.0/16 or net 54.72.0.0/13 or net 54.80.0.0/12 or net 54.192.0.0/12 or net 54.208.0.0/15 or net 176.34.0.0/19 or net 176.32.112.0/21 or net 176.32.120.0/22 or net 175.41.192.0/18 or net 54.216.0.0/14 or net 54.220.0.0/15 or net 54.208.0.0/13 or net 54.240.0.0/12 or net 54.224.0.0/12 or net 79.125.0.0/17 or net 103.4.8.0/21 or net 176.32.64.0/19 or net 177.72.240.0/21 or net 99.127.232.0/22 or net 176.32.96.0/21 or net 184.169.128.0/17 or net 177.71.128.0/17 or net 96.127.0.0/17 or net 176.32.104.0/21 or net 178.236.0.0/20 or net 79.125.0.0/17 or net 46.137.0.0/17 or net 103.246.150.0/23 or net 176.32.126.0/23 or net 177.71.192.0/20 or net 185.48.120.0/22 or net 177.72.240.0/21 or net 63.238.12.0/22 or net 122.248.192.0/18 or net 177.71.128.0/17 or net 63.238.16.0/23 or net 79.125.0.0/17 or net 66.7.64.0/19)) and (proto TCP) and (dst port 80 or dst port 443)' -o extended|perl -pi -e 's/\sM/e+06/g'|perl -pi -e 's/\sG/e+09/g'|perl -pi -e 's/0e+09RE/\ J/g' >> $(echo $2"Amazon/stats/stat_TopNWebsearch_Amazon_`echo $j`")
#FACEBOOK
99
if [ ! -d $(echo $2"FACEBOOK/stats/") ]; then mkdir -p $(echo $2"FACEBOOK/stats/")fi
nfdump -R /home/pablo/Escritorio/2013-05-13/nfcapd.201305130000:nfcapd.201305132355 -n 10 -s dstip/bytes -q '((src net 149.156.0.0/16) and (net 173.252.64.0/18 or net 31.13.64.0/18 or net 69.171.224.0/19 or net 174.129.0.0/16 or net 66.220.144.0/20 or net 66.220.152.0/21 or net 66.220.159.0/24 or net 69.63.176.0/20 or net 69.63.184.0/21 or net 69.171.239.0/24 or net 69.171.240.0/20 or net 69.171.255.0/24 or net 74.119.76.0/22 or net 103.4.96.0/22 or net 173.252.64.0/18 or net 173.252.70.0/24 or net 173.252.96.0/19 or net 204.15.20.0/22 or net 31.13.24.0/21 or net 31.13.64.0/18 or net 31.13.64.0/19 or net 31.13.64.0/24 or net 31.13.65.0/24 or net 31.13.66.0/24 or net 31.13.67.0/24 or net 31.13.68.0/24 or net 31.13.69.0/24 or net 31.13.70.0/24 or net 31.13.71.0/24 or net 31.13.72.0/24 or net 31.13.73.0/24 or net 31.13.74.0/24 or net 31.13.75.0/24 or net 31.13.76.0/24 or net 31.13.77.0/24 or net 31.13.96.0/19 or ip 145.47.125.105 or ip 145.47.130.161 or ip 145.47.134.248 or ip 145.47.174.78 or ip 145.47.174.87 or ip 145.47.21.135 or ip 145.47.21.78 or ip 145.47.233.105 or ip 145.47.245.84 or dst ip 145.47.250.14 or ip 145.47.73.228 or ip 145.47.80.105 or ip 2.17.15.139 or ip 2.18.143.139 or ip 2.18.47.139 or ip 2.19.242.110 or ip 2.19.255.139 or ip 49.77.203.78 or ip 49.77.203.87 or ip 49.77.234.222 or ip 49.77.239.78 or ip 49.77.239.87 or ip 75.69.0.106 or ip 75.69.0.115 or ip 75.69.0.216 or ip 75.69.0.226 or ip 75.69.0.248 or ip 75.69.0.35 or ip 75.69.0.56 or ip 75.69.0.63 or ip 75.69.120.105 or ip 75.69.120.219 or ip 75.69.120.56 or ip 75.69.182.219 or ip 75.69.247.106 or ip 75.69.247.19 or ip 75.69.247.57 or ip 75.69.247.63 or ip 75.69.247.79 or ip 75.69.45.106 or ip 75.69.45.248 or ip 75.69.45.56 or ip 75.69.45.63 or ip 75.69.8.63 or ip 92.123.111.139 or ip 92.123.151.139 or ip 92.123.199.139 or ip 92.123.31.139 or ip 95.100.15.139 or ip 95.100.223.139 or ip 95.100.249.113 or ip 95.100.249.130 or ip 95.100.249.97 or ip 95.100.255.32 or ip 95.100.63.139 or ip 95.100.97.200)) and (proto TCP) and ((dst port 80) or (dst port 443))' -o extended|perl -pi -e 's/\sM/e+06/g'|perl -pi -e 's/\sG/e+09/g'|perl -pi -e 's/0e+09RE/\ J/g' >> $(echo $2"FACEBOOK/stats/stat_TopNWebSearch_FACEBOOK`echo $j`")
#TWITTER
if [ ! -d $(echo $2"TWITTER/stats/") ]; then mkdir -p $(echo $2"TWITTER/stats/")fi
nfdump -R /home/pablo/Escritorio/2013-05-13/nfcapd.201305130000:nfcapd.201305132355 -n 10 -s dstip/bytes -q '((src net 149.156.0.0/16) and (net 199.59.148.0/22 or net 199.96.56.0/21 or net 199.16.156.0/22 or net 103.252.112.0/22 or net 192.133.76.0/22) and (proto TCP) and (dst port 80) or (dst port 443))' -o extended|perl -pi -e 's/\sM/e+06/g'|perl -pi -e 's/\sG/e+09/g'|perl -pi -e 's/0e+09RE/\ J/g' >> $(echo $2"TWITTER/stats/stat_TopNWebSearch_DROPBOX`echo $j`")
100
#YOUTUBE
if [ ! -d $(echo $2"YOUTUBE/stats/") ]; then mkdir -p $(echo $2"YOUTUBE/stats")fi
nfdump -R /home/pablo/Escritorio/2013-05-13/nfcapd.201305130000:nfcapd.201305132355 -n 10 -s dstip/bytes -q '((src net 149.156.0.0/16) and (ip 74.125.132.118 or ip 74.125.132.93 or ip 74.125.136.101 or ip 74.125.136.102 or ip 74.125.136.138 or ip 74.125.136.139 or ip 74.125.216.112 or ip 74.125.216.113 or ip 74.125.216.114 or ip 74.125.216.117 or ip 74.125.216.145 or ip 74.125.216.146 or ip 74.125.216.147 or ip 74.125.216.148 or ip 74.125.216.150 or ip 74.125.216.178 or ip 74.125.216.179 or ip 74.125.216.17 or ip 74.125.216.181 or ip 74.125.216.182 or ip 74.125.216.183 or ip 74.125.216.208 or ip 74.125.216.20 or ip 74.125.216.210 or ip 74.125.216.211 or ip 74.125.216.212 or ip 74.125.216.213 or ip 74.125.216.214 or ip 74.125.216.215 or ip 74.125.216.23 or ip 74.125.216.240 or ip 74.125.216.241 or ip 74.125.216.242 or ip 74.125.216.243 or ip 74.125.216.244 or ip 74.125.216.245 or ip 74.125.216.246 or ip 74.125.216.48 or ip 74.125.216.50 or ip 74.125.216.55 or ip 74.125.216.80 or ip 74.125.216.81 or ip 74.125.216.82 or ip 74.125.216.83 or ip 74.125.216.87 or ip 74.125.218.112 or ip 74.125.218.113 or ip 074.125.218.114 or ip 74.125.218.115 or ip 74.125.218.116 or ip 74.125.218.117 or ip 74.125.218.118 or ip 74.125.218.119 or ip 74.125.218.144 or ip 74.125.218.145 or ip 74.125.218.146 or ip 74.125.218.147 or ip 74.125.218.148 or ip 74.125.218.149 or ip 74.125.218.150 or ip 74.125.218.151 or ip 74.125.218.16 or ip 74.125.218.176 or ip 74.125.218.177 or ip 74.125.218.178 or ip 74.125.218.179 or ip 74.125.218.17 or ip 74.125.218.180 or ip 74.125.218.181 or ip 74.125.218.182 or ip 74.125.218.183 or ip 74.125.218.18 or ip 74.125.218.19 or ip 74.125.218.208 or ip 74.125.218.209 or ip 74.125.218.210 or ip 74.125.218.211 or ip 74.125.218.212 or ip 74.125.218.213 or ip 74.125.218.214 or ip 74.125.218.215 or ip 74.125.218.21 or ip 74.125.218.22 or ip 74.125.218.23 or ip 74.125.218.240 or ip 74.125.218.241 or ip 74.125.218.242 or ip 74.125.218.243 or ip 74.125.218.244 or ip 74.125.218.245 or ip 74.125.218.246 or ip 74.125.218.247 or ip 74.125.218.48 or ip 74.125.218.49 or ip 74.125.218.50 or ip 74.125.218.51 or ip 74.125.218.52 or ip 74.125.218.53 or ip 74.125.218.54 or ip 74.125.218.55 or ip 74.125.218.81 or ip 74.125.218.82 or ip 74.125.218.83 or ip 74.125.218.84 or ip 74.125.218.85 or ip 74.125.218.86 or ip 74.125.218.87 or ip 74.125.232.128 or ip 74.125.232.129 or ip 74.125.232.130 or ip 74.125.232.131 or ip 74.125.232.137 or ip 74.125.99.102 or ip 74.125.99.103 or ip 74.125.99.104 or ip 74.125.99.105 or ip 74.125.99.106 or ip 74.125.99.107 or ip 74.125.99.108 or ip 74.125.99.109 or ip 74.125.99.110 or ip 74.125.99.111 or ip 74.125.99.112 or ip 74.125.99.113 or ip 74.125.99.114 or ip 74.125.99.115 or ip 74.125.99.116 or ip 74.125.99.117 or ip 74.125.99.118 or ip 74.125.99.119 or ip 74.125.99.120 or ip 74.125.99.121 or ip 74.125.99.70 or ip 74.125.99.71 or ip 74.125.99.72 or ip 74.125.99.73 or ip 74.125.99.74 or ip 74.125.99.75 or ip 74.125.99.76 or ip 74.125.99.77 or ip 74.125.99.78 or ip 74.125.99.79 or ip 74.125.99.80 or ip 74.125.99.81 or ip 74.125.99.82 or ip
101
74.125.99.83 or ip 74.125.99.84 or ip 74.125.99.85 or ip 74.125.99.86 or ip 74.125.99.87 or ip 74.125.99.88 or ip 74.125.99.89 or ip 74.125.99.74 or ip 74.125.99.75 or ip 74.125.99.76 or ip 74.125.99.77 or ip 74.125.99.78 or ip 74.125.99.79 or ip 74.125.99.80 or ip 74.125.99.81 or ip 74.125.99.82 or ip 74.125.99.83 or ip 74.125.99.84 or ip 74.125.99.85 or ip 74.125.99.86 or ip 74.125.99.87 or ip 74.125.99.88 or ip 74.125.99.89 or ip 212.191.227.80 or ip 212.191.227.110 or ip 212.191.227.121 or ip 212.191.227.112 or ip 212.191.227.113 or ip 212.191.227.123 or ip 212.191.227.88 or ip 212.191.227.106 or ip 212.191.227.102 or ip 212.191.227.99 or ip 212.191.227.91 or ip 212.191.227.90 or ip 212.191.227.95 or ip 212.191.227.117 or ip 212.191.227.101) and (proto TCP) and ((dst port 80) or (dst port 443)))' -o extended|perl -pi -e 's/\sM/e+06/g'|perl -pi -e 's/\sG/e+09/g'|perl -pi -e 's/0e+09RE/\ J/g' >> $(echo $2"YOUTUBE/stats/stat_YOUTUBE`echo $j`")
#DROPBOX
if [ ! -d $(echo $2"DROPBOX/stats/") ]; then mkdir -p $(echo $2"DROPBOX/stats")fi
nfdump -R /home/pablo/Escritorio/2013-05-13/nfcapd.201305130000:nfcapd.201305132355 -n 10 -s dstip/bytes -q '((src net 149.156.0.0/16) and (net 108.160.160.0/20 or net 199.47.216.0/22 or net 205.189.0.0/24) and (proto TCP) and ((dst port 80) or (dst port 443)))' -o extended|perl -pi -e 's/\sM/e+06/g'|perl -pi -e 's/\sG/e+09/g'|perl -pi -e 's/0e+09RE/\ J/g' >> $(echo $2"DROPBOX/stats/stat_DROPBOX_`echo $j`")
102
12. p2p.sh
#!/bin/bashj=1001
if [ ! -d $(echo $2"P2Pservices/P2P/stats") ]; then mkdir -p $(echo $2"P2Pservices/P2P/stats")fi
#P2P
for i in /$(echo $1"nfcapd*") ;do nfdump -R /home/pablo/Escritorio/2013-05-13/nfcapd.201305130000:nfcapd.201305132355 -n 10 -s srcip/bytes '(src net 149.156.124.0/24 and (proto UDP) and dst port 80 and bytes>1500)' -o extended|perl -pi -e 's/\sM/e+06/g'|perl -pi -e 's/\sG/e+09/g' >> $(echo $2"P2Pservices/P2P/stats/stat_P2P`echo $j`")((j++))done
for i in $(echo $2"P2Pservices/P2P/stats/*")do awk '{ SUM += $11} END { print SUM }' $i >> $(echo $2"P2Pservices/P2P/bytes_P2P.txt")
awk '{ SUM += $10} END { print SUM }' $i >> $(echo $2"P2Pservices/P2P/packets_P2P.txt")
awk '{ SUM += $12} END { print SUM }' $i >> $(echo $2"P2Pservices/P2P/flows_P2P.txt")
done
13. subnets.sh
#!/bin/bashj=1001
#SUBNET VLAN30:
if [ ! -d $(echo $2"VLAN30/stats/") ]; then mkdir -p $(echo $2"VLAN30/stats/")fi
for i in /$(echo $1"nfcapd*") ;do nfdump -r $i -q 'src net 149.156.30.0/24' -o extended|perl -pi -e 's/\sM/e+06/g'|perl -pi -e 's/\sG/e+09/g' >> $(echo $2"VLAN30/stats/stat_VLAN30`echo $j`")
103
((j++))done
for i in $(echo $2"VLAN30/stats/*")do awk '{ SUM += $11} END { print SUM }' $i >> $(echo $2"VLAN30/bytes_VLAN30.txt")
awk '{ SUM += $10} END { print SUM }' $i >> $(echo $2"VLAN30/packets_VLAN30.txt")
awk '{ SUM += $12} END { print SUM }' $i >> $(echo $2"VLAN30/flows_VLAN30.txt")
*This last code (subnets.sh) was replied for every subnet on our network.
104
ANEXO 1
1.Introducción
1.1 Motivación
Hoy en día, el uso de Internet es de algún modo esencial en el día a día de los seres humanos.Internet puede ser considerado como la red de área extensa (WAN) por excelencia, compuesta por redes de area extensa que a su vez pueden estar formadas por redes de área local (LAN).
La sostenibilidad, el rápido crecimiento, el incremento de la competitividad económica , y la proliferación de nuevas aplicaciones se han combinado para cambiar el carácter de Internet en los últimos años. La resolución de problemas y el análisis de rendimiento de las aplicaciones utilizadas sobre redes de área extensa es un negocio en evolución. Muchos productos y servicios se encuentran hoy en día en el mercado para solventar las necesidades de las compañías de red de área extensa. Estas compañías invierten mucho dinero en mejorar y mantener una red efectiva y eficiente.
La medición del tráfico de Internet ha sido un tema de interés desde que existe. Un número elevado de estudios han sido publicados a lo largo de los años a la vez que Internet ha ido evolucionando desde el proyecto ARPANET hasta el entorno comercial multiservicio que realmente es ahora.
Mientras que las técnicas de clasificación del tráfico están mejorando en eficiencia y precisión, la clasificación de este tráfico sigue siendo un un problema debido a la continua proliferación de distintos comportamientos de diferentes aplicaciones de Internet, agravadas más adelante por determinadas aplicaciones encargadas de camuflar este tráfico para evitar ser filtrado o bloqueado.
El análisis del tráfico basado en captura de paquetes muestra sus limitaciones comparandolo con el basado en registros entendiendo lo que un registro es, “A network flow is defined as an unidirectional sequence of packets between given source and destination end points”, además de que la captura de paquetes en redes de alta velocidad requiere hardware caro e infraestructuras que resultan esenciales.Esta alta necesidad de recursos extra en redes de alta velocidad es sólo la primera ventaja en comparación con la captura de paquetes.
105
Esta muy extendido y conformado debido a su integración en sistemas de reenvío de paquetes (en torno al 70% de las compañías de redes comerciales y de investigación tienen equipos que soportan la exportación y recolección de registros).
Proporciona una reducción significativa de datos (en torno a 1/2000 del volumen original). Además la exportación de los registros no es tan sensible por considerar las cabeceras de los paquetes.
Mediante el uso del bien conocido analizador de registros Netflow, debido a sus capacidades internas de monitorización proveninetes de los routers de Cisco, creamos este analisis, necesario para acercarse al objetivo de mejorar la red.
1.2 Objetivos
El principal objetivo de este proyecto es el de buscar posibilidades de optimización de redes de área extensa mediante los registros proporcionados por Netflow, realizando un analisis previo del uso de esta red, y comprendiendo como se transmite el trafico por esta red y estudiando los posibles caminos que puedan reducir el uso de las conexiones de las redes de área extensa.
En este proyecto, presentamos un análisis profundo basado en las medidas del tráfico recogidas en el colector del campus de la AGH. Caracterizamos el tráfico a lo largo de una escala de 24 horas, en terminos de volumen de tráfico, de volumen de registros, de duración de estos, y composición del tráfico con respecto a los protocolos IP, a nivel de transporte y de aplicación, y caracterizamos este tráfico mediante una herramienta OpenSource denominada nfdump, para realizar los filtros de los protocolos de aplicación y para obtener la información necesaria en la busqueda de las posibilidades de optimización.
1.3 Organización del Proyecto
Este proyecto esta dividido en diferentes partes:
– Para empezar, tra la introducciión, el estado del arte será presentado, realizando una lectura profunda de los estudios relacionados con este proyecto, así como Reuest for Comments y otros documentos importantes relacionados, haciendo mayor incapié en aquellos que profundicen en el tema de monitorización basada en registros.
– Despues de esto, el diseño del proyecto será explicado.
– El desarrollo del proyecto será estudiado a continuación. En este punto, mediante el uso de los registros Netflow recolectados, junto con
106
determinados scripts, prepararemos la herrmienta para filtrar la información deseada, y obtener una mejor visión local y global del uso de nuestra red, otorgandonos una visión más especifica de la red en la que estamos trabajando (campus universitario).
– Una vez conocido el comportamiento de niuestra red con el resto (conociendo top-tañkers, puertos y subredes más usadas, o hosts más solicitados) intentaremos obtener alguna información que nos permita mejorar el funcionamiento de las redes de área extensa, dividiendo las posibilidades entre redes conocidas, como el campus y las redes que lo componen, y redes fuera de nuestro alcance.
– Este proyecto concluirá exponiendo la mejor forma (o formas) de optimizar la red, a su vez, documentando de manera breve los posibles trabajos futuros directamente realcionados.
107
108
ANEXO 2
5.1. Conclusión
En este proyecto hemos analizado días enteros de información basada en flujos, recolectada en la red del campus de la Universidad AGH con el fin de encontrar posibilidades de optimización a nivel de WAN.
Los datos obtenidos parecen demostrar que resulta mucho más sencillo optimizar una red que resulta conocida topológicamente, a nivel de subredes e información recogida, no sólo por temas de seguridad y legales, sino también para posibilitar la optimización de posibles partes de la red que estén utilizando más recursos, o por el contrario, aquellas que no estén siendo usadas.
Con respecto al comportamiento de nuestra red (AGH campus) con el resto de WAN, parece ser difícil optimizar debido a su naturaleza tan heterogenea. Después de analizar las 10 conexiones HTTP más demandadas, las oportunidades de obtener alguna ventaja de ellas parecen ser difíciles, ya que el análisis de latencia y caminos realizado, expone grandes variaciones de latencia en un corto intervalo de tiempo para mismos caminos.
5.2. Trabajo futuro
El trabajo futuro con respecto a este proyecto, tendrá en cuenta la posibilidad de recoger en el Colector distintos Elementos de Información (IE´s) además de los que la quíntupla estándar recoge, como pueden ser banderas de TCP o elementos relacionados con MPLS, debido a que muchas veces la quíntupla no es suficiente para verificar determinados tipos de aplicación.Como ejemplo, si en nuestros flujos hubiésemos tenido recogidos los números AS de nuestras conexiones HTTP, el filtrado y análisis de la información hubiese sido mucho más preciso. Sin embargo esto supone cargar la tabla de rutas AS en nuestros dispositivos con Netflow, y además, conviene resaltar que todo elemento de información (IE) recogido por flujo, supone un incremento considerable del volumen de datos.
Por último, como la tesis tuvo en cuenta la posibilidad de cachear o realizar prefetching con respecto a las 10 conexiones más solicitadas, la posibilidad de cachear la información más solicitada por los usuarios en algún servidor dentro de la red del campus universitario, ya que hemos observado que la cantidad de conexiones HTTP relacionadas con Google, Facebook o Youtube suponen un volumen más que considerable sobre el tráfico total. Es importante saber que estas aplicaciones web utilizan protocolo HTTPS, por lo que hoy en día resulta imposible cachear nada de esa información.
109
110
ANEXO A: PLIEGO DE CONDICIONES
Este documento contiene las condiciones legales que guiarán la realización, en este proyecto, de una herramienta de analisis de posibiildades de optimización de una WAN. Presenta un caso de análisis de trazas reales recogidas en el campus de la Universidad AGH de Cracovia.
En este documento, se hace un estudio previo centralizado en artículos y papeles oficiales del tema, y a partir de ahí, comienza la busqueda de posibilidades.
A.1. Entregables
1. Memoria del proyecto. Se entrega una versión original y dos copias de la misma, encuadernadas de forma normalizada. Cesión a la Universidad Autónoma de Madrid, de forma gratuita y no exclusiva, por el máximo plazo legal y con ámbito universal, para que pueda ser utilizada de forma libre y gratuita por todos los usuarios del repositorio y del portal eciencia, los derechos de reproducción, distribución y de comunicación pública, tal y como queda descrito en la Ley de Propiedad Intelectual.
2. Código. En él se expone en lenguaje awk y perl, el mecanismo de análisis de flujos recogidos mediante nfdump, necesario para obtener conclusiones de las trazas de NetFlow. A su vez, se tiene un script en lenguaje bash de automatización del proceso para el caso de estudio presente.
A.2. Condiciones de desarrolloRecursos Hardware
• Equipo de desarrollo ASUS K53E con procesador Intel® Core™ i3-2200 2,7 GHZ, memoria RAM 3072 MB DDR3 y disco duro 500 GB. Utilizado para el desarrollo del software y la realización de pruebas.
• Disco duro externo Seagate Expansion Portable con capacidad de 1 TB. Utilizado para el almacenamiento de los análisis realizados.
111
A.3. Condiciones de desarrolloRecursos Software
• Sistema operativo Linux Ubuntu 12.04.5 LTS utilizado en el equipo de desarrollo.
• Dentro de el entorno de Ubuntu, fue necesario utilizar perl y nfdump para el procesado de los flujos y posterior análisis, todo ello OpenSource.
• Gnuplot para la creación de gráficas a partir de los datos obtenidos en el análisis.
• Para la redacción del documento se utilizó LibreOffice Writer, también OpenSource.
112
ANEXO B: PRESUPUESTO
A continuación, desglosaremos el presupuesto total empleado en el proyecto en los siguientes apartados:
• Presupuesto de Ejecución Material.
• Gastos generales y Beneficio industrial.
• Honorarios por redacción y dirección del proyecto.
• Costes totales
1) Presupuesto de Ejecución Material
Consta de los costes de mano de obra y el coste de los recursos materiales empleados durante el desarrollo del proyecto.
En cuanto a los costes de mano de obra, para el proyecto serán necesarios:
-Ingeniero de Telecomunicación, encargado del planteamiento, desarrollo e implementación del trabajo técnico, y la redacción del proyecto.
-Un administrativo, encargado de la edición, encuadernación y presentación del proyecto
Con la distribución del trabajo en el conjunto de tareas, tenemos la siguiente tabla:
Desempleo, FOGASA y Formación profesional((6,7+0,2+0,6)%) 1.771,37 € 787,90 €
Coste Seguridad Social 7.345,29 € 3.267,15 €
Salario bruto anual 23.618,28 € 10.505,32 €Coste salarial anual 30.963,57 € 13.772,47 €Coste salaral por hora 17,20 € 7,65 €Numero de horas 900 100
Coste total 15.481,78 € 765,14 €
2) Costes de mano de obra
3) Costes recursos materiales
El equipo necesario para desarrollar la práctica y generar la documentación necesaria fue un ordenador pórtatil ASUS K53E como se expuso en el apartado A.2. Condiciones de desarrollo, del capítulo Pliego de Condiciones.
114
Recursos Hardware
Concepto Coste total Meses Coste real
Equipo de desarrollo y de generación de documentación 439,99 € 9 82,50 € Disco Duro Externo Seagate Expansion Portable 1 TB 59,99 € 8 10,00 €
Concepto CosteIngeniero Superior 15.481,78 €Administrativo 765,14 €
Total 16.246,92 €
4) Coste total de los recursos
5) Gastos generales y Beneficio Industrial
6) Honorarios por redacción y dirección del proyecto
Los Honorarios que recomienda aplicar el Colegio Oficial de Ingenieros de Telecomunicación, tanto para la redacción como para la dirección del proyecto son los asociados a Trabajos tarifados por tiempo empleado, con un valor de un 5.6%.
115
Presupuesto de ejecución materialConcepto Coste totalCostes materiales 92,50 € Costes mano de obra 16.246,92 € Total 16.339,42 €
Presupuesto de ejecución por contrataConcepto Coste totalPresupuesto de ejecución material 16.339,42 € Gastos generales (17 % del P.E.M.) 2.777,70 € Beneficio industrial (6 % del P.E.M.) 980,36 €
Total 20.097,48 €
7) Costes totales
El presupuesto total obtenido del proyecto asciende a la cantidad de VEINTISIETE MIL CUARENTA Y UN euros con CINCUENTA Y SEIS céntimos.
Madrid, Mayo de 2015
El Ingeniero Jefe de Proyecto
Fdo.: Pablo Escat JuanesIngeniero de Telecomunicación
116
Presupuesto total
Concepto Coste totalPresupuesto de ejecución por contrata 20.097,48 € Honorarios por dirección 1.125,46 € Honorarios por redacción 1.125,46 € Subtotal 22.348,40 € IVA(21%) 4.693,16 € Total 27.041,56 €